1
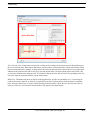
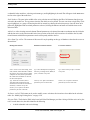
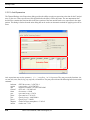
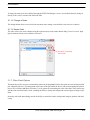
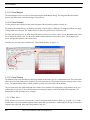
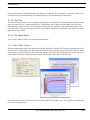
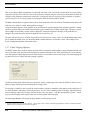
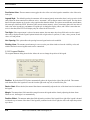
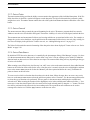
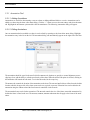
Plot Customization
5.3.1 Annotation Tool
5.3.1.1 Adding Annotations
Annotations are useful for documenting events on a chart or adding additional labels to a series. Annotations can be
added to a chart using the chart editor Tools dialog. Click the “+” button to access the Tool Gallery and select the Other
tab. Highlight the Annotation option and the click the Add button. The following Annotation dialog will appear.
5.3.1.2 Editing Annotations
Once an annotation has been added to a chart, it can be edited by returning to the chart editor Tools dialog. Highlight
the annotation entry in the list on the left. The annotation dialog will automatically appear on the right side of the form.
The annotation should be typed in the Text field of the Options tab. Options are provide to control alignment, cursor,
clipping of text, add the ability to edit the text directly on the chart. When the Allow Edit option is selected, clicking on
the annotation will launch the edit mode. To exit the edit mode, hit the escape key.
The Position tab controls the location of the annotation on the chart. The Left and Top fields are offsets from the default
location which is the upper left of the chart. Units can be set as pixels or percent. Extension lines can be added to the
annotation using the Callout tab and the font format is controlled via the Text tab.
The annotation frame can be further customized. The Size tab controls the size of the frame around the annotation. By
default the frame is fitted to the text. The Format, Gradient, Shadow and Bevel tabs all apply to the frame of the annotation.
5-26
EZXY User’s Manual, C&R Technologies, Inc.