1
Debugging
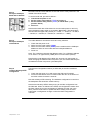
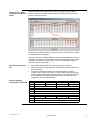
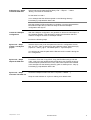
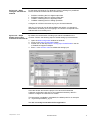
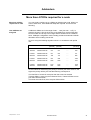
PL7 Debug Screen
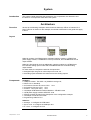
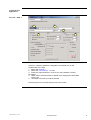
For debugging open the CPP110 debug screen
1
3
2
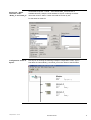
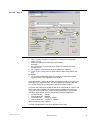
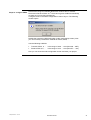
PL7 Debug - Step 1
Node overview
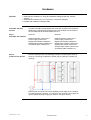
1. The node list provides an overview over all configured nodes. Node #2
is shown in red because it is not connected to the bus. Node #3 is
working properly and therefore is black.
If one or more nodes are red, the DIAG button (and the CPP error led) is red
too. The Premium resets error led and DIAG button automatically when the
faulty condition has gone. For the TSX Micro, it must be reset by a positive
edge on bit %QW0.1:X2.
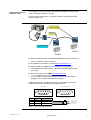
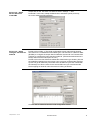
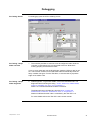
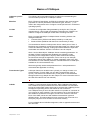
PL7 Debug - Step 2
Node diagnostic
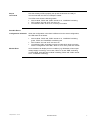
2. Node diagnostic. To get more details, click on the red listed node. The
diagnostic field is showing the string : Node 2: Status=01h, AddInfo=0000h,
Profile=0, NodeState=127, Error= 34, EmcyEntries= 0
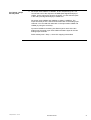
Status = 01 indicates that Node #2 does not answer.
The diagnostic string of Node #3 is showing Node 3: Status=08h,
AddInfo=0015h, Profile=401, NodeState=5, Error= 0, EmcyEntries= 0
Status=8 indicates that the node is controlled by the TSX CPP 110.
For more details refer to the TSX CPP 100/110 user manual.
CANopen Basics - Oct-04
Schneider Electric
20