1
Model 5030
Instruction Manual
Synchronized Hybrid Ambient Real-time
Particulate Monitor
Part Number 102017-00
8Jan2013
USEPA Automated Equivalent PM2.5 Method: EQPM-0609-184
© 2007 Thermo Fisher Scientific Inc. All rights reserved.
Specifications, terms and pricing are subject to change. Not all products are available in all countries. Please
consult your local sales representative for details.
Thermo Fisher Scientific
Air Quality Instruments
27 Forge Parkway
Franklin, MA 02038
1-508-520-0430
www.thermo.com/aqi
WEEE Compliance
This product is required to comply with the European Union’s Waste
Electrical & Electronic Equipment (WEEE) Directive 2002/96/EC. It is
marked with the following symbol:
Thermo Fisher Scientific has contracted with one or more
recycling/disposal companies in each EU Member State, and this product
should be disposed of or recycled through them. Further information on
Thermo Fisher Scientific’s compliance with these Directives, the recyclers
in your country, and information on Thermo Fisher Scientific products
which may assist the detection of substances subject to the RoHS Directive
are available at: www.thermo.com/WEEERoHS.
Thermo Fisher Scientific
WEEE Compliance
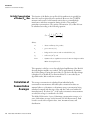
Preface Section
This manual provides information about operating, maintaining, and
servicing the Model 5030 SHARP Monitor. It also contains important
alerts to ensure safe operation and prevent equipment damage. The manual
is organized into the following chapters and appendices to provide direct
access to specific operation and service information:
Thermo Fisher Scientific
●
Chapter 1 “Introduction” provides an overview of product features,
describes the principle of operation, and lists the specifications.
●
Chapter 2 “Installation” describes how to unpack, setup, and startup
the instrument.
●
Chapter 3 “Operation” describes the front panel display, the front
panel keypad, and the menu-driven software.
●
Chapter 4 “Calibration” provides the procedures for calibrating the
instrument and describes the required equipment.
●
Chapter 5 “Preventive Maintenance” provides a spare parts list and
preventive maintenance procedures to ensure reliable and consistent
instrument operation.
●
Chapter 6 “Troubleshooting” presents guidelines for diagnosing
instrument failures, isolating faults, and includes recommended actions
for restoring proper operation. It also includes descriptions of status
messages and reports.
●
Chapter 7 “Servicing” presents safety alerts for technicians working on
the instrument, step-by-step instructions for repairing and replacing
components. It also includes contact information for product support
and technical information.
●
Chapter 8 “Optional Equipment” describes the optional equipment
that can be used with this instrument.
●
Appendix A “Warranty” provides a copy of the warranty statement.
●
Appendix B “RS-232 Commands” provides a description of the RS232 commands that can be used to remotely control an instrument
using a host device such as a PC or a data logger.
●
Appendix C “Connector and Board Schematics” provides the
connector and board schematics for the Model 5030 main circuit
board.
Model 5030 SHARP Monitor Instruction Manual
v
Preface Section
Safety
Safety
Review the following safety information carefully before using the analyzer.
This manual provides specific information on how to operate the analyzer,
however, if the analyzer is used in a manner not specified by the
manufacturer, the protection provided by the equipment may be impaired.
Safety and Equipment
Damage Alerts
This manual contains important information to alert you to potential safety
hazards and risks of equipment damage. Refer to the following types of
alerts you may see in this manual.
Safety and Equipment Damage Alert Descriptions
Alert
WEEE Symbol
Description
DANGER
A hazard is present that could result in death or serious
personal injury if the warning is ignored. ▲
WARNING
A hazard or unsafe practice could result in serious
personal injury if the warning is ignored. ▲
CAUTION
A hazard or unsafe practice could result in minor to
moderate personal injury if the warning is ignored. ▲
Equipment Damage
A hazard or unsafe practice could result in property
damage if the warning is ignored. ▲
The following symbol and description identify the WEEE marking used on
the instrument and in the associated documentation.
Symbol
Description
Marking of electrical and electronic equipment which applies to waste
electrical and electronic equipment falling under the Directive 2002/96/EC
(WEEE) and the equipment that has been put on the market after 13 August
2005. ▲
Where to Get Help
Service is available from exclusive distributors worldwide. Contact one of
the phone numbers below for product support and technical information
or visit us on the web at www.thermo.com/aqi.
1-866-282-0430 Toll Free
1-508-520-0430 International
vi
Model 5030 SHARP Monitor Instruction Manual
Thermo Fisher Scientific
Preface Section
US NRC Exemption
US NRC Exemption
USEPA PM2.5 FEM:
EQPM-0609-184
The Model 5030 SHARP Monitor is an exempt product in accordance
with NRC license No. 20-23922-01E and SSD Registration Certificate
No. AVR-1234-D-101-E. The user is exempt from any licensing
requirements for this device. Laws may vary outside of the United States.
Thermo Scientific Model 5030 SHARP Monitor operated for 24-hour
average measurements; including a 1-micron inlet; PM2.5 VSCC ; inlet
connector; sample tube; DHS heater with 35% RH threshold; mass foil kit;
GF10 filter tape; nephelometer zeroing kit; 8-hour filter change; and
operational calibration and servicing as outlined in Model 5030 SHARP
instruction manual.
The following conditions must be followed in order to comply with
USEPA Designation EQPM- 0609-184 for ambient monitoring of PM2.5:
1. Operated for 23-25 hour average measurements.
2. Flow rate set to 1000 L/h (16.67 L/min).
3. Automatic filter change (8-hour cycle time).
4. Automatic filter change when flow rate < 950 L/h.
5. Automatic filter change when sampled filter spot mass is > 1,500 μg.
6. DHS set to 35% RH.
7. Calibrated with zero and span mass transfer foil kit for 0 to 5,000
μg/m3 range.
8. System calibrated for temperature, barometric pressure, and volumetric
flow rate.
Thermo Fisher Scientific
Model 5030 SHARP Monitor Instruction Manual
vii
Preface Section
USEPA PM2.5 FEM: EQPM-0609-184
The USEPA method required the SHARP to be installed with the
following Thermo Fisher Scientific hardware:
1. 10-micron omni directional inlet operated at 16.67 Lmin (e.g., Model
SA246b or as specified in 40 CFR 50, Appendix L) with PM2.5
VSCC™.
2. Inlet to sample tube connector.
3. Standard 1-meter heater.
4. SHARP monitor.
5. Pump kit.
6. Glass fiber filter tape.
7. Vertical stabilization of sample tube, as necessary.
8. Nephelometer zeroing kit
viii
Model 5030 SHARP Monitor Instruction Manual
Thermo Fisher Scientific
Contents
Thermo Fisher Scientific
Chapter 1
Introduction........................................................................................................ 1-1
Principle of Operation ........................................................................ 1-2
Calculation of Particulate Mass on Filter Tape .................................... 1-3
Calculation of the PM2.5 Concentration with Digital Filter and Fixed
Time Constant................................................................................. 1-5
Activity Concentration of Radon (CRn) Gas ..................................... 1-6
Calculation of Concentration Averages ............................................... 1-6
Specifications ...................................................................................... 1-9
Chapter 2
Installation ......................................................................................................... 2-1
Packaging and Transport..................................................................... 2-1
Lifting ................................................................................................. 2-1
Unpacking .......................................................................................... 2-1
Acceptance Testing and Startup Procedures ........................................ 2-2
Bench Acceptance Test........................................................................ 2-7
Establishing Monitor Protocol ............................................................ 2-8
Menu Tutorial .................................................................................... 2-9
One-Point Temperature Verification ............................................. 2-12
One-Point RH Sensor Verification................................................. 2-12
One-Point Barometric Pressure Verification................................... 2-13
One-Point Volumetric Flow Rate Verification ............................... 2-13
Nephelometer Zero........................................................................ 2-14
Background Zero ........................................................................... 2-16
24-Hour Zero and Detection Limit ............................................... 2-17
Heated Sample Tube Sensor Calibration........................................ 2-18
Setup and Installation ....................................................................... 2-18
Siting ............................................................................................. 2-18
Heated Sample Tube Lengths ........................................................ 2-19
Rack Mounting.............................................................................. 2-19
Establishing Communications........................................................... 2-22
Analog Output Installation ............................................................ 2-22
Serial Data Communications ......................................................... 2-25
Filter Tape Installation...................................................................... 2-26
Chapter 3
Operation ............................................................................................................ 3-1
Operation and Service Menus ............................................................. 3-1
Display............................................................................................. 3-1
Keypad............................................................................................. 3-1
Main User Screen............................................................................. 3-2
Model 5030 SHARP Monitor Instruction Manual
ix
Contents
Operation Menu .............................................................................. 3-3
Service Menu .................................................................................... 3-12
Mechanical Control ....................................................................... 3-12
Mass Display.................................................................................. 3-13
Hardware and Sensor Diagnosis ..................................................... 3-13
x
Chapter 4
Calibration ..........................................................................................................4-1
Equipment Required........................................................................... 4-1
Pre-Calibration ................................................................................... 4-2
Calibration Menu ............................................................................... 4-2
Temperature, RH and Barometric Sensor Calibration...................... 4-2
Sample Flow Rate Calibration.......................................................... 4-4
Automated Detector Adjustment ..................................................... 4-4
Theoretical Adjustment of the High Voltage and the Thresholds ..... 4-5
Mass Foil Calibration....................................................................... 4-7
Nephelometer Zero and Calibration ................................................ 4-9
Configuration Menu ......................................................................... 4-11
German Networking Protocol........................................................... 4-12
Storing Calibration Values and Operational Parameters .................... 4-12
Reloading from EEPROM ................................................................ 4-13
Chapter 5
Preventive Maintenance .................................................................................5-1
Spare Parts .......................................................................................... 5-1
Maintaining the Sample Vacuum Pump ............................................. 5-2
Checking the Air Flow ........................................................................ 5-3
Temperature Sensors........................................................................... 5-4
Pressure Sensors .................................................................................. 5-5
Inlet Assemblies................................................................................... 5-6
PM2.5 Impactor Cleaning and Inspection .......................................... 5-6
Cyclone Maintenance....................................................................... 5-7
USEPA PM10 Inlet ........................................................................... 5-8
European PM10 Inlet ........................................................................ 5-9
Weather Proofing........................................................................... 5-10
Leak Test Procedure.......................................................................... 5-10
Chapter 6
Troubleshooting.................................................................................................6-1
Safety Precautions ............................................................................... 6-1
Troubleshooting Guides...................................................................... 6-1
Status Messages ................................................................................... 6-3
Status Concept and Structure........................................................... 6-4
Warning and Operating Detailed Status Reports.............................. 6-4
Structure of the Status Conception .................................................. 6-5
Detailed Status Messages.................................................................. 6-6
Overlay of Several Status Messages ................................................. 6-10
Status Output by Potential Free Relay Contacts................................ 6-11
Model 5030 SHARP Monitor Instruction Manual
Thermo Fisher Scientific
Contents
Output by Serial Interfaces (COM1 and COM2) ............................. 6-11
Print Formats .................................................................................... 6-12
Status Concepts for Quality-Assured Measurement........................... 6-13
Thermo Fisher Scientific
Chapter 7
Servicing............................................................................................................. 7-1
Safety Precautions ............................................................................... 7-1
Filter Tape Replacement ..................................................................... 7-2
Carbon Vane Replacement.................................................................. 7-2
Nephelometer and Beta Attenuation Servicing .................................... 7-2
Firmware Update ............................................................................. 7-4
Firmware Update Procedure............................................................. 7-5
Service Locations................................................................................. 7-9
Chapter 8
Optional Equipment .......................................................................................... 8-1
Inlet Assemblies................................................................................... 8-1
Sampling Tube Extensions .................................................................. 8-1
Weather Enclosure .............................................................................. 8-1
Rack Mounting Accessories................................................................. 8-1
Appendix A
Warranty ............................................................................................................ A-1
Appendix B
RS-232 Commands ........................................................................................... B-1
Appendix C
Connector and Board Schematics.................................................................C-1
Model 5030 SHARP Monitor Instruction Manual
xi
Contents
xii
Model 5030 SHARP Monitor Instruction Manual
Thermo Fisher Scientific
Figures
Figure 1–1. SHARP Monitor Sample Path.......................................................... 1-2
Figure 1–2. Model 5030 SHARP Flow Schematic .............................................. 1-8
Figure 2–1. Model 5030 Front Panel and Component List................................. 2-3
Figure 2–2. Model 5030 Rear Panel and Component List ................................. 2-4
Figure 2–3. Vacuum Pump Assembly and Connectors....................................... 2-5
Figure 2–4. 1-Meter Heated Sample Tube......................................................... 2-5
Figure 2–5. Roof/Shelter Flange Installation ..................................................... 2-6
Figure 2–6. Zero Test Assembly ......................................................................... 2-6
Figure 2–7. Model 5030 Main Circuit Board.................................................... 2-24
Figure 4–1. Theoretical Adjustment of the High Voltage and the Thresholds.. 4-5
Figure 5–1. Location of Pump Parts.................................................................... 5-3
Figure 5–2. Carbon Vane Installation................................................................. 5-3
Figure 5–3. Exploded View of PM2.5 WINS Impactor ......................................... 5-6
Figure 5–4. PM2.5 Sharp-Cut-Cyclone ................................................................. 5-7
Figure 5–5. USEPA PM10 Inlet............................................................................. 5-8
Figure 5–6. European PM10 Inlet......................................................................... 5-9
Figure 7–1. Pump Parts Location ........................................................................ 7-3
Figure 7–2. Carbon Vane Installation................................................................. 7-3
Figure 7–3. Communications Cable Wiring Diagram and Serial Connection.... 7-4
Thermo Fisher Scientific
Model 5030 SHARP Monitor Instruction Manual
xiii
Figures
xiv
Model 5030 SHARP Monitor Instruction Manual
Thermo Fisher Scientific
Tables
Table 1–1. Model 5030 Specifications............................................................... 1-9
Table 2–1. EU and US Monitoring Protocols...................................................... 2-9
Table 3–1. Model 5030 SHARP Parameter List.................................................. 3-6
Table 3–2. Parameter Change List...................................................................... 3-7
Table 5–1. Recommended Spare Parts .............................................................. 5-1
Table 6–1. Troubleshooting Guide...................................................................... 6-1
Table 6–2. Warning Status Report ..................................................................... 6-5
Table 6–3. Operating Status Report................................................................... 6-5
Table 6–4. Global Error Status............................................................................ 6-7
Table 6–5. Data and Program Memory .............................................................. 6-8
Table 6–6. Sampling and Measuring System .................................................... 6-8
Table 6–7. Pressure Sensors .............................................................................. 6-9
Table 6–8. Air Flow Regulation .......................................................................... 6-9
Table 6–9. Sample Heater .................................................................................. 6-9
Table 6–10. Temperature Measurement.......................................................... 6-10
Table 6–11. Nephelometer Measurement ....................................................... 6-10
Table 6–12. Detailed Error Status and Global Error Status ............................. 6-10
Table 8–1. Optional Equipment Parts List .......................................................... 8-1
Thermo Fisher Scientific
Model 5030 SHARP Monitor Instruction Manual
xv
Tables
xvi
Model 5030 SHARP Monitor Instruction Manual
Thermo Fisher Scientific
Chapter 1
Introduction
The Model 5030 Synchronized Hybrid Ambient Real-time Particulate
(SHARP) Monitor is a hybrid nephelometric/radiometric particulate mass
monitor capable of providing precise, one-minute, real-time measurements
with a superior detection limit. The SHARP Monitor measures the mass
concentration of ambient PM10, PM2.5, and PM1.0 aerosol in real-time. The
SHARP monitor incorporates a high sensitivity light scattering photometer
whose output signal is continuously referenced to the time-averaged
measurements of an integral beta attenuation mass sensor. This system
achieves heretofore-unattained short-term precision and accuracy. The
SHARP monitor incorporates advanced firmware to optimize the
continuous mass calibration of the nephelometric signal, ensuring that the
measured mass concentration remains independent of changes in the
particle population being sampled.
The SHARP monitor incorporates a dynamic heating system (DHS)
designed to maintain the relative humidity of the air passing through the
filter tape of the radiometric stage well below the point at which the
collected particles accrete and retain liquid water. This DHS system
minimizes the internal temperature rise ensuring negligible loss of semivolatiles from the collected sample when the ambient relative humidity is
below the threshold to which the heater is controlling. As the ambient RH
increases above the threshold, the applied heating is optimized to maintain
the RH threshold above the beta attenuation filter tape. The purpose of
this heating system is specifically designed to force the continuous mass
monitor to agree with the gravimetric reference method and the relative
humidity conditions to which the reference filter samples are conditioned.
Furthermore, sufficient flexibility is provided within the firmware to
configure the heating conditions to satisfy global monitoring protocols.
The Model 5030 has the following features:
Thermo Fisher Scientific
●
Multi-line alphanumeric display
●
Menu-driven firmware
●
Field programmable logging averages
●
Analog output
●
High sensitivity
Model 5030 SHARP Monitor Instruction Manual
1-1
Introduction
Principle of Operation
●
Excellent linear response
●
Mitigation of aerosol artifacts
●
Long-life optics, detectors, and beta source
●
Automatic temperature and pressure compensation
●
Internal quality assurance and data storage features
Thermo Fisher Scientific is pleased to supply this continuous aerosol mass
monitor. We are committed to the manufacture of instruments exhibiting
high standards of quality, performance, and workmanship. Thermo service
personnel are available for assistance with any questions or problems that
may arise in the use of this analyzer.
Principle of
Operation
The Model 5030 is based on the principles of aerosol light scattering
(nephelometer) and beta attenuation to measure precise and accurate
ambient aerosol concentrations. The Model 5030 aerosol sample pathway
is shown in Figure 1-1.
Conditioned Aerosol Sample
To Vacuum Pump
Nephelometer
Beta Attenuation
Figure 1–1. SHARP Monitor Sample Path
1-2
Model 5030 SHARP Monitor Instruction Manual
Thermo Fisher Scientific
Introduction
Calculation of Particulate Mass on Filter Tape
The SHARP optical assembly senses the light scattered by the aerosol
passing through an 880 nm illumination beam. The nephelometry response
is linear with aerosol concentration; independent of sample flow rate; and a
running one-minute average and dynamic average are continuously
calculated. Within the base of the optical assembly, a relative humidity
(RH) sensor is located immediately upstream of the sample filter-tape
assuring a representative measurement of the aerosol conditioning prior to
real-time mass determination.
Thereafter, the aerosol is deposited onto a glass fiber filter tape. The filter
tape will accumulate an aerosol sample towards a threshold value,
whereupon the filter tape will automatically advance prior to reaching
saturation. During the collection of aerosol onto the filter tape the SHARP
Monitor uses the radiometric principle of beta attenuation through a
known sample area to continuously collect and detect the deposited mass.
Additionally, the beta-attenuation chamber measures alpha emissions from
the accumulated aerosol and excludes negative mass artifacts due to the
presence of daughter nuclides from radon gas decay to achieve a “refined
mass” measurement. Simultaneous refined mass measurements of sampled
aerosol on the filter tape and sample volume measurement through a
calibrated orifice provide a continuous concentration measurement of the
ambient mass concentration. The collected sample temperature is measured
within the attenuation chamber.
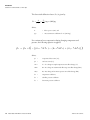
Calculation of
Particulate Mass
on Filter Tape
The beta detector of the 5030 SHARP delivers a count rate, which is
proportional to the intensity of the beta beam. The mass is calculated from
this count rate according to the following equation :
∑m
n
⎛
⎞
β0
⎟
= F cal ∗ ln ⎜
⎜ β n − F β / α * (α n − α ) ⎟
n
n
0
⎝
⎠
where;
Thermo Fisher Scientific
Σ mn
= mass loading in micrograms [μg],
β0
= background β count rate with an unloaded filter [1/s],
βn
= the gross count rate with a loaded filter [1/s],
Fcal
= mass foil calibration factor in micrograms [μg],
Fβn/αn
= global natural β : α count rate ratio ≈ 3.5
αn
= the gross α count rate of natural aerosol radioactivity [1/s], and
αo
= background α count rate [1/s]
Model 5030 SHARP Monitor Instruction Manual
1-3
Introduction
Calculation of Particulate Mass on Filter Tape
The theoretical calibration factor (Fcal) is given by:
Fcal =
A
2
=
* mg ≈ 6,600 μg
μ / ρ 0.3
where;
A
=
filter spot area (cm2), and
μ/ρ
=
mass attenuation coefficient for 14C [cm²/mg]
For continuous beta compensation during changing temperature and
pressure, the following equation is applied:
βn = β
R
× (1 − [( k T 2 * Δ T 2 ) − ( k P 2 * Δ P 2 ) + ( k
p3
* Δ P 3 )] )
where;
1-4
Model 5030 SHARP Monitor Instruction Manual
βn =
compensated beta count [1/s],
βR =
raw beta count [1/s],
ΔT2 =
T2 – T2o, change in sample temperature since filter change (oC)
ΔP2 =
P2 – P20 , change in vacuum under filter tape since filter change (hPa),
ΔP3 =
P3 – P30, change in barometric pressure since filter change (hPa),
kT2 =
temperature coefficient,
kP2 =
sub-filter pressure coefficient
kP3 =
barometric pressure coefficient
Thermo Fisher Scientific
Introduction
Calculation of Particulate Mass on Filter Tape
Calculation of the PM2.5
Concentration with
Digital Filter and Fixed
Time Constant
Calculation Mode:
From the accumulated particulate mass (Σm), a discrete mass value (m) is
calculated every four (4) seconds. The discrete mass is then passed through
a digital filter with the time constant (τ1) of 20 minutes. The filter
smoothes the discrete mass fluctuations, resulting in a smoothed discrete
mass value (mRM). The mass differentiation with respect to time in then
calculated (dmRM/dt). Thus, dmRM/dt is divided by the average air flow rate
(Q) from the last 4-seconds, resulting in a raw concentration (Ce). The
storage cycle time is four (4) seconds, thereby recognizing rapid
concentration gradients. However, Ce does exhibit an unacceptable noise
level through this short period of time and therefore a second digital filter is
applied with a second time constant (τ2) of 20 minutes to offer a final
concentration for reporting (CRM).
dm RM
τ2
C e = dt ; Ce ⎯⎯→
C RM
Q
The above description provides the basis for the beta attenuation derived
mass concentration. Simultaneously, the nephelometer concentration is
measured as a 1-minute running average (Nf_1n). Thereafter, both Nf_1n and
CRM are passed through a digital filter with a dynamic time constant (τv)
ranging from 20-480 minutes, whereby the time constant used is a
function of the coefficient of variation of the nephelometer signal:
τ v ∝ f (ν N
f _ 1n
)
No matter what the constant, both Nf_1n and CRM are passed through τv
resulting in synchronized long-tern averages Nf_τv and C14f_τv, respectively.
Thermo Fisher Scientific
Model 5030 SHARP Monitor Instruction Manual
1-5
Introduction
Calculation of Concentration Averages
Activity Concentration
of Radon (CRn) Gas
The fraction of the Radon isotope Rn-222 in ambient air is typically less
than 10% and is neglected by most methods. However, the C14 BETA
measures and corrects for this natural activity due to potentially high
interferences with beta attenuation during periods of low ambient
particulate concentrations. The activity concentration (CRn)of Rn-222 can
be calculated according to the following equation:
⎛ 1
C Rn = ⎜⎜
⎝ εα2
⎞ ⎛ αn − α 0
⎟⎟ * ⎜⎜
⎠ ⎝ Q * T222
⎞
⎟
⎟
⎠
where;
εα2
=
detection efficiency of α particles,
αn
= gross count rate [1/s],
αo
= background α count rate with an unloaded filter [1/s],
Q
=
T222
= 4,550 seconds; an equilibrium constant for Rn-222 daughter nuclides
air flow rate [m3/s], and
Within the sampled aerosol.
This equation is valid as soon as the radiological equilibrium of the Rn-222
decayed daughter nuclides are reached. This is approximately 90 minutes
after a filter change. During this period the CRn just before the filter change
is displayed. It is should also be mentioned that CRn is smoothed by an
algorithm with a 300 second time constant.
Calculation of
Concentration
Averages
The average concentration is calculated from individual cyclic
concentration measurements. All valid cyclic concentration values are
summed either as a 30-minute or 60-minute average concentration being
calculated, stamped with the time of day and date, and stored within the
internal memory. If at least 2/3rds of the cyclic concentration measurements
are valid, the average is considered to be valid.
The Model 5030 retains 1 year of 30-minute concentration averages or 2years of 60-minute averages via the internal 512 kilo-Byte memory. Each
record is stored with a respective date, time, instrument status, and
classification.
1-6
Model 5030 SHARP Monitor Instruction Manual
Thermo Fisher Scientific
Introduction
Calculation of Concentration Averages
Every 30-minutes the 1 hour and 3 hour average concentration is
calculated as a mean value from the latest two (2) and six (6) 30-minute
average concentration values, respectively.
After midnight (00:00), the daily average concentration is calculated from
the valid 30-minute averages of the previous day.
The 30-minute average, 1 hour average, 3 hour average, and 24 hour
average concentrations are displayed on the Model 5030 LCD display by
pressing "DISP". These data are also available via the serial interfaces
(COM1, COM2) by remote commands and print format command.
The Model 5030 airflow schematic is shown in Figure 1-2. This figure
shows the general locations of the ambient, sample, and heater wall
temperature sensors; the upstream sample RH sensor, the vacuum,
differential orifice, and barometric pressure sensors; and the vacuum pump
controlled by variable speed.
Through proper sensor placement a continuous air density correction is
applied to the beta attenuation derived concentration. A dynamic average
of this concentration is continuously calculated. The ratio of the dynamic
beta concentration to the dynamic nephelometer concentration is also
continuously calculated. This ratio is then used as a correction factor (CF)
for the one-minute average nephelometer reading. Therefore, the following
applies:
SHARPn = Nf_1n * (C14f_τv / Nf_τv)n
where:
Nf_1n
= Nephelometer 1 minute running average (μg/m3).
C14f_τv = Dynamically filtered Beta-derived concentration (μg/m3).
Nf_τv = Dynamically filtered Neph-derived concentration (μg/m3).
Thermo Fisher Scientific
Model 5030 SHARP Monitor Instruction Manual
1-7
Introduction
Calculation of Concentration Averages
T1: Ambient temp. (deg C)
Heated Sample Tube
T3: Orifice temp. (deg C)
T4: Heater temp. (deg C)
RH: Sample RH (% RH)
Neph
T2: Sample temp. (deg C)
Speed Controlled
Vacuum Pump
C-β
14
Speed Control
Input
P3 (hPa)
barometric
pressure
500-1,500 hPa
P2 (hPa)
vacuum
0-500 hPa
P1 (hPa)
ΔP
Orifice
0-100 hPa
0-10 V
Figure 1–2. Model 5030 SHARP Flow Schematic
The Model 5030 SHARP provides an updated concentration every 4
seconds via the analog output, serial output, and user menu. User selected
30-minute or 60-minute concentrations are date and time stamped with
any status/error conditions logged to the internal memory.
1-8
Model 5030 SHARP Monitor Instruction Manual
Thermo Fisher Scientific
Introduction
Specifications
Specifications
Table 1–1 lists the instrument’s features and specifications.
Table 1–1. Model 5030 Specifications
Thermo Fisher Scientific
Feature
Description
Concentration ranges
0 to 1,000 μg/m3 and 0 to 10,000 μg/m3 (auto-ranging)
Minimum detectable
concentration limit
< 0.5 μg/m3 @ 2σ (one-hour time resolution)
< 0.2 μg/m3 @ 2σ (24-hour time resolution)
Hourly precision
±2 μg/m3 < 80 μg/m3 ; ±5 μg/m3 > 80 μg/m3
Measurement time resolution
One minute (updated every 4-seconds)
Precision between two
monitors
±0.5 μg/m3 (2-σ, 24-hour time resolution)
Span drift
0.002% per day (< 0.7% per year)
Display resolution
0.1 μg/m3 (internally logged and displayed data)
Accuracy
±5% (compared to 24 hour FRM)
Sources
Optical: IRLED, 6 mW, 880 nm
Beta: Carbon-14, < 3.7 MBq (< 100 μCi), 5700-year half-life
Detectors
Optical: silicon/hybrid amplifier
Radiometric: proportional counter (α and β)
Air flow rate
1 m3/h (16.67 lpm) measured across an internal sub-sonic
orifice
Output
Two serial interface RS232 (25-pin and 9-pin)
Analog output
4-20mA or 0-10 output of concentration (μg/m3) (specify
upon order)
Operating environment
-22 to 140 °F (-30 to 60 °C)*: Non condensing
Power supply instrument
100-240V, 50/60Hz, 330W max., 15W without pump or
heater
Pump
100-110/100-120V, 50/60Hz or 220/240V, 50/60Hz, 100W
Dimensions Instrument
19-inches (W) x 12.25-inches (H) x 13-inches (D) //
483mm(W) x 311mm(H) x 330mm(D)
Pump
8.25-inches (W) x 8.75-inches (H) x 4.25-inches (D) /
210mm(W) x 222mm(H) x 108mm(D)
Model 5030 SHARP Monitor Instruction Manual
1-9
Chapter 2
Installation
The following installation procedures for the Model 5030 describe
packaging, lifting the instrument, unpacking the instrument, performing an
acceptance test, installing the monitor, and establishing communications.
For more information about optional equipment (such as, PM10, PM2.5,
and PM1.0 inlet assemblies, heated sample delivery tube, roof flange
installation, ambient shelter installation, and standard rack-mount
installation), see the “Optional Equipment” chapter.
Packaging and
Transport
The Model 5030 instrument, power cord, and operator manual are shipped
in an ISTA 2A-certified packaging and all other items/accessories are
shipped separately. The Model 5030 ISTA 2A-certified packaging is
comprised of the instrument within an inner box which is secured within an
outer box using foam end-caps and corner bracing. In this configuration,
the packaging is ready for shipping by carrier domestically and
internationally.
The inner box that the instrument resides in is an ISTA 1A-certified
packaging and is appropriate for transporting the instrument on local paved
roads to the monitoring site. Precautions should be taken to secure this
package from shifting during local transport.
Using the ISTA-2A packaging is strongly recommended for transporting the
instrument over poor roads or on highways.
Lifting
Unpacking
Thermo Fisher Scientific
A procedure appropriate to lifting a heavy object should be used when
lifting the monitor. This procedure consists of bending at the knees while
keeping your back straight and upright. The monitor should be grasped at
the bottom, in the front and at the rear of the unit. Do not attempt to lift
the monitor by the cover or other external fittings. While one person may
lift the unit, it is desirable to have two persons lifting, one by grasping the
bottom in the front and the other by grasping the bottom in the rear.
If there is obvious damage to the shipping container, notify the carrier
immediately and hold for inspection. The carrier, and not Thermo Fisher
Scientific, is responsible for any damage incurred during shipment.
Model 5030 SHARP Monitor Instruction Manual
2-1
Installation
Acceptance Testing and Startup Procedures
Use the following procedure to unpack and inspect the instrument.
1. Remove the instrument from the shipping container(s) and set on a
table or bench that allows easy access to both the front and rear of the
instrument.
2. Continue with the “Acceptance Testing and Startup Procedures” that
follow.
Acceptance Testing
and Startup
Procedures
The Model 5030 has been bench tested and calibrated at the factory prior to
shipping. The mass sensors, RH sensor, internal sample temperature sensor,
flowmeter temperature sensor, external ambient/heater temperature sensors,
barometric pressure, and volumetric flow rate have been calibrated to
traceable standards. Only the ambient and heater temperature sensors
integrated within the vertical sample tube may require calibration since
these two (2) sensors are specific to each heated sample tube and shipped
separately. For a quick start, proceed immediately to the “Startup
Procedures” and skip the “Acceptance Testing.”
To assure the best quality data, it is recommended that you perform an
acceptance test. Frequently, as part of a quality assurance program
acceptance testing will be conducted prior to field installation. This is an
excellent opportunity to compare the monitor to the primary and transfer
standards that are being used within the monitoring program. Furthermore,
it is an opportunity to assure that the monitor is operating according to the
manufacturer specifications.
After acceptance testing, a completed monitoring installation will require
final volumetric flow rate verification.
The following list of figures will help to identify the Model 5030
components and accessories:
Figure 2-1 Model 5030 Front Panel and Component List
Figure 2-2 Model 5030 Rear Panel and Component List
Figure 2-3 Vacuum Pump Assembly and Connectors
Figure 2-4 Heated Sample Tube
Figure 2-5 Roof/Shelter Flange Installation
Figure 2-6 Zero Test Assembly
2-2
Model 5030 SHARP Monitor Instruction Manual
Thermo Fisher Scientific
Installation
Acceptance Testing and Startup Procedures
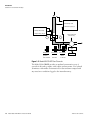
Figure 2-7 Model 5030 Main Circuit Board
1
8
2
6
7
3
4
5
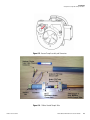
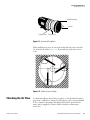
Figure 2-1. Model 5030 Front Panel and Component List
1. Inlet - Nephelometer connector (shown with inlet cap)
2. Nephelometer - Beta detection chamber connection
3. Beta Attenuation chamber
4. Filter tape supply reel
5. Filter tape take-up reel
6. Reversing sintered roller and filter tape transport sensor
7. Filter-tape exchange lever-arm and cam
8. Display
Thermo Fisher Scientific
Model 5030 SHARP Monitor Instruction Manual
2-3
Installation
Acceptance Testing and Startup Procedures
Figure 2-2. Model 5030 Rear Panel and Component List
10. Vacuum pump hose connection
11. Power connection, fuse (2 x 6A), and main switch
12. 3A auxiliary pump connection (used on new Busch/Becker Pumps)
13. Smart Heater connection
14. Ambient/Heater temperature sensor connection
15. 0-10V Pump control connection
16. 50-pin network connection (option)
21. 25-pin I/O connection
22. COM2 serial data interface V.24/RS 232, 9-pin D-sub female connector
23. COM1 serial data interface V.24/RS 232, 25-pin D-sub female connector
24. HV Battery Buffer Supply (three {3} Alkaline C-Cell Batteries)
25. HV Battery Buffer Switch (on/off/test)
2-4
Model 5030 SHARP Monitor Instruction Manual
Thermo Fisher Scientific
Installation
Acceptance Testing and Startup Procedures
Figure 2-3. Vacuum Pump Assembly and Connectors
Figure 2-4. 1-Meter Heated Sample Tube
Thermo Fisher Scientific
Model 5030 SHARP Monitor Instruction Manual
2-5
Installation
Acceptance Testing and Startup Procedures
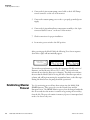
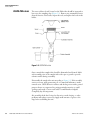
Figure 2-5. Roof/Shelter Flange Installation
HEPA Filter
Flow Audit Adapter
Inlet Adapter
Sample Inlet Adapter
Figure 2-6. Zero Test Assembly
2-6
Model 5030 SHARP Monitor Instruction Manual
Thermo Fisher Scientific
Installation
Bench Acceptance Test
Bench Acceptance
Test
Prior to installing the Model 5030, you should perform the acceptance
testing procedures. These tests are conducted to evaluate the out-of-box
performance of the instrument, perform any necessary calibrations prior to
final site installation, and familiarize the user with the menu structure.
Use the following procedure to perform the bench acceptance test.
Equipment Required:
Model 5030 SHARP Monitor,
Model 5030 Power cord
Mini-ambient/heater temperature cable assembly (DO NOT USE THE
HEATED SAMPLE TUBE ASSEMBLY AT THIS POINT)
Vacuum Pump Assembly
Flow Adapter Assembly
NIST-traceable Thermometer
NIST-traceable Hygrometer
NIST-traceable Barometer
NIST-traceable Volumetric Flow Transfer Standard
1. After unpacking the instrument place the Model 5030 and accessories
onto a table or bench located within a stable indoor environment.
Prior to continuing with acceptance testing, the instrumentation and
accessories should have sufficient time to equilibrate to room
temperature due to temperature variations during shipping and/or
storage.
2. Following a sufficient equilibration period, connect the power cord to
the rear of the instrument and to a properly grounded power supply. If
the Model 5030 turns ON at this point, set the power switch to the
“OFF” position and then proceed.
3. Connect the braided vacuum hose to the top brass port on the pump
and the other end to the vacuum pump hose connection on the rear of
the monitor.
Thermo Fisher Scientific
Model 5030 SHARP Monitor Instruction Manual
2-7
Installation
Establishing Monitor Protocol
4. Connect the 9-pin vacuum pump control cable to the 0-10V Pump
control connector on the rear of the monitor.
5. Connect the vacuum pump power cord to a properly grounded power
supply.
6. Connect the 9-pin ambient/heater temperature assembly to the 9-pin
connector labeled “sensors” on the rear of the monitor.
7. Check connections for proper installation.
8. Set monitor power switch to the ON position.
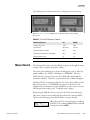
After powering up the Model 5030, the following User Screen sequence
(from left to right) will automatically appear:
5030 SHARP v1.18
US-Version
NEXT
The initial screen information provides the instrument Model, version of
Firmware, and the Monitor Protocol (US or EU). The second screen
informs the user that the filter tape is changing. The third screen informs
the user that the Model 5030 is zeroing the mass of the filter tape and air
column, and will begin measuring the accumulated mass on the filter tape.
During this third screen, the pump should be operational.
Establishing Monitor
Protocol
2-8
Two (2) monitoring protocols have been written into the Model 5030
SHARP firmware. These protocols cover the United States and the
European Union. The SHARP Monitor protocol can be changed within the
first 10 seconds after the monitor is turned on by pressing the second key
from the left. The protocol remains in memory if power is interrupted and
needs to be chosen only once.
Model 5030 SHARP Monitor Instruction Manual
Thermo Fisher Scientific
Installation
Menu Tutorial
The following screens demonstrate how to change protocols at start up.
5030 SHARP
v1.21
5030 SHARP
v1.21
Refer to Table 2-1 for a comparison of the EU and US monitoring
protocols.
Table 2-1. EU and US Monitoring Protocols
Menu Tutorial
Monitoring Protocol
EU
USEPA
Concentration Factor
110%
100%
Stored Values
30 minutes
one hour
Relative Humidity Threshold
65%
58%
Maximum Allowable Heater Temperature
45° C
60° C
Minimum Heater Power
5%
2%
Software Version (Oct 2012)
1.21
1.21
The following brief menu tutorial will help to guide you through the menu
structure and to complete acceptance testing.
The status codes within the User Screen should appear as above. After the
sample stabilizes, the “ZERO” will change to “NORMAL”. However,
within the first 12 hours, the status code of 0040 will remain while the
instrument stabilizes. Thereafter, an operational status of 0000 will appear.
Should a STATUS code appear within the User Screen that is different from
what is shown above, or if a ERROR code appears in the User Screen,
supplemental text information and/or detailed error codes can be reviewed
and interpreted according to the “Troubleshooting” chapter.
By pressing the DISP key, the user can enter the User Screen sub-menus.
Once there, the user can scroll through the sub-menu by pressing NEXT.
These are the following screens that should be seen upon startup:
This is the main User Screen showing a combined
STATUS Code, combined ERROR Code, and PM
Concentration. Press DISP.
Thermo Fisher Scientific
Model 5030 SHARP Monitor Instruction Manual
2-9
Installation
Menu Tutorial
This screen provides the current aerosol
concentration and accumulated mass in
micrograms. Press NEXT.
This screen shows the measured volumetric flow rate
in liters per hour (l/h), the standard flow rate (Nl/h),
as well as the pump controller output in percent of
the output range (such as, 68.6%). Divide by 60 to
obtain liters per minute. Press NEXT.
This screen shows the most recent 30–minute,
one-hour, three-hour, and 24-hour average
concentrations carried over from prior operation.
Press NEXT.
This screen shows the background radon content
measured by the instrument. Press NEXT.
This screen shows the individual text codes in
relation to the combined status codes that are
expected at startup. Press TEXT for additional
information.
This screen shows the additional “POWER ON”
status code after starting the instrument. Press
NEXT.
This screen shows the detailed error status code.
If necessary, this should be interpreted through
the “Troubleshooting” chapter. Press NEXT.
This is the last screen within the main User
Screen, and this shows the current Date
(yy-mm-dd) and Time (hh:mm:ss). Refer to the
“Operation” chapter for changing these values.
Press NEXT.
By pressing NEXT, from the last screen within the main User Screen, the
following screen will appear:
This is the Operation menu. Press NEXT.
2-10
Model 5030 SHARP Monitor Instruction Manual
Thermo Fisher Scientific
Installation
Menu Tutorial
This is the Service menu. Press NEXT.
This is the Calibration menu. Press NEXT.
You have now returned to the main User Screen.
By pressing NEXT or BACK you may scroll to the
Operation, Service, and Calibration menus. By
pressing DISP, you will scroll through the User
Screen sub-menus again.
To continue with the acceptance testing, scroll forward to the Service menu
and press YES to enter this menu. Once there, press SET to unlock the
keypad and you should see the following screen:
From here, continue to press NEXT until you see
the following screen:
Press YES to enter this Service sub-menu and
continue to press NEXT until you see the
following screen:
At this screen, the top row is an abbreviated text of
the digital measurements being provided. The
description of these abbreviations is as follows:
T1: Ambient Temperature (deg C),
T2: Sample Temperature (deg C),
T3: Orifice Temperature (deg C),
T4: Heater External Wall Temperature (deg C),
P1: Orifice Pressure Drop (hPa),
P2: Vacuum under sample filter tape (hPa),
P3: Barometric Pressure (hPa),
RH: Sample Relative Humidity (% RH).
Thermo Fisher Scientific
Model 5030 SHARP Monitor Instruction Manual
2-11
Installation
Menu Tutorial
Table 2-2. Barometric Pressure Conversions
hPa = atm X 1,013.2501
hPa = in Hg X 33.8638867
hPa = mm Hg x 1.3332239
The second line of the above screen provides the T1, T2, T3, and T4
measurement. The third line of the above screen provides the P1, P2, P3,
and RH measurements.
Assuming adequate time has passed for thermal equilibration and the
vacuum pump has been drawing room air into the instrument, compare the
ambient temperature (T1), sample temperature (T2), orifice temperature
(T3), and heater temperature (T4) to your NIST traceable thermometer.
Note At this point during acceptance testing the mini-ambient/heater
temperature assembly is attached to the rear of the instrument. Please be
sure that the pump exhaust or any other heat source is not influencing these
sensor readings. One-Point Temperature
Verification
As per 40CFR, Part 50, Appendix L, Section 9.3, record the T1, T2, T3,
and T4 sensor readings from the Model 5030 and compare to your
NIST-traceable thermometer. Each of these measurements should be within
±4 °C tolerance of your NIST-traceable thermometer. Within this tolerance,
the temperature sensors have passed the acceptance test.
If the Model 5030 sensors are slightly out of tolerance (±5 °C), the
acceptance test should be classified as marginal. If the sensor performance is
less than marginal, please contact Thermo Fisher Scientific’s Technical
Support at (866) 282-0430 or your local sales representative.
Temperature sensor calibration is covered in the “Calibration” chapter.
One-Point RH Sensor
Verification
2-12
Record the RH sensor reading from the Model 5030 and compare to your
NIST-traceable Hygrometer. The Model 5030 RH sensor should compare
within ±2% RH tolerance of your NIST-traceable Hygrometer. If the Model
5030 RH sensor performance is within this tolerance, the acceptance test
has passed.
Model 5030 SHARP Monitor Instruction Manual
Thermo Fisher Scientific
Installation
Menu Tutorial
Note The temperature verification should be completed prior to performing
the RH-sensor verification due to a thermal compensation applied to the
RH-sensor. If the Model 5030 RH sensor is slightly out of tolerance, ±3% RH, the
acceptance test should be classified as marginal. If the sensor performance is
less than marginal, please contact Thermo Fisher Scientific’s Technical
Support at (866) 282-0430 or your local sales representative.
RH sensor calibration is covered in the “Calibration” chapter.
It is recommended that the NIST-traceable Hygrometer should also
compare well with the RH-measurement used within a gravimetric
laboratory that is part of a compliance program.
One-Point Barometric
Pressure Verification
As per 40CFR, Part 50, Appendix L, Section 9.3, record the Model 5030
P3 barometric pressure sensor reading. This value is in units of hectopascal
(hPa). If necessary, using the conversion chart (Table 2-2) to convert your
NIST-traceable measurement to units of hPa for an appropriate
comparison. The Model 5030 P3 sensor should compare within ±13.33 hPa
tolerance of your NIST-traceable barometer. If the Model 5030 P3 sensor
performance is within this tolerance, the acceptance test has passed.
If the Model 5030 P3 sensor is slightly out of tolerance, ±15 hPa, the
acceptance test should be classified as marginal. If the sensor performance is
less than marginal, please contact Thermo Fisher Scientific’s Technical
Support at (866) 282-0430 or your local sales representative.
The Model 5030 P3-Barometric Pressure sensor calibration is covered in the
“Calibration” chapter.
One-Point Volumetric
Flow Rate Verification
As per 40CFR, Part 50, Appendix L, Section 9.2.5, the flow rate of the
Model 5030 should be verified during this acceptance test. Prior to this test
it is important for the previous temperature and pressure acceptance tests to
be completed. Should the T1, T3, or P3 sensors require calibration, this
should be done prior to the flow rate verification.
From this screen, repeatedly press NEXT until you
arrive at the Main User Screen:
From here, press DISP then press NEXT and the
following screen appears:
Thermo Fisher Scientific
Model 5030 SHARP Monitor Instruction Manual
2-13
Installation
Menu Tutorial
At this screen the Model 5030 volumetric flow rate
in units of liters per hour and is shown on the
second line of the display, next to OPERATION.
The third line of this screen shows the flow rate in
units of standard liters per hour. This standard flow rate is corrected to
1013.25 hPa (1 atm, 29.92 in Hg, or 760 mm Hg) and to the temperature
displayed next to NORM. The last line of this screen shows the pump
control voltage output in percent (%).
Attach the small sample tube adapter to the Model 5030 inlet. Attach the
inlet adapter to the sample tube. Depending upon your NIST-traceable
volumetric flow transfer standard (FTS), you may either attach your FTS
now or add the flow audit adapter to accommodate any flexible tubing that
your FTS may require. Allow 60 seconds to stabilize the flow.
Note Keep this inlet assembly for nephelometer zero. Record the Model 5030 Volumetric Flow Rate as Qm and the FTS flow rate
as Qi, assuring that both are being recorded in units of L/h. Take three (3)
readings each from Qm and Qi and average the respective values. Use the
following equation to calculate the percent difference:
% D 100 u
Qm Qi
Qi
If %D is within ±4%, then the Model 5030 volumetric flow rate acceptance
test has passed. If the Model 5030 volumetric flow rate is slightly out of
tolerance, ±5%, the acceptance test should be classified as marginal. If the
volumetric flow rate performance is less than marginal, please contact
Thermo Fisher Scientific’s Technical Support at (866) 282-0430 or your
local sales representative.
The Model 5030 Volumetric flow rate calibration is covered in the
“Calibration” chapter.
Perform a leak test. Refer to “Leak Test Procedure” on page 2-10.
Nephelometer Zero
Prior to field installation, the inline nephelometer should be tested and
zeroed. There are two approaches that can be used at this point:
•
2-14
Model 5030 SHARP Monitor Instruction Manual
Perform a background zero on the Model 5030 nephelometer (~2
minutes), or
Thermo Fisher Scientific
Installation
Menu Tutorial
•
Perform an overnight zero test to evaluate absolute zero measurement
and calculate the instrument detection limit.
Assuming this test is continuing from the previous user screen:
Continue to press NEXT, until the following
screen appears:
Press YES.
If the screen indicates the Calibration is locked,
press SET to unlock Calibration menu.
Increment the calibration code to “4” by pressing
the + key.
Press NEXT.
The Calibration Screen can now be fully accessed.
Continue to Press NEXT until the following screen
appears:
At this screen, Press YES.
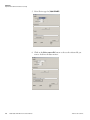
At this screen, there are four (4) parameters of
consideration.
In the screen above, the first value (205) is the
nephelometer analog signal in units of least significant bits (LSB). The
second value (1.3) is the nephelometer one-minute average aerosol
concentration in units of micrograms per cubic meter (μg/m3). The third
value (2.5) is the long-term beta attenuation derived aerosol concentration
in units of μg/m3. The fourth value (0.7) is the Model 5030 hybrid
real-time aerosol concentration in units of μg/m3.
Thermo Fisher Scientific
Model 5030 SHARP Monitor Instruction Manual
2-15
Installation
Menu Tutorial
Background Zero
From this menu, placing a HEPA Filter at the inlet and Pressing ZERO on
the keypad can zero the nephelometer. A HEPA filter is provided with each
Model 5030 for this purpose. Furthermore, by introducing a known
concentration of aerosol to the Model 5030, a span calibration can be
performed on the nephelometer. However, for the purpose of this step only
the zero of the nephelometer should be performed.
To perform a zero measurement on the nephelometer, connect the Zero Test
Assembly (as done previously during the volumetric flow rate verification).
1. Attach the small sample tube adapter to the Model 5030 inlet.
2. Attach the inlet adapter to the sample tube.
3. Attach the flow audit adapter.
4. Attach the HEPA filter to the flow audit adapter.
5. Allow 5-minutes for the factory-zero to stabilize.
At the end of 5 minutes, the ANALOG and NEPH values should be stable.
The NEPH value should read 0.0 μg/m3, ±2.0 μg/m3. If the Model 5030
Nephelometer performance is within this tolerance, the acceptance test has
passed. These two (2) values can be considered the “as-found” values for the
Model 5030 zero measurement. Should the NEPH value be ±4.0 μg/m3, the
nephelometer performance can be considered marginal, and outside of this
range the nephelometer requires the background be zeroed.
It is recommended that the ANALOG and NEPH values be recorded
and control-charted in an effort to maintain any history of
background shift.
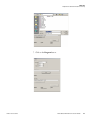
To zero the background, maintain the HEPA filter at the inlet and press
Zero.
After pressing ZERO, the screen will begin an
automatic 60-second average of the nephelometer
operating on the 0-1,000 μg/m3 concentration
range. The counter is in the lower right hand of the
screen.
2-16
Model 5030 SHARP Monitor Instruction Manual
Thermo Fisher Scientific
Installation
Menu Tutorial
After the first range is zeroed, the 2nd Range
(0-10,000 μg/m3) is independently zeroed over a
20-second period.
Now the Nephelometer background is zeroed for
both ranges of measurement. Another 5-minute
measurement cycle can be performed and
compared to the “as found” values. Press NEXT
until the following screen appears:
Press YES.
The nephelometer zero calibration has now been
set. Press NEXT
CAUTION If operational parameter changes have been made within the
Operations menu, they must be saved via the CALIBRATION menu in
order to become new default settings. Otherwise, the original parameter
settings will be restored when RELOAD is used within the CALIBRATION
menu. 24-Hour Zero and
Detection Limit
Perform the following steps to thoroughly evaluate the absolute zero and
detection limit of the Model 5030.
1. Keep the instrument in the Calibration Mode (Status = 0070).
2. Maintain the HEPA filter at the inlet.
By conducting this test, the zero measurement should run for approximately
24 hours. After performing this test, the hourly data should be downloaded
from the instrument memory. The average of 24 consecutive measurements
would be the 24-hour absolute zero of the instrument.
With a sample population of 24, one-hour measurements, an hourly
detection limit can be calculated according to:
DL1hr
Thermo Fisher Scientific
2V
Model 5030 SHARP Monitor Instruction Manual
2-17
Installation
Setup and Installation
whereas, σ is calculated from the following non-biased standard
deviation equation:
V
n
§ n ·
n¦ X 2 ¨ ¦ X ¸
i 1
©i1 ¹
nn 1
2
and, Xi is each hourly zero measurement over a 24 hour period.
After completing the nephelometer zero, the acceptance test is now
complete. Should any questions or issues be outstanding, please contact
Thermo Fisher Scientific’s Technical Support at (866) 282-0430 or your
local sales representative.
Heated Sample Tube
Sensor Calibration
While the instrument and accessories are fully equilibrated to room
temperature, it would be beneficial and convenient to locate the heated
sampling tube and connect the ambient/heater temperature sensor 9-pin
cable assembly to the Model 5030 in place of the temperature sensor
assembly that comes standard with each instrument.
After replacing the ambient/heater sensor cable with the ambient/heater
cable assembly attached to the heated sample tube, repeat the one-point
temperature verification for T1 and T4. If acceptable, the instrument and
accessories are ready for installation. Otherwise, refer to the “Calibration”
chapter to calibrate the sensors. Please note that although the resistance of
the standard temperature cable assembly is closely matched to that of the
heated sample tube cable assembly, Thermo Fisher Scientific qualifies and
ships the heated sample tubes separately and therefore are not calibrated for
any instrument with each shipment.
Setup and Installation
Siting
2-18
The Model 5030 is designed to be installed within an approved ambient
shelter or a climate controlled shelter whose environments are
non-condensing and the temperature range is between –22 to 60 °C.
Through the use of a flange kit, the Model 5030 may be installed on a flat
building or shelter roof surface. Depending upon the inlet height, additional
vertical bracing may be required. The Model 5030 can be either rack
mounted or tabletop mounted.
The siting criteria for proper aerosol collection should generally adhere to
the following criteria:
Model 5030 SHARP Monitor Instruction Manual
Thermo Fisher Scientific
Installation
Setup and Installation
•
Final inlet height ≥ two (2) meters above roof line and away from direct
building ventilation/exhaust
•
Final inlet height should be as close as possible to the inlet height of the
reference methods being compared against
•
1-2 meter inlet distance between collocated samplers @16.67 L/min
•
2-3 meter inlet distance between collocated 16.67 L/min and hi-vol
samplers
•
Instrument front panel should be North to Northeast facing in an
ambient shelter or avoid direct sunlight if rack mounted in climate
controlled shelter.
For more information on siting an aerosol measurement inlet, spatial and
temporal aspects of network design and optimum site exposure, refer to 40
CFR Part 58, Appendix D and in the guidance document for network
design and optimum site exposure for PM2.5 and PM10 published by the
U.S. EPA Office of Air Quality Planning and Standards.
Heated Sample Tube
Lengths
There are two style heaters at 1-meter and 3-meter lengths. The one meter
length is normally used in conjunction with the ambient shelter provided by
Thermo Fisher Scientific. The three meter length has a two meter heated
zone and an additional one meter of excess sample tubing to be cut to the
exact height requirements onsite. Please check availability for these heaters.
Rack Mounting
One limiting factor when siting the Model 5030 is placement within a
standard 19-inch rack mounting. Future planning should be made to
reserve the topmost rack mounting position available due to the vertical
positioning of the sample tube directly from the roof into the top of the
Model 5030. In addition, modification to the rack cabinet to accommodate
the vertical tubing connection also needs to be considered prior to
installation.
Review the following installation steps prior to field installation.
1. Mount the Model 5030 to the rack using a set of FH132 sliding rail
hardware.
2. Determine the location of the Model 5030 inlet tube on the roof
enclosure (ambient shelters are already provided with this location
cleared).
Thermo Fisher Scientific
Model 5030 SHARP Monitor Instruction Manual
2-19
Installation
Setup and Installation
3. Drill a 2 ½-inch (64 mm) diameter hole at that location through the
roof.
4. Caulk around the 2 ½-inch hole and place the roof flange over the hole
(for the ambient shelter a gasket is provided in place of the caulking for
this step).
5. Secure the flange in place with four 3/8-inch lag bolts. Caulk around the
lag bolts to prevent leaks.
6. Thread the black tube-to-flange coupling into the flange until fully
tightened. Caulk around the outside edge of the coupling-flange
interface.
7. Remove the upper coupling with rubber ferrule and set aside.
8. Determine the exact length of sample tube needed above the roofline to
accommodate the inlet assembly.
Assuming an inlet height of 2-meters (78 ¾-inch) a PM2.5 inlet
assembly would require exactly 1,391 mm (54 ¾-inch) of sample tubing
above the roofline and a PM10 inlet assembly would require 1,521 mm
(59 ¾-inch) of sample tubing above the roofline.
Cut the stainless steel sample tube and debur the inner and outer edge of
the sample tube to avoid cutting the O-rings on the inlet adapter and
blocking any aerosol entering the sample tube.
9. Remove the two sets of brass resistance-heater connections from the
heated sample tube and set aside.
10. Place the inlet tubing through the roof flange and onto the top of the
Model 5030.
Note PLEASE PAY EXTRA CARE TO THE INTEGRATED
AMBIENT/HEATER TEMPERATURE SENSOR CABLE ASSEMBLY
THAT MUST PASS THROUGH WITH THE HEATED TUBE. 2-20
Model 5030 SHARP Monitor Instruction Manual
Thermo Fisher Scientific
Installation
Setup and Installation
11. Place the rubber ferrule and coupling over the heated sample tube and
thread the coupling into the lower coupling adapter already secured.
APPLY ONLY FINGER TIGHT.
12. At instrument level, properly align and tighten the stainless steel
knurled nut onto the top of the Model 5030.
13. Return to the roof level and firmly tighten the roof flange-coupling
assembly. Caulk around the coupling-to-sample tube interface to avoid
leaks.
14. Attach the ambient temperature radiation shield assembly to the outer
gray plastic sample tube and insert the ambient temperature sensor into
the radiation shield.
15. Attach the inlet assembly onto the sample tube (for example, inlet
adapter, sharp-cut cyclone, PM10 Inlet).
16. Attach vertical bracing to the exterior sample tube in at least two lateral
directions that are 90 degrees apart or employ the use of a tripod
attachment as available.
17. Connect the power cord to the rear of the Model 5030 and to a properly
grounded power supply of the appropriate voltage and frequency.
Should the Model 5030 turn ON at this point, set the power switch to
the OFF position and then proceed.
18. Connect the braided vacuum hose to the top brass port on the pump
and the other end to vacuum pump hose connection on the rear of the
monitor. Properly tighten both ends of this braided hose.
19. Connect the 9-pin vacuum pump control cable to the 0-10V Pump
control connector on the rear of the monitor.
20. Connect the vacuum pump power cord to a properly grounded power
supply of the appropriate voltage and frequency.
Thermo Fisher Scientific
Model 5030 SHARP Monitor Instruction Manual
2-21
Installation
Establishing Communications
21. Connect the 9-pin ambient/heater temperature cable assembly from the
heated sample tube to the 9-pin connector labeled “sensors” on the rear
of the monitor.
22. Place the heater control unit on top of the Model 5030 with the green
power switch facing forward.
23. Connect the brass resistance-heater connectors to the upper-most
exposed copper tubing and the lower-most exposed stainless sample
tube.
24. Connect one (1) blue/gray heater control cable to each brass resistance
heater connector. Wrap exposed stainless sample tube with insulation
provided.
25. Plug the heater control unit amphenol-connector into the rear of the
Model 5030 labeled “heater.”
26. Check connections for proper installation.
27. Set monitor power switch to the ON position.
WARNING The Model 5030 Monitor and pump are supplied with
three-wire grounding cords. Under no circumstances should this grounding
system be defeated. Establishing
Communications
Unless specified upon order, the Model 5030 comes equipped with a default
analog output signal of 0-20 milliamps (mA).
Analog Output Installation
This setting can simply be adjusted to a 4-20 mA setting via the user screen.
In order to configure the Model 5030 for an analog output of 0-10 volts
(V), jumpers on the main circuit board must be repositioned.
WARNING If the output signal jumpers are to be changed, TURN THE
POWER TO THE INSTRUMENT OFF FIRST AND UNPLUG FROM
THE POWER SUPPLY! 2-22
Model 5030 SHARP Monitor Instruction Manual
Thermo Fisher Scientific
Installation
Establishing Communications
The Model 5030 analog output of measured aerosol concentrations can be
accessed from the rear I/O socket on the central unit. Pin numbers 12 and
13 from the I/O socket are used as the (+) 0-20mA/0-10V concentration
signal and as the (-) 20mA/ground connectors, respectively.
In order to switch the analog output signal from mA to V, the jumper
settings on the circuit board must be changed.
1. Reference Figure 2-7 to make any necessary changes. In this figure,
locate the four (4) connectors labeled x10, x11, x24, and x25 towards
the right side of the circuit board. These connectors run from top to
bottom in Figure 2-7 and are towards the rear of the instrument. Each
connector comes from the factory with the jumpers connected to pins
3-4 and 7-8, and this provides an analog output of 0-20 mA.
For a description of the connector pin layout, see the upper right hand
corner of Figure 2-7 labeled: “Pin No.”
WARNING Disconnect power before accessing the circuit board. Thermo Fish er Scientific
Model 5030 SHARP Monitor Instruction Manual
2-23
Installation
Establishing Communications
X10 Jumper Pins for
Concentration Analog Output
2
7
5
3
4
Programming
Jumper Lock
1
10
8
6
Program Chip
9
Pin No.
Display Connector
X11 Jumper
X24 Jumper
9
7
5
3
1
2
4
6
8
0-20 mA Concentration Analog
Output Jumper Configuration
10
mA Jumper Configuration
X25 Jumper
9
7
4
3
1
Rear of
Instrument
2
6
Front of
Instrument
5
8
0-10 VDC Concentration Analog
Output Jumper Configuration
10
Volt Jumper Configuration
Figure 2–7. Model 5030 Main Circuit Board
2-24
Model 5030 SHARP Monitor Instruction Manual
Thermo Fisher Scientific
Installation
Establishing Communications
2. To complete a change of jumpers, access the circuit board by
unscrewing the six (6) small screws on the small access panel on the
lower rear of the instrument. Gently pull the panel with fixed circuit
board outward only two inches (5 cm) to expose the connectors.
3. To configure the analog output for voltage, change the jumper settings
on connector x10 and x24 only (as referenced in Figure 2-7) to provide
a 1-3 and 7-8 jumper setting per connector. Do not change the jumper
settings on connectors x11 and x25.
4. Gently insert the circuit board and secure the rear access panel with the
six (6) screws.
5. Power on the central unit and check for voltage output readings.
Note Although the jumpers have now been changed for a voltage output
signal, the Display menu will still show mA as the analog output. Please
apply 0 mA = 0V; 4 mA = 2V and 20 mA = 10V. To revert back to an analog output in mA, follow the above instructions and
place the x10 and x24 connectors into the original jumper settings of 3-4
and 7-8.
Any information regarding Serial Data Output is discussed in Chapter 3
and RS-232 Commands are provided in Appendix B.
Serial Data
Communications
Thermo Fisher Scientific
There are two RS-232 serial data ports on the Model 5030. Referencing
Figure 2-2, these two com-ports are labeled COM1 (No 23) and COM2
(No 22) and are a 25-pin and 9-pin female connectors, respectively.
HyperTerminal is the software used to connect to the Model 5030. The
communications protocol used for both serial ports is as follows:
Baud rate
300, 600, 1200, 4800, or 9600
Data Bits
7
Parity
Even
Stop Bits
2
Flow Control
Hardware
Model 5030 SHARP Monitor Instruction Manual
2-25
Installation
Filter Tape Installation
It is recommended that COM2 be used for remote dial-up connection and
COM1 be reserved as either an onsite interface or for scheduled data
printouts. One COM1 cable is provided with each Model 5030. A full
explanation of serial communication is provided in the “Operation” chapter.
Filter Tape
Installation
From the Service menu, press YES.
Enable the keypad by pressing SET, and then press
NEXT.
From this screen, press YES.
Open the Detector Head by pressing YES.
Use the following procedure to install the filter tape (Figure 2-1:).
1. Open the front transparent cover plate on the Model 5030.
2. Loosen the knurled nuts on both the supply reel (4) and the take-up reel
(5) and remove any used filter tape and empty the supply spool.
3. Put a full roll of tape on the filter tape supply reel (4), and place the
empty take-up spool on the filter tape take-up reel (5).
4. Feed the filter tape from the supply reel clockwise around the reversing
roller (6), through the left side of the detection chamber, and fix the
filter tape to the filter tape take-up reel (5) using double-sided sticky
tape.
5. Hand-tighten the knurled nuts on both the supply reel (4) and the
take-up reel (5).
2-26
Model 5030 SHARP Monitor Instruction Manual
Thermo Fisher Scientific
Installation
Filter Tape Installation
6. Press YES to advance the filter tape, and
the tape counter should be increasing.
Advance the filter tape until it has wrapped
around itself twice on the take-up reel (5).
Press NEXT.
7. At this screen, Press FC+Z. This will
perform a filter change and zero and
reinitialize aerosol measurement.
8. Replace the front transparent cover plate on the central unit.
In case the inserted filter tape is not correctly tensioned (for example, in case
the reversing roller does not turn during the filter change cycle), the pump
will be switched on immediately after the filter tape change attempt is
complete, but at the same time a corresponding error status will occur.
Consequently, the filter tape needs to be checked. After investigation,
another filter change cycle has to be initialized by pressing the key “FC+Z”
again.
Thermo Fisher Scientific
Model 5030 SHARP Monitor Instruction Manual
2-27
Installation
Filter Tape Installation
2-28
Model 5030 SHARP Monitor Instruction Manual
Thermo Fisher Scientific
Chapter 3
Operation
Operation and
Service Menus
This chapter describes the front panel display, keypad pushbuttons, and
menu-driven software for the Operation and Service menus. The
Calibration menu is described in the “Calibration” chapter.
Display
The 4 line by 20 character alphanumeric display shows the sample
concentration, instrument parameters, instrument controls, and help
messages. Some menus contain more items than can be displayed at one
time. For these menus, use the BACK and NEXT pushbuttons to move
through the menus and submenus.
Keypad
The keypad of the Model 5030 consists of 4 keys to operate the instrument.
Together with the display unit, these keys form the interactive user surface.
The functions that are covered by the single keys are described in the lowest
line of the display.
BACK,NEXT
YES
YES,NO
+, –
Moving backwards and forwards within the menu
Entering a sub-menu, carrying out the action(s)
being displayed
Switching on/off parameter flags
Setting numerical values
These keys are only for general information. The additional key functions
that are more individual or specific within each menu are described in the
corresponding menu descriptions.
During normal operation, the keyboard usually is locked. The majority of
the menu points and all displays can be accessed by pressing the BACK,
NEXT and YES keys. Changing operational settings and the calibration of
sensors are only possible after unlocking the keyboard. With the keyboard
unlocked only changes to the operational settings are possible. To calibrate
the unit, a code must be entered to further unlock the Calibration menu.
Thermo Fisher Scientific
Model 5030 SHARP Monitor Instruction Manual
3-1
Operation
Operation and Service Menus
Main User Screen
In the Main User Screen the status code, error code, and aerosol
concentration are found. The concentration value in micrograms per cubic
meter (μg/m3) will be updated every 4 seconds. By pressing DISP and
NEXT other values such as aerosol mass, air flow rate, average concentration
values, error status, and time can be displayed. The Main sub-menus are as
follows:
This is the main User Screen showing a
combined STATUS Code, combined ERROR
Code, and PM Concentration, press DISP.
This screen provides the current aerosol
concentration and accumulated mass in
micrograms, press NEXT.
This display shows the volumetric flow at the
inlet, the flow rate at STP conditions (standard
temperature and pressure, 1013 hPa and 25 °C),
and the pump power (%). Please note the
standard temperature is adjustable in the
Calibration menu. Press NEXT.
This screen shows the most recent 30–minute,
one-hour, three-hour, and 24-hour average
concentrations carried over from prior operation.
Please note that the 24-hour average is the “daily”
average. Press NEXT.
This screen shows the background radon content
measured by the instrument and is used for
refining the mass measurement. Press NEXT.
This screen shows the individual text codes in
relation to the combined status codes that are
expected at startup, press TEXT for additional
information.
3-2
Model 5030 SHARP Monitor Instruction Manual
Thermo Fisher Scientific
Operation
Operation and Service Menus
This screen shows the additional “POWER ON”
status code after starting the instrument. Press
NEXT.
Here, the error status is shown. Each character
represents four error bits, assuming values in the
range of 1 and F (hexadecimal: 16). To interpret
the error status, see the “Troubleshooting”
chapter. Press NEXT.
This is the last screen within the main User
Screen, and this shows the current Date
(yy-mm-dd) and Time (hh:mm:ss). To change
these values the keypad must be unlocked. Press
NEXT.
By pressing NEXT, from the last screen within the main User Screen, the
following screen will appear:
This is the OPERATION menu, press NEXT.
This is the SERVICE menu, press NEXT.
CALIBRATION
********************
This is the CALIBRATION menu, press NEXT.
YES BACK NEXT
Operation Menu
This section describes the Operation menu.
Press YES to enter the Operation menu, press
BACK to return to the Main Menu, or press
NEXT to enter the Service menu.
To toggle between the operation via keypad and
serial interface, press the SET key. Please
remember that the parameters cannot be changed
without having enabled the keypad. Press SET.
Thermo Fisher Scientific
Model 5030 SHARP Monitor Instruction Manual
3-3
Operation
Operation and Service Menus
Press NEXT.
Serial Communication
Parameters
Pressing the COM key toggles between the
COM1 and COM2 interface. Choose COM1 or
COM2 to change the serial parameters. Press
NEXT.
The print format indicates which data report will
be issued at the serial interface. You can adjust the
print format using the +/- keys. Press NEXT.
Press PRINT to begin the serial output.
After the set time has elapsed, the selected data
report will output to the serial interface. If set to
0 minutes, the next menu allows a cycle ranging
from 0 to 120 seconds. Printouts will be limited
and repeated to this print cycle. Press NEXT.
This display window allows setting the baud
transmission rate. Choose between 300, 600,
1200, 2400, 4800 and 9600 Baud, using the +/keys.
This display window allows a device number to be
applied to the instrument and is important when
multiple monitors are tied into a network on the
same communications line.
Print Formats
3-4
Print formats are provided by an output spooler. While printing, the normal
measurement operation will not be interrupted and the measuring
instrument can be operated as usual. Remote Control commands are
possible using the second serial interface during printing out the lists via the
first serial interface. From the internal memory, sufficient information from
the print formats is available. The transmission of all half-hourly mean
concentrations over an entire year, including information on date and status,
requires approximately 632 Kbytes. At a bit transmission rate of 9600, the
transmission process will need approximately 10 minutes. The transmission
of hourly values will take less space and time.
Model 5030 SHARP Monitor Instruction Manual
Thermo Fisher Scientific
Operation
Operation and Service Menus
The following information provides examples of the Serial Output Print
Formats, whereby only Print Formats 1-7 will automatically be output
according to the Print Cycle:
1) Date, time, status, and concentration (μg/m3)
04-10-26 15:39:38 000000 10.3
2) Date, time, status, concentration and mass (μg)
04-10-26 15:39:38 000000 10.3 130.4
3) Date, time, status, concentration, mass, and air flow rate (l/h)
04-10-26 15:39:38 000000 10.3 130.4 1000
5) Date, time, status, concentration, ½ h Conc., 1h Conc., 3h Conc., and
Daily Conc.
04-10-26 15:39:38 000082 10.3 10.0 10.7 11.0 10.5
6) Measuring network protocol
MD03 001 3585+01 82 00 324 000000 002 +3630+01 82 00 324 000000
003 -3585-01 82 00 324 000000
or
MD01 000 +3299+01 48 02 323 000000
7) Date, time, status, concentration, mass, flow rate, RH (%), T1 (°C), T2 (°C), T3 (°C), T4 (°C), Heater Cycle
(%), P1 (hPa), P2 (hPa), P3 (hPa), BetaConc-short, BetaConc-long, Neph Counts, NephConc,
NephConc-long, Neph-CalFactor, and Beta Counts
04-10-26 15:39:38 000082 10.3 130.4 999.8 40.5 21.0 30.0 28.0 45.0 43.8 35.8 103.0 997.9 13.5 9.1
172 21.0 18.5 0.492 14562
8) Parameter list
Print Format 8 provides the Parameter List for the Model 5030 SHARP.
The parameter list provides all internally stored parameters for the
operation and calibration of the Model 5030 SHARP. It is recommended
upon receipt of the Model 5030 SHARP that Print Format 8 (Parameter
List) be downloaded and kept as a record of the manufacturer’s default
settings. Upon each calibration and Parameter Change, a download of the
Thermo Fisher Scientific
Model 5030 SHARP Monitor Instruction Manual
3-5
Operation
Operation and Service Menus
Parameter List should be performed and kept for record keeping. Should a
warning or error status condition occur, download the Parameter List for
review.
Table 3-1. Model 5030 SHARP Parameter List
Themo Fisher Scientific SHARP v1.21 SERIAL NUMBER 19 05-03-03
PRINT FORMAT:
COM2 7
PRINT CYCLE:
1 min
BAUDRATE:
Bd 9600
DEVICE ADDRESS:
1
FILTER CHANGE
MASS >
μg 1500
CYCLE
h8
HOUR:
24
AVERAGE STORAGE MODE
1
AIR FLOW
1000
CALIBRATION
SENSITIVITY:
6946
CONCENTRATION FACTOR
100%
HIGH VOLTAGE
1320 V
REF-THRESHOLD
530 mV
T2-COMP-FACTOR
0.00292
P2-COMP.FACTOR
0.00015
Pabs-COMP.FACTOR
0.00055
OPTICAL CALIBRATION
T2-COMP-FACTOR NEPH.
0.2500
OPTIC SENSITIVITY
0.53495
OFFSET RANGE 1
177
OFFSET RANGE 2
29
SENSOR CALIBRATION
T1 T2 T3 T4 RH P1 P2 P3
-37 -58 19 -1 439 71 49 0
AIR FLOW
91.6
FLOW RATE REFERENCE VOLUMETRIC FLOW REF
STANDARD TEMPERATURE
25 °C
HEATER PARAMETERS
3-6
RH NOMINAL VALUE
58% RH
MAX. HEATING TEMP.
60 °C
MIN. HEATING POWER
2%
Model 5030 SHARP Monitor Instruction Manual
Thermo Fisher Scientific
Operation
Operation and Service Menus
Table 3-1. Model 5030 SHARP Parameter List, continued
Themo Fisher Scientific SHARP v1.21 SERIAL NUMBER 19 05-03-03
ANALOG OUTPUTS
OUTPUT ZERO
0 mA
CONC
-100 1000
GESYSTEC PROTOCOL
STATUS VERSION
STANDARD
NUMBER OF VARIABLES
1
CONC
END
9) Parameter Change list: 22 entries
Print Format 9 provides a Parameter Change List. With each Operational or
Calibration change, a record is kept as a means of tracking the parameter
changes. This is an excellent tool for recalling time and dates of operator
interaction, qualifying data and instrument security.
Table 3-2. Parameter Change List
List of Changed Parameters No: 76
Thermo Fisher Scientific
03-02-24
13:21
EF-THRESHOLD
300, 300
03-02-24
13:21
HIGH VOLTAGE
1270, 1300
03-02-24
13:19
CALIBRATION CODE
0, 4
03-02-24
12:57
EF-THRESHOLD:
300, 200
03-02-24 HIGH
12:57
VOLTAGE
1300, 1270
03-02-24
12:55
CALIBRATION CODE
0, 4
03-02-10
16:45
94, 94
03-02-10
16:45
1000, 995
03-02-10
16:44
94, 93
03-02-10
16:44
999, 1010
03-02-10
16:43
999, 1040
03-02-10
16:43
93, 90
03-02-10
16:38
BAROMETRIC PRESSURE
820, 960
03-02-10
16:38
TEMP. INLET HEATER
17, 20
03-02-10
16:38
SYSTEM TEMPERATURE
25, 20
03-02-10
16:38
HEAD TEMPERATURE
31, 20
03-02-10
16:37
TEMPERATURE OUTSIDE
27, 20
03-02-10
16:32
CALIBRATION CODE
0, 4
Model 5030 SHARP Monitor Instruction Manual
3-7
Operation
Operation and Service Menus
Table 3-2. Parameter Change List, continued
List of Changed Parameters No: 76, continued
03-02-10
16:19
CALIBRATION CODE
0, 4
57-00-57
00:57
0, 0
57-00-57
00:57
0, 0
57-00-57
00:57
0, 0
11 & 19) Logbook: 20 & 1,632 entries respectively
Print Formats 11 and 19 provide a Logbook of events. When the instrument
status changes, the new status (including date, time, detailed status code,
general status code, concentration, mass, air flow rate, and most sensor data)
are entered into a logbook. Should an event of interest occur, reviewing the
Logbook can provide precise information of the instruments operation. If
further defining of the detailed error status is necessary, see the
“Troubleshooting” chapter.
Thermo Fisher Scientific
SHARP v1.21
SERIAL NUMBER 001
04-02-23
-------------------------------------------------------------------LOG
DATE /TIME
ERROR
STATUS
03-02-25 15:11:06 0000 0000 0000 0000 000082
-36
0 1000
20
22
79253
0
03-02-25 15:11:03 0000 0000 0000 0000 000092
-36
0
999
20
22
78746
0
03-02-25 15:10:29 0000 0000 0000 0000 000082
-36
0
0
20
22
77014 35384
03-02-25 15:09:37 0000 0000 0000 0000 000089
-36
0
0
31
22
77880 48250
03-02-24 14:04:46 0000 0000 0000 0000 000089
-36
0
0
19
20
79857 49203
03-02-24 13:27:44 0000 0000 0000 8000 020038
-36
-92
0
20
20
82449
0
...
showing
Date
time
error
status Conc. Mass
Q
T1
T2
Rb
Ra
20
30
97
958
20
30
97
958
20
0
0
957
20
0
0
958
20
0
0
964
20
0
1
965
T4
P1
P2
P3
30) Half-hour or Hourly Averages (last 60 stored values)
31) Half-hour or Hourly Averages (last 60 stored values) without header
39) Half-hour or Hourly Averages (> 1 year of data w/expanded memory
option) without header
In compliance with the measuring interval/cycle set, each measured value
that has been calculated and saved in memory can be printed via Print
Formats 30, 31 or 39. Print Formats 30 and 39 start without headers, and
Print Format 31 is represented below. Print Formats 30 and 39 are usually
preferred for later data reduction via spreadsheet applications. Print Format
39 provides data from the expanded memory, over one year of 30-minute
average data.
3-8
Model 5030 SHARP Monitor Instruction Manual
Thermo Fisher Scientific
Operation
Operation and Service Menus
Thermo Fisher Scientific SHARP v1.21 SERIAL NUMBER 323
Averages
Date/Time
Status
Conc
C-14-CONC
04-02-23
12:01
020058
32.9
32.9
04-02-23
11:01
2E01DB
32.9
32.9
04-02-20
17:01
000070
32.3
25.9
04-02-20
16:01
000070
33.5
35.1
04-02-20
15:01
000040
31.8
31.5
04-02-20
14:01
0000FB
31.1
33.2
04-02-20
13:01
0000CB
26.1
25.9
22:01
000040
12.9
14.1
04-02-24
...
04-02-18
END
Please note that the above Print Formats 30, 31, and 39 store both the
hybrid concentration and the traditional C14-Beta derived concentration.
40 & 41) Daily mean values: up to 380 lines
Print Format 41 has no header lines.
Thermo Fisher Scientific
SHARP v1.21 SERIAL NUMBER
001
04-02-24
--------------------------------------------------------------------DAILY MEAN VALUES
DATE
o.k.%
CONC[μg/m3]
--------------------------------------------------------------------04-02-23 100 17.9
04-02-22 100 4.3
04-02-21 100 7.6
04-02-20 100 24.7
04-02-19 100 22.4
.
.
Filter Change Frequency
Thermo Fisher Scientific
The Model 5030 SHARP comes with a filter change cycle of 0-hours, a
filter change hour of 24 (midnight), and a mass limit of 1500 micrograms.
The Model 5030 SHARP will automatically perform a filter change when
the mass on the filter spot reaches 1500 micrograms, when the filter change
cycle has been reached, and when the filter change hour has been reached.
To change these settings, please cross-reference Table 3-1 and the RS-232
commands in this manual.
Model 5030 SHARP Monitor Instruction Manual
3-9
Operation
Operation and Service Menus
Flow Rate Setpoint
The Model 5030 SHARP has a fixed flow rate of 1000 L/h (16.67 L/min).
Dynamic Heating System
The temperature control system that is used on the Model 5030 SHARP
Monitor is the Dynamic Heating System (DHS). A relative humidity sensor
is placed downstream of the optical sensing volume and upstream of the
beta attenuation sample chamber. The RH-sensor placement offers the
ability to measure the RH of the incoming aerosol. At this point in the
menu, only the DHS can be turned ON or OFF using the keypad. Press
NEXT.
Note T1 = ambient temp.,T2 = sample temp., T4 = Heater Wall Temp., and
HL = Heater Duty Cycle. Additional DHS Settings are accessed using write-control commands. See
Appendix B.
Analog Output Configuration
The Model 5030 SHARP has one analog output channel (no. 1) on the
main board.
The analog output can be individually configured by jumpers: as voltage
output (0/2 -10V) or as current loop (0/4 - 20mA). The current output can
be equipped with a module for potential-free signal separation. For the
analog output a live zero signal (4mA or 2V) can be selected.
The assigned quantity for the analog output can be selected by the user. The
available quantities and their codes are listed in the table below. The symbol
is not shown in the configuration display. The user should assume the units
per quantity as listed in the following table.
3-10
Model 5030 SHARP Monitor Instruction Manual
Thermo Fisher Scientific
Operation
Operation and Service Menus
Code
Symbol
Quantity
Unit
1
CONC
Aerosol Concentration
μg/m³
2
MASS
Compensated mass
μg
3
Q-OP
Air flow rate (Volumetric Conditions)
l/h
4
Q-N
Air flow rate (Standard Conditions)
Nl/h
5
T1
Ambient temperature
°C
6
T2
Temperature at filter tape
°C
7
T4
Temperature of external tube heater surface
°C
8
RH
Sample Relative Humidity
%
9
P1
Differential pressure / orifice
hPa
10
P2
Vacuum under filter
hPa
11
P3
Barometric pressure
hPa
12
C-1H
Aerosol Concentration filtered 1 hour
μg/m³
13
M-1H
Compensated mass filtered 1 hour
μg
Here the operator may define the analog output
range.
Note Analog output selections on the display will always show units of
milliamp (mA). Corresponding voltage (V) outputs are achieved by jumper
settings. See the “Installation” chapter. Press Yes.
User-selected zero point output of 0 mA/0V or 4
mA/2V.
Here the user has chosen a live zero to be a 4 mA
(or 2V) analog output. Press NEXT.
Here the user can choose the analog output of the
default channel by using the +/- keypad. Press
NEXT.
User-selected concentration for the zero point of
the analog output range. Possible settings: -100
to 1000 μg/m3. Press NEXT.
Thermo Fisher Scientific
Model 5030 SHARP Monitor Instruction Manual
3-11
Operation
Service Menu
User-selected concentration for the span point of
the analog output range. Possible settings: 0 to
10,0000 μg/m3. Press NEXT.
Language
By pressing the SET key, you can either select English, Spanish, or German
language to be displayed:
Press NEXT.
You are now at the Service menu.
Service Menu
The Service menu allows the user to carry out
hardware and component tests and cable
connections. Press YES.
By pressing the SET key, operation can be
switched over between keypad and serial
interface. Please note that without enabling the
keypad, no parameter changes and no actions
can be accomplished. Press NEXT.
Mechanical Control
This sub-menu enables the measuring head to be
opened and the filter transport to be initiated
manually. Press Yes.
The pump can be switched ON and OFF by
pressing PUMP. Please make sure not to switch
off the pump by pulling off the connecting
cable/plug. Otherwise the device assumes that
the pump is defective or the tubing was pulled
off and consequently sets a corresponding error
status.
3-12
Model 5030 SHARP Monitor Instruction Manual
Thermo Fisher Scientific
Operation
Service Menu
For the purpose of inserting a new filter tape, it is possible to open the
measuring head by pressing YES. The pump is then switched off
automatically.
In case the measuring head has been opened, as
described in the previous menu, the filter tape
transport motor can be switched on by pressing
the YES key. The number displayed symbolizes
the counts of the incremental encoder. This way,
it is always possible to check the filter tape for
correct transport (for example, especially after
installing a filter tape printer).
To stop the motor, press the NEXT and BACK keys. Subsequently, the
measuring head should be closed again or a filter change should be
performed to continue operation.
To close the measuring head, press YES. The
user may also press the FC+Z key to initiate a
full filter change and zero if sampling is to
resume. Press NEXT.
Mass Display
In this screen, the instantaneous mass reading
(MASS) smoothed mass (QLF) are made. In this
menu, the mass can be set to zero or the entire
mass calculation can be reset using the ZERO
and RESET keys, respectively. Once the mass is
stable, the QLF value will appear with an
asterisk (*) next to that value and a confidence
value will appear to the right of the QLF. Press
NEXT.
Hardware and Sensor
Diagnosis
In this screen, a diagnosis of the measurements
being made are provided. Press YES.
Beta Attenuation Detector
Beta-attenuation Detector. In this screen, the
user can validate the initial beta count (Rβø), the
real-time beta counts (Rβ), the alpha counts
(Rα), and the reference setting (Rref ) are all
being measured by the proportional detector.
Thermo Fisher Scientific
Model 5030 SHARP Monitor Instruction Manual
3-13
Operation
Service Menu
To check the proportionate function of the detector, this is best done
immediately after a filter change (see Mechanic Control Above and FC+Z).
Press START and this will initiate a running average of the Rα and Rβ
readings and generally, Rα should be < 1.0 after approximately 60 seconds.
During this functional check, the right hand side
of the screen will show the counter (increasing to
900 seconds), the running average of Rβ and the
running average of Rα from top to bottom of the
screen, respectively.
After this test, if the Rα average value is >1.0, the automated adjustment
procedure should be completed through the Calibration menu (refer to the
“Calibration” chapter) otherwise, press STOP.
The same test can now be conducted on the reference channel (Rref ) of the
proportional detector. First, press Rref. The “Rα” character should now
change to a “Rref ”. Press START to begin the functional check. During this
check, Rref will increase to approximately 50% of Rβ. After approximately
60 seconds, the Rref average value is NOT within 40-60% of Rβ, the
automated adjustment procedure should be completed through the
Calibration menu (refer to the “Calibration” chapter) otherwise, press
STOP and then press NEXT.
The Rβ, Rα, and Rref values should be recorded with each functional check.
Sensor Signals
The following screen will display digital signals of the Model 5030 SHARP
sensors.
Note Should one of the values within this screen blink repeatedly this is an
indication that a sensor malfunction is occurring. Should this occur, please
see the “Troubleshooting” chapter. In this screen, the sensors are presented with
appropriate units of measure. A description of these
sensors appears in the following table. Press NEXT.
3-14
Model 5030 SHARP Monitor Instruction Manual
Thermo Fisher Scientific
Operation
Service Menu
Analog Output Test
Thermo Fisher Scientific
Sensor
Units
Description
T1
°C
Ambient temperature sensor
T2
°C
Sample temperature sensor
T3
°C
Orifice temperature sensor
T4
°C
Heater outer-wall temperature sensor
P1
hPa
Orifice differential pressure
P2
hPa
Differential vacuum under filter tape
P3
hPa
Barometric pressure
RH
%RH
Sample relative humidity
In this screen, the user can test the analog signal
output being sent to their external data logger.
By pressing the respective key, 0/4 mA or 20
mA, an equivalent analog output is provided to
the analog channel. This allows for adjusting
chart recorders connected to the unit and for testing cable connections.
Corresponding voltage output setting will also apply to this test, whereas
4 mA = 2V and 20 mA = 10V. When quitting this menu by pressing either
the BACK or NEXT key, the measured value will be again output to the
analog interface.
Model 5030 SHARP Monitor Instruction Manual
3-15
Operation
Service Menu
3-16
Model 5030 SHARP Monitor Instruction Manual
Thermo Fisher Scientific
Chapter 4
Calibration
This chapter describes the procedures for performing the necessary sensor
calibrations. This chapter is also a follow-up to the Acceptance Testing
outlined in the “Installation” chapter and a continuation of the menu
display descriptions in the “Operation” chapter.
Equipment Required
Thermo Fisher Scientific
The Model 5030 SHARP comes with a HEPA filter and adapter for zeroing
the instrument. Optional mass transfer standards are available from Thermo
Fisher Scientific for performing an annual mass calibration. However,
additional specialized equipment is needed to calibrate the Model 5030 for
temperature, relative humidity, barometric pressure, and volumetric flow
measurements. The following equipment should be used:
•
A thermistor or thermocouple thermometer capable of measuring
ambient temperatures in a range of -30 to +45 °C, readable to the
nearest 0.1 °C. This thermometer should be referenced to within an
accuracy of ±0.5 °C to NIST-traceable precision thermometers. Multiple
thermometers may be used to cover the temperature range as long as
each thermometer meets the accuracy and readability specifications
described above.
•
A barometer capable of measuring barometric pressure over a range of
600 to 800 mm Hg (80 to 106 kilo Pascals [kPa]) and readable to the
nearest 1 mm Hg. At least once a year, this barometer should be
calibrated to within ±5 mm Hg of a NIST-traceable barometer of
known accuracy.
•
Flow-rate Transfer Standard (FTS) measurement equipment capable of
calibrating, or verifying, the volumetric flow rate measurement with an
accuracy of ±2 percent. This flow rate standard must be a separate,
stand-alone device. It must have its own certification and be traceable to
a NIST primary standard for volume or flow rate. Dry-piston meters
and bubble flow meters should only be used under controlled laboratory
conditions. Ambient field measurements should use a NIST-traceable
low pressure drop orifice/venturi flow meter (such as, BGI Delta-Cal).
•
A relative humidity (RH) standard capable of measuring in the range of
35-75% RH, readable to the nearest 0.5% RH and accurate to within
2% RH.
Model 5030 SHARP Monitor Instruction Manual
4-1
Calibration
Pre-Calibration
Pre-Calibration
Prior to calibration, be sure the Model 5030 is operating properly. The
Model 5030’s internal diagnostics makes this a quick and simple process.
Turn on the instrument and allow it to stabilize for one hour prior to
calibrating. If you are receiving this instrument for the first time, the
optional acceptance testing in the “Installation” chapter should also be
reviewed. If the internal sample temperature sensor (T2) requires
calibration, the IMR heating system should be turned off at least one hour
prior to calibrating.
Calibration Menu
CALIBRATION
********************
Press YES to enter the Calibration menu.
YES BACK NEXT
Press SET to access the calibration code menu.
Change the code value to 4, by pressing the +, keys and press NEXT.
The Calibration menu should now be unlocked.
Press NEXT.
Temperature, RH and
Barometric Sensor
Calibration
To calibrate any of the Temperature sensors,
Relative Humidity Sensor, or Barometric Pressure
Sensor, press YES to perform a 1-point
calibration.
Note Wet bath-type calibrations are not recommended. The measured ambient temperature (T1) value is
displayed. To enter the reference value, press the
CAL key and then the +,- keys. The value will be
accepted by pressing the NEXT key.
Reference measurements are made by inserting
the reference probe into an attached or nearby
naturally aspirated radiation shield. After
completion, press NEXT.
4-2
Model 5030 SHARP Monitor Instruction Manual
Thermo Fisher Scientific
Calibration
Calibration Menu
The T1 calibration procedure above is also valid
for the T2 HEAD Temperature (also referred to
as, sample temperature) and can be referenced to
shelter temperature if the Model 5030 has been
equilibrated for approximately one hour while
sampling room or shelter air. Press NEXT.
The T1 calibration procedure is also valid for the
T3 system temperature located at the orifice for
flow measurement. Sufficient time should be
given for the T3 sensor to equilibrate to the T2
temperature (approximately 45 minutes with no
heating). Press NEXT.
The T1 calibration procedure is also valid for the
T4 Heater Outer-wall temperature sensor. This
sensor can be removed from the heated tube
assembly and equilibrated to room or reference
temperature conditions within 5-10 minutes.
Press NEXT.
Similar to the T2 sensor, it is important for the
instrument to be equilibrated to the conditions
of the incoming air temperature since any air
temperature differential from the RH reference
device and the RH sensor located within the
monitor can influence the accuracy of this
calibration. To enter the RH reference value,
press the CAL key and then the +, - keys to
adjust the RH sensor to the reference
measurement. The value will be accepted by
pressing the NEXT key.
Enter the absolute barometric pressure (P3) on
site (make sure not to use a pressure that refers to
sea level!). If local airport data is being used, be
sure to correct for elevation. To enter the P3
reference value, press the CAL key and then the
+, - keys to adjust the RH sensor to the reference
measurement. The value will be accepted by
pressing the NEXT key.
Thermo Fisher Scientific
Model 5030 SHARP Monitor Instruction Manual
4-3
Calibration
Calibration Menu
Barometric Pressure Conversions
hPa = atm X 1,013.2501
hPa = in Hg X 33.8638867
hPa = mm Hg X 1.3332239
There are two additional pressure sensors responsible for the differential
orifice measurement (P1) and the sample differential vacuum measurement
(P2) under the filter tape. Both of these pressure sensors are very stable with
the factory calibration and are re-zeroed with every filter change.
Sample Flow Rate
Calibration
This is the sub-menu used for the air flow rate
calibration. The user may toggle the pump
on/off with the PUMP key. Generally it is good
practice to turn the pump off prior to attaching
and removing the flow transfer standard (FTS).
The volumetric flow rate is initially indicated as
measured by the Model 5030. Press CAL to
adjust the air flow rate calibration coefficient.
Thereafter, adjust the volumetric air flow rate
measured by a FTS using the +, - keys and press
NEXT. Allow 30 seconds between indicated air
flow adjustments. Repeat as necessary until
corresponding FTS and Model 5030 flow rate
values agree within 2%.
Flow Conversions
L / h = L / min X 60
L / h = m3 / hr X 1000
L / h = m3 / min X 60,000
Note The air flow calibration always has to be performed last. Subsequent
temperature and pressure sensor calibrations could have an impact on the air
flow calibration. Automated Detector
Adjustment
4-4
The automated detector adjustment is completed through a series of serial
commands and can be found on our Air Quality Instruments Online
Library at www.thermoscientific.com/aqilibrary.
Model 5030 SHARP Monitor Instruction Manual
Thermo Fisher Scientific
Calibration
Calibration Menu
Theoretical Adjustment of
the High Voltage and the
Thresholds
a) Detector - Plateau
The following images provide some technical information on the operation
of the detector, and its theory of operation.
b) Height of Pulse
Figure 4-1. Theoretical Adjustment of the High Voltage and the Thresholds
During the factory setup, the High Voltage of the detector, the thresholds
and the plateau are determined and documented within the final test
protocol. Only in case of a detector error or instrument status condition
should this readjustment be done.
The Model 5030 SHARP - detector is a proportional counter, which
depends on the operating High Voltage (HV). Figure 4-1a shows the
relation of count rate versus HV. The detector is operational within the
range of the plateau and all pulses caused by the 14C betas can be counted.
Figure 4-1b shows the height of pulse as a relation of count rate versus the
threshold in mV. This system is designed to be able to separate the beta (β)
radiation from natural alpha radioactivity (Radon). The natural alpha
particles have higher energies than the 14C betas. Therefore the alpha
particles give a higher signal.
If the HV is too low the count rate of the detector is not in the plateau. If
the HV is too high the system measures more 14C beta counts as alpha
activity.
Thermo Fisher Scientific
Model 5030 SHARP Monitor Instruction Manual
4-5
Calibration
Calibration Menu
The instructions to “Insert Filter Tape” are
directed at the user to perform a filter change
prior to initializing this automatic adjustment
procedure. This is described in the “Automated
Detector Adjustment” procedure described
previously. Press START.
The display of the Model 5030 will automatically proceed through the HV
and threshold adjustments necessary to bring the detector within operating
specifications. During this automatic procedure, the beta counts (Rβ), the
alpha counts (Rα), and the reference setting (Rref ) are being measured and
optimized within this routine.
The procedure is now complete. Press NEXT.
If the Plateau Slope is >10%, repeat the adjustment.
4-6
Model 5030 SHARP Monitor Instruction Manual
Thermo Fisher Scientific
Calibration
Calibration Menu
Mass Foil Calibration
The Model 5030 SHARP is calibrated for mass in the factory using a series
of null and span foils. The mass transfer standard foil sets are available from
Thermo Fisher Scientific, and should be used as part of a QA Program for
performing a QC check on the mass measurements. This mass foil
calibration procedure can be used for QC checks, auditing, and calibration.
Zero and Span Foils
Foil Holder
•
It is recommended to perform an annual mass calibration on the Model
5030 SHARP Monitor.
•
The foil sets must be kept in a clean container.
•
The foils must not be wiped, otherwise a loss or gain of mass can occur
thereby biasing the mass calibration.
•
Foils sets can be returned to Thermo Fisher Scientific for recalibration
as necessary.
•
Separate foil sets are recommended for periodic QC checks, auditing,
and calibration.
•
Should the user suspect the foil window(s) has been damaged,
scratched, or coated, these foil sets should be returned to Thermo Fisher
Scientific for recalibration.
The null foil has the same approximate mass as a clean filter spot and the
span foil is a calibrated mass increase above the null foil. Therefore, the foils
come in a set and must not be mixed with other sets since a bias in mass
calibration will occur.
Since the beta attenuation method is linear with mass increase, the Model
5030 need not be calibrated in the exact range of beta attenuation per filter
spot. What is important, is calibrating the corresponding beta count
reduction with an increase of calibrated mass.
Thermo Fisher Scientific
Model 5030 SHARP Monitor Instruction Manual
4-7
Calibration
Calibration Menu
Note To achieve the most accurate mass calibration, the T2 sample
temperature should be as stable as possible and therefore the instrument
should have the IMR heating system turned off, and the instrument should
be allowed to equilibrate to shelter or ambient temperature. If the Model
5030 SHARP is mounted within an ambient shelter, then the most stable
time of day to perform a mass calibration would be either early morning or
late afternoon. To begin the mass calibration using the
reference mass foils, press YES.
Please enter the SPAN foil value using the +, keys. Press NEXT.
The beta attenuation chamber should now
open. During this period, this screen will be
displayed for approximately thirty seconds.
Cut/break the filter tape on the left side of the
measurement head and pull the remaining filter
tape out from the right hand side. Then insert
the foil holder from the left into open gap.
Maintaining a slight sideward pressure on the
filter holder, press NEXT to proceed with the
foil calibration, or press ABORT to stop the foil
calibration.
While the beta attenuation closes, this screen
will display for approximately thirty seconds.
Insert the zero/null foil. Press NEXT to continue
or press ABORT to stop the foil calibration.
The auto zero procedure of mass will begin and
last for approximately 200 seconds.
4-8
Model 5030 SHARP Monitor Instruction Manual
Thermo Fisher Scientific
Calibration
Calibration Menu
MASS = Instantaneous Mass
QLF = Quick Lock Filter for the mass
CONFID = Confidential Interval
When the zero is complete, the beta
attenuation measurement head will remain
closed. Remove the zero/null foil and insert
with the span foil (for example, 1442 μg). Press
NEXT to continue or press ABORT to stop the
foil calibration.
The span foil calibration procedure is now
active. After ~ 200 seconds the calibrations
procedure should end.
After the span calibration, the screen will show
the OLD and NEW mass calibration factors.
Press NO, if you DO NOT want to change, or
press YES to store the new calibration factor.
After selecting YES, the screen will indicate the
measurement head is opening. You may now
remove the span foil and place it into its
protective case. Thereafter, you may remove the
foil holder and immediately insert the filter tape from the left. Should the
user not have sufficient time to replace the filter tape, the Mechanic Control
in the Service menu can be used. Press NEXT to proceed.
Nephelometer Zero and
Calibration
The Model 5030 SHARP has a nephelometer (aerosol light scattering
sensor) built-in upstream of the beta attenuation measurement chamber
and downstream of the instrument sample delivery tube. This nephelometer
is calibrated for zero and span in the factory using a HEPA filter and ISO
Fine Test Dust 12103-1, A-2, respectively. Of the two measurements, it is
more important to perform periodic checks on the zero performance of the
instrument.
Although field tests have indicated both a stable zero and span
measurement, it is more likely that the nephelometric chamber could
increase in background over time, thus affecting both zero and span
measurements. However, due to the nature of this hybrid method it is only
necessary to perform periodic Zero Calibrations on the Model 5030
SHARP, thereby leaving the aerosol response to be calibrated by the
long-term beta attenuation measurement.
Thermo Fisher Scientific
Model 5030 SHARP Monitor Instruction Manual
4-9
Calibration
Calibration Menu
The Zero/background of the nephelometer is measured by placing the inlet
adapter and HEPA filter at the inlet of the instrument. To zero the
nephelometer, proceed according to the following displays:
To begin the Nephelometer Zero/Calibration,
make sure the HEPA filter is installed at the inlet
and press YES.
At this next screen, you can record the as-found
digitized analog signal value under ANALOG
(for example, 205 LSB), and the as-found one
minute average zero measurement under NEPH
(for example, 1.3 μg/m3). Generally the user should allow 3-5 minutes for
the Nephelometer reading to stabilize after disturbing the inlet connections.
The other two values appearing on this screen is the long-term beta
concentration under C14 (for example, 2.5 μg/m3) and the current hybrid
concentration to the right of CONC (for example, 0.7 μg/m3). In order to
zero the nephelometer, press ZERO on the keypad and the following screen
will appear:
After pressing ZERO, the screen will begin an
automatic 60-second average of the nephelometer
operating on the 0-1,000 μg/m3 concentration
range. The counter is in the lower right hand of the
screen.
After the first range is zeroed, the second Range
(0-10,000 μg/m3) is independently zeroed over a
20-second period.
Now the Nephelometer background is zeroed for
both ranges of measurement. Another five minute
measurement cycle can be performed and
compared to the “as found” values.
Performing a SPAN Calibration of the Nephelometer is initially done in the
factory. During this SPAN Calibration a master nephelometer,
gravimetrically calibrated to ISO Fine Test Dust 12103-1, is placed
immediately upstream of the Model 5030 SHARP. During calibration the
test dust is delivered to the test assembly, and once a stable concentration is
achieved the technician will press SPAN on the Model 5030 menu. During
this period, the Model 5030 will calculate a one-minute average from the
nephelometer while the display counts down from 60-seconds to zero. At
the end of the test run, the average concentration from the master
Nephelometer is enlisted using the +/- keys. Press NEXT.
4-10
Model 5030 SHARP Monitor Instruction Manual
Thermo Fisher Scientific
Calibration
Configuration Menu
Configuration Menu
Within the Configuration menu, the user can choose what sample volume
conditions to use, to define the standard temperature value, and to establish
a communication protocol compatible with previous Thermo Fisher
Scientific models.
To enter the Configuration menu, press YES.
By default, the Model 5030 SHARP comes with
a 100% scaling of the beta attenuation derived
aerosol concentration. Should any site-specific
issues require a change in the response in the
accuracy (slope) of the Model 5030 SHARP, compared to a reference
measurement, the response can be adjusted in this screen by pressing the +/keys.
After the response scale has been adjusted, press
NEXT.
In this menu, the user can choose which
conditions the sample flow rate, and thus sample
volume and concentrations, are to be reported
in. The choices are either Volumetric Conditions
or Standard Conditions. The sample volume
conditions can be toggled by pressing the SET
key.
Press NEXT.
Volumetric conditions are also known as actual or local conditions (LTP)
and reference the volumetric sample flow that has entered the inlet.
Standard conditions (STP) adjust the measured sample flow rate and sample
volume to 1 atmosphere of barometric pressure and a user-defined standard
temperature.
Note The sample flow rate at the inlet is always controlled to a volumetric
flow rate due to the particle penetration characteristics required for size cut
requirements. Thermo Fisher Scientific
Model 5030 SHARP Monitor Instruction Manual
4-11
Calibration
German Networking Protocol
Depending upon the air monitoring program
requirements, the standard temperature can be
adjusted as needed using the +/- keys. Press
NEXT to continue.
German Networking
Protocol
The GESYTEC Protocol references network
protocols in Germany and can be set to either
I-N Compatible or to a STANDARD version.
Press SET to switch between version required by
the user.
Press NEXT to continue.
In the following two screens the number of
variables (1-7) and the value for each variable can
be chosen as necessary. Press NEXT.
Press NEXT.
Storing Calibration
Values and
Operational
Parameters
This Calibration menu asks the user if they
would like to set the new parameters (such as,
Calibration and Operation) to be stored into the
EEPROM. If this is not done, the next time the
power is cycled, or a user chooses to Reload
Values From EEPROM in the next screen, all Operational and Calibration
changes will be lost. To store these settings, press YES.
All parameters, dates and calibration data are written into the EEPROM.
These data are reloaded, either in case an error is detected in the
battery-buffered RAM when switching the main switch or by simply giving
the respective command via keyboard entry in the next screen.
4-12
Model 5030 SHARP Monitor Instruction Manual
Thermo Fisher Scientific
Calibration
Reloading from EEPROM
The system indicates whether the writing process
has been successful or whether a write/read error
has occurred. It should also be noted that any
Operation menu changes (see the “Operation”
chapter) should also be saved to EEPROM. If a power outage should occur,
Operation menu changes will revert back to prior settings.
Reloading from
EEPROM
Should a program error occur, it is first
recommended that the user attempt to reload
the operational parameters from the
EEPROM.
CAUTION If operational parameter changes have been made within the
Operations menu, they must be saved via the CALIBRATION menu in
order to become new default settings. Otherwise, the original parameter
settings will be restored when RELOAD is used. The RELOAD command
is also used if any memory errors are seen. Furthermore, RELOAD from the
EEPROM will happen automatically after the power is turned on and if an
error in the battery buffered SAVE-RAM has been found. After all calibrations are completed, the keypad may be disabled, and
normal operation should continue. Normally, a filter change and zero
(FC+Z) is usually activated after a calibration.
Thermo Fisher Scientific
Model 5030 SHARP Monitor Instruction Manual
4-13
Calibration
Reloading from EEPROM
4-14
Model 5030 SHARP Monitor Instruction Manual
Thermo Fisher Scientific
Chapter 5
Preventive Maintenance
The Model 5030 SHARP has been designed to operate unattended for a
period of up to one year. However, monitoring program requirements can
vary and sometimes depend upon the application and the regulations that
the sampling method must meet.
This chapter describes the periodic maintenance procedures that should be
performed on the Model 5030 SHARP to ensure proper, uninterrupted
operation. Certain components, such as the sample pump and filter tape,
have a limited life and should be checked on a regular basis and replaced as
necessary. Other procedures, such as annual optics and sample chamber
cleaning should be performed by a trained technician, and periodic checks
on the calibration of the pressure and temperature sensors should also be
performed. In this chapter, the specific checks and/or cleaning procedures
for these elements are reviewed.
Refer to the “Servicing” chapter for the component replacement procedures.
Spare Parts
Table 5-1 lists the recommended spare parts.
Table 5-1. Recommended Spare Parts
Thermo Fisher Scientific
Part Number
Description
FH111
Filter Tape Roll
FH153C14
Pump Repair Kit for FH180 and FH180-1 Pumps: includes
SM169001042 Set of 3 Carbon Vanes and KT144248920 Set of 2
PVC Separators
SM169001042
Set of Three Carbon Vanes for FH180, FH180-1 and 425452061
Pumps
KT144248920
Set of 2 PVC Separators for FH180 an FH180-1 Pumps
FH153-01
Pump Repair Kit for 425452061 Pump; includes SM169001042 Set
of 3 Carbon Vanes and KT144248920 Set of 2 PVC Separators
KT144248925
Set of 2 PVC Separators Only for 425452061 Pump
425452065
110-240V, 50/60Hz Vacuum Pump
KT169001023
Pump Repair Kit for 42542065 Pump; includes set of 5 Carbon
Vanes
KT169001024
Pump Protection Filter
Model 5030 SHARP Monitor Instruction Manual
5-1
Preventive Maintenance
Maintaining the Sample Vacuum Pump
Maintaining the
Sample Vacuum Pump
A rotary vane pump with a dry rotor is used as a source of vacuum. The
pump performance is excellent, with minimal heat and noise generation.
Only a few maintenance items are required, even when running
continuously. The pump can be operated without the need for installing
additional filters since the air delivered to the pump is already free from any
particulate matter. However, minor amounts of carbon dust may be
exhausted from the pump operation and should be filtered or vented if
indoor air is being measured.
By default, the air flow rate is set to 1000 l/h (16.67 l/min) with a ±5%
tolerance. When measuring aerosol, the pump can be set between 500-1200
L/h (8-20 L/min), but must be set to a corresponding flow rate of any size
selective inlets (for example, PM10, PM2.5). Nevertheless, if the Model 5030
SHARP cannot reach the desired nominal flow rate, a filter change will be
performed automatically under the assumption that the filter spot may have
become clogged.
An excellent indicator of pump performance is achieved by reviewing the %
Power to the pump in the Main Display sub-menu. If the flow rate of the
Model 5030 SHARP is below the nominal set point and the pump power is
very high (>95%), then the user should check and tighten all external
fittings, and if necessary tighten the internal fittings surrounding the flow
path. Otherwise, if all fittings are tight and pump wear is suspected, then the
user should replace the vanes (See the “Servicing” chapter).
Maintenance of the rotating pump must be performed in accordance with
the special instructions given by the pump manufacturer.
Because the pump usually only operates with pre-filtered air, abrasion of the
carbon vanes is only minor. The service life of a set of carbon vanes amounts
to more than one year of operation. For this reason, one should either check
the carbon vanes at intervals of 2,000 - 3,000 hours, which corresponds to a
three-month cycle or change them once a year (See the “Servicing” chapter).
Vane replacement must be performed outdoors. Failure to do so may
introduce carbon particles into the air and damage electronic
equipment.Before servicing, the vacuum pump must be switched off and
secured against accidental power-up. In order to replace the vanes, the
silencer housing, the silencer diaphragms, the distance ring, and the cylinder
cover must be removed (Figure 5-1). Blow carbon dust from vane cavity
with an air hose.
WARNING Avoid inhaling carbon dust. Use an approved particle filter or
respirator. 5-2
Model 5030 SHARP Monitor Instruction Manual
Thermo Fisher Scientific
Preventive Maintenance
Checking the Air Flow
Silencer Diaphragm
Silencer
Cylinder Cover
Distance Ring
Figure 5-1. Location of Pump Parts
When installing new vanes, be sure that the beveled side points outwards
(see circled areas within Figure 5-2). Reassemble the parts in the reverse
order.
Figure 5-2. Carbon Vane Installation
Checking the Air Flow
Thermo Fisher Scientific
To check and calibrate the air flow rate, please see the detailed description
given in the “Calibration” chapter. For this purpose, a flow transfer standard
(FTS) is needed to determine and calibrate the air flow (preferred flow
meters can be supplied by Thermo Fisher Scientific as maintenance
accessories).
Model 5030 SHARP Monitor Instruction Manual
5-3
Preventive Maintenance
Temperature Sensors
Typically it is recommended by the USEPA to visit the monitoring site
biweekly to perform a flow check for control charting purposes. Flow audits
can be done once per quarter. If the flow rate of the Model 5030 SHARP
does not deviate by more than ±5% of the auditing standard then no
calibration is required except for an annual calibration. A drifting control
chart from biweekly flow checks can define for the user what the calibration
frequency may be for the instrument and if there is any sensor drift.
However, the Model 5030 has been designed to hold a valid calibration for
up to one year.
Please be cautious in choosing flow standards in the field. Typically bubble
flow meters and dry piston meters should be limited to laboratory use and
are not recommended by Thermo Fisher Scientific as an appropriate flow
meter for field conditions. Thermo Fisher Scientific recommends the use of
a venturi-style flow meter.
Temperature Sensors
Four temperature sensors are included in the Model 5030 SHARP:
•
T1 ambient sensor
•
T2 sample sensor (located inside the beta attenuation chamber)
•
T3 flow sensor (which measures the temperature at the subsonic orifice)
•
T4 heater sensor (located on the external heater wall)
The measuring range of these temperature sensors is -22 to 158 °F (-30 to
70 °C), however the Model 5030 SHARP is rated for a temperature range of
-22 to 140 °F (-20 to 60 °C). The T4 Heater Sensor is rated for a
temperature range of 0-100 °C.
Although the Model 5030 SHARP should hold a valid calibration for up to
one year, typically it is recommended by the USEPA to visit the monitoring
site biweekly to perform a flow check for control charting. Should an error
in the flow check be significant (>7%), the error may be caused by one of
the temperature sensors. It would also be beneficial to control chart the
temperature sensors with each site visit. Furthermore, temperature sensor
audits can be done once per quarter. If any temperature sensor does not
agree within ±3.6 °F(±2 °C) of the auditing standard then a calibration is
required in addition to an annual calibration. A drifting control chart from
biweekly checks can define for the user what the calibration frequency may
be for the instrument and if there is any persistent sensor drift. Should a
temperature sensor need to be replaced, reference the “Servicing” chapter.
5-4
Model 5030 SHARP Monitor Instruction Manual
Thermo Fisher Scientific
Preventive Maintenance
Pressure Sensors
Note The T1 Ambient temperature sensor is readily accessible. However,
the T2, T3, and T4 sensors should be allowed to equilibrate to either
ambient or room temperature if the IMR Heating system has been active
within the past one-hour. Pressure Sensors
Three pressure sensors are included in the Model 5030 SHARP:
•
P1 orifice sensor
•
P2 pump vacuum sensor
•
P3 barometric pressure sensor
P1 measures the pressure differential across an orifice and is used for the
flow calibration. P2 measures the vacuum under the filter tape, relative to
barometric pressure. P3 directly measures the barometric pressure.
Although the Model 5030 SHARP should hold a valid calibration for up to
one year, typically it is recommended by the USEPA to visit the monitoring
site biweekly to perform a flow check for control charting.
Should an error in the flow check be significant (>7%), the error may be
caused by one of the pressure sensors (most probably P3 barometric
pressure). It would also be beneficial to control chart the P3 sensor with
each site visit. Furthermore, P3 sensor audits can be done once per quarter.
If the P3 sensor does not agree within ±10 mm Hg (±13.33 hPa) of the
auditing standard, then a calibration is required in addition to an annual
calibration. A drifting control chart from biweekly checks can define for the
user what the calibration frequency may be for the instrument and if there is
any persistent sensor drift. Should a fatal error occur with a pressure sensor,
contact the Thermo Fisher Scientific.
Note The P1 and P2 pressure sensors are factory calibrated and re-zeroed
with each filter exchange. Calibration for these two sensors can only be
done by a factory-trained technician. The “Installation” and “Calibration” chapters provide the procedures for
re-zeroing the nephelometer. Although the nephelometer is designed to
provide a consistent optical background measurement, drift may occur
should the optics becoming coated over time. Normally an annual cleaning
of the optics by a factory-trained technician should be scheduled.
Thermo Fisher Scientific
Model 5030 SHARP Monitor Instruction Manual
5-5
Preventive Maintenance
Inlet Assemblies
Although the Model 5030 SHARP should hold a valid calibration for up to
one year, typically it is recommended by the USEPA to visit the monitoring
site biweekly for the QC checks referenced above. However, during these
visits it is also a convenient time to check the optical background of the
nephelometric stage (as described in the “Installation” and “Calibration”
chapters) by performing a zero measurement using the inlet adapter and
HEPA filter. After five minutes, both the ANALOG and NEPH values
should be control charted as “as found” values. The NEPH value should
read 0.0 μg/m3, ±2.0 μg/m3. If the NEP reading is outside of this control
criteria, the Nephelometer should be re-zeroed, and a post-site-visit
ANALOG and NEPH value should be recorded. Unless unusual dust
storms have recently occurred and apparently interfered with subsequent
measurements, the nephelometric chamber should be cleaned once per year
by a Thermo Fisher Scientific certified technician or qualified field
personnel.
Inlet Assemblies
PM2.5 Impactor Cleaning
and Inspection
The inlet assemblies can include a simple sampling cane, extended
downtube, particle size separation devices (cyclone or impactor), and/or
ambient 10-micron inlet. Cleaning schedules and routine maintenance of
assembly components (such as, O-rings) should be established and
maintained by the user.
If using a WINS Impactor (Figure 5-3) with the Model 5030 SHARP for
PM2.5, disassemble and clean the impactor at least every five sampling days.
Impactor Housing, Upper
Impactor Well, Upper
Impactor Well, Lower
Impactor Housing, Lower
Figure 5-3. Exploded View of PM2.5 WINS Impactor
5-6
Model 5030 SHARP Monitor Instruction Manual
Thermo Fisher Scientific
Preventive Maintenance
Inlet Assemblies
The PM2.5 impactor is cleaned by separating the upper and lower housings,
wiping the upper and lower impactor well clean with lint-free laboratory
tissues or a cloth, putting a new filter in the lower impactor well, and
adding 1 ±0.1 ml of impactor oil. The oil should cover the filter uniformly.
Reassemble the well and place in the impactor.
Preparation time can be saved by preparing several spare impactor wells and
storing them in a clean, particulate-free container until needed.
Once a month, with the impactor assembly open, inspect the interior of the
impactor housing, both above and below the impactor well. These areas
should be clean and dry. If necessary, clean the areas with a lint-free wipe.
On a monthly basis, clean the interior of the impactor nozzle jet using a
lint-free pipe cleaner or similar tool. Also monthly, check the O-rings for
distortion, cracks, fraying, or other problems and replace as necessary.
Cyclone Maintenance
If a Sharp-Cut Cyclone or a BGI Very Sharp-Cut Cyclone is being used for
PM2.5 sampling (Figure 5-4), once every 4 weeks the dust pot should be
unscrewed, emptied, and cleaned with a lint-free cloth. Once every three
months, the entire SCC assembly should be inspected and cleaned, O-rings
checked for distortion, cracks, fraying, or other problems. Replace O-rings
as necessary.
Inlet
Dust Pot
Outlet
Figure 5-4. PM2.5 Sharp-Cut-Cyclone
Thermo Fisher Scientific
Model 5030 SHARP Monitor Instruction Manual
5-7
Preventive Maintenance
Inlet Assemblies
USEPA PM10 Inlet
The water collector bottle located on the PM10 inlet should be inspected at
least every five sampling days (Figure 5-5). Remove any accumulated water,
clean the interior of the bottle, inspect the seals, and replace the bottle in the
holder.
Figure 5-5. USEPA PM10 Inlet
Once a month the sampler inlet should be dismantled and cleaned. Mark
each assembly point of the sampler inlet with a pen or pencil to provide
reference marks during reassembly.
Disassemble the sample inlet unit according to Figure 5-5. If the assembly
screws are frozen, apply penetrating oil or commercial lubricant to make
removal easier. Clean all interior surfaces and the bug screen with a general
purpose cleaner or compressed air, paying particular attention to small
openings and cracks. Cotton swabs and/or a small brush are helpful.
Completely dry all components.
Also monthly, check the O-rings for distortion, cracks, fraying, or other
problems and replace as necessary. Apply small amounts of grease to the
rings before assembling the unit.
5-8
Model 5030 SHARP Monitor Instruction Manual
Thermo Fisher Scientific
Preventive Maintenance
Inlet Assemblies
Reassemble the unit in accordance with the previously scribed match marks.
Particular care should be taken to ensure that all O-rings seals are properly
seated and that all screws are uniformly tightened.
European PM10 Inlet
The same schedule should be used for the European PM10 Inlet, at
approximately a 1-2 month interval. The components of the inlet should be
inspected and cleaned as necessary. Figure 5-6 provided below provides a
image and design drawing of the inlet, with references to parts.
Nozzles (8)
Baffle Plate
Safety Snap-Locks
Tube (d = 16/14)
Figure 5-6. European PM10 Inlet
PM10 size selective inlet (1 m³/h) for FH 62 Dust Monitors:
Thermo Fisher Scientific
•
Same construction as the EN reference inlet, but with 1 m³/h
•
With special surface protection using an aluminium EMATAL surface
•
With special water separator and easy exchangeable impactor baffle
plate
•
Standard tube connection: d = 16 mm for connecting a continuous
monitor
•
Easy converting to PM2.5 using the PM2.5 nozzle plate (8 nozzles)
•
Easy converting to PM1 using the PM1 nozzle plate (8 nozzles)
Model 5030 SHARP Monitor Instruction Manual
5-9
Preventive Maintenance
Leak Check Procedure
Weather Proofing
The “Installation” chapter covers detailed installation instructions. After
proper installation, it is recommended to check the weather-proof
installation at all interfaces exposed to ambient conditions. Ensure that the
condition of the roof flange and silicone caulking will prevent any
precipitation from entering the shelter and possibly damaging the
instrument’s electronics.
Leak Check
Procedure
The leak check of the 5030 SHARP is conducted by first placing the
factory-supplied leak check adapter (Thermo part number 110524-00) on
top of the inlet adapter. Afther the leak check adapter (LCA) is installed,
attach a flow meter on top of the LCA. The addition of the LCA and the
flow meter can cause the instrument to automatically change the filter spot.
Allow the flow rate to stabilize and then document the flow meter reading.
The next step is to remove the LCA and reconnect the flow meter onto the
inlet adapter. Allow the flow rate to stabilize and document the value from
the flow meter. Compare the volumetric flow rate of the flow meter before
and after the use of the LCA and calculate the difference.
It is normal for the 5030 to have a lower flow rate approximately 0.8 alpm
when the LCA is attached compared to without the LCA. If the difference is
less than 0.80 L/min (80 ml/min) the the leack check passes. If it is greater
than 0.8 alpm, check for leaks in the system by checking the various fittings
upstream of the measurement head. If the source of the leak cannot be
found, the instrument requires service by a trained technician.
5-10
Model 5030 SHARP Monitor Instruction Manual
Thermo Fisher Scientific
Chapter 6
Troubleshooting
The Model 5030 SHARP has been designed to achieve a high level of
reliability. Only premium components are used, thus complete failure is
rare.
In the event of problems or failure, the troubleshooting guidelines presented
in this chapter should be helpful in isolating the fault(s).
For additional fault location information refer to the “Preventive
Maintenance” chapter in this manual.
The Technical Support Department at Thermo Fisher Scientific can also be
consulted in the event of problems. See “Service Locations” at the end of
this chapter for contact information. In any correspondence with the
factory, please note the serial number of the instrument.
This chapter provides the following troubleshooting information:
CAUTION Some internal components can be damaged by small amounts of
static electricity. A properly grounded antistatic wrist strap must be worn
while handling any internal component. For more information about
appropriate safety precautions, see the “Servicing” chapter. Safety Precautions
Troubleshooting
Guides
Read the safety precautions in the Preface and the “Servicing” chapter before
performing any actions listed in this chapter.
The troubleshooting guide presented in this chapter are designed to help
isolate and identify instrument problems.
Table 6-1. Troubleshooting Guide
Malfunction
Possible Cause
Action
Does not start up
No power
Check that the
instrument/pump is plugged
into the proper source
(100/120V or 220/240V)
Check instrument fuse
Thermo Fisher Scientific
Model 5030 SHARP Monitor Instruction Manual
6-1
Troubleshooting
Troubleshooting Guides
Table 6-1. Troubleshooting Guide, continued
Malfunction
Possible Cause
Action
Power supply
Check voltages from power
supply
Digital electronics
Check that all boards and
connectors are seated
properly
defective
Replace with spare boards
to isolate the problem
Cannot change
parameters
Keypad is not enabled
Enable keypad through menu
No automatic filter
change
Reel nuts not tight
Tighten reel nuts
No more filter tape
Replace with new filter tape
Filter not properly adhered
Adhere filter tape to take-up
reel and wind over itself
once
Optical Tape Counter defective
Replace optical tape
transport sensor
Filter tape transport drive motor
defective
Replace motor
Pressure transducer
does not hold
calibration or is noisy
Pressure transducer
Replace pressure transducer
Run output noisy
Recorder noise
Replace or repair recorder
and/or leads.
Sample concentration varying
Run Model 5030 on a zero
filter - if quiet, there is no
malfunction
Foreign material in
Clean optical bench
defective
optical bench
Digital electronics
Analyzer does not
calibrate properly
Analog test ramp
6-2
Model 5030 SHARP Monitor Instruction Manual
defective
Replace board with a spare
board
System leak
Find and repair leak
Pressure or temperature
transducer(s) out of calibration
Recalibrate pressure or
temperature transducer(s)
Digital electronics defective
Replace one board at a time
with a spare board to isolate
the defective board
Faulty recorder
Replace recorder
Zero output on
Turn Zero off
Thermo Fisher Scientific
Troubleshooting
Status Messages
Table 6-1. Troubleshooting Guide, continued
Malfunction
Possible Cause
Action
Span output on
Turn span off
Digital electronics
Replace board with a spare
board
defective
Display is off
Status Messages
Wrong contrast setting
Adjust potentiometer on
board
LCD cable loose
Check connection and cable
integrity
LCD defective
Replace display
The status messages serve to inform and alert the user of the instrument
operation. Among these features are the operating status, warning status and
error messages.
The status message can be reviewed in the Main Menu and through the
internal memory data download. In case there is no status message present,
the measuring instrument is in the normal operation mode and the green
LED “READY” will be illuminated.
The yellow LED “STATUS” stands for an operating and/or warning status.
The red LED “ERROR” will illuminate in case of an instrument error.
The general status message is abbreviated and represented as a 6-digit
hexadecimal number. Each of the 6 characters represents up to 4
independent conditions. The eight global error status bits each represent a
group of eight status bits. Consequently, a total number of 64 errors
independent of each other can be distinguished allowing the user to pin
point a specific error.
With the measuring instrument being in the normal error-free
measurement operation, the status will show the value 000000.
Global status: 6 characters, each one consisting of 4 bits, characters 0
thorough F.
In the following section is a list of the most important status displays. The
status, however, can occur also in various other combinations.
Thermo Fisher Scientific
Model 5030 SHARP Monitor Instruction Manual
6-3
Troubleshooting
Status Messages
Status Concept and
Structure
This section interprets the Operational, Warning and Error Status codes
that may be indicated by the Model 5030.
Warning and Operating
Detailed Status Reports
6-4
Model 5030 SHARP Monitor Instruction Manual
Warning Status
Thermo Fisher Scientific
Troubleshooting
Status Messages
Table 6-2. Warning Status Report
Status Code
Definition
01
maximum pump power
02
mass limit is exceeded; filter change will follow
04
Nephelometer Background Offset High (> 700), Neph < -1
08
Relative Humidity > (RH Setpoint + 10%)
10
not used
20
Compensation of the mass signal > ±5%
40
two consecutive plateau checks are wrong during filter change: Rref/R1 <
30% or > 70%
80
Analog Range 2
Operating Status
Table 6-3. Operating Status Report
Structure of the Status
Conception
Thermo Fisher Scientific
Status Code
Definition
00
Normal operation, no error
01
Mechanical filter change
02
Plateau check and zero adjustment of the mass (R0)
04
System Stabilizing (for 12h after switched on)
08
Pump switched off
10
Manual operation (off-line, keyboard enabled)
20
Calibration enabled
40
Nephelometer Calibration Stabilizing
80
Power supply switched on
Note The detailed status messages are a result of added status codes and thus
form the warning as well as the operating status. Model 5030 SHARP Monitor Instruction Manual
6-5
Troubleshooting
Status Messages
Examples:
Status
Significance
011
0010
Manual operation
0001
Mechanical Filter change
0080
Power Supply Switched on
0002
Zeroing (mass)
0001
Filter change (mechanical)
0008
Pump off
0020
Calibration enabled
0080
Poewr Supply Switched on
0082
00A9
Note Below are the combinations of potential added status codes and their
breakdown. In the STATUS example above, recognize that the “A” in 00A9
shows a combination of 20 and 80 for the Operating Status. Do not confuse
this with a 02 and 08 for Operating Status. The positioning of the
alphabetical character is key to defining which codes the instrument is
reporting. Being able to recognize these subtleties will allow the user to
easily define and troubleshoot the Model 5030 as necessary. Below is a
matrix of alphanumeric combinations. Status Codes - Alphanumeric Combinations
Detailed Status Messages
0
1
2
3=2+1
4
5=4+1
6=4+2
7 = 4 + 2 +1
8
9=8+1
A=8+2
B=8+2+1
C=8+4
D=8+4+1
E=8+4+2
F = 8 + 4 + 2 +1
From the Main Menu, a Global Error Status appears as a 2 hexadecimal
figure. Table 6-4 indicates the codes and general definitions. Each code
should be interpreted by reviewing the detailed error status codes.
Global Error Status
6-6
Model 5030 SHARP Monitor Instruction Manual
Thermo Fisher Scientific
Troubleshooting
Status Messages
Table 6-4. Global Error Status
Code
Global Error Status Definition
Field
01
Sum status of the data and program memory
A
02
Sum status of sampling and measuring system
B
04
Sum status of pressure sensors
C
08
Sum status of air flow regulation
D
10
Sum status of the sample heater
E
20
Sum status of temperature measurement
F
40
Sum status of the Nephelometer measurement
G
80
Not used
H
The following break down of the Global Error Status Definitions to a
Detailed Error Status can be obtained by pressing the DISP key once and
the NEXT key four times from the Main Menu.
Thermo Fisher Scientific
Model 5030 SHARP Monitor Instruction Manual
6-7
Troubleshooting
Status Messages
Detailed Error Status
0000 0000 0000 0000
A Sum status of the data and program memory (memory error) (Table 6-5).
Table 6-5. Data and Program Memory
Code
Definition
01
FLASH-EEPROM Error
02
RAM error
04
Save RAM error (backup battery exhausted)
08
EEPROM write/read error
10
free
20
free
40
free
80
free
0000 0000 0000
B Sum status of the sampling and measuring system (Table 6-6).
Table 6-6. Sampling and Measuring System
6-8
Code
Definition
01
detector error < 1000 1/s …> 500000 1/s
02
automatic HV adjustment not possible (<1200V … > 1500V)
04
mass compensation > ±10%
08
pump off protection (do not block the air intake!)
10
lift sensor: “open” position not noticed
20
filter break
40
Plateau Flag (Counter ≥ 10)
80
pump was switched off when nominal air flow could not be reached
Model 5030 SHARP Monitor Instruction Manual
Thermo Fisher Scientific
Troubleshooting
Status Messages
0000 0000 0000 0000
C Sum status of the pressure sensors (Table 6-7).
Table 6-7. Pressure Sensors
Code
Definition
01
differential pressure sensor P1: over range
02
low pressure sensor P2: over range
04
barometric pressure sensor P3: over range
10
P2 < 10 hPa
20
difference pressure P1 < 1hPa
0000 0000 0000 0000
D Sum status of the air flow regulation: (Table 6-8).
Table 6-8. Air Flow Regulation
Code
Definition
01
regulation deviation > 5 %
0000 0000 0000 0000
E Sum status of the sample heater (Table 6-9).
Table 6-9. Sample Heater
Thermo Fisher Scientific
Code
Definition
01
T4 exceeds max-heater temp > 2 °C
02
RH Sensor Over Range
Model 5030 SHARP Monitor Instruction Manual
6-9
Troubleshooting
Status Messages
0000 0000 0000 0000
F Sum status of the temperature measurement (Table 6-10).
Table 6-10. Temperature Measurement
Code
Definition
01
temperature T1 over range
02
temperature T2 over range
04
temperature T3 over range
08
temperature T4 over range
0000 0000 0000 0000
G Sum status of nephelometer measurement (Table 6-11).
Table 6-11. Nephelometer Measurement
Overlay of Several Status
Messages
Code
Definition
01
nephelometer output over range
The error codes of the detailed error status messages are added and thus
form the detailed error status and the global error (failure) status
(Table 6-12).
Table 6-12. Detailed Error Status and Global Error Status
Error Status
Description
01: 0000 0000 0000 0004
SaveRAM error (backup battery empty)
02: 0000 0000 0000 3000
Lifting position: opening of the filter tape gap has not
been recognized
Filter tape fissure: no filter tape transport has been
recognized
04: 0000 0000 0001 0000
6-10
Model 5030 SHARP Monitor Instruction Manual
Differential pressure sensor
Thermo Fisher Scientific
Troubleshooting
Status Output by Potential Free Relay Contacts
Status Output by
Potential Free Relay
Contacts
If the respective status code is not set, the relay circuit will be closed.
If the respective status code is set, the relay circuit will be open.
Each relay has one potential free change contact.
The self-surveillance routine of the Model 5030 SHARP is executed every
second and the relays are set or reset according to the actual status.
Status Reports of the standard relays on the main board include:
Relay 0: signals the “Operation Status”
Relay 1: Nephelometer Auto Ranging
Relay 2: signals the “Error (Break-Down) Status”
Output by Serial
Interfaces (COM1 and
COM2)
Remote Control Commands
After receiving the read command (for example, # <CR>) the device
returns:
Data Protocol with Network Connection
Command: <STX> DA address <ETX> <BCC1> <BCC2>
Device returns: <STX> MD 01 address meas.value status SFKT <ETX>
<BCC1> <BCC2>
Refer to “Appendix B” for a detailed description of the code words alone.
Thermo Fisher Scientific
Model 5030 SHARP Monitor Instruction Manual
6-11
Troubleshooting
Print Formats
“status” has 4 figures:
2 figures “Operation Status”
2 figures “Global Error (Break-Down) Status”
(“Warning and Limit Status” is not included!)
By Gesytec Protocol Status Version “compatible to FH62I-N”:
Operation Status: data bit D1:
“off-line, keyboard enabled”
data bit D2: “filter change”
Global Error (Break-Down) Status:
data bit D0: “air flow rate error”
data bit D1: “filter tape break or filter tape end”
data bit D2: “offset > ± 100%”
data bit D3: “mass buffer is not filled”
Print Formats
In some print formats (for example, no. 1, , no. 30) the instrument status is
provided in addition to the measured value. For example: the device status
in the format “02 00 CA” is given out.
The first two figures represent the “Global Error Status,” the two in the
middle represent the “Warning and Limit Statesman the last two represent
the “Operation-Status.”
Example: Print format 3:
03-11-16
6-12
Model 5030 SHARP Monitor Instruction Manual
14:48:18
0200CA 10.3
129.7
1000.7
Thermo Fisher Scientific
Troubleshooting
Print Formats
Status Concepts for
Quality-Assured
Measurement
Status Changes and Entries into the Logbook
When the device status changes, the new device status is copied into the
logbook together with date, time, concentration, mass, air flow rate,
temperatures (T1, T2, T4), RH pressures (P2, P3), and Count Rates (Rβ,
Rα,).
The logbook contains the 20 latest entries (standard). With the option “512
Kbyte RAM-expansion” it has 1632 entries.
Example: (print format no. 11 or no. 19)
Status Definition of the Half-Hour Mean Values of the Concentration
The code[Number]s of all status, occurring during the half-hour, are added
and thus form the status of the half-hour mean values.
This procedure prevents the loss of status information, even when a special
status vanishes again during the half-hour. Multiple occurrence of the same
status in a half hour is not recorded.
Example:
Thermo Fisher Scientific
TIME
STATUS
COMMENTARY
13.45
00 00 00
normal operation
14.05
00 08 00
relative humidity elevated
14:13
00 00 00
normal operation
14:35
00 00 40
Nephelometer calibration
stabilizing
14:49
00 00 00
normal operation
14:55
00 00 10
keypad enabled
15:10
00 00 00
normal operation
Model 5030 SHARP Monitor Instruction Manual
6-13
Troubleshooting
Print Formats
Status of the half-hour mean value
14.00 - 14.30 : 00 08 00
14.30 - 15.00 : 00 00 50
File of Mean Values of the Dust Concentration
The mean value file contains a user-selectable 1/2-hour or one-hour
concentration:
date, time, status, 1/2h-mean concentration value, and 1/2h mean C14
concentration
It contains the 60 latest values (standard). With the option “512 Kbyte
RAM-expansion” it is extended to 18560 entries (more than one year). The
entry happens at every finished half hour.
6-14
Model 5030 SHARP Monitor Instruction Manual
Thermo Fisher Scientific
Chapter 7
Servicing
This chapter describes how to update the software and replace the Model
5030 SHARP filter tape and carbon vanes of the vacuum pump.
For fault location refer to the “Preventive Maintenance” and
“Troubleshooting” chapters. For additional service assistance, see “Service
Locations” at the end of this chapter.
Safety Precautions
Read the safety precautions before beginning any procedures in this chapter.
WARNING The service procedures in this manual are restricted to qualified
service representatives. If the equipment is operated in a manner not specified by the manufacturer,
the protection provided by the equipment may be impaired. The Thermo Scientific Model 5030 SHARP contains a small 14C (Carbon
14) beta radiation emitting source. Source activity is <100 μCi (micro
curries) which is below the exempt concentration limit defined in 10 CFR,
Section 30.70 - Schedule A. The person with responsibility for the Model
5030 SHARP can return the device to Thermo Fisher Scientific for
recycling the 14C source.
Neither the 14C source nor the detector are field serviceable. The Model
5030 SHARP must be returned to the factory for servicing or it can be
serviced by an authorized Thermo Fisher Scientific field service technician.
CAUTION Carefully observe the instructions in each procedure. Thermo Fisher Scientific
Model 5030 SHARP Monitor Instruction Manual
7-1
Servicing
Filter Tape Replacement
Equipment Damage Some internal components can be damaged by small
amounts of static electricity. A properly grounded antistatic wrist strap must
be worn while handling any internal component. If an antistatic wrist strap
is not available, be sure to touch a grounded metal object before touching
any internal components. When the instrument is unplugged, the chassis is
not at earth ground. Handle all printed circuit boards by the edges. Filter Tape
Replacement
As soon as the filter tape on the filter roll is empty, a replacement of the roll
is necessary.
The filter tape is usually replaced every year, but this can also depend on the
non-standard operational parameters chosen by the user or the loading per
filter spot. In high concentration areas, more frequent filter changes can
occur due to higher loading. As a basis for an estimation of this time, the
reference can serve that ~40 m of tape per roll is sufficient for approximately
800-900 single measurements. Due to the uncertainty of filter tape life in
higher concentration areas, checking the filter tape every 6-9 months may be
warranted.
To change the filter tape, follow the instructions in the “Installation”
chapter.
Carbon Vane
Replacement
Vane replacement must be done outdoors. Failure to do so may introduce
carbon particles into the air and damage electronic equipment. Before
servicing, the vacuum pump must be switched off and secured from any
accidental start-up.
In order to replace the vanes, the silencer housing, the silencer diaphragm,
the distance ring, and the cylinder cover must be removed (see Figure 7-1).
Nephelometer and
Beta Attenuation
Servicing
7-2
Servicing of the Nephelometer and Beta Attenuation Chambers should be
performed by a trained technician. A technical bulletin is available via the
internet at http://www.thermo.com/air.
Model 5030 SHARP Monitor Instruction Manual
Thermo Fisher Scientific
Servicing
Nephelometer and Beta Attenuation Servicing
Silencer Diaphragm
Silencer
Cylinder Cover
Distance Ring
Figure 7-1. Pump Parts Location
Use an air hose to blow carbon particulate from the vane cavity.
WARNING Avoid inhaling carbon particulate. Use an approved particle
filter or respirator.
When installing new vanes, be sure the beveled side points outwards (see
Figure 7-2). Reassemble the parts in the reverse order.
Figure 7-2. Carbon Vane Installation
Thermo Fisher Scientific
Model 5030 SHARP Monitor Instruction Manual
7-3
Servicing
Nephelometer and Beta Attenuation Servicing
Firmware Update
Firmware for the Model 5030 SHARP can be updated by exchanging its
FLASH-EEPROM. However, it is more easily accomplished through the
transmission of a new program code via the COM1 serial interface. During
transmission the program is saved in RAM. After the transmission has been
completed without corruption, the program code is written into the Flash EEPROM.
A download of the Parameter List (Print Format 8) should be done prior to
any firmware updates. Refer to “Print Formats” in the “Operation” chapter.
Use the following requirements and steps to update to a new firmware
version.
Requirements:
•
PC with Windows 98 or higher with COM1 serial interface (9 pin)
•
Model 5030 SHARP with jumpered X30/Pin 1-2 (insert: longest
distance from the Flash - EEPROM)
•
Communications Cable with the configuration shown in Figure 7-3.
This cable connects the PC 9-pin COM1 port to the Model 5030
SHARP 25-pin COM1 port.
Comm unications Cable W iring Diagram
2
3
5
6
7
4
8
2
3
7
Female 9-pin
Cable Connector
M ale 25-Pin
Cable Connector
Connects to:
Connects to:
M ale 9-Pin
PC COM 1 Connector
Fem ale 25-Pin
M odel 5030 COM 1 Connector
Figure 7-3. Communications Cable Wiring Diagram and Serial Connection
7-4
Model 5030 SHARP Monitor Instruction Manual
Thermo Fisher Scientific
Servicing
Nephelometer and Beta Attenuation Servicing
Software Requirements
Firmware Update
Procedure
•
Software “winupdate.exe” for the PC (supplied by Thermo Fisher
Scientific)
•
Firmware file vx-xxx.hex or MASTER.hex for the instrument
Use the following procedure to update the Model 5030 SHARP firmware.
1. Connect COM1 of the PC to COM1 of Model 5030 and switch on
both instruments.
2. Unlock the keypad in the Operations menu and configure the Model
5030 to:
•
Print cycle: 0 min 0 sec
•
Baud rate: 9600 baud
3. Lock the keypad, returning to the remote control mode.
4. Start “winupdate” on the PC.
Note You can check and validate the SHARP firmware version before and
after upload by clicking on the Start button in the Version Query section. Thermo Fisher Scientific
Model 5030 SHARP Monitor Instruction Manual
7-5
Servicing
Nephelometer and Beta Attenuation Servicing
5. Select Device type for 5030 SHARP.
6. Click on the Select source file button to choose the software file you
want to load into the dust monitor.
7-6
Model 5030 SHARP Monitor Instruction Manual
Thermo Fisher Scientific
Servicing
Nephelometer and Beta Attenuation Servicing
7. Click on the Program button.
Thermo Fisher Scientific
Model 5030 SHARP Monitor Instruction Manual
7-7
Servicing
Nephelometer and Beta Attenuation Servicing
The first screen that appears on the SHARP instrument indicates the
address of the data bytes being received. This screen is shown below. The
transfer takes approximately three to five minutes.
RECEIVING FLASH DATA
-----------------------------------2C80
Data Byte Address Screen
After a successful firmware upload the Flash - EEPROM is programmed.
The following screen is displayed.
PROGRAMMING FLASHMEM
-----------------------------------FFC0
Programming Flash Memory Screen
After successfully uploading the new firmware to the Model 5030 SHARP,
the instrument will automatically restart with the new firmware version. You
can now close the WinUpdate program.
The initial screen shown at startup appears for approximately 30 seconds.
This screen contains the firmware version. The version (for example, v 1.02)
should be checked to make sure that it corresponds to the new version.
(This can also be done with “winupdate” by clicking on the Version Query
START button.)
If the firmware upload was faulty or the programming of the Flash EEPROM did not work correctly, the instrument starts with the old
firmware version.
Note The parameters of the Model 5030 SHARP are not changed when the
firmware is updated. As a precaution, however, the parameters should be
compared with the values that existed before the update was made. This can
be done by using Print Format 8 before and after the update. 7-8
Model 5030 SHARP Monitor Instruction Manual
Thermo Fisher Scientific
Servicing
Service Locations
Service Locations
For additional assistance, service is available from exclusive distributors
worldwide. Contact one of the phone numbers below for product support
and technical information or visit us on the web at www.thermo.com/aqi.
1-866-282-0430 Toll Free
1-508-520-0430 International
Thermo Fisher Scientific
Model 5030 SHARP Monitor Instruction Manual
7-9
Servicing
Service Locations
7-10
Model 5030 SHARP Monitor Instruction Manual
Thermo Fisher Scientific
Chapter 8
Optional Equipment
This chapter describes the Model 5030 optional equipment. Refer to
Table 8-1 for a list of the optional equipment part numbers.
The Model 5030 SHARP comes as a standalone unit with an external
vacuum pump and it can store a year’s worth of data.
Inlet Assemblies
The Model 5030 can be used for different applications. Using different inlet
configurations (PM10, PM2.5, PM1 Inlets) or enrichment techniques
(PM10-2.5), several particle size fractions can be monitored. The main
application is the measurement of PM10 and PM2.5 for ambient air quality
monitoring and health effect studies.
Sampling Tube
Extensions
Often the most compatible way to install the Model 5030 at air quality
monitoring sites is to collocate the inlet at the same height as other
similar-use inlets. The “Installation” chapter discusses specific siting criteria.
In addition to using the above referenced inlets, extending the sample
downtube length is necessary using a rigid sample tube.
Note Extended lengths of flexible tubing can lead to particle loss and are
strongly discouraged. Weather Enclosure
Rack Mounting
Accessories
If a climate-controlled shelter is not available for siting the Model 5030, a
weather-proof enclosure is available. Please inquire with your Thermo Fisher
Scientific representative.
Use Thermo Fisher Scientific part number FH132 Sliding Rail Hardware
for mounting the Model 5030 within a standard 19-inch rack.
Table 8-1. Optional Equipment Parts List
Thermo Fisher Scientific
Option
Part No.
Description
Inlet Assembly
57-000596
10-Micron Inlet (U.S. EPA PM10 Inlet as per 40 CFR at
16.67 l/min)
57-005896
2.5-Micron Sharp-Cut Cyclone (SCC) at 16.67 l/min)
Model 5030 SHARP Monitor Instruction Manual
8-1
Optional Equipment
Rack Mounting Accessories
Table 8-1. Optional Equipment Parts List, continued
Option
Sampling Tube
Extensions
Part No.
Description
57-008740
2.5-Micron Very Sharp-Cut Cyclone (VSCC) at 16.67
l/min)
10-007742
1.0-Micron Sharp-Cut Cyclone at 16.67 l/min)
4254521-3m
9.75-foot (3 m) Heated Sampling Tube
4254521-1m
1 meter Heated Sampling Tube
FH107
Roof Mounting Flange for Sampling Tube
(For 40mm tubes, DDF40)
Weather
Enclosure
SM149248350
Protective Housing for Ambient Temperature Sensor
Rack Mounting
Accessories
425451065
Telescope Plate
KT149140871
Telescope Mount Bars, 1 pair, for 19-inch Rack
Mounting
425451029
Printed Circuit Board(s) Potential-Free Separation
425451026
Bit I/O Expansion Board
Analog
Extension
8-2
Model 5030 SHARP Monitor Instruction Manual
Thermo Fisher Scientific
Appendix A
Warranty
Seller warrants that the Products will operate or perform substantially in
conformance with Seller's published specifications and be free from defects
in material and workmanship, when subjected to normal, proper and
intended usage by properly trained personnel, for the period of time set
forth in the product documentation, published specifications or package
inserts. If a period of time is not specified in Seller’s product
documentation, published specifications or package inserts, the warranty
period shall be one (1) year from the date of shipment to Buyer for
equipment and ninety (90) days for all other products (the "Warranty
Period"). Seller agrees during the Warranty Period, to repair or replace, at
Seller's option, defective Products so as to cause the same to operate in
substantial conformance with said published specifications; provided that
(a) Buyer shall promptly notify Seller in writing upon the discovery of any
defect, which notice shall include the product model and serial number (if
applicable) and details of the warranty claim; (b) after Seller’s review, Seller
will provide Buyer with service data and/or a Return Material
Authorization (“RMA”), which may include biohazard decontamination
procedures and other product-specific handling instructions; and (c) then,
if applicable, Buyer may return the defective Products to Seller with all
costs prepaid by Buyer. Replacement parts may be new or refurbished, at
the election of Seller. All replaced parts shall become the property of Seller.
Shipment to Buyer of repaired or replacement Products shall be made in
accordance with the Delivery provisions of the Seller’s Terms and
Conditions of Sale. Consumables, including but not limited to lamps,
fuses, batteries, bulbs and other such expendable items, are expressly
excluded from the warranty under this warranty.
Notwithstanding the foregoing, Products supplied by Seller that are
obtained by Seller from an original manufacturer or third party supplier are
not warranted by Seller, but Seller agrees to assign to Buyer any warranty
rights in such Product that Seller may have from the original manufacturer
or third party supplier, to the extent such assignment is allowed by such
original manufacturer or third party supplier.
In no event shall Seller have any obligation to make repairs, replacements
or corrections required, in whole or in part, as the result of (i) normal wear
and tear, (ii) accident, disaster or event of force majeure, (iii) misuse, fault
or negligence of or by Buyer, (iv) use of the Products in a manner for which
Thermo Fisher Scientific
Model 5030 SHARP Monitor Instruction Manual
A-1
they were not designed, (v) causes external to the Products such as, but not
limited to, power failure or electrical power surges, (vi) improper storage
and handling of the Products or (vii) use of the Products in combination
with equipment or software not supplied by Seller. If Seller determines
that Products for which Buyer has requested warranty services are not
covered by the warranty hereunder, Buyer shall pay or reimburse Seller for
all costs of investigating and responding to such request at Seller's then
prevailing time and materials rates. If Seller provides repair services or
replacement parts that are not covered by the warranty provided in this
warranty, Buyer shall pay Seller therefor at Seller's then prevailing time and
materials rates. ANY INSTALLATION, MAINTENANCE, REPAIR,
SERVICE, RELOCATION OR ALTERATION TO OR OF, OR
OTHER TAMPERING WITH, THE PRODUCTS PERFORMED BY
ANY PERSON OR ENTITY OTHER THAN SELLER WITHOUT
SELLER'S PRIOR WRITTEN APPROVAL, OR ANY USE OF
REPLACEMENT PARTS NOT SUPPLIED BY SELLER, SHALL
IMMEDIATELY VOID AND CANCEL ALL WARRANTIES WITH
RESPECT TO THE AFFECTED PRODUCTS.
THE OBLIGATIONS CREATED BY THIS WARRANTY
STATEMENT TO REPAIR OR REPLACE A DEFECTIVE PRODUCT
SHALL BE THE SOLE REMEDY OF BUYER IN THE EVENT OF A
DEFECTIVE PRODUCT. EXCEPT AS EXPRESSLY PROVIDED IN
THIS WARRANTY STATEMENT, SELLER DISCLAIMS ALL
OTHER WARRANTIES, WHETHER EXPRESS OR IMPLIED, ORAL
OR WRITTEN, WITH RESPECT TO THE PRODUCTS,
INCLUDING WITHOUT LIMITATION ALL IMPLIED
WARRANTIES OF MERCHANTABILITY OR FITNESS FOR ANY
PARTICULAR PURPOSE. SELLER DOES NOT WARRANT THAT
THE PRODUCTS ARE ERROR-FREE OR WILL ACCOMPLISH
ANY PARTICULAR RESULT.
A-2
Model 5030 SHARP Monitor Instruction Manual
Thermo Fisher Scientific
RS-232 Commands
Appendix B
The RS-232 interface enables the Model 5030 to be remotely controlled by
a host RS-232 device such as a PC, PLC, and data logger.
Connections
The two female connectors labeled “COM1” and “COM2” on the rear
panel are 25-pin and 9-pin, respectively. Either connector can be connected
to the remote device. The remaining connector can be used to connect a
second serial output.
Remote Control
The transmission of all data takes place via the following settings:
Bits per Second
9600, 4800, 2400, 1200, 600 or 300
Data Bits
7
Parity
Even
Stop Bits
2
Flow Control
As a rule, a remote command always consists of a character or special
character and, if necessary, is followed by numbers. A stop code forms the
end of a command.
The stop code is either <CR> (carriage return) or <LF> (line feed).
However, it is also permitted to send several stop codes. Besides the
characters <CR> and <LF> also the character 7Fhex, or respectively FFhex
can be used as stop code.
The Model 5030 is provided with a receive buffer of 256 characters.
Consequently, several commands can be received immediately one after the
other. For example; a complete set of parameters (approximately 20
commands) can be sent to the Model 5030 as one contiguous string of
commands.
The entire systems structure allows for operating several measuring
instruments being connected to a common bus line (RS485). This way, all
commands can be received from all devices. In the event a command is to be
executed by one precisely defined device, then the respective device address
has to precede the command character when sending.
Thermo Fisher Scientific
Model 5030 SHARP Monitor Instruction Manual
B-1
RS-232 Commands
Remote Control Commands
A device address is a number followed by a colon. Consequently, a
command usually looks like the following:
[Address][:]Command code number stop code
The information in brackets is optional.
As far as the execution of the command is concerned, it makes no difference
whether a command is entered via the keyboard or via the serial interface.
In case the system detects unreasonable parameters when receiving a
command (such as, parameters that are no longer within the admissible
range), the respective command will not be executed and the error counter
will increment by 1.
The MODEL 5030 monitor incorporates two serial interfaces which can be
operated simultaneously:
•
COM1
•
COM2
COM1 is connected to a 25-pin D-sub plug connector.
Note COM1 is the only interface used for software updates. COM2 is wired to a 9-pin D-sub plug connector and can be connected to
the interface of a computer using a 1:1 cable.
The command codes are split into 3 groups: READ-, WRITE- and
CONTROL-commands and are listed in alphabetical order. The word
“number” found in a command always stands for the entry as a maximum
7-digit integer number, unsigned. Leading space characters are permitted.
Data sent by the monitoring device MODEL 5030 always end with
<CR><LF>. The guaranteed response time to a remote control command
amounts to one second.
Unless stated otherwise, numbers usually consist of 6 characters,
representing a maximum 5-digit integer number, ranging from -9999 to
99999 having at least one leading space character.
Remote Control
Commands
B-2
Remote control commands include read commands, write commands, and
control commands.
Model 5030 SHARP Monitor Instruction Manual
Thermo Fisher Scientific
RS-232 Commands
Remote Control Commands
Read Commands
Thermo Fisher Scientific
C
Output of the dust mass concentration in μg/m³ (actual mode)
C1
Output of the β-concentration
C2
Output of the optic concentration
H
Output of the last half hour average in μg/m³
HH
Output of the 1h filtered concentration
H1
1 h average concentration [μg/m³]
H3
3 h average concentration [μg/m³]
HT
24 h (daily) average concentration [μg/m³]
JB
T1, temperature sampling head
JC
T2, temperature dust sampling chamber
JD
T3, temperature inside of the flow meter orifice
JE
T4, temperature external heated sampling tube (at tube surface) all
temperature in °C
JF
P1, differential pressure of the air flow measuring module in Pa
JG
P2, low pressure suction chamber
JH
P3, Barometer in hPa
JI
air flow sampling head (operating flow)
JJ
norm air flow (273K, 1013hPa)
JO
air flow rate regulation 0...100%
JQ
power of external heating 0...100%
JR
relative humidity value (%RH)
m1
non filtered mass in μg
m2
mass on LCD with RC-filter (μg)
m3
mass, filtered with Quick-Lock filter
Model 5030 SHARP Monitor Instruction Manual
B-3
RS-232 Commands
Remote Control Commands
m4
mass filtered with RC-filter for 1 hour (μg)
m7
density compensation factor
N
read error transmission counter
If at the receiving of data an error has appeared,
- parity error
- invalid parameters
an error counter is incremented.
Through the reading the counter is set on zero.
t
Output of the board type
UA
beta count rate Rβ [1/s]
UB
zero count rate Rβø [1/s]
UC
alpha count rate Rα [1/s]
UD
zero count rate Rαø [1/s]
UP
natural alpha activity on the filter [Bq]
UQ
Radon –EEC activity concentration [Bq/m³]
US
adjustment-factor for the optic
UT
low pass filtered β-concentration
UU
low pass filtered optics-concentration
v
Instrument model and software version[Number] are given out.
Z
read date/time of day
answer: jj-mm-tt hh:mm:ss
ZZ
read date/time
Answer: jjmmddhhmmss
B-4
Model 5030 SHARP Monitor Instruction Manual
Thermo Fisher Scientific
RS-232 Commands
Remote Control Commands
?
#
read device address
output device status
The complete error -, warning -, and operating status is given out as
a string of 22 characters. Each character represents 4 status bits with
hexadecimal display. The first 16 characters show the detailed error
status, the last 6 characters the global error -, warning -/alarm – and
operating status.
Thermo Fisher Scientific
Model 5030 SHARP Monitor Instruction Manual
B-5
RS-232 Commands
Remote Control Commands
Write Commands
dA[number]
set serial[Number]
0..999
d1
print format COM 1
0...255
d2
print cycle in minutes
0...30000
d3
print cycle in seconds
0...120
d4
Baud rate COM 1 and COM 2
d7
device adress
0...255
d8
print format COM 2
0...255
D[number]
set print format e.g., D8 print format
no. 8,
K4[number]
concentration factor
50...200 %
KB[number]
filter change dust load in μg
0...9999
KD[number]
filter change cycle in hours
0, 3...100
KE[number]
filter change time of day (full hours)
0...24
0: no filter change
KG[number]
external heating on: 1
external heating off: 0
KH[number]
set point air flow regulation in l/h
0...3500
KK[number]
mass calibration factor
0...50000
KL[number]
Beta temperature compensation
factor
(factory)
KM[number]
choosing which averages are saved
½ hour averages: 0
1 hour averages: 1
KN[number]
concentration according
operating volume: 0
norm volume: 1
B-6
KQ[number]
Establishes the Range 1 Optical
Offset
KR[number]
Establishes the Range 2 Optical
Offset
KS[number]
Establishes the Range 1 Optical
Calibration
KT[number]
Nephelometer temperature
compensation factor
KU[number]
Establishes the RH Target Value
Model 5030 SHARP Monitor Instruction Manual
(factory)
Thermo Fisher Scientific
RS-232 Commands
Remote Control Commands
KV[number]
Establishes the maximum heater
setting
KW[number]
Establishes the minimum heater
power (0-20%)
KY[number]
channel for the analog output
(0 .. 12)
K%
Norm – Temperature
0…99 °C
K?
Flag for language selection
(0=German, 1=English, 2=French,
Italian, or spanish)
K+
Sample vacuum compensation
factor
(factory)
K*
Barometric Pressure compensation
factor
(factory)
K#
Calibration factor of the air flow
rate
Y$
write parameters to EEPROM
Z[YYMMDDhhmmss]
set date and time
Control Commands
A
pump off
E
pump on
F
filter change
P
Data output according to the selected print format is triggered.
R
Reset., This command has the same effect reconnecting the supply voltage.
Y
load parameter set from EEPROM
y<
load PARAMETER file (print format 47)
y>
write PARAMETER file (print format 47)
o0
offline
o1
online
Output commands for file output:
Thermo Fisher Scientific
/A
Auto stop ON; single line output
/O
Auto stop OFF
/S
Stop
/C
Continue
/T
Terminate
Model 5030 SHARP Monitor Instruction Manual
B-7
RS-232 Commands
Data Protocols with Measuring Network Connection
u0
reference count rate on
u1
alpha count rate on
ua[Number]
high voltage
range: 0....1600V
ud[Number]
reference threshold range
range: 0....5000 mV
b [Number]
Setting the number of days backwards from the current date for
terminating the file output.
Range: 0...1000 days; 0 will produce the complete file.
Data Protocols with
Measuring Network
Connection
Once the character <STX> (usually: Ctrl-B) has been received, the
monitoring instrument MODEL 5030 starts processing the data received at
the serial line according to the protocol that has been agreed upon for
devices operating in a measuring network.
To prevent the measuring instrument from executing data outputs on its
own, we strongly recommend setting the print format to 0.
This is the basic structure of a data protocol:
<STX>[Text]<ETX><BCC1><BCC2>
Instead of <ETX><BCC1><BCC2> it is also possible to send <CR>. In
doing so, the block check will be disabled.
The response of the measuring device will be terminated by <CR><LF>, if
the control or inquiry command had an <CR> at the end. If the command
is terminated with <ETX> (usually: Ctrl-C) and block check, the response
of the measuring instrument will be also terminated with <ETX> and
<BCC1><BCC2>.
Data Sampling
Upon request, the measuring instrument sends a measuring data protocol.
Transmission of the measuring data is released by the following sequence of
characters:
<STX>DA[Address]<ETX><BCC1><BCC2>
where Address: Device address, 3 characters, leading zeros can be replaced
by <SP>. It is also possible that the address can be completely dropped. The
address at the measuring instrument is set by using the keyboard. (Menu
OPERATION: Device address).
B-8
Model 5030 SHARP Monitor Instruction Manual
Thermo Fisher Scientific
RS-232 Commands
Data Protocols with Measuring Network Connection
Sampling is valid and response will be given, if:
•
the <STX> is followed by the characters DA,
•
the address is correct or not existing,
•
the <ETX> is followed by two correct BCC-characters
•
or <ETX><BCC1><BCC2> is replaced by <CR>.
The following is an example for a valid inquiry at the device having the
address 5:
<STX>DA<CR>
<STX>DA005<CR>
<STX>DA<SP><SP>5<ETX><BCC1><BCC2>
<STX>DA<ETX>04
Data Transmission
The data inquiry may comprise up to seven variables. As a consequence, the
response then contains the respective number of blocks, each block
beginning with the address and ending with [SFKT]. With each block, the
address will be incremented by 1.
The transmission of measured data is effected as response to the data
inquiry/data sampling (1). The format will be as follows (here in this case
with 2 variables):
<STX>MD0[n]<SP>
[Address]<SP>[measured value 1]<SP>[Status]<SP>[Serial
no.]<SP>[SFKT]<SP>
[Address+1]<SP>[Measured value 2]<SP>[Status]<SP>[Serial
no.]<SP>[SFKT]<SP>
<ETX><BCC1><BCC2>
Thermo Fisher Scientific
[n]:
Number of variables
[Address]:
Device address set, 3 characters, leading zeros are transmitted
<SP>:
Space character
Model 5030 SHARP Monitor Instruction Manual
B-9
RS-232 Commands
Data Protocols with Measuring Network Connection
[Measured value]:
Indicated in μg/m3, exponential representation with 4 characters
mantissa and 2 characters exponent, each one with sign.
Mantissa: sign followed by 4 numerical characters. The decimal
point is located after the first two decimal characters and is not
transmitted. Exponent: sign followed by 2 numerical characters,
leading zeros are included in the transmission.
[Status]:
4 characters, operational and error status byte, each one being
represented by two characters, formed like the BCC: operating
status <SP> error status
[Serial no.]:
Number of manufacture to guarantee unique device identification
[SFKT]:
Special function, not used, six times the numerical character 0.
Note In the previous example, the indication is only in μg/m³ if the
transmitted variable is the Concentration. The user may select other
variables for transmission through the Geystec Protocol menu. The variables
which can be selected are:
Conc, Mass, Q-OP, Q-N, T1, T2, T4, RH, P1, P2, and P3
Significance of the operating status bits:
1. Standard: Operating and error status as described in the
“Troubleshooting” chapter.
2. Compatible with FH 62 I-N:
02 : Keyboard active
04 : Filter change
Significance of the error status bits:
01 : Air flow disturbed
02 : Breach or end of the filter tape
04 : Detector error
08: Heater error
10: Any error occurred
<ETX>[BCC1][BCC2] is replaced by <CR><LF>, if the data inquiry has
been terminated by <CR>.
B-10
Model 5030 SHARP Monitor Instruction Manual
Thermo Fisher Scientific
RS-232 Commands
Data Protocols with Measuring Network Connection
Example: GEI (Bavaria/Hessia) protocol including the transmission of the
number of black carbon and the concentration of black carbon:
Inquiry:
<STX>DA<CR>
Response: <STX>MD03
001
+2578
+03 00 00
023
000000<SP>
↑
↑
↑
Address
Conc
Serial Number
002 +5681+00 00 00 023 000000<SP>
003 +1001+03 00 00 023 000000<CR>
Remote Control
The measuring instrument is controlled by the following protocol:
<STX>ST[Address]<SP>[Command]<ETX>[BCC1][BCC2]
Address: Device address, 3 characters, leading zeros may be replaced by
<SP>.
The address may be also dropped. In this case, the first command character
directly must follow the characters ST.
Command: All commands listed in this appendix are admissible commands
to be applied. The response coming from the device, however, is sent
without protocol. For this reason, no read commands should be used.
In case that the control command is accepted by the measuring instrument
(the characters ST follow the <STX>, correct address, correct block check),
then the command will be executed.
It is allowed to replace <ETX>[BCC1][BCC2] by <CR>.
Thermo Fisher Scientific
Model 5030 SHARP Monitor Instruction Manual
B-11
RS-232 Commands
Data Protocols with Measuring Network Connection
How to form the block check character (BCC1, BCC2):
The BCCs are formed by simply building the exclusive OR operation
byte-by-byte over all characters transmitted (incl. <STX>, <ETX>) (based
on 00hex). The bit that results is sent as hexadecimal number with two
ASCII characters.
Example:
BCC binary: 01011010
Is transmitted by the ASCII characters: 5A
B-12
Model 5030 SHARP Monitor Instruction Manual
Thermo Fisher Scientific
APPENDIX C
CONNECTOR AND
BOARD SCHEMATICS
Female connector standard I/O
Female connector COM1
o
o
o
o
o
o
o
o
o
o
o
o
o
o
o
o
o
o
o
o
o
o
o
o
o
1
14
2
15
3
16
4
17
5
18
6
19
7
20
8
21
9
22
10
23
11
24
12
25
13
Shielding
TD
RD
RTS
CTS
o
o
o
o
o
o
o
o
1
6
2
7
3
8
4
9
5
o
o
o
o
o
o
o
o
o
o
o
GND
o
o
o
o
o
o
o
o
o
o
o
o
o
Female connector COM2
o
o
-12V
TD
CTS
RD
-12V
GND
1
Relay 0 Make contact
14 Relay 0 Break contact
2
Relay 0 Center contact
15 Relay 1 Make contact
3
Relay 1 Break contact
16 Relay 1 Center contact
4
Relay 2 Make contact
17 Relay 2 Break contact
5
Relay 2 Center contact
18
6
19
7
20
8
Input for Telemeter OK (Japan Vers.)
21 GND for Telemeter OK
(Japan Vers.)
9 Input for Telemeter reset (Japan Ver.)
22 GND for Telemeter reset (Japan Ver.)
10
23
11
24
12 +20 mA Concentration
25
13 -20 mA Concentration
Relay 0: Operating status
Relay 1: Limit value
Relay 2: Failure
Loading capacity of the contacts:
max 60V/ 0.5A
Rest: Relay picked-up
Analog outputs 0..10V:
Internal resistance : < 1 Ω
Maximum output current: 5 mA
Analog outputs 0..20mA:
Maximum load: 500 Ω
Thermo Fisher Scientific
Model 5030 SHARP Monitor Instruction Manual C-1
Female connector analog I/O
Female connector standard I/O extension
o
o
o
o
o
o
o
o
o
o
o
o
o
o
o
o
o
o
o
o
o
o
o
o
o
o
o
o
o
o
o
o
o
o
o
o
o
1
20
2
21
3
22
4
23
5
24
6
25
7
26
8
27
9
28
10
29
11
30
12
31
13
32
14
33
15
34
16
35
17
36
18
37
19
Relay
Relay
Relay
Relay
Relay
Relay
Relay
Relay
Relay
Relay
Relay
Relay
Relay
Relay
Relay
Relay
Relay
Relay
0
0
0
1
1
1
2
2
2
3
3
3
4
4
4
5
5
5
Make contact
Break contact
Center contact
Make contact
Break contact
Center contact
Make contact
Break contact
Center contact
Make contact
Break contact
Center contact
Make contact
Break contact
Center contact
Make contact
Break contact
Center contact
o
o
o
o
o
o
o
o
o
o
o
o
o
o
o
o
o
o
o
+IN
-IN
GND
+IN
-IN
GND
+IN
-IN
GND
+IN
-IN
GND
1
1
o
o
o
2
2
o
o
o
1
14
2
15
3
16
4
17
5
18
6
19
7
20
8
21
9
22
10
23
11
24
12
25
13
+15V
AIN1
-15V
EEPROM DO
AIN5
AIN6
AIN7
AIN8
EEPROM CS
GND
AIN2
GND
0..10V OUT C
AIN 3
SHIFT CLOCK (SK)
0..10V OUT A
AIN4
SER. OUT (DI)
0..10V OUT B
TRIM DAC LD
GND
0..10V OUT D
GND
GND
3
3
4
4
+20mA
+20mA
-20mA
-20mA
Female connector 4-20 mA
Mass
Concentration
Mass
Concentration
o
o
o
o
o
o
o
o
o
C-2 Model 5030 SHARP Monitor Instruction Manual
1
6
2
7
3
8
4
9
5
+20mA
-20mA
+20mA
-20mA
+20mA
-20mA
+20mA
-20mA
A
A
B
B
C
C
D
D
(Air flow rate)
(Air flow rate)
(Temp. PM10-head)
(Temp. PM10-head)
(Channel 5)
(Channel 5)
(Channel 6)
(Channel 6)
Thermo Fisher Scientific
Female connector PUMP
o
o
o
o
o
o
o
o
o
1
6
2
7
3
8
4
9
5
GND
+0..10V, Pump regulation
Female connector SENSORS
o
o
o
o
o
o
o
o
o
1
6
2
7
3
8
4
9
5
Sensor
Sensor
Sensor
Sensor
T1,
T1,
T4,
T4,
Outside temp.
Outside temp.
Heater temp.
Heater temp.
Plug PUMP
Switched voltage output maximum 3 A
Pin
Designation
No.
protective
conductor
3
switched
voltage
Pump
1
neutral
conductor
Plug HEATER
Switched voltage output maximum 3 A
Pin
Designation
No.
protective
conductor
2
switched
voltage
Heating
1
neutral
conductor
Thermo Fisher Scientific
Model 5030 SHARP Monitor Instruction Manual C-3
MAIN BOARD
ANALOG OUTPUTS
Standard Setting
Jumper
Connection
X10
Pin 3-4, 7-8
Pin 1-3, 7-8
X
X24
Pin 3-4, 7-8
Pin 1-3, 7-8
X
Jumper
X30
Flash-EEPROM programmable via serial interface COM 1 (Software Update)
Connection
Standard Setting
Function
Pin 1-2
X
Programming enabled
Pin 2-4
Programming disabled
Jumper
X31
Connection
Pin 1-2
Pin 2-4
Pin 1-3
Pin 2-4
X33
Jumper
X32
Connection
Pin 1-2Pin 2-3
Pin 1-2Pin 2-4
Jumper
X34
Connection
Pin 1-2
Pin 2-4
-
X35
Switch
S1/1
S1/1
S1/3
S1/3
on
off
on
off
Function
Concentration (rear side)
Current loop
0/4-20mA
Voltage output: 0/2-10V
Concentration (front side)
Current loop:
0/4-20mA
Voltage output: 0/2-10V
CPU active / disabled
Standard Setting
X
CPU active
CPU disabled
CPU disabled
X
CPU active
Battery for Save RAM Area
Standard Setting
X
Battery on
Battery off
C-4 Model 5030 SHARP Monitor Instruction Manual
off
on
off
on
Function
Others
Standard Setting
Function
X
GND on I/O-Bus Bit 7
+5V on I/O-Bus Bit 8
test pin for ADC
reference voltage
Standard etting
S1/2
S1/2
S1/4
S1/4
Function
X
FH 62-1
FH 62 I-R
Sensor Type
T2: KTY 10
T2: PT 100
T3: KTY 10
T3: PT 100
Thermo Fisher Scientific
Model 5030 Main Circuit Board
X10 Jumper Pins for
Concentration Analog Output
2
7
5
3
4
Programming
Jumper Lock
1
10
8
6
Program Chip
9
Pin No.
Display Connector
X11 Jumper
X24 Jumper
9
7
5
3
1
2
4
6
8
0-20 mA Concentration Analog
Output Jumper Configuration
10
mA Jumper Configuration
X25 Jumper
Thermo Fisher Scientific
9
7
4
3
1
Rear of
Instrument
2
6
Front of
Instrument
5
8
0-10 VDC Concentration Analog
Output Jumper Configuration
10
Volt Jumper Configuration
Model 5030 SHARP Monitor Instruction Manual
C-5