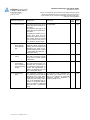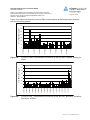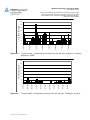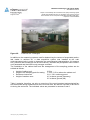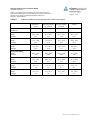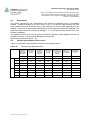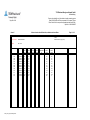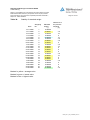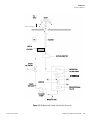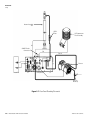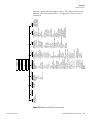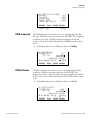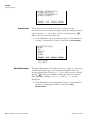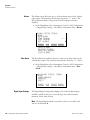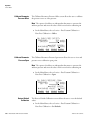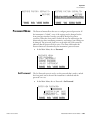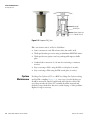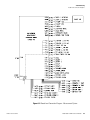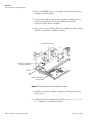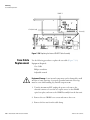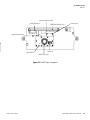
1
TÜV RHEINLAND ENERGIE UND UMWELT GMBH Report on the suitability test of the ambient air quality measuring system Model 5030i SHARP with PM2.5 pre-separator of the company Thermo Fisher Scientific for the component suspended particulate matter PM2.5 TÜV-Report: 936/21209885/F Cologne, 20 September 2013 www.umwelt-tuv.de [email protected] The department of Environmental Protection of TÜV Rheinland Energie und Umwelt GmbH is accredited for the following work areas: - Determination of air quality and emissions of air pollution and odour substances; Inspection of correct installation, function and calibration of continuously operating emission measuring instruments, including data evaluation and remote emission monitoring systems; Combustion chamber measurements; Performance testing of measuring systems for continuous monitoring of emissions and ambient air, and of electronic data evaluation and remote emission monitoring systems; Determination of stack height and air quality projections for hazardous and odour substances; Determination of noise and vibration emissions and pollution, determination of sound power levels and execution of sound measurements at wind energy plants according to EN ISO/IEC 17025. The accreditation is valid up to 22-01-2018. DAkkS-register number: D-PL-11120-02-00. Reproduction of extracts from this test report is subject to written consent. TÜV Rheinland Energie und Umwelt GmbH D - 51105 Cologne, Am Grauen Stein, Tel: +49 221 806-5200, Fax: +49 221 806-1349 740300_2013_936_21209885F_EN.docx TÜV Rheinland Energie und Umwelt GmbH Air Pollution Control Page 2 of 424 Report on the suitability test of the ambient air quality measuring system Model 5030i SHARP with PM2.5 pre-separator of the company Thermo Fisher Scientific for the component suspended particulate matter PM2.5, Report-No.: 936/21209885/F Acknowledgement TÜV Rheinland Energie und Umwelt GmbH would like to acknowledge the involvement of Bureau Veritas and the National Physical Laboratory as our UK partners in this project for their involvement in collecting the UK field data; project management; and data processing. 740300_2013_936_21209885F_EN.docx TÜV Rheinland Energie und Umwelt GmbH Air Pollution Control Report on the suitability test of the ambient air quality measuring system Model 5030i SHARP with PM2.5 pre-separator of the company Thermo Fisher Scientific for the component suspended particulate matter PM2.5, Report No.: 936/21209885/F Page 3 of 424 Report on the suitability test of the ambient air quality measuring system Model 5030i SHARP with PM2.5 pre-separator of the company Thermo Fisher Scientific for the component suspended particulate matter PM2.5 Instrument tested: Model 5030i SHARP with PM2.5 pre-separator Manufacturer: Thermo Fisher Scientific 27 Forge Parkway Franklin, Ma 02038 USA Test period: June 2009 to September 2013 Date of report: 20 September 2013 Report number: 936/21209885/F Editor: Dipl.-Ing. Karsten Pletscher Tel.: +49 221 806-2592 [email protected] Scope of report: 173 Pages Report: Annex Page 174 Manual Page 220 Manual Of Total 204 Pages 424 Pages 740300_2013_936_21209885F_EN.docx TÜV Rheinland Energie und Umwelt GmbH Air Pollution Control Page 4 of 424 Report on the suitability test of the ambient air quality measuring system Model 5030i SHARP with PM2.5 pre-separator of the company Thermo Fisher Scientific for the component suspended particulate matter PM2.5, Report-No.: 936/21209885/F Blank page 740300_2013_936_21209885F_EN.docx TÜV Rheinland Energie und Umwelt GmbH Air Pollution Control Report on the suitability test of the ambient air quality measuring system Model 5030i SHARP with PM2.5 pre-separator of the company Thermo Fisher Scientific for the component suspended particulate matter PM2.5, Report No.: 936/21209885/F Page 5 of 424 Content 1. SUMMARY AND PROPOSAL FOR DECLARATION OF SUITABILITY ........................13 1.1 Summary ...................................................................................................................13 1.2 Certification proposal .................................................................................................18 1.3 Summary of test results .............................................................................................19 2. TASK DEFINITION........................................................................................................28 2.1 Nature of test .............................................................................................................28 2.2 Objective....................................................................................................................28 3. DESCRIPTION OF THE AMS TESTED ........................................................................29 3.1 Measuring principle ....................................................................................................29 3.2 Functionality of the measuring system .......................................................................32 3.3 AMS scope and set-up...............................................................................................37 4. TEST PROGRAMME ....................................................................................................51 4.1 General......................................................................................................................51 4.2 Laboratory test ...........................................................................................................54 4.3 Field test ....................................................................................................................55 5. REFERENCE MEASURING METHODS .......................................................................74 6. TEST RESULTS ...........................................................................................................75 6.1 4.1.1 Measured value display ...................................................................................75 6.1 4.1.2 Easy maintenance ...........................................................................................77 6.1 4.1.3 Functional check ..............................................................................................79 6.1 4.1.4 Set-up times and warm-up times ......................................................................81 6.1 4.1.5 Instrument design ............................................................................................83 6.1 4.1.6 Unintended adjustment ....................................................................................84 6.1 4.1.7 Data output ......................................................................................................85 740300_2013_936_21209885F_EN.docx TÜV Rheinland Energie und Umwelt GmbH Air Pollution Control Page 6 of 424 Report on the suitability test of the ambient air quality measuring system Model 5030i SHARP with PM2.5 pre-separator of the company Thermo Fisher Scientific for the component suspended particulate matter PM2.5, Report No.: 936/21209885/F 6.1 5.1 General ...............................................................................................................87 6.1 5.2.1 Certification ranges ..........................................................................................88 6.1 5.2.2 Measuring range ..............................................................................................89 6.1 5.2.3 Negative output signals ....................................................................................90 6.1 5.2.4 Failure in the mains voltage .............................................................................91 6.1 5.2.5 Operating states...............................................................................................92 6.1 5.2.6 Switch-over ......................................................................................................93 6.1 5.2.7 Maintenance interval ........................................................................................94 6.1 5.2.8 Availability ........................................................................................................95 6.1 5.2.9 Instrument software ........................................................................................97 6.1 5.3.1 General ............................................................................................................99 6.1 5.3.2 Repeatability standard deviation at zero point ................................................101 6.1 5.3.3 Repeatability standard deviation at reference point ........................................103 6.1 5.3.4 Linearity (lack of fit) ........................................................................................104 6.1 5.3.5 Sensitivity coefficient of sample gas pressure ................................................105 6.1 5.3.6 Sensitivity coefficient of sample gas temperature ...........................................106 6.1 5.3.7 Sensitivity coefficient of surrounding temperature ..........................................107 6.1 5.3.8 Sensitivity coefficient of supply voltage ..........................................................111 6.1 5.3.9 Cross-sensitivity .............................................................................................113 6.1 5.3.10 Averaging effect ...........................................................................................114 6.1 5.3.11 Standard deviation from paired measurement ..............................................115 6.1 5.3.12 Long-term drift..............................................................................................117 6.1 5.3.13 Short-term drift .............................................................................................123 6.1 5.3.14 Response time .............................................................................................124 6.1 5.3.15 Difference between sample and calibration port ...........................................125 6.1 5.3.16 Converter efficiency .....................................................................................126 6.1 5.3.17 Increase of NO2 concentration due to residence in the measuring system ...127 740300_2013_936_21209885F_EN.docx TÜV Rheinland Energie und Umwelt GmbH Air Pollution Control Report on the suitability test of the ambient air quality measuring system Model 5030i SHARP with PM2.5 pre-separator of the company Thermo Fisher Scientific for the component suspended particulate matter PM2.5, Report No.: 936/21209885/F Page 7 of 424 6.1 5.3.18 Overall uncertainty .......................................................................................128 6.1 5.4.1 General ..........................................................................................................129 6.1 5.4.2 Equivalency of the sampling system ..............................................................130 6.1 5.4.3 Reproducibility of the sampling systems ........................................................131 6.1 5.4.4 Calibration......................................................................................................132 6.1 5.4.5 Cross-sensitivity .............................................................................................134 6.1 5.4.6 Averaging effect .............................................................................................137 6.1 5.4.7 Constancy of sample volumetric flow .............................................................138 6.1 5.4.8 Tightness of the measuring system ................................................................141 6.1 Methodology of the equivalence check (modules 5.4.9 – 5.4.11) ............................143 6.1 5.4.9 Determination of uncertainty between systems under test ubs ........................144 6.1 5.4.10 Calculation of the expanded uncertainty of the instruments..........................151 6.1 5.4.11 Application of correction factors and terms...................................................165 6.1 5.5 Requirements on multiple-component measuring systems ...............................170 7. RECOMMENDATIONS FOR PRACTICAL USE ..........................................................171 8. LITERATURE ..............................................................................................................173 9. APPENDIX ..................................................................................................................174 740300_2013_936_21209885F_EN.docx TÜV Rheinland Energie und Umwelt GmbH Air Pollution Control Report on the suitability test of the ambient air quality measuring system Model 5030i SHARP with PM2.5 pre-separator of the company Thermo Fisher Scientific for the component suspended particulate matter PM2.5, Report No.: 936/21209885/F Page 8 of 424 Tables Table 1: Table 2: Table 3: Table 4: Table 5: Table 6: Table 7: Table 8: Table 9: Table 10: Table 11: Table 12: Table 13: Table 14: Table 15: Table 16: Table 17: Table 18: Table 19: Table 20: Table 21: Table 22: Table 23: Table 24: Table 25: Table 26: Table 27: Table 28: Table 29: Table 30: Description of the test sites ..............................................................................16 Description of the test site (additional campaign 2013) ....................................17 Technical data for Model 5030i SHARP (manufacturer’s specifications) ..........49 Overview of software versions during suitability testing ....................................51 Field test sites ..................................................................................................56 Ambient conditions at the field test sites, daily mean values ............................61 Evaluation of the Teddington (summer) campaign with rH adjusted to 50 % ............................................................................................................62 Ambient conditions at the additional site “Bornheim, Summer 2013”, shown as daily mean values ............................................................................65 Results of the equivalence test at the site Bornheim, Summer 2013, SN 1 (58 %) & SN 2 (50 %), component PM2.5, raw data .................................66 Results of the equivalence test at the site Bornheim, summer 2013, SN 1 (58 %) & SN 2 (50 %), component PM2.5, slope correction 1.068 ...........66 Results of the equivalence test “suitability testing + Bornheim, summer 2013”, SN 1 & SN 2, component PM2.5, slope correction 1.068..........67 Results of Grubbs outlier test – Reference PM2.5.............................................69 Discarded reference PM2.5 paired values according to Grubbs ........................70 Used filter materials ........................................................................................73 Certification ranges .........................................................................................88 Determination of availability (without test-related outages) ..............................96 Determination of availability (including test-related outages) ...........................96 Detection limit PM2.5 ......................................................................................102 Dependence of the zero point (SHARP) on surrounding temperature, deviation in µg/m³, average of three measurements ......................................109 Dependence of sensitivity (mass coefficient) on surrounding temperature, deviation in %, average of three measurements ............................................109 Dependence of the zero point (NEPH) on surrounding temperature, deviation in µg/m³, average of three measurements ......................................110 Dependence of the measured values on mains voltage, deviation in % ........112 Concentration averages, standard deviation, uncertainty range and reproducibility in the field, measured component PM2.5 .................................116 Zero point drift SN 1 & SN 2, test with zero filter............................................119 Sensitivity drift SN 1 & SN 2 ..........................................................................121 Parameters of the calibration and analysis function, measured component PM2.5 ...........................................................................................132 Deviation between reference measurement and candidate on days with a relative humidity > 70 %, measured component PM2.5 ........................135 Comparison candidate SN 1 with reference instrument, rel. humidity > 70 %, all test sites, measured component PM2.5 .........................................136 Comparison candidate SN 2 with reference instrument, rel. humidity > 70 %, all test sites, measured component PM2.5 .........................................136 Results of flow rate checks ............................................................................139 740300_2013_936_21209885F_EN.docx TÜV Rheinland Energie und Umwelt GmbH Air Pollution Control Report on the suitability test of the ambient air quality measuring system Model 5030i SHARP with PM2.5 pre-separator of the company Thermo Fisher Scientific for the component suspended particulate matter PM2.5, Report No.: 936/21209885/F Table 31: Table 32: Table 33: Table 34: Table 35: Table 36: Table 37: Table 38: Table 39: Table 40: Table 41: Page 9 of 424 Parameters for flow measurement (24-h average), SN 1 (field) .....................140 Parameters for flow measurement (24-h average), SN 2 (field) .....................140 Results of the tightness check .......................................................................142 Uncertainty between systems under test ubs for candidates SN 1 and SN 2, measured component PM2.5 .........................................................146 Overview equivalence test of Model 5030i SHARP for PM2.5 .........................154 Uncertainty between the reference devices uref for PM2.5 ...............................156 Summary of the results of the equivalence test, SN 1 & SN 2, measured component PM2.5, raw data ...........................................................................157 Summary of the results of the equivalence check, SN 1 & SN 2, after slope correction .....................................................................................169 Stability of standard weight............................................................................211 Stability of the control filters...........................................................................213 Conditioning and weighing timescales ...........................................................214 740300_2013_936_21209885F_EN.docx TÜV Rheinland Energie und Umwelt GmbH Air Pollution Control Report on the suitability test of the ambient air quality measuring system Model 5030i SHARP with PM2.5 pre-separator of the company Thermo Fisher Scientific for the component suspended particulate matter PM2.5, Report No.: 936/21209885/F Page 10 of 424 Figures Figure 1: Figure 2: Figure 3: Figure 4: Figure 5: Figure 6: Figure 7: Figure 8: Figure 9: Figure 10: Figure 11: Figure 12: Figure 13: Figure 14: Figure 15: Figure 16: Figure 17: Figure 18: Figure 19: Figure 20: Figure 21: Figure 22: Figure 23: Figure 24: Figure 25: Figure 26: Figure 27: Figure 28: Figure 29: Figure 30: Figure 31: Figure 32: Figure 33: Figure 34: Figure 35: Figure 36: Figure 37: Figure 38: Figure 39: Sample path within the Model 5030i SHARP measuring system ......................32 Hardware components Model 5030i SHARP – Optics module .........................33 Hardware components Model 5030i SHARP – Beta module ............................33 Picture of hardware components Model 5030i SHARP – Beta module.............34 Diagram – Set-up of Model 5030i SHARP .......................................................35 Model 5030i SHARP (SHARP optics modules (top) + SHARP beta module (bottom)) .............................................................................................37 (European) PM2.5 sampling inlet for Model 5030i SHARP ................................38 Heated sampling tube (DHS) ...........................................................................39 Model 5030i SHARP measuring system ..........................................................39 Model 5030i SHARP measuring system – Optics module ................................40 Model 5030i SHARP measuring system – Beta module ...................................40 Model 5030i SHARP measuring system (Systems 1 and 2 from right) at measuring station ............................................................................................41 Vacuum pump (type: GAST Model 75R647, PN 110836-00) ...........................41 Main screen of the user interface ....................................................................42 Flow chart – Overview of menu-assisted firmware ..........................................45 Zero filter for supplying air free of suspended particles and its connection adapter ............................................................................................................46 Set with foil holder and test foils ......................................................................47 Leak test adapter ............................................................................................48 Course of PM2.5 concentrations (reference) at the test site “Cologne, parking lot, winter“ ...........................................................................................57 Course of PM2.5 concentrations (reference) at the test site “Bornheim, motorway parking lot, summer” .......................................................................57 Course of PM2.5 concentrations (reference) at the test site “Bornheim, motorway parking lot, winter“...........................................................................58 Course of PM2.5 concentrations (reference) at the test site “Teddington, summer“ ..........................................................................................................58 Field test site Cologne, parking lot...................................................................59 Field test site Bornheim, motorway parking lot ................................................59 Field test site Teddington ................................................................................60 Comparison of reference and candidate SN 1, measured component PM2.5, Teddington (summer), relative humidity threshold adjusted to 50 % .....63 Comparison of reference and candidate SN 2, measured component PM2.5, Teddington (summer), relative humidity threshold adjusted to 50 % .....63 Grubbs test results for the PM2.5 reference method, Cologne (winter) .............70 Grubbs test results for the PM2.5 reference method, Bornheim (summer) ........71 Grubbs test results for the PM2.5 reference method, Bornheim (winter) ...........71 Grubbs test results for the PM2.5 reference method, Teddington (summer) .....72 Display of the measured SHARP concentration ..............................................76 Rear view of Model 5030i SHARP ...................................................................86 Software version (here V02.00.00.232+) displayed by selection of the menu “Diagnostics / Program Versions” ..........................................................98 Zero point drift SN 1, measured component PM2.5 .........................................120 Zero point drift SN 2, measured component PM2.5 .........................................120 Drift of the measured value SN 1, measured component PM2.5 .....................122 Drift of the measured value SN 2, measured component PM2.5 .....................122 Flow of candidate SN 1 (field) .......................................................................140 740300_2013_936_21209885F_EN.docx TÜV Rheinland Energie und Umwelt GmbH Air Pollution Control Report on the suitability test of the ambient air quality measuring system Model 5030i SHARP with PM2.5 pre-separator of the company Thermo Fisher Scientific for the component suspended particulate matter PM2.5, Report No.: 936/21209885/F Figure 40: Figure 41: Figure 42: Figure 43: Figure 44: Figure 45: Figure 46: Figure 47: Figure 48: Figure 49: Figure 50: Figure 51: Figure 52: Figure 53: Figure 54: Figure 55: Figure 56: Figure 57: Figure 58: Figure 59: Figure 60: Figure 61: Figure 62: Figure 63: Page 11 of 424 Flow of candidate SN 2 (field) .......................................................................140 Results of the parallel measurements with the candidates SN 1 / SN 2, measured component PM2.5, all test sites ......................................................147 Results of the parallel measurements with the candidates SN 1 / SN 2, measured component PM2.5, test site Cologne (winter) .................................147 Results of the parallel measurements with the candidates SN 1 / SN 2, measured component PM2.5, test site Bornheim (summer) ............................148 Results of the parallel measurements with the candidates SN 1 / SN 2, measured component PM2.5, test site Bornheim (winter) ...............................148 Results of the parallel measurements with the candidates SN 1 / SN 2, measured component PM2.5, test site Teddington (summer) .........................149 Results of the parallel measurements with the candidates SN 1 / SN 2, measured component PM2.5, all test sites, values ≥ 18 µg/m³ ........................149 Results of the parallel measurements with the candidates SN 1 / SN 2, measured component PM2.5, all test sites, values < 18 µg/m³........................150 Reference vs. candidate, SN 1 & SN 2, measured component PM2.5, all test sites ...................................................................................................158 Reference vs. candidate, SN 1, measured component PM2.5, all test sites ....159 Reference vs. candidate, SN 2, measured component PM2.5, all test sites ....159 Reference vs. candidate, SN 1, measured component PM2.5, Cologne (winter) ............................................................................................160 Reference vs. candidate, SN 2, measured component PM2.5, Cologne (winter) ............................................................................................160 Reference vs. candidate, SN 1, measured component PM2.5, Bornheim (summer) ......................................................................................161 Reference vs. candidate, SN 2, measured component PM2.5, Bornheim (summer) ......................................................................................161 Reference vs. candidate, SN 1, measured component PM2.5, Bornheim (winter) ..........................................................................................162 Reference vs. candidate, SN 2, measured component PM2.5, Bornheim (winter) ..........................................................................................162 Reference vs. candidate, SN 1, measured component PM2.5, Teddington (summer) ....................................................................................163 Reference vs. candidate, SN 2, measured component PM2.5, Teddington (summer) ....................................................................................163 Reference vs. candidate, SN 1, measured component PM2.5, values ≥ 18 µg/m³..........................................................................................164 Reference vs. candidate, SN 2, measured component PM2.5, values ≥ 18 µg/m³..........................................................................................164 Stability of standard weight............................................................................210 Stability of the control filters...........................................................................212 Distribution for Emfab filters of (A) Pre spread weighed relative to the check weight and (B) Post spread weighed relative to the check weight. ..........................................................................219 740300_2013_936_21209885F_EN.docx TÜV Rheinland Energie und Umwelt GmbH Air Pollution Control Page 12 of 424 Report on the suitability test of the ambient air quality measuring system Model 5030i SHARP with PM2.5 pre-separator of the company Thermo Fisher Scientific for the component suspended particulate matter PM2.5, Report No.: 936/21209885/F Blank page 740300_2013_936_21209885F_EN.docx TÜV Rheinland Energie und Umwelt GmbH Air Pollution Control Report on the suitability test of the ambient air quality measuring system Model 5030i SHARP with PM2.5 pre-separator of the company Thermo Fisher Scientific for the component suspended particulate matter PM2.5, Report No.: 936/21209885/F Page 13 of 424 1. Summary and proposal for declaration of suitability 1.1 Summary According to Directive 2008/50/EC of 21 May 2008 [7] on “Air quality and cleaner air for Europe” (replaces Council Directive 96/62/EC of 27 September 1996 on ambient air quality assessment and management including its daughter directives 1999/30/EC, 2000/69/EC, 2002/3/EC and the Council Decision 97/101/EC), the methods described in Standard EN 12341 “Air quality - Determination of the PM10 fraction of suspended particulate matter. Reference method and field test procedure to demonstrate reference equivalence of measurement methods” and Standard EN 14907 “Ambient air quality - Standard gravimetric measurement method for the determination of the PM2.5 mass fraction of suspended particulate matter” serve as reference methods for suspended particle measurement of the respective mass fraction. However, EC member states are free to use any other method in the case of particulate matter for which the Member State concerned can demonstrate displays a consistent relationship to the reference method. In that event the results achieved by that method must be corrected to produce results equivalent to those that would have been achieved by using the reference method. (2008/50/EC, Annex VI, B). The Guidance “Demonstration of Equivalence of Ambient Air Monitoring Methods” [4], which was developed by an ad hoc EC task group (Source: http://ec.europa.eu/environment/air/quality/legislation/pdf/equivalence.pdf, Version January 2010) describes an equivalence check method for non-standard measurement methods. The specifications of the Guide for the equivalence testing were included in the last revision of the VDI Standards VDI 4202, Part 1 [1] as well as VDI 4203, Part 3 [2]. The following limits were applied during suitability testing: PM2.5 Daily limit value (24 h) not defined Annual limit value (1 a) 25 µg/m³* as well as for the calculations according to the Guide [4] PM2.5 Limit value 30 µg/m³ Standard VDI 4202, Part 1 of 2002 describes all “Performance criteria for performance tests of automated ambient air measuring systems”. General parameters for the related tests are given in Standard VDI 4203, Part 1 “Testing of automated measuring systems - General con- 740300_2013_936_21209885F_EN.docx TÜV Rheinland Energie und Umwelt GmbH Air Pollution Control Page 14 of 424 Report on the suitability test of the ambient air quality measuring system Model 5030i SHARP with PM2.5 pre-separator of the company Thermo Fisher Scientific for the component suspended particulate matter PM2.5, Report No.: 936/21209885/F cepts” of October 2001 and further specified in VDI 4203, Part 3 “Testing of automated measuring systems - Test procedures for point-related ambient air measuring systems for gaseous and particulate air pollutants” of August 2004. Standard VDI 4202, Part 1 and VDI 4203, Part 3 were republished after an extensive revision with latest update September 2010. Unfortunately, after this revision uncertainties and contradictions remain regarding the concrete minimum requirements on the one hand, and the general relevance of the test points on the other hand when testing particulate ambient air measuring devices. The following test points require clarification: 6.1 5.3.2 Repeatability standard deviation at zero point no minimum requirement defined 6.1 5.3.3 Repeatability standard deviation at reference point not relevant for particulate devices 6.1 5.3.4 Linearity (lack of fit) not relevant for particulate devices 6.1 5.3.7 Sensitivity coefficient of surrounding temperature no minimum requirement defined 6.1 5.3.8 Sensitivity coefficient of supply voltage no minimum requirement defined 6.1 5.3.11 Standard deviation from paired measurement no minimum requirement defined 6.1 5.3.12 Long-term drift no minimum requirement defined 6.1 5.3.13 Short-term drift not relevant for particulate devices 6.1 5.3.18 Overall uncertainty not relevant for particulate devices, covered by 5.4.10 For this reason an official request to the competent German body was made, to define a coordinated procedure for dealing with inconsistencies in the Standard. The following procedure was suggested: Test points 5.3.2, 5.3.7, 5.3.8, 5.3.11 and 5.3.12 are evaluated as before basing on the minimum requirements stated in VDI 4202 Part 1 of 2002 (i.e. using the reference values B0, B1 and B2). The performance of the test points 5.3.3, 5.3.4, 5.3.13 and 5.3.18 is omitted, as they are not relevant for particulate measuring devices. 740300_2013_936_21209885F_EN.docx TÜV Rheinland Energie und Umwelt GmbH Air Pollution Control Report on the suitability test of the ambient air quality measuring system Model 5030i SHARP with PM2.5 pre-separator of the company Thermo Fisher Scientific for the component suspended particulate matter PM2.5, Report No.: 936/21209885/F Page 15 of 424 The competent German body agreed with the proposed procedure by decisions of 27 June 2011 and 07 October 2011. Since according to the applied standards the reference values to be used are explicitly adjusted to component PM10, for component PM2.5 the following reference values have been agreed upon: B0 B1 B2 PM2.5 2 µg/m³ 25 µg/m³ 200 µg/m³ PM10 (for comparison) 2 µg/m³ 40 µg/m³ 200 µg/m³ B1 shall be merely adjusted to the level of the limit value for the annual average. Thermo Fisher Scientific has commissioned TÜV Rheinland Energie und Umwelt GmbH to perform of a suitability test of Model 5030i SHARP measuring system for component suspended particulate matter PM2.5. • Standard VDI 4202 Part 1, “Performance criteria for performance tests of automated ambient air measuring systems – Point-related measurement methods for gaseous and particulate air pollutants”, September 2010 or June 2002 [1] • Standard VDI 4203 Part 3, “Testing of automated measuring systems - Test procedures for point-related ambient air measuring systems for gaseous and particulate air pollutants”, September 2010 or August 2004 [2] • Standard EN 14907, “Ambient air quality - Standard gravimetric measurement method for the determination of the PM2.5 mass fraction of suspended particulate matter”, German version EN 14907: 2005 [3] • Guide “Demonstration of Equivalence of Ambient Air Monitoring Methods”, English version of January 2010 [4] 740300_2013_936_21209885F_EN.docx TÜV Rheinland Energie und Umwelt GmbH Air Pollution Control Report on the suitability test of the ambient air quality measuring system Model 5030i SHARP with PM2.5 pre-separator of the company Thermo Fisher Scientific for the component suspended particulate matter PM2.5, Report No.: 936/21209885/F Page 16 of 424 The measuring system Model 5030i SHARP is a synchronised hybrid real-time measuring instrument for particulate matter which determines the particulate concentration using a combined nephelometric/radiometric method of measurement. With the aid of a pump, ambient air is sucked at 16.67 l/min via a PM2.5 pre-separator. The dust-laden sampling air passes through a light-scattering photometer (nephelometer) and is then collected on a filter tape. The determination of particulate mass collected on the filter tape is performed continuously during sampling by means of the radiometric measuring principle of beta absorption. The actual reading of the measuring system Model 5030i SHARP is determined from the values measured by the nephelometer and radiometer by means of a calculation algorithm. The tests took place in the laboratory and for several months in the field. The following test sites were chosen for the field test according to Table 1. Table 1: Description of the test sites Cologne, parking lot, winter Bornheim, motorway parking lot, summer Bornheim, motorway parking lot, winter Teddington (UK) summer Period 03/2011 – 05/2011 07/2011 – 11/2011 01/2012 – 03/2012 07/2012 – 10/2012 No. of paired values: Candidates 52 91 49 50 Characteristics Urban background Rural structure + motorway Rural structure + motorway Urban background Rank of pollution Average to high Low to average Average Average To qualify the necessary change of the threshold for the relative humidity to control the sample heating from originally 50 % to 58 % (necessary due to the results of the campaign in Teddington UK), an additional campaign at one of the German sites with two candidate systems with settings of each 50 % and 58 % was performed (decision of the 32nd Expert meeting ”test reports” of May 14/15 2013). Table 2 gives an overview on the additional campaign. The results of this campaign are shown in chapter 4.3 Field test from page 55. 740300_2013_936_21209885F_EN.docx TÜV Rheinland Energie und Umwelt GmbH Air Pollution Control Report on the suitability test of the ambient air quality measuring system Model 5030i SHARP with PM2.5 pre-separator of the company Thermo Fisher Scientific for the component suspended particulate matter PM2.5, Report No.: 936/21209885/F Table 2: Page 17 of 424 Description of the test site (additional campaign 2013) Bornheim, motorway parking lot, summer Period 06/2013 – 07/2013 No. of paired values: Candidates 45 Characteristics Rural structure + motorway Rank of pollution Low to average The complete test was performed within the scope of the test programme “Combined MCERTS and TÜV PM Equivalence Testing Programme”. In the context of European harmonisation, the test programme was developed and carried out by British and German test institutes (Bureau Veritas UK & Ireland, National Physical Laboratory NPL and TÜV Rheinland). It comprises the testing of the latest series of suspended particle measuring systems by different manufacturers in the laboratory and at field test sites in the UK and in Germany. The minimum requirements were fulfilled during suitability testing. TÜV Rheinland Energie und Umwelt GmbH therefore suggests publication as a suitabilitytested measuring system for continuous monitoring of suspended particulate matter PM2.5 in ambient air. 740300_2013_936_21209885F_EN.docx TÜV Rheinland Energie und Umwelt GmbH Air Pollution Control Report on the suitability test of the ambient air quality measuring system Model 5030i SHARP with PM2.5 pre-separator of the company Thermo Fisher Scientific for the component suspended particulate matter PM2.5, Report No.: 936/21209885/F Page 18 of 424 1.2 Certification proposal Due to the positive results achieved, the following recommendation is put forward for the notification of the AMS as a suitability-tested measuring system: AMS designation: Model 5030i SHARP with PM2.5 pre-separator for suspended particulate matter PM2.5 Manufacturer: Thermo Fisher Scientific, Franklin, USA Field of application: Continuous monitoring of suspended particulate matter of the PM2.5 fraction in ambient air (stationary operation) Measuring ranges during suitability test: Component Certification range Unit PM2.5 0 – 1000 µg/m³ Software version: V02.00.00.232+ Restrictions: None Notes: 1. The requirements according to guide “Demonstration of Equivalence of Ambient Air Monitoring Methods” are fulfilled for the measured component PM2.5. 2. The measuring system shall be operated within a lockable measuring cabinet. 3. The measuring system is to be calibrated on site at regular intervals by application of the gravimetric PM2.5 reference method according to EN 14907. 4. It is recommended that the measuring system is operated with a threshold for the relative humidity of 58%, in particular at sites with significantly high ratio of volatiles in the suspended particulate matter. 5. The test report on the suitability test is available online under www.qal1.de. Test report: TÜV Rheinland Energie und Umwelt GmbH, Cologne, Germany Report No.: 936/21209885/F of 20 September 2013 740300_2013_936_21209885F_EN.docx TÜV Rheinland Energie und Umwelt GmbH Air Pollution Control Report on the suitability test of the ambient air quality measuring system Model 5030i SHARP with PM2.5 pre-separator of the company Thermo Fisher Scientific for the component suspended particulate matter PM2.5, Report No.: 936/21209885/F 1.3 Page 19 of 424 Summary of test results Minimum requirement Specification Test result Fulfilled Page The measuring system is fitted with a measured value display. yes 75 mainte- Necessary maintenance of the Maintenance works can be carried out measuring systems should be with commonly available tools taking possible without larger effort, if reasonable time and effort. possible from outside. yes 77 All system functions listed in the manual are available, can be activated and function well. The current system status is continuously monitored and displayed by a series of status messages. yes 80 4.1.4 Set-up times and Shall be specified in the in- The set-up and warm-up times were warm-up times struction manual. determined. yes 82 4.1.5 Instrument design Shall be specified in the in- The instrument design specifications listed in the operating manual are struction manual. complete and correct. yes 83 4.1.6 Unintended adjustment It shall be possible to secure the adjustment of the measuring system against illicit or unintended adjustment during operation. The AMS is protected against unauthorised and unintended adjustment. In addition, the AMS shall be locked up in a measuring cabinet. yes 84 4.1.7 Data output The output signals shall be Measured signals are output as anaprovided digitally and/or as an- logue signals (in V or mA) and digitalalogue signals ly (via Ethernet, RS 232, RS 485). yes 85 yes 87 4 Requirements on the instrument design 4.1 General requirements 4.1.1 Measured value Shall be available. display 4.1.2 Easy nance 4.1.3 Functional check If the operation or the functional check of the measuring system require particular instruments, they shall be considered as part of the measuring system and be applied in the corresponding sub-tests and included in the assessment. 5. Performance requirements 5.1 General The manufacturer’s specifica- No differences between the instrutions in the instruction manual ment design and the descriptions givshall be by no means better en in the manual were detected. than the results of the performance test. 740300_2013_936_21209885F_EN.docx TÜV Rheinland Energie und Umwelt GmbH Air Pollution Control Report on the suitability test of the ambient air quality measuring system Model 5030i SHARP with PM2.5 pre-separator of the company Thermo Fisher Scientific for the component suspended particulate matter PM2.5, Report No.: 936/21209885/F Page 20 of 424 Minimum requirement Fulfilled Page yes 88 A measuring range of 0 – 10 000 µg/m³ is set by default. It is possible to adjust other measuring ranges. The upper limit of the measuring range of the measuring system is greater than the respective upper limit of the certification range. yes 89 5.2.3 Negative output signals Negative output signals or Negative measured signals are dismeasured values may not be played directly on the AMS and are suppressed (life zero). transmitted correctly via the respective signal outputs of the measuring system. yes 90 5.2.4 Failure in the mains voltage Uncontrolled emission of operation and calibration gas shall be avoided. The instrument parameters shall be secured by buffering against loss caused by failure in the mains voltage. When mains voltage returns, the instrument shall automatically reach the operation mode and start the measurement according to the operating instructions. All instrument parameters are protected against loss through buffering. After the power supply has returned, the measuring device goes back to failure-free operational condition and resumes measurement. However, at least the first 12 h worth of data after voltage returns shall be discarded, since the system needs an equilibration phase after restart until the BETA detector adjusts to ambient conditions. yes 91 5.2.5 Operating states The measuring system shall allow the control of important operating states by telemetrically transmitted status signals. The measuring systems can be extensively monitored and operated from an external PC via modem or router. yes 92 5.2.6 Switch-over Switch-over between measurement and functional check and/or calibration shall be possible telemetrically by computer control or manual intervention. In principle, all necessary operations for performing a functional check can be monitored directly on the system or via telemetric remote control. yes 93 5.2.7 Maintenance interval If possible 3 months, minimum The maintenance interval is defined 2 weeks. by the necessary maintenance procedures and has been set to 1 month. yes 94 5.2 Specification Test result General requirements on measuring systems 5.2.1 Certification ranges Have to comply with the re- It is possible to assess the measuring quirements of Table 1 of the system in the range of the relevant Standard VDI 4202 Part 1. limit values. 5.2.2 Measuring range The upper limit of measurement of the measuring systems shall be greater or equal to the upper limit of the certification range. 740300_2013_936_21209885F_EN.docx TÜV Rheinland Energie und Umwelt GmbH Air Pollution Control Report on the suitability test of the ambient air quality measuring system Model 5030i SHARP with PM2.5 pre-separator of the company Thermo Fisher Scientific for the component suspended particulate matter PM2.5, Report No.: 936/21209885/F Page 21 of 424 Minimum requirement Specification Test result Fulfilled Page 5.2.8 Availability Minimum 95 %. The availability was 97.4 % for SN 1 and 96.1 % for SN 2 without testrelated outages, or 90.2 % for SN 1 and 89.0 % for SN 2 including testrelated outages. yes 95 5.2.9 Instrument software The version of the instrument software to be tested shall be displayed during switch-on of the measuring system. The test institute shall be informed on changes in the instrument software, which have influence on the performance of the measuring system. The version of the instrument software is shown on the display. Changes to the instrument software are communicated to the test institute. yes 97 5.3 Requirements on measuring systems for gaseous air pollutants 5.3.1 General Minimum requirement according VDI 4202 Part 1. The test is based on the minimum requirements of Standard VDI 4202, Part 1 (September 2010). Test points 5.3.2, 5.3.7, 5.3.8, 5.3.11 and 5.3.12 are evaluated as before basing on the minimum requirements stated in VDI 4202 Part 1 of 2002 (i.e. using the reference values B0, B1 and B2). The performance of the test points 5.3.3, 5.3.4, 5.3.13 and 5.3.18 is omitted, as they are not relevant for particulate measuring devices. yes 99 5.3.2 Repeatability standard deviation at zero point The repeatability standard deviation at zero point shall not exceed the requirements of Table 2 in the certification range according to Table 1 of Standard VDI 4202 Part 1 (September 2010). For PM: Max. B0. The investigations result in detection limits of 0.11 µg/m³ for system 1 (SN 1) and 0.07 µg/m³ for system 2 (SN 2). yes 101 5.3.3 Repeatability standard deviation at reference point The repeatability standard de- Not applicable. viation at reference point shall not exceed the requirements of Table 2 in the certification range according to Table 1 of Standard VDI 4202 Part 1 (September 2010). - 103 5.3.4 Linearity (lack of fit) The analytical function describing the relationship between the output signal and the value of the air quality characteristic shall be linear. - 104 For PM2.5 particulate measuring systems, this test shall be performed according to minimum requirement 5.4.10 “Calculation of the expanded uncertainty of the instruments”. 740300_2013_936_21209885F_EN.docx TÜV Rheinland Energie und Umwelt GmbH Air Pollution Control Report on the suitability test of the ambient air quality measuring system Model 5030i SHARP with PM2.5 pre-separator of the company Thermo Fisher Scientific for the component suspended particulate matter PM2.5, Report No.: 936/21209885/F Page 22 of 424 Minimum requirement Fulfilled Page 5.3.5 Sensitivity coeffi- The sensitivity coefficient of the Not applicable. sample gas pressure at refercient of sample ence point shall not exceed the gas pressure specifications of Table 2 of Standard VDI 4202 Part 1 (September 2010). - 105 5.3.6 Sensitivity coeffi- The sensitivity coefficient of the Not applicable. sample gas temperature at refcient of sample gas temperature erence point shall not exceed the specifications of Table 2 of Standard VDI 4202 Part 1 (September 2010). - 106 The maximum dependence on surrounding temperature in the range 5 °C to 40 °C was 0.2 µg/m³ at zero. No deviation > -2.6 % of the default value at 20 °C could be observed at reference point. yes 107 No deviations > -1.4 % in relation to the default value at 230 V caused by voltage changes could be detected for PM2.5. yes 111 - 113 5.3.7 Sensitivity coefficient of surrounding temperature Specification The sensitivity coefficient of the surrounding temperature at zero and reference point shall not exceed the specifications of Table 2 of Standard VDI 4202 Part 1 (September 2010). For PM: Test result Zero point value for ∆Tu of 15 K between +5 °C and +20 °C or 20 K between +20 °C and +40 °C shall not exceed B0. The measurement value in the range of B1 shall not exceed ± 5 % for ∆Tu of 15 K between +5 °C and +20 °C or for 20 K between +20 °C and +40 °C. 5.3.8 Sensitivity coeffi- The sensitivity coefficient of the electric voltage at reference cient of supply point shall not exceed the voltage specifications made in Table 2 of Standard VDI 4202 Part 1 (September 2010). For PM: Change in measured value at B1 maximum B0 within the voltage interval (230 +15/-20) V. 5.3.9 Cross-sensitivity The change in the measured Not applicable. value caused by interfering components in the sample gas shall not exceed the requirements of Table 2 of Standard VDI 4202 Part 1 (September 2010) at zero and reference point. 740300_2013_936_21209885F_EN.docx TÜV Rheinland Energie und Umwelt GmbH Air Pollution Control Report on the suitability test of the ambient air quality measuring system Model 5030i SHARP with PM2.5 pre-separator of the company Thermo Fisher Scientific for the component suspended particulate matter PM2.5, Report No.: 936/21209885/F Page 23 of 424 Minimum requirement Specification Test result 5.3.10 Averaging effect For gaseous components the Not applicable. measuring system shall allow the formation of hourly averages. The averaging effect shall not exceed the requirements of Table 2 of Standard VDI 4202 Part 1 (September 2010). 5.3.11 Standard deviation from paired measurement The standard deviation from The reproducibility for PM2.5 was 10 parallel determinations shall be for the complete dataset of the field done with two identical meas- test. uring devices during field test. It shall not exceed the specifications stated in Table 2 of Standard VDI 4202 Part 1 (September 2010). For PM: Fulfilled Page - 114 yes 115 yes 117 - 123 RD ≥ 10 related to B1. 5.3.12 Long-term drift The long-term drift at zero point and reference point shall not exceed the requirements of Table 2 in the field test of Standard VDI 4202 Part 1 (September 2010) in the field test. For PM: Zero point: within 24 h and within the maintenance interval a maximum of B0. As reference point: within 24 h and within the maintenance interval a maximum 5 % of B1. The maximum deviation at zero point was 2.4 µg/m³ in relation to the previous value and 2.2 µg/m³ in relation to the start value, and is therefore within the permissible limits of B0 = 2 µg/m³. The values obtained during the sensitivity drift tests amount to a maximum of -2.9 % in relation to the previous value for PM2.5. 5.3.13 Short-term drift The short-term drift at zero Not applicable. point and reference point shall not exceed the requirements of Table 2 of Standard VDI 4202 Part 1 (September 2010) within 12 h (for benzene 24 h) in the laboratory test and within 24 h in the field test. 740300_2013_936_21209885F_EN.docx TÜV Rheinland Energie und Umwelt GmbH Air Pollution Control Report on the suitability test of the ambient air quality measuring system Model 5030i SHARP with PM2.5 pre-separator of the company Thermo Fisher Scientific for the component suspended particulate matter PM2.5, Report No.: 936/21209885/F Page 24 of 424 Minimum requirement Specification 5.3.14 Response time Fulfilled Page The response time (rise) of the Not applicable. measuring system shall not exceed 180 s. The response time (fall) of the measuring system shall not exceed 180 s. The difference between the response time (rise) and response time (fall) of the measuring system shall not exceed 10% of response time (rise) or 10 s, whatever value is larger. - 124 5.3.15 Difference between sample and calibration port The difference between the Not applicable. measured values obtained by feeding gas at the sample and calibration port shall not exceed the requirements of Table 2 of Standard VDI 4202 Part 1 (September 2010). - 125 5.3.16 Converter efficiency In the case of measuring sys- Not applicable. tems with a converter, the efficiency of the converter shall be at least 98 %. - 126 5.3.17 Increase of NO2 concentration due to residence in the measuring system In case of NOx measuring sys- Not applicable. tems, the increase of NO2 concentration due to residence in the measuring system shall not exceed the requirements of Table 2 of Standard VDI 4202 Part 1 (September 2010). - 127 5.3.18 Overall uncertainty The expanded uncertainty of the measuring system shall be determined. The value determined shall not exceed the corresponding data quality objectives in the applicable EU Directives on air quality listed in Annex A, Table A1 of Standard VDI 4202 Part 1 (September 2010). - 128 740300_2013_936_21209885F_EN.docx Test result By resolution of the competent German body (see module 5.3.1), this test is not relevant for particulate measuring systems. Reference is made to module 5.4.10. TÜV Rheinland Energie und Umwelt GmbH Air Pollution Control Report on the suitability test of the ambient air quality measuring system Model 5030i SHARP with PM2.5 pre-separator of the company Thermo Fisher Scientific for the component suspended particulate matter PM2.5, Report No.: 936/21209885/F Minimum requirement Fulfilled Page yes 129 The equivalency to the refer- Not applicable to PM2.5 sampling sysence method according to EN tems. Reference is made to module 12341 [T2] shall be demon- 5.4.10 of this report. strated. -- 130 5.4.3 Reproducibility of This shall be demonstrated in Not applicable to PM2.5 sampling systhe field test for two identical tems. Reference is made to module the sampling systems according to EN 5.4.10 of this report. systems 12341 [T2]. - 131 5.4 Specification Page 25 of 424 Test result Requirements on measuring systems for particulate air pollutants 5.4.1 General 5.4.2 Equivalency of the sampling system Test according to the minimum requirement stated in Table 5 of Standard VDI 4202, Part 1. Furthermore, the particle mass concentration shall be related to a defined volume. Testing was carried out in compliance with the minimum requirements stated in Table 5 of Standard VDI 4202, Part 1 (September 2010). The calculated mass is related to a defined and actively regulated sampling volume, thus determining the particulate mass concentration. 5.4.4 Calibration The systems under test shall be calibrated in the field test by comparison measurements with the reference method according to EN 12341 and EN 14907. Here, the relationship between the output signal and the gravimetrically determined reference concentration shall the determined as a steady function. A statistical correlation between the reference measuring method and the device reading could be demonstrated. yes 132 5.4.5 Cross-sensitivity Shall not exceed 10 % of the No deviation of the measured signal limit value. from the nominal value > 0.5 µg/m³ caused by interference of moisture in the sample could be observed for PM2.5. No negative influence on the measured values at varying relative humidity was detected during the field test. Comparability of the candidates with the reference method according to Guide „Demonstration of Equivalence of Ambient Air Monitoring Methods” [4] is also given for days with a relative humidity > 70 %. yes 134 5.4.6 Averaging effect The measuring system shall allow for formation of 24 h averages. The time of the sum of all filter changes within 24 h may not exceed 1 % of this averaging time. yes 137 It is possible to form daily averages based on the three measurement cycles using the described instrument configuration and a cycle duration of 8 hours. 740300_2013_936_21209885F_EN.docx TÜV Rheinland Energie und Umwelt GmbH Air Pollution Control Report on the suitability test of the ambient air quality measuring system Model 5030i SHARP with PM2.5 pre-separator of the company Thermo Fisher Scientific for the component suspended particulate matter PM2.5, Report No.: 936/21209885/F Page 26 of 424 Minimum requirement Specification Test result Fulfilled Page 5.4.7 Constancy of sample volumetric flow ± 3 % of the rated value. All instantaneous values of the sample volumetric flow shall be within a range of ± 5 % of the rated value during sampling. All determined daily averages present deviations less than ±3 % from the nominal value; all instantaneous values deviate less than ±5 %. yes 138 5.4.8 Tightness of the measuring system Leakage shall not exceed 1 % The criteria specified by the manufacof the sample volume sucked. turer upon which the tightness check is considered passed – maximum difference of ±0.42 l/min (= ±2.5 % of the flow rate) between the flow rates measured by the instrument and by the external flow meter under application of the adapter – proved to be appropriate parameters for monitoring the instrument’s tightness. The laboratory tests resulted in a maximum leakage < 1 % of the nominal flow rate of 16.67 l/min for both candidates. The tightness check must only be performed with the tightness check adapter and the described procedure. It can otherwise damage the instrument. yes 141 5.4.9 Determination of uncertainty between systems under test ubs Shall be determined according to chapter 9.5.2.1 of the guidance document „Demonstration of Equivalence of Ambient Air Monitoring Methods“ in the field test for at least two identical systems. The uncertainty between the candidates ubs is with a maximum of 1.68 µg/m³ for PM2.5 below the required value of 2.5 µg/m³. yes 144 5.4.10 Calculation of the expanded uncertainty of the instruments Determination of the expanded uncertainty of the candidates according to chapter 9.5.2.2ff of the guidance document „Demonstration of Equivalence of Ambient Air Monitoring Methods”. The determined uncertainties WCM without application of correction factors lay for all observed datasets below the defined expanded relative uncertainty Wdqo of 25 % for fine dust. yes 151 740300_2013_936_21209885F_EN.docx TÜV Rheinland Energie und Umwelt GmbH Air Pollution Control Report on the suitability test of the ambient air quality measuring system Model 5030i SHARP with PM2.5 pre-separator of the company Thermo Fisher Scientific for the component suspended particulate matter PM2.5, Report No.: 936/21209885/F Minimum requirement Specification 5.4.11 Application of If the maximum expanded uncorrection factors certainty of the systems under and terms test exceeds the data quality objectives according to the European Directive on ambient air quality [7] for the test of PM2.5 measuring systems, the application of correction factors and terms is allowed. Values corrected shall meet the requirements of chapter 9.5.2.2 ff. of the guidance document „Demonstration of Equivalence of Ambient Air Monitoring Methods”. 5.5 Requirements on multiplecomponent measuring systems Page 27 of 424 Test result Fulfilled Page The candidate systems fulfil the requirements on data quality of ambient air quality measurements during the test even without application of correction factors. A correction of the slope leads nevertheless to a significant improvement of the expanded measuring uncertainty of the full data comparison. yes 165 - 170 Shall comply with the require- Not applicable. ments set for each component also in the case of simultaneous operation of all measuring channels. 740300_2013_936_21209885F_EN.docx TÜV Rheinland Energie und Umwelt GmbH Air Pollution Control Page 28 of 424 2. Task definition 2.1 Nature of test Report on the suitability test of the ambient air quality measuring system Model 5030i SHARP with PM2.5 pre-separator of the company Thermo Fisher Scientific for the component suspended particulate matter PM2.5, Report No.: 936/21209885/F Thermo Fisher Scientific has commissioned TÜV Rheinland Energie und Umwelt GmbH to carry out suitability testing of the measuring system Model 5030i SHARP with PM2.5 preseparator. The test was performed as a complete suitability test. 2.2 Objective The AMS shall determine the content of PM2.5 fine dust in ambient air within the concentration range of 0 - 1000 µg/m3. The suitability test was carried out in accordance with the current standards for suitability tests while taking into account the latest developments. The test was performed in consideration of the following standards: • Standard VDI 4202 Part 1, “Performance criteria for performance tests of automated ambient air measuring systems – Point-related measurement methods for gaseous and particulate air pollutants”, September 2010 or June 2002 [1] • Standard VDI 4203 Part 3, “Testing of automated measuring systems – Test procedures for point-related ambient air measuring systems for gaseous and particulate air pollutants”, September 2010 or August 2004 [2] • Standard EN 14907, “Ambient air quality - Standard gravimetric measurement method for the determination of the PM2.5 mass fraction of suspended particulate matter”, German version EN 14907: 2005 [3] • Guide “Demonstration of Equivalence of Ambient Air Monitoring Methods”, English version of January 2010 [4] 740300_2013_936_21209885F_EN.docx TÜV Rheinland Energie und Umwelt GmbH Air Pollution Control Report on the suitability test of the ambient air quality measuring system Model 5030i SHARP with PM2.5 pre-separator of the company Thermo Fisher Scientific for the component suspended particulate matter PM2.5, Report No.: 936/21209885/F Page 29 of 424 3. Description of the AMS tested 3.1 Measuring principle The ambient air measuring system Model 5030i SHARP operates combining the principles of particle light scattering (nephelometry) and beta attenuation. The designation SHARP stands for “Synchronised Hybrid Ambient Real-time Particulate”. The clever combination of a highly sensitive but potentially inaccurate measuring technique (NEPH) and a non-sensitive but highly accurate real-time measurement (BETA) aims at providing a precise and, at the same time, sensitive real-time measurement of fine dust. Nephelometry is based on the measurement of light radiation intensity, which is scattered by a totality of particles passing through a measured volume defined by the intersection of the illumination beam and the field of view of the detection optics. In contrast to particle counters, the measured volume shall be large in terms of inverse function of the concentration of particle numbers. The resulting signal is linearly proportional to the particle volume concentration for an aerosol with constant optical characteristics (particle size, form and refractive index), provided that the conditions of independent and single scattering that shall be maintained for the concentration range in focus are met. A nephelometer’s response R is defined by the following formula as the relation of the detection signal for light scattering to the mass concentration of the particles: where: I0 = irradiation intensity N = particle number concentration f(dp) = particle size distribution function Cm = mass concentration λ = illumination wavelength r = distance of scattered particles to detector i1,i2 = Lorenz-Mie scattering functions, alternately dependent on the relation of particle size to wavelength and on the refractive index f(λ) = combined dependence of wavelengths on emitter and detector F(θ) = angular scattering geometry of the optical system The high sensitivity of the nephelometer is thus accompanied by an overall dependence of the measured signal on the size of particles. This means that nephelometric measuring systems are, in contrast to gravimetric reference measurements, prone to have difficulties caused by shifts in response. 740300_2013_936_21209885F_EN.docx TÜV Rheinland Energie und Umwelt GmbH Air Pollution Control Page 30 of 424 Report on the suitability test of the ambient air quality measuring system Model 5030i SHARP with PM2.5 pre-separator of the company Thermo Fisher Scientific for the component suspended particulate matter PM2.5, Report No.: 936/21209885/F The nephelometer is therefore calibrated on site with a HEPA filter (zero point) and test aerosols for reference (with PM2.5 Sharp-Cut Cyclone connected upstream). Zero point checks can be performed anytime with help of the HEPA filter at the instrument inlet. Furthermore, the sensitivity of the nephelometer is continuously being re-calibrated by the radiometric measurement during operation. The principle of radiometric mass determination is based on the physics law of beta attenuation as effect of passing through a thin layer of matter. This relation is described as follows: where: Cβ = particle mass concentration A = particle collection area (filter spot) µm = mass attenuation coefficient (dependent on the energy of the beta source) Q = sampling flow rate t = sampling time = initial beta count rate (tare) ff = final beta count rate f0 The radiometric mass determination is calibrated on site with help of null and span foils. In using the “mass transfer standard” foil set (= span foil set), the radiometric measurement can be checked anytime for quality assurance purposes and, if required, calibrated. The output mass concentration Cm of Model 5030i SHARP is calculated as follows: where: Cm = mass concentration SHARP CN1 = nephelometer signal averaged over 1 minute Cβ = radiometric mass concentration, dynamically filtered over a variable time span CN2 = nephelometric concentration, dynamically filtered over a variable time span 740300_2013_936_21209885F_EN.docx TÜV Rheinland Energie und Umwelt GmbH Air Pollution Control Report on the suitability test of the ambient air quality measuring system Model 5030i SHARP with PM2.5 pre-separator of the company Thermo Fisher Scientific for the component suspended particulate matter PM2.5, Report No.: 936/21209885/F Page 31 of 424 Both Cβ and CN2 values are averaged in the same way over a variable time span. The averaging period depends on the variation coefficient of the mass concentration determined by the nephelometer itself. This coefficient is calculated using a mathematical algorithm, in which both the current nephelometer concentration and the concentration measured by the nephelometer one second before are integrated. The coefficient is calculated continuously and is averaged by a digital filter (one-minute time constant). The resulting factor is then multiplied by the maximum time constant of 720 min. In case of small and stable concentrations, the averaging period (= time constant) of the radiometric measurement is automatically extended to up to 12 h in order to increase the accuracy of mass concentration determination. For highly variable and large concentrations the process is exactly the opposite, i.e. the averaging time is reduced to up to 20 min. In practical use, however, the time constant is seldom less than 4 hours. The Cβ / CN2 ratio of the equation above is the so-called (auto) calibration factor, which applies a real-time calibration to the one-minute average of the nephelometer signal CN1. In order to optimise this continuous mass calibration of the nephelometer signal, software has been implemented in the Model 5030i SHARP measuring system, which ensures that the measured mass concentration remains unaffected by changes in the total particle population. 740300_2013_936_21209885F_EN.docx TÜV Rheinland Energie und Umwelt GmbH Air Pollution Control Report on the suitability test of the ambient air quality measuring system Model 5030i SHARP with PM2.5 pre-separator of the company Thermo Fisher Scientific for the component suspended particulate matter PM2.5, Report No.: 936/21209885/F Page 32 of 424 3.2 Functionality of the measuring system The Model 5030i SHARP measuring system combines the principles of aerosol light scattering (nephelometry) and beta attenuation (analogous to Model 5014i BETA, see test report 936/21209985/H). The particle sample passes through the PM2.5 sampling inlet with a flow rate of 1 m³/h (=16.67 l/min) and reaches via the heated sampling tube (DHS = dynamic heating system) the actual Model 5030i SHARP measuring instrument. The use of the dynamic heating system DHS ensures that the relative humidity of the air passing through the filter tape of the radiometric stage stays well below the point at which the collected particles accrete and condensation effects that may distort the measured value appear. It also allows for maintaining the relative humidity below a specified threshold in the nephelometer (set value during suitability testing: 50 % and 58 % rel. humidity). This system minimises the internal temperature rise ensuring negligible loss of semi-volatiles from the collected sample when the ambient relative humidity is below the threshold to which the heater is controlling. As the ambient relative humidity increases above the threshold, the applied heating is optimised to maintain the relative humidity threshold above the beta attenuation filter tape of the radiometric stage. The regulation of the DHS is carried out using the control variable “relative sample humidity” rH (here: nominal value < 50 % / 58 %, see Section 4.3 Field test) and the filter temperature sensor (here: maximum value of 30 °C). The heating conditions can be adjusted subject to the requirements of the measurement network. Figure 1 and Figure 5 show the path a particle sample travels within the Model 5030i SHARP measuring system after passing the sampling inlet and sampling tube, including the DHS. Figure 1: Sample path within the Model 5030i SHARP measuring system 740300_2013_936_21209885F_EN.docx TÜV Rheinland Energie und Umwelt GmbH Air Pollution Control Report on the suitability test of the ambient air quality measuring system Model 5030i SHARP with PM2.5 pre-separator of the company Thermo Fisher Scientific for the component suspended particulate matter PM2.5, Report No.: 936/21209885/F Page 33 of 424 Figure 2: Hardware components Model 5030i SHARP – Optics module Figure 3: Hardware components Model 5030i SHARP – Beta module 740300_2013_936_21209885F_EN.docx TÜV Rheinland Energie und Umwelt GmbH Air Pollution Control Report on the suitability test of the ambient air quality measuring system Model 5030i SHARP with PM2.5 pre-separator of the company Thermo Fisher Scientific for the component suspended particulate matter PM2.5, Report No.: 936/21209885/F Page 34 of 424 Figure 4: Picture of hardware components Model 5030i SHARP – Beta module 740300_2013_936_21209885F_EN.docx TÜV Rheinland Energie und Umwelt GmbH Air Pollution Control Report on the suitability test of the ambient air quality measuring system Model 5030i SHARP with PM2.5 pre-separator of the company Thermo Fisher Scientific for the component suspended particulate matter PM2.5, Report No.: 936/21209885/F Figure 5: Page 35 of 424 Diagram – Set-up of Model 5030i SHARP 740300_2013_936_21209885F_EN.docx TÜV Rheinland Energie und Umwelt GmbH Air Pollution Control Page 36 of 424 Report on the suitability test of the ambient air quality measuring system Model 5030i SHARP with PM2.5 pre-separator of the company Thermo Fisher Scientific for the component suspended particulate matter PM2.5, Report No.: 936/21209885/F The nephelometer assembly is downstream the heated tube. The fine dust follows a laminar path by the isolated nephelometer and reaches then the radial tube above the radiometric assembly. The nephelometer consists of a photometer based on light scattering with a pulsed near-IR LED operating at a central wavelength of 880 nm. The level of scattering is determined in a measured volume of 1 cm3 in forward direction at an angular range of 6080°. The design of the measuring inlet ensures a low internal background produced by optical reflection. The analogue raw signal is detected in cycles of one second, digitised for further processing and the minute average is calculated. The nephelometer module offers six automatically chosen measuring ranges which ensure that measured values as precise as possible are obtained. During the periodic zero adjustment procedures (performed as part of every filter change), the zero adjustment magnetic valve on the rear side is activated and HEPA filtered air (= free of suspended particles) is admitted into the nephelometer. Every range is then zeroed again. The results of the zero adjustment can be read on the display and are as C-link command available. At the location at which the nephelometer is attached to the enclosure of measuring system, an isolated radial tube hits the sampling tube. The nephelometer module can thereby be easily detached from the actual measuring system. This makes it possible to reconfigure the Model 5030i SHARP measuring system (combination of nephelometric and radiometric measurements) into the Model 5014i BETA measuring system (see test report 936/21209885/H). After passing the nephelometer, the particles of the particle sample are deposited on the glass fibre filter tape for radiometric measurement. The particles are collected on the filter tape up to a specified threshold (during test: fast-forward of filter tape after 8 h or when mass is >1500 µg on the filter tape or when the deviation of the current flow rate from the nominal flow rate is more than 2.5 %). The filter tape can be found between the proportional detector and the 14C beta source. The beta ray is transmitted from the bottom upwards passing through the filter tape and the accumulated particle layer. The intensity of the beta ray is attenuated by the increasing mass load, thus reducing its intensity. The reduced beta intensity is then measured by the proportional detector. The mass on the filter tape is calculated from the continuous integrated count rate. The determined count rate is continuously corrected with regard to changes in the air density. Furthermore, the radiometric mass determination is optimised by the simultaneous determination and consideration of the natural α activity of aerosols. This additional α count rate serves the purpose of measuring radon, which causes undesirable interference in the radiometric mass determination of particles and must therefore be compensated. In order to keep the sampling flow rate at a constant nominal value, the continuous measurement of the flow rate as well as its adjustment is carried out by means of a proportional valve. The PM concentrations are shown on the display on the front side of the measuring system as SHARP (= hybrid values), PM (= radiometrically measured values analogous to Model 5014i BETA) and NEPH (= values measured with scattered light). The measured values can be obtained through different output paths (analogue, digital, Ethernet). 740300_2013_936_21209885F_EN.docx TÜV Rheinland Energie und Umwelt GmbH Air Pollution Control Report on the suitability test of the ambient air quality measuring system Model 5030i SHARP with PM2.5 pre-separator of the company Thermo Fisher Scientific for the component suspended particulate matter PM2.5, Report No.: 936/21209885/F 3.3 Page 37 of 424 AMS scope and set-up The measuring system comprises the PM2.5 sampling inlet, the heated sampling tube (dynamic heating system DHS), the (optional) extension tube, the ambient air sensor (including radiation protection shield), the vacuum pump, the nephelometer module (= SHARP optics module), the central unit (= SHARP beta module, identical in design to the 5014i measuring system, see test report 936/21209885/H) including glass fibre filter tape, the respective connection lines, cables and adapters, roof bushing with flange, and a manual in German. Figure 6: Model 5030i SHARP (SHARP optics modules (top) + SHARP beta module (bottom)) 740300_2013_936_21209885F_EN.docx TÜV Rheinland Energie und Umwelt GmbH Air Pollution Control Report on the suitability test of the ambient air quality measuring system Model 5030i SHARP with PM2.5 pre-separator of the company Thermo Fisher Scientific for the component suspended particulate matter PM2.5, Report No.: 936/21209885/F Page 38 of 424 As sampling inlet, a PM2.5 inlet (manufacturer: Digitel, type: DPM2.5/01/00/16) which serves as pre-separator for suspended particles sucked in from outside air, is used. The instruments are operated at a constant volume flow rate adjusted to 16.67 l/min = 1.0 m³/h. It is also possible to use PM10 and PM1 sampling inlets instead. Figure 7: (European) PM2.5 sampling inlet for Model 5030i SHARP The heated sampling tube (approx. 0.9 m long) and the (optional) extension tube (approx. 1.8 m long) connect the sampling inlet to the actual measuring system. The adjustment of the sample heater (dynamic heating system DHS) is carried out as described in Section 3.2 Functionality of the measuring system. 740300_2013_936_21209885F_EN.docx TÜV Rheinland Energie und Umwelt GmbH Air Pollution Control Report on the suitability test of the ambient air quality measuring system Model 5030i SHARP with PM2.5 pre-separator of the company Thermo Fisher Scientific for the component suspended particulate matter PM2.5, Report No.: 936/21209885/F Figure 8: Heated sampling tube (DHS) Figure 9: Model 5030i SHARP measuring system Page 39 of 424 740300_2013_936_21209885F_EN.docx TÜV Rheinland Energie und Umwelt GmbH Air Pollution Control Report on the suitability test of the ambient air quality measuring system Model 5030i SHARP with PM2.5 pre-separator of the company Thermo Fisher Scientific for the component suspended particulate matter PM2.5, Report No.: 936/21209885/F Page 40 of 424 Figure 10: Model 5030i SHARP measuring system – Optics module Figure 11: Model 5030i SHARP measuring system – Beta module 740300_2013_936_21209885F_EN.docx TÜV Rheinland Energie und Umwelt GmbH Air Pollution Control Report on the suitability test of the ambient air quality measuring system Model 5030i SHARP with PM2.5 pre-separator of the company Thermo Fisher Scientific for the component suspended particulate matter PM2.5, Report No.: 936/21209885/F Page 41 of 424 Figure 12: Model 5030i SHARP measuring system (Systems 1 and 2 from right) at measuring station Figure 13: Vacuum pump (type: GAST Model 75R647, PN 110836-00) 740300_2013_936_21209885F_EN.docx TÜV Rheinland Energie und Umwelt GmbH Air Pollution Control Report on the suitability test of the ambient air quality measuring system Model 5030i SHARP with PM2.5 pre-separator of the company Thermo Fisher Scientific for the component suspended particulate matter PM2.5, Report No.: 936/21209885/F Page 42 of 424 The measuring system is operated through pushbuttons and an LCD display on the front side of the instrument. Here, the user can retrieve measurement data and instrument information, change parameters and perform tests for controlling the functionality of the measuring system. Figure 14: Main screen of the user interface 740300_2013_936_21209885F_EN.docx TÜV Rheinland Energie und Umwelt GmbH Air Pollution Control Report on the suitability test of the ambient air quality measuring system Model 5030i SHARP with PM2.5 pre-separator of the company Thermo Fisher Scientific for the component suspended particulate matter PM2.5, Report No.: 936/21209885/F Page 43 of 424 The main screen is on the top level of the user interface. It usually displays the SHARP concentration. By scrolling down with the arrow buttons ↑↓, the screens for PM concentration (= BETA), NEPH concentration, ambient air conditions, flow conditions and mass sensor data are displayed. In addition, the main screen displays a status bar with the current time as well as different status messages (e.g. the current mode the nephelometer is set to). In some cases, the following symbols can be observed: The main menu for operating the measuring system can be reached by pressing . This button always leads to the previous sub-menu. The four keys directly below the LCD display are programmable soft keys – by default, the keys lead to the sub-menus “RANGE”, “AVG”, “DIAGS” and “ALARM”. The sub-menu “Range” allows for setting the unit the concentration values are to be output in and adjusting standard as well as customised measuring ranges. In the sub-menu “Integration Time” it is possible to adjust the averaging period of the radiometric measurement within the range 15 – 60 min (by default set to 20 min). The sub-menu “24-Hour Average” allows the user to define the start time of the 24-hour averaging period of the concentration measurement. The “Calibration Factors” sub-menu displays the calibration factors adjusted in the measuring system as well as those determined during manual and/or automatic calibrations. It is also possible to adjust them using this menu. The “Instrument Controls” sub-menu may be selected to control various instrument operational parameters. It allows for parameterising the flow rate, turning the pump on and off, configuring the sample heater DHS, adjusting filter tape control operations (moving the tape manually, adjusting a reliable mass limit during test: 1500 µg, setting a time and interval for the next filter tape change, etc.), determining volumetric conditions, configuring the internal data logging and communication settings, adjusting the screen contrast, turning the service mode on and off (wrench icon appears on the main screen when service mode is on) as well as setting up the date and time. 740300_2013_936_21209885F_EN.docx TÜV Rheinland Energie und Umwelt GmbH Air Pollution Control Page 44 of 424 Report on the suitability test of the ambient air quality measuring system Model 5030i SHARP with PM2.5 pre-separator of the company Thermo Fisher Scientific for the component suspended particulate matter PM2.5, Report No.: 936/21209885/F The “Diagnostics” sub-menu provides access to diagnostic information and functions, e.g. software version, current reading of the different sensors, radiometric detector and nephelometer status, status of the analogue and digital inputs and outputs, etc. This information is especially useful when troubleshooting the instrument. The “Alarms” sub-menu displays the status of the measuring system with regard to potentially upcoming alarm messages. The bell icon on the main screen indicates that one (or more) alarm(s) are active. The “Service” sub-menu (available only when the service mode is activated on the “Instrument Controls” sub-menu if on, the wrench icon appears on the main screen) provides access to advanced diagnostic functions. These include, for example, the adjustment of the sensors with regard to ambient air temperature, flow temperature, ambient humidity, air pressure and flow. Furthermore, it allows for checking / adjusting the radiometric determination / mass coefficient, calibrating the detector (to be performed by a service technician of the manufacturer only) and nephelometer as well as setting up the analogue inputs and outputs. The “Password” sub-menu allows the user to configure and activate password protection for the instrument (the lock icon on the main screen indicates that password protection is active). 740300_2013_936_21209885F_EN.docx TÜV Rheinland Energie und Umwelt GmbH Air Pollution Control Report on the suitability test of the ambient air quality measuring system Model 5030i SHARP with PM2.5 pre-separator of the company Thermo Fisher Scientific for the component suspended particulate matter PM2.5, Report No.: 936/21209885/F Page 45 of 424 Figure 15 provides an overview of the menu-assisted firmware. Figure 15: Flow chart – Overview of menu-assisted firmware 740300_2013_936_21209885F_EN.docx TÜV Rheinland Energie und Umwelt GmbH Air Pollution Control Report on the suitability test of the ambient air quality measuring system Model 5030i SHARP with PM2.5 pre-separator of the company Thermo Fisher Scientific for the component suspended particulate matter PM2.5, Report No.: 936/21209885/F Page 46 of 424 In addition to the possibility of direct communication via pushbuttons/display, the measuring system may be completely operated and parameterised over RS232/RSRS485 and Ethernet – both directly from a PC and indirectly via modem or network. During suitability testing, the measuring system was accessed over Ethernet and the terminal software iPort, especially for downloading the measurement data saved internally. The nature and scope of internal data logging (logging interval, recorded parameters) can be configured on the “Instrument Controls” menu. This remote operation of the measuring system contains the same features as direct operation. The measuring system supports C-Link, MODBUS, Gesytec (Bayern-Hessen), ESM, Streaming Data and NTP protocols. To perform external zero checks of the measuring system, a zero filter is mounted to the AMS inlet. This filter ensures the supply of air free of suspended particles. Figure 16: Zero filter for supplying air free of suspended particles and its connection adapter 740300_2013_936_21209885F_EN.docx TÜV Rheinland Energie und Umwelt GmbH Air Pollution Control Report on the suitability test of the ambient air quality measuring system Model 5030i SHARP with PM2.5 pre-separator of the company Thermo Fisher Scientific for the component suspended particulate matter PM2.5, Report No.: 936/21209885/F Page 47 of 424 In order to check and, if required, calibrate the radiometric measurement, the manufacturer provides a set of mass transfer standard foils. This set comprises one null foil and two span foils. The null foil has the same approximate mass as a clean filter spot and the span foil is a calibrated mass increase above the null foil. Therefore, the foils come in a set and must not be mixed with other sets. Figure 17: Set with foil holder and test foils It is not possible to produce a reproducible signal for the sensitivity of the nephelometer using external test standards. However, the nephelometer is regularly flushed with zero air during operation (auto-zero function as part of every filter change), thus determining and documenting the position of the zero point on a regular basis. Since the nephelometer is continuously calibrated with a very stable radiometric measurement, a separate examination of the stability of the nephelometer’s signal under operating conditions can be omitted. A special adapter for connecting an external flow measuring instrument is mounted to the inlet in order to check the leak tightness of the measuring system. The leak test adapter produces a high vacuum in the system. The leak tightness of the measuring system can be evaluated by comparing the flow rate measured by the system (at high vacuum) and the flow rate at the inlet (= external flow measuring instrument). If the difference exceeds the manufacturer’s specification of 420 ml/min (= approx. 2.5 % of the nominal flow rate), the system shall be tested for leaks. 740300_2013_936_21209885F_EN.docx TÜV Rheinland Energie und Umwelt GmbH Air Pollution Control Report on the suitability test of the ambient air quality measuring system Model 5030i SHARP with PM2.5 pre-separator of the company Thermo Fisher Scientific for the component suspended particulate matter PM2.5, Report No.: 936/21209885/F Page 48 of 424 Figure 18: Leak test adapter 740300_2013_936_21209885F_EN.docx TÜV Rheinland Energie und Umwelt GmbH Air Pollution Control Report on the suitability test of the ambient air quality measuring system Model 5030i SHARP with PM2.5 pre-separator of the company Thermo Fisher Scientific for the component suspended particulate matter PM2.5, Report No.: 936/21209885/F Page 49 of 424 Table 3 contains a list of important technical data of the ambient air quality measuring system Model 5030i SHARP for suspended particles. Table 3: Technical data for Model 5030i SHARP (manufacturer’s specifications) Dimensions / Weight Model 5030i SHARP Measuring system 425 x 584 x 219 mm / 19 kg (without pump) Sampling tube Approx. 0.9 m long, isolated heated tube + 1.8 m extension tube Sampling inlet Depends on manufacturer, during suitability testing: Digitel DPM2.5/01/00/16 Power requirements Analyser: 100-240 V, 50-60 Hz Pump: 115 V, 50-60 Hz Power input Approximate maximum of 880 W Ambient conditions Temperature +5 to +40 °C (during suitability testing) Humidity Non-condensing Sample flow rate (Inlet) 16.67 l/min = 1 m³/h Nephelometer IR LED, 6 mW, 880 nm Radiometry Source Detector Hybrid silicone amplifier Source 14 Detector Proportional radiation detector Temporal resolution SHARP C, <3.7 MBq (< 100 µCi) 1 min (at data output rate of 1 s) Parameter: Filter change Filter change: time (cycle) 0 h – 100 h Default: 8 h (3 changes per day) Filter change: particle mass 0 – 9999 µg Default: 1500 µg Parameter: Sample heater Max. heating temperature 30 °C (during suitability testing) Nominal relative humidity 50 % / 58 % (during suitability testing) Data storage capacity (internal) Max. 190,000 datasets (> 650 d at storage intervals of 5 min) Instrument inputs and outputs Outputs: Analogue 0-20 mA or 4-20 mA (optional) Digital RS232, RS485, TCP/IP, 10 status relays Inputs: 16 digital inputs 8 analogue inputs (optional) 740300_2013_936_21209885F_EN.docx TÜV Rheinland Energie und Umwelt GmbH Air Pollution Control Page 50 of 424 Report on the suitability test of the ambient air quality measuring system Model 5030i SHARP with PM2.5 pre-separator of the company Thermo Fisher Scientific for the component suspended particulate matter PM2.5, Report No.: 936/21209885/F Protocols Communication with PC over Ethernet and iPort software C-Link, MODBUS, Gesytec, ESM, Data Streaming and NTP Simultaneous connections from different locations over Ethernet Status signals / Error messages Available, for an overview please refer to Chapter 6 of the instruction manual 740300_2013_936_21209885F_EN.docx TÜV Rheinland Energie und Umwelt GmbH Air Pollution Control Report on the suitability test of the ambient air quality measuring system Model 5030i SHARP with PM2.5 pre-separator of the company Thermo Fisher Scientific for the component suspended particulate matter PM2.5, Report No.: 936/21209885/F Page 51 of 424 4. Test programme 4.1 General The suitability test was carried out with two instruments of identical design with the serial numbers SN 1 and SN 2. The test started in the year 2009 with the software version V00.05.41.114. The software was steadily enhanced and optimised during the course of testing. At the beginning of the field test in January 2011, software version V01.00.01.197 was implemented. This version was used during the whole field test. The software was updated to version V01.00.03.225 after conclusion of the regular field test and before starting the remaining laboratory tests. This software version was as well used for the additional campaign “Bornheim, Summer 2013”. In the meantime the software version was updated another time due to a discontinuation of a processor board to version V02.00.00.232+. The following software modifications were implemented: Table 4: Overview of software versions during suitability testing Version Description of change V00.05.41.114 Initial version V01.00.00.163 Status during suitability test Installed during laboratory test, part 1 Not installed 1. Integration of support for Model 5030i 2. Improvement of algorithms for controlling RH and TEMP 3. Addition of “Carriage return“ to ESM protocol 4. Replacement of term “Zero“ with “Offset“ 5. Adjustment of digital filter for “Mass” and “PM” to 60 min 6. Elimination of sample temperature from user interface 7. Raise of limit for Temp offset values to +/10 °C 8. Implementation of mass determination without flow in service mode for improving the calibration of mass measurement 9. Implementation of the “Infinite Mass Accumulation Method“ 740300_2013_936_21209885F_EN.docx TÜV Rheinland Energie und Umwelt GmbH Air Pollution Control Report on the suitability test of the ambient air quality measuring system Model 5030i SHARP with PM2.5 pre-separator of the company Thermo Fisher Scientific for the component suspended particulate matter PM2.5, Report No.: 936/21209885/F Page 52 of 424 V01.00.01.197 Installed during field 1. Release of Model 5030i code 2. Integration time variable for mass and con- test centration determination (range 15 – 60 min) added 3. Necessary code adjustments for the amplifier, due to the change from batteries to capacitor for buffering high voltage supply for up to 2 h during power outages 4. Increase of filter tape movements per roll by approx. 50 % 5. Change of filter tape after three failed attempts no longer possible 6. Elimination of minor bugs V01.00.02.199 1. Calibration coefficient is frozen at c (BETA) Not installed < 2.5 µg/m³ and/or c (NEPH) < 1 µg/m³ instead of c (BETA) < 2.5 µg/m³ and/or c (SHARP) < 1 µg/m³ 2. Flow temp replaced by sample temp in Bayern-Hessen protocol 3. Increase of accuracy of “diag volts“ command V01.00.03.225 1. Modification of key variables and soft keys for USB keypad support 2. Alarms added to the list of digital outputs 3. Additional parameters for recording added 4. Changes to timing procedure after filter exchange – no calculations in the first 15 min following pump stop 5. Update of algorithms for calculating ambient temperature, ambient humidity and flow temperature in order to provide a more precise sample humidity value (sample rH) 6. Recording of amplification and mode for NEPH added 7. Update of pressure calculations smoothing in order to improve flow control 8. Update of heating control (PID control optimised) V02.00.00.232+ 1. Modification to new i-series processor board Not installed, exam110570 ined during regular 2. Menu navigation “Servise/Pres/Vacuum Cal- production audit. ibration/Vac/Flow” changed 3. Diagnostics/Voltages/detector Board menu no longer locks up 4. Title line on “Calibration factors/Neph BKG Values/restore Prev Values” verschoben 740300_2013_936_21209885F_EN.docx Installed during laboratory test, part 2, as well as the additional campaign “Bornheim, Summer 2013” TÜV Rheinland Energie und Umwelt GmbH Air Pollution Control Report on the suitability test of the ambient air quality measuring system Model 5030i SHARP with PM2.5 pre-separator of the company Thermo Fisher Scientific for the component suspended particulate matter PM2.5, Report No.: 936/21209885/F Page 53 of 424 5. “range” Clink command now deliberately writes a response in every case 6. Several parameters are no longer displayed when the unit is password locked 7. Remove blanket rejection of “set” for the “sp field” Clink command The reliability of the AMS was consistently increased with every change. The changes introduced up to version V02.00.00.232+ are not expected to affect the performance of the AMS significantly. The suitability test comprised a laboratory test for determining the system’s performance characteristics and a field test carried out over several months at different locations. All determined concentrations are given as µg/m³ (operating conditions). The report in hand provides a description of the minimum requirement for each test item in accordance with the number and wording used in standards [1, 2, 3, 4]. 740300_2013_936_21209885F_EN.docx TÜV Rheinland Energie und Umwelt GmbH Air Pollution Control Page 54 of 424 4.2 Report on the suitability test of the ambient air quality measuring system Model 5030i SHARP with PM2.5 pre-separator of the company Thermo Fisher Scientific for the component suspended particulate matter PM2.5, Report No.: 936/21209885/F Laboratory test The laboratory test was carried out with two identical instruments of the type Model 5030i SHARP with serial numbers SN 1 and SN 2. In conformity with standards [1, 2], the following performance criteria were tested in the laboratory: Laboratory test, part 1 (2009): • • • Description of system functions Determination of dependence of sensitivity on ambient temperature Determination of dependence of sensitivity on mains voltage Laboratory test, part 2 (2012/2013): • • • • Detection limit Determination of the dependence of zero point / sensitivity on ambient temperature Determination of the dependence of zero point / sensitivity on the mains voltage Tightness of the sampling system The following auxiliary devices were used to determine the system characteristics during the laboratory test: • Climatic chamber (temperature range from –20 °C to +50 °C, accuracy < 1 °C) • Adjustable isolating transformer • Zero filter for external zero point checks • Span foil sets The measured values were recorded internally by the instruments. Once stored in the systems, they were transmitted via Ethernet to the iPort software for read-out. The laboratory tests and results are presented in Section 6. 740300_2013_936_21209885F_EN.docx TÜV Rheinland Energie und Umwelt GmbH Air Pollution Control Report on the suitability test of the ambient air quality measuring system Model 5030i SHARP with PM2.5 pre-separator of the company Thermo Fisher Scientific for the component suspended particulate matter PM2.5, Report No.: 936/21209885/F 4.3 Page 55 of 424 Field test The field test was carried out with two identical systems with the serial numbers: System 1: SN 1 System 2: SN 2 The following performance criteria were tested in the field: • Comparability of the candidates according to the Guide “Demonstration of Equivalence of Ambient Air Monitoring Methods” • Comparability of the candidates with the reference methods according to the Guide “Demonstration of Equivalence of Ambient Air Monitoring Methods” • Calibratability, analytical function • Reproducibility • Zero drift and sensitivity • Dependence of the measured values on sample humidity • Maintenance interval • Availability • Constancy of sample volumetric flow • Overall uncertainty of the test candidates The following auxiliary devices were used during the field test: • Measuring cabinet provided by TÜV Rheinland, air-conditioned to approx. 20 °C • Measuring cabinet for low-volume samplers provided by DEFRA (UK), air-conditioned to approx. 20 °C • Weather station (WS 500 manufactured by ELV Elektronik AG for use in Germany and MK III Series manufactured by Rainwise (US) for use in the UK) for the determination of meteorological characteristics such as air temperature, air pressure, air humidity, wind velocity, wind direction and precipitation • 2 reference samplers LVS3 for PM2.5 in accordance with point 5 • 1 gas meter, dry • 1 mass flow meter Model 4303 (manufactured by TSI) • 1 mass flow meter type BIOS volumeter (manufactured by BIOS) for use in the UK • 1 mass flow meter type TetraCal venturi (manufactured by BGI), for use in the UK • Power consumption measuring device type Metratester 5 (manufactured by Gosen Metrawatt) • Zero filter for external zero point checks • Span foil sets Two Model 5030i SHARP systems and two PM2.5 reference instruments were each operated simultaneously for 24 h during the field test. The reference equipment worked discontinuously, i.e. the filter had to be changed manually after each sample drawing. 740300_2013_936_21209885F_EN.docx TÜV Rheinland Energie und Umwelt GmbH Air Pollution Control Report on the suitability test of the ambient air quality measuring system Model 5030i SHARP with PM2.5 pre-separator of the company Thermo Fisher Scientific for the component suspended particulate matter PM2.5, Report No.: 936/21209885/F Page 56 of 424 The impaction plates of the PM2.5 sampling inlets of the reference devices were cleaned approx. every 2 weeks and lubricated with silicone grease in order to guarantee a safe separation and deposition of the particulate. The PM2.5 sampling inlets of the candidates were cleaned approx. every 4 weeks. The inlet was cleaned according to the manufacturer’s instruction while taking into account the local suspended particle concentrations. The flow rate was tested on each candidate and reference device prior to and after each change of location with a dry gas meter and a mass flow meter connected with a hose to the air inlet. Test sites and arrangement of the measuring systems During the field test, the measuring systems were arranged in such a way that the sampling inlets were positioned outside the measuring cabinet above its roof. The central units of both candidates were located inside the air-conditioned measuring cabinet. The entire reference equipment (LVS3) was placed outdoors on the roof of the cabinet. The field test was carried out at the following test sites: Table 5: Field test sites No. Measurement site Period Characteristics 1 Cologne, parking lot, winter 03/2011 – 05/2011 Urban background 2 Bornheim, motorway parking lot, summer 07/2011 – 11/2011 Rural structure + traffic influence 3 Bornheim, motorway parking lot, winter 01/2012 – 03/2012 Rural structure + traffic influence 4 Teddington, summer 07/2012 – 10/2012 Urban background 740300_2013_936_21209885F_EN.docx TÜV Rheinland Energie und Umwelt GmbH Air Pollution Control Report on the suitability test of the ambient air quality measuring system Model 5030i SHARP with PM2.5 pre-separator of the company Thermo Fisher Scientific for the component suspended particulate matter PM2.5, Report No.: 936/21209885/F Page 57 of 424 Figure 19 to Figure 22 show the course of PM2.5 concentrations at the field test sites obtained with the reference systems. Conc. PM2.5 (Ref.) in µg/m³ 70 60 50 40 30 20 10 Figure 19: 03.05.2011 26.04.2011 19.04.2011 12.04.2011 05.04.2011 29.03.2011 22.03.2011 08.03.2011 15.03.2011 0 Course of PM2.5 concentrations (reference) at the test site “Cologne, parking lot, winter“ Conc. PM2.5 (Ref.) in µg/m³ 70 60 50 40 30 20 10 Figure 20: 07.11.2011 31.10.2011 24.10.2011 17.10.2011 10.10.2011 03.10.2011 26.09.2011 19.09.2011 12.09.2011 05.09.2011 29.08.2011 22.08.2011 15.08.2011 08.08.2011 01.08.2011 25.07.2011 0 Course of PM2.5 concentrations (reference) at the test site “Bornheim, motorway parking lot, summer” 740300_2013_936_21209885F_EN.docx TÜV Rheinland Energie und Umwelt GmbH Air Pollution Control Report on the suitability test of the ambient air quality measuring system Model 5030i SHARP with PM2.5 pre-separator of the company Thermo Fisher Scientific for the component suspended particulate matter PM2.5, Report No.: 936/21209885/F Page 58 of 424 Conc. PM2.5 (Ref.) in µg/m³ 70 60 50 40 30 20 10 Figure 21: 05.03.2012 27.02.2012 20.02.2012 13.02.2012 06.02.2012 30.01.2012 23.01.2012 16.01.2012 0 Course of PM2.5 concentrations (reference) at the test site “Bornheim, motorway parking lot, winter“ Conc. PM2.5 (Ref.) in µg/m³ 70 60 50 40 30 20 10 Figure 22: 05.10.2012 27.09.2012 19.09.2012 11.09.2012 03.09.2012 26.08.2012 18.08.2012 10.08.2012 02.08.2012 25.07.2012 17.07.2012 0 Course of PM2.5 concentrations (reference) at the test site “Teddington, summer“ 740300_2013_936_21209885F_EN.docx TÜV Rheinland Energie und Umwelt GmbH Air Pollution Control Report on the suitability test of the ambient air quality measuring system Model 5030i SHARP with PM2.5 pre-separator of the company Thermo Fisher Scientific for the component suspended particulate matter PM2.5, Report No.: 936/21209885/F Page 59 of 424 The following figures show the measuring cabinet at the field test sites Cologne (parking lot), Bornheim (motorway parking lot) and Teddington. Figure 23: Field test site Cologne, parking lot Figure 24: Field test site Bornheim, motorway parking lot 740300_2013_936_21209885F_EN.docx TÜV Rheinland Energie und Umwelt GmbH Air Pollution Control Report on the suitability test of the ambient air quality measuring system Model 5030i SHARP with PM2.5 pre-separator of the company Thermo Fisher Scientific for the component suspended particulate matter PM2.5, Report No.: 936/21209885/F Page 60 of 424 Figure 25: Field test site Teddington In addition to the measuring systems used for determining the content of suspended particulate matter in ambient air, a data acquisition system was installed at the cabinet/measurement site in order to determine the meteorological characteristics. Air temperature, pressure and humidity as well as wind velocity, direction and precipitation were continuously assessed and their half-hourly averages recorded. The installation of the cabinet itself and the arrangement of the sampling probes are described as follows: • Height of cabinet roof: 2.50 m • Height of the sampling point for testing 1.10 m / 0.51 m above the cabinet roof • Reference instrument 3.61 / 3.01 m above ground • Height of weather vane: 4.5 m above ground (Germany) 2.5 m above ground (UK) Table 6 contains, therefore, not only an overview of the most important meteorological factors determined during measurement at the four test sites, but also an overview of the PM ratio during the entire test. The individual values are presented in annexes 5 and 6. 740300_2013_936_21209885F_EN.docx TÜV Rheinland Energie und Umwelt GmbH Air Pollution Control Report on the suitability test of the ambient air quality measuring system Model 5030i SHARP with PM2.5 pre-separator of the company Thermo Fisher Scientific for the component suspended particulate matter PM2.5, Report No.: 936/21209885/F Table 6: No. of (reference) Page 61 of 424 Ambient conditions at the field test sites, daily mean values paired values Cologne, parking lot, winter Bornheim, motorway parking lot, summer Bornheim, motorway parking lot, winter Teddington (UK), summer 48 87 41 65 38.8 – 86.3 61.7 27.1 – 88.1 57.3 43.1 – 91.1 73.0 36.2 – 70.5 53.9 11.0 – 44.8 26.2 0.0 - 53.3 21.6 10.4 – 73.2 25.2 10.8 – 70.8 34.3 5.0 – 22.1 12.3 5.2 – 24.5 15.5 -8.9 – 10.4 1.9 8.9 – 24.2 16.4 998 – 1031 1012 995 – 1024 1008 1003 – 1031 1018 971 – 1010 996 34.7 – 90.4 61.8 53.8 – 91.1 75.1 50.2 – 90.5 77.7 47.1 – 94.6 72.7 0.3 – 5.3 1.9 0.3 – 4.1 1.4 0.6 – 5.7 2.1 0.1 – 1.9 0.5 0.0 – 11.1 0.9 0.0 – 51.7 2.7 0.0 – 12.8 1.5 0.0 – 30.0 1.6 Ratio PM2,5/PM10 [%] Range Average Ratio Volatiles/PM2,5 [%]* Range Average Air temperature [°C] Range Average Air pressure [hPa] Range Average Rel. humidity [%] Range Average Wind velocity [m/s] Range Average Precipitation [mm/d] Range Average * The content of volatiles was measured with a TEOM-FDMS system operated simultaneously 740300_2013_936_21209885F_EN.docx TÜV Rheinland Energie und Umwelt GmbH Air Pollution Control Report on the suitability test of the ambient air quality measuring system Model 5030i SHARP with PM2.5 pre-separator of the company Thermo Fisher Scientific for the component suspended particulate matter PM2.5, Report No.: 936/21209885/F Page 62 of 424 Parameterisation of the relative humidity threshold for the Dynamic Heating System DHS The Model 5030i SHARP measuring system uses a heated sampling system in order to prevent the effects of condensation in the system (especially in the nephelometer and filter tape). The heater must also be designed in such a way that the potential risk of volatile particle loss is minimised. The Dynamic Heating System DHS implemented in the Model 5030i SHARP measuring system ensures that the relative humidity of the air passing through the filter tape at the radiometric stage is kept well below the point at which the collected particles adhere together, thus producing disrupting condensation effects. Furthermore, the relative humidity in the nephelometer is adjusted below the specified limit. The system minimises the increase of internal temperature. This ensures a negligible loss of semi-volatile particle components, provided that the relative ambient humidity is maintained below the limit to which the heater is adjusted. As that the relative ambient humidity rises above the threshold, the applied heating is optimised to maintain the relative humidity threshold above the filter tape of the radiometric stage. The DH-System is adjusted using the controlled variable rH (= “rel. ambient humidity of the sample” calculated from the rel. humidity of ambient air, ambient temperature and sample temperature) and the filter temperature sensor. The heating conditions can be adjusted according to the requirements of each measurement network. The parameters were adjusted as follows during suitability testing: Rel. air humidity threshold: 50 % Filter temperature sensor: max. 30 °C This means that the heater turns on as soon as the relative humidity rH rises above 50 %. However, the filter temperature does not exceed 30 °C. The relative humidity threshold value of 50 % was specified by the manufacturer, since it represents the filter conditioning value of the gravimetric reference method. None of the slopes or offsets determined from the comparison with the reference method were significantly visible during the comparison campaigns at the test sites Cologne (winter), Bornheim (summer) and Bornheim (winter). All expanded measurement uncertainties calculated according to the Guide “Demonstration of Equivalence of Ambient Air Monitoring Methods” [4] lay below the maximum permissible value of 25 % without application of correction factors. After concluding the measurements in Germany, the final comparison campaign started in summer of 2012 at the test site Teddington. During this campaign, an underestimation of the suspended particulate content measured by the candidates was observed in comparison with the reference method. The evaluation of the campaign led to the following results: Table 7: Evaluation of the Teddington (summer) campaign with rH adjusted to 50 % Orthogonal Regression PM2.5 5030i Sharp Limit Value of 30 μg m-3 Dataset nc-s r2 Slope (b) +/- ub Intercept (a) +/- ua WCM / % % ≥ 17 μg m-3 SN1 Teddington Summer w ith 50 % RH Setting 38 0,856 0,902 +/- 0,058 0,305 +/- 0,493 20,03 5,3 SN2 Teddington Summer w ith 50 % RH Setting 38 0,850 0,819 +/- 0,054 0,965 +/- 0,459 31,07 5,3 740300_2013_936_21209885F_EN.docx TÜV Rheinland Energie und Umwelt GmbH Air Pollution Control Report on the suitability test of the ambient air quality measuring system Model 5030i SHARP with PM2.5 pre-separator of the company Thermo Fisher Scientific for the component suspended particulate matter PM2.5, Report No.: 936/21209885/F Page 63 of 424 100 SN1 Teddington Summer with 50 % RH Setting 90 PM2.5 5030i Sharp / μg m-3 80 70 60 50 40 30 20 10 0 0 10 20 30 40 50 60 70 80 90 100 PM2.5 Reference / μg m-3 Comparison of reference and candidate SN 1, measured component PM2.5, Teddington (summer), relative humidity threshold adjusted to 50 % Figure 26: 100 SN2 Teddington Summer with 50 % RH Setting 90 PM2.5 5030i Sharp / μg m-3 80 70 60 50 40 30 20 10 0 0 10 20 30 40 50 60 70 80 90 100 PM2.5 Reference / μg m-3 Figure 27: Comparison of reference and candidate SN 2, measured component PM2.5, Teddington (summer), relative humidity threshold adjusted to 50 % 740300_2013_936_21209885F_EN.docx TÜV Rheinland Energie und Umwelt GmbH Air Pollution Control Page 64 of 424 Report on the suitability test of the ambient air quality measuring system Model 5030i SHARP with PM2.5 pre-separator of the company Thermo Fisher Scientific for the component suspended particulate matter PM2.5, Report No.: 936/21209885/F Since these parameters differ from the ones determined during previous campaigns, the possible causes for this discrepancy were analysed. In this context, the volatile content in fine dust was reviewed in detail. The content of volatiles in suspended particulate matter had been determined in measurements carried out in parallel with measuring systems of the type TEOM-FDMS. The results showed that the test site Teddington (summer) is characterised by a generally very low level of suspended particulate matter and a significantly high content of volatile dust components. The average content of volatiles in suspended particulate matter PM2.5 amounted to approx. 35 % during the campaign carried out in Teddington (summer), compared to a content of approx. 20 – 25 % during the three previous campaigns. Based on similar experiences during measurement campaigns in China, the manufacturer suggested a change in the parameterisation of the relative air humidity threshold from 50 % to 58 % to solve the problem. This would activate the heater only when the relative humidity exceeds 58 % instead of 50 % as in the previous campaigns. The Teddington (summer) comparison campaign was subsequently repeated using the new parameters (average volatile content during this campaign: 34.3 %). No problems demonstrating the equivalence during this measurement campaign were detected after applying this change. The results are presented in detail in Section 6.1 5.4.10 Calculation of the expanded uncertainty of the instruments. Table 6 and Annex 6 of this report present the results of the measurement campaigns with regard to content of volatiles in suspended particulate matter PM2.5. To qualify the necessary change of the threshold for the relative humidity to control the sample heating from originally 50% to 58% (necessary due to the results of the campaign in Teddington UK), an additional campaign at one of the German sites with two candidate systems with settings of each 50 % and 58 % was performed (decision of the 32. Expert discussion ”test reports” of May 14/15 201) Table 2 gives an overview on the additional campaign. The results of this campaign are shown in chapter 4.3 Field test from page 55. The tests were performed at the site Bornheim with the candidate systems SN 1 and SN 2. The candidates were set up as follows: Component threshold for heater regulation SN 1 PM2.5 58 % 50 % SN 2 PM2.5 The following test program was performed: • comparison campaign with a minmum of 40 valid paired values reference vs candidate system • determination of the uncertainty between candidate systems ubs according to Guide • determination of the expanded uncertainty of the candidate systems according to Guide • application of the correction factors/ terms determined in chapter 6.1 5.4.10 Calculation of the expanded uncertainty of the instruments • recalculation of equivalence of the 4 data sets from the existing suitability test and the additional data set “Bornheim Summer 2013 with different thresholds for the heater regulation according to the approach from point “8.2 Suitability testing” der CEN/TS 16450 [9] The additional campaign was performed between 07 June 2013 and 25 July 2013. The ambient conditions during the campaign were as follows: 740300_2013_936_21209885F_EN.docx TÜV Rheinland Energie und Umwelt GmbH Air Pollution Control Report on the suitability test of the ambient air quality measuring system Model 5030i SHARP with PM2.5 pre-separator of the company Thermo Fisher Scientific for the component suspended particulate matter PM2.5, Report No.: 936/21209885/F Table 8: Page 65 of 424 Ambient conditions at the additional site “Bornheim, Summer 2013”, shown as daily mean values Bornheim, motorway parking lot, summer 2013 No. of paired values (reference) 44 Ratio PM2,5/PM10 [%] Range Average 39.1 – 75.1 59.9 Ratio Volatiles/PM2,5 [%]* Range Average 4.7 – 38.4 17.4 Air temperature [°C] Range Average 13.2 – 27.6 19.8 Air pressure [hPa] Range Average 1001 – 1020 1010 Rel. humidity [%] Range Average 52.2 – 86.1 67.8 Wind velocity [m/s] Range Average 0.2 – 3.5 1.2 Precipitation [mm/d] Range Average 0.0 – 34.6 3.2 All values are to be found in Appendix 7 (PM-measuring values) and 8 (ambient conditions). In total 45 paired values were determined. A significant outlier according to Grubbs is the paired value for the reference PM2.5 of 18 July 2013 (Ref1: 11.3µg/m³; Ref2: 9.0 µg/m³). These values were discarded from the data pool. Therefore 44 paired values are available for evaluation. The evaluation of the comparison measurements according to the Guide [4] leads to the following result: 740300_2013_936_21209885F_EN.docx TÜV Rheinland Energie und Umwelt GmbH Air Pollution Control Report on the suitability test of the ambient air quality measuring system Model 5030i SHARP with PM2.5 pre-separator of the company Thermo Fisher Scientific for the component suspended particulate matter PM2.5, Report No.: 936/21209885/F Page 66 of 424 Table 9: Results of the equivalence test at the site Bornheim, Summer 2013, SN 1 (58%) & SN 2 (50%), component PM2.5, raw data Orthogonal Regression SN1 Individual Datasets Bornheim Summer 2013 SN2 Dataset nc-s r2 44 0.917 Slope (b) +/- ub 1.157 +/- 0.051 Intercept (a) +/- ua WCM / % % ≥ 17 μg m-3 0.372 +/- 0.625 35.91 11.4 Orthogonal Regression Individual Datasets Limit Value of 30 μg m-3 Dataset Bornheim Summer 2013 nc-s r2 44 0.904 Slope (b) +/- ub 1.001 +/- 0.048 Limit Value of 30 μg m-3 Intercept (a) +/- ua WCM / % % ≥ 17 μg m-3 0.518 +/- 0.586 11.75 11.4 Assessment: 1. The uncertainty between the two candidate systems is 1.53 µg/m³ and thus is below the permissible 2.5 µg/m³ 2. The expanded uncertainty for the raw data for SN 1 (58%) is higher as the acceptable 25%, the expanded uncertainty for the raw data for SN 2 (50%) is below the permissible 25%. The correction factors/ terms detected during suitability testing in 6.1 5.4.10 Calculation of the expanded uncertainty of the instruments are afterwards applied to the raw data sets. Therefore a correction of the data sets for SN 1 and SN 2 with a slope of 1.068 (uncertainty of slope 0.013) is carried out. This results to the following evaluation: Table 10: Results of the equivalence test at the site Bornheim, summer 2013, SN 1 (58 %) & SN 2 (50 %), component PM2.5, slope correction 1.068 Orthogonal Regression SN1 Individual Datasets Bornheim Summer 2013 SN2 Dataset nc-s r2 44 0.917 Slope (b) +/- ub 1.080 +/- 0.048 Intercept (a) +/- ua WCM / % % ≥ 17 μg m-3 0.383 +/- 0.585 21.87 11.4 Orthogonal Regression Individual Datasets Limit Value of 30 μg m-3 Dataset Bornheim Summer 2013 nc-s r2 44 0.904 Slope (b) +/- ub 0.934 +/- 0.045 Limit Value of 30 μg m-3 Intercept (a) +/- ua WCM / % % ≥ 17 μg m-3 0.520 +/- 0.549 14.41 11.4 Assessment: 1 The expanded uncertainty of the data corrected by the slope of 1.068 lies for SN 1 (58 %) and SN 2 (50 %) beneath the allowed 25%. 740300_2013_936_21209885F_EN.docx TÜV Rheinland Energie und Umwelt GmbH Air Pollution Control Report on the suitability test of the ambient air quality measuring system Model 5030i SHARP with PM2.5 pre-separator of the company Thermo Fisher Scientific for the component suspended particulate matter PM2.5, Report No.: 936/21209885/F Page 67 of 424 Closing, the corrected data set for Bornheim, Summer 2013 was included in the original equivalence evaluation from suitability testing (see Table 38) according to point “8.2 Suitability testing of CEN/TS 16450 [9] as additional 5th data set, to check whether the criteria for equivalence test are still fulfilled. Table 11: PM2.5 5030i Sharp Slope Corrected Results of the equivalence test “suitability testing + Bornheim, summer 2013”, SN 1 & SN 2, component PM2.5, slope correction 1.068 25.9% ≥ 17 μg m-3 Orthogonal Regression WCM / % nc-s r2 All Data 11.7 243 0.970 0.997 +/- 0.011 < 18 μg m-3 12.1 189 0.876 ≥ 18 μg m-3 16.4 54 0.955 SN1 Dataset nc-s r 2 Bornheim Winter 41 0.975 1.006 Cologne Winter 41 0.970 Bornheim Summer 78 Teddington Summer Slope (b) +/- ub Intercept (a) +/- ua Reference Candidate 0.059 +/- 0.189 0.59 1.26 1.040 +/- 0.027 -0.251 +/- 0.267 0.53 1.23 1.018 +/- 0.030 -0.806 +/- 0.914 0.77 1.61 Orthogonal Regression Individual Datasets Combined Datasets Individual Datasets Combined Datasets Limit Value of 30 μg m-3 WCM / % % ≥ 17 μg m-3 +/- 0.025 -0.175 +/- 0.624 13.10 56.1 1.017 +/- 0.028 -0.481 +/- 0.633 13.23 53.7 0.931 1.037 +/- 0.031 -0.469 +/- 0.437 16.06 15.4 49 0.906 1.043 +/- 0.047 -0.590 +/- 0.381 10.59 4.1 Bornheim Summer 2013 44 0.917 1.080 +/- 0.048 0.383 +/- 0.585 21.87 11.4 < 18 μg m-3 198 0.850 1.114 +/- 0.031 -0.861 +/- 0.306 20.99 4.5 ≥ 18 μg m-3 55 0.951 1.035 +/- 0.032 -1.069 +/- 0.959 17.45 100.0 All Data 253 0.962 1.016 +/- 0.013 -0.104 +/- 0.209 13.58 25.3 Slope (b) +/- ub Intercept (a) +/- ua Orthogonal Regression SN2 Betw een Instrument Uncertainties Limit Value of 30 μg m-3 Dataset WCM / % % ≥ 17 μg m-3 +/- 0.029 -0.763 +/- 0.729 15.75 56.1 +/- 0.025 0.386 +/- 0.554 11.81 53.5 0.885 +/- 0.028 1.052 +/- 0.400 21.04 15.7 nc-s r2 Bornheim Winter 41 0.968 1.033 Cologne Winter 43 0.974 0.990 Bornheim Summer 70 0.931 Slope (b) +/- ub Intercept (a) +/- ua Teddington Summer 63 0.848 0.947 +/- 0.048 0.234 +/- 0.406 13.89 3.2 Bornheim Summer 2013 44 0.904 0.934 +/- 0.045 0.520 +/- 0.549 14.41 11.4 < 18 μg m-3 207 0.838 1.004 +/- 0.028 -0.009 +/- 0.282 11.34 4.8 ≥ 18 μg m-3 54 0.941 1.019 +/- 0.034 -1.164 +/- 1.052 19.41 100.0 All Data 261 0.960 0.985 +/- 0.012 13.32 24.5 0.081 +/- 0.203 740300_2013_936_21209885F_EN.docx TÜV Rheinland Energie und Umwelt GmbH Air Pollution Control Page 68 of 424 Report on the suitability test of the ambient air quality measuring system Model 5030i SHARP with PM2.5 pre-separator of the company Thermo Fisher Scientific for the component suspended particulate matter PM2.5, Report No.: 936/21209885/F Assessment summary To verify the equivalence of the data between both candidates with the threshold set for the heating of 50 % respectively 58 % a comparison campaign was performed at one of the German sites. The gathered data sets (SN 1 with 58% setting, SN 2 with 50 % setting) were subjected to an equivalence test. The assessment led to the following results: 1. The uncertainty between the two candidate systems is 1.53 µg/m³ and thus is below the permissible 2.5 µg/m³ 2. The expanded uncertainty of the data corrected by the slope of 1.068 is for SN 1 (58 %) and SN 2 (50 %) below the permissible 25 % 3. The combined evaluation of the 4 original data sets of suitability testing with the additional 5th data set Bornheim, summer 2013 leads as well to a compliance with the equivalence criteria according to the guide [4] Hence the verification of the equivalence of the candidate systems with a threshold for the rel. humidity of 58 % was proved also for a German site. Therefore, the Model 5030i SHARP measuring system can alternatively as well be operated with a relative humidity threshold of 58 %, in particular for any site where a significantly high volatile content is expected. 740300_2013_936_21209885F_EN.docx TÜV Rheinland Energie und Umwelt GmbH Air Pollution Control Report on the suitability test of the ambient air quality measuring system Model 5030i SHARP with PM2.5 pre-separator of the company Thermo Fisher Scientific for the component suspended particulate matter PM2.5, Report No.: 936/21209885/F Page 69 of 424 Sampling period EN 14907 defines a sampling period of 24 h ± 1 h. The sampling period was set to 24 h for all instruments during the entire field test (10:00 – 10:00 in Teddington and Cologne, and 7:00 – 7:00 in Bornheim). Data handling All paired reference values determined during the field tests were subject to statistical testing according to Grubbs (99 %) to prevent influences of clearly implausible data on the measurement results. Paired values identified as significant outliers may be discarded from the data pool as long as the critical value of the test statistic does not fall below the target. The January 2010 version of Guide [4] stipulates that only 2.5 % of the paired values may be identified as outliers and discarded. During the “Combined MCERTS and TÜV PM Equivalence Testing“ programme we agreed with our British partners not to discard any value measured by the candidates, unless the implausibility is attributed to technical causes. Thus, no values measured by the candidates were discarded during the entire testing period. Table 12 shows an overview of the amount of paired values (reference) recognised as significant outliers and discarded at each test site. Table 12: Results of Grubbs outlier test – Reference PM2.5 Number of data- Maximum Number Number of dataNumber Identified Number Deleted pairs that can be deleted pairs remaining Graph Number Site Sampler A Bornheim Winter PM2.5 Reference 41 1 0 0 41 B Cologne Winter PM2.5 Reference 49 1 2 1 48 C Bornheim Summer PM2.5 Reference 87 2 0 0 87 D Teddington Summer PM2.5 Reference 66 2 1 1 65 740300_2013_936_21209885F_EN.docx TÜV Rheinland Energie und Umwelt GmbH Air Pollution Control Report on the suitability test of the ambient air quality measuring system Model 5030i SHARP with PM2.5 pre-separator of the company Thermo Fisher Scientific for the component suspended particulate matter PM2.5, Report No.: 936/21209885/F Page 70 of 424 The following paired values were discarded: Table 13: Discarded reference PM2.5 paired values according to Grubbs Test site Date Reference 1 [µg/m³] Reference 2 [µg/m³] Cologne (Winter) 05 May 2011 11.2 14.8 Teddington (summer) 03 Aug 2012 5.5 4.6 100 Not Outlier B 90 Outlier Deleted Outlier Not Deleted 1 to 1 Line 80 70 PM2.5 Reference 2 60 50 40 30 20 10 0 0 10 20 30 40 50 60 70 80 90 100 PM2.5 Reference 1 Figure 28: Grubbs test results for the PM2.5 reference method, Cologne (winter) 740300_2013_936_21209885F_EN.docx TÜV Rheinland Energie und Umwelt GmbH Air Pollution Control Report on the suitability test of the ambient air quality measuring system Model 5030i SHARP with PM2.5 pre-separator of the company Thermo Fisher Scientific for the component suspended particulate matter PM2.5, Report No.: 936/21209885/F Page 71 of 424 100 Not Outlier 90 Outlier Deleted Outlier Not Deleted 1 to 1 Line 80 70 PM2.5 Reference 2 60 50 40 30 20 10 0 0 10 20 30 40 50 60 70 80 90 100 PM2.5 Reference 1 Figure 29: Grubbs test results for the PM2.5 reference method, Bornheim (summer) 100 Not Outlier 90 Outlier Deleted Outlier Not Deleted 1 to 1 Line 80 70 PM2.5 Reference 2 60 50 40 30 20 10 0 0 10 20 30 40 50 60 70 80 90 100 PM2.5 Reference 1 Figure 30: Grubbs test results for the PM2.5 reference method, Bornheim (winter) 740300_2013_936_21209885F_EN.docx TÜV Rheinland Energie und Umwelt GmbH Air Pollution Control Report on the suitability test of the ambient air quality measuring system Model 5030i SHARP with PM2.5 pre-separator of the company Thermo Fisher Scientific for the component suspended particulate matter PM2.5, Report No.: 936/21209885/F Page 72 of 424 100 Not Outlier 90 Outlier Deleted Outlier Not Deleted 1 to 1 Line 80 70 PM2.5 Reference 2 60 50 40 30 20 10 0 0 10 20 30 40 50 60 70 80 90 100 PM2.5 Reference 1 Figure 31: Grubbs test results for the PM2.5 reference method, Teddington (summer) 740300_2013_936_21209885F_EN.docx TÜV Rheinland Energie und Umwelt GmbH Air Pollution Control Report on the suitability test of the ambient air quality measuring system Model 5030i SHARP with PM2.5 pre-separator of the company Thermo Fisher Scientific for the component suspended particulate matter PM2.5, Report No.: 936/21209885/F Page 73 of 424 Filter handling – Mass determination The following filters were used for suitability testing: Table 14: Used filter materials Measuring instrument Filter material, type Manufacturer Reference instrument LVS3 Emfab, ∅ 47 mm Pall The filter material EmfabTM (Teflon-coated glass fibre filters) was used during the “Combined MCERTS and TÜV PM Equivalence Testing“ programme by special request of our British partners, because according to [8], they consider it most appropriate for the measurement task. The handling of filters meets the requirements of EN 14907. The procedures for filter handling and weighing are described in detail in Appendix 2 of this report. 740300_2013_936_21209885F_EN.docx TÜV Rheinland Energie und Umwelt GmbH Air Pollution Control Page 74 of 424 Report on the suitability test of the ambient air quality measuring system Model 5030i SHARP with PM2.5 pre-separator of the company Thermo Fisher Scientific for the component suspended particulate matter PM2.5, Report No.: 936/21209885/F 5. Reference measuring methods In accordance with the specifications of EN 14907, the following instruments were used during the field test: 1. Reference equipment for PM2.5: Low-Volume Sampler LVS3 Manufacturer: Ingenieurbüro Sven Leckel, Leberstraße 63, Berlin Germany Date of manufacture: 2007 PM2.5 Sampling inlet Two PM2.5 reference instruments were operated simultaneously during the test, each with a controlled volume flow of 2.3 m³/h. The accuracy of the volume flow control is <1 % of the nominal volume flow under real operating conditions. The sampling air for the LVS3 is sucked in through the sampling inlet by a rotary vane vacuum pump. The sampling air volume flow is measured between the filter and the vacuum pump with a measuring orifice. The suctioned air streams then out of the pump passing through a separator for abrasion of the rotary vane towards the air outlet. The electronic measuring equipment of the LVS3 displays the inlet sampling air volume in standard or operating m3 as soon as the sampling is complete. To determine the PM2.5 concentration, the laboratory performed a gravimetric determination of the amount of suspended particulate matter on the respective filters. The obtained result was then divided by the respective volume of sampling air in operating m³. 740300_2013_936_21209885F_EN.docx TÜV Rheinland Energie und Umwelt GmbH Air Pollution Control Report on the suitability test of the ambient air quality measuring system Model 5030i SHARP with PM2.5 pre-separator of the company Thermo Fisher Scientific for the component suspended particulate matter PM2.5, Report No.: 936/21209885/F Page 75 of 424 6. Test results 6.1 4.1.1 Measured value display The measuring system shall be fitted with a measured value display. 6.2 Equipment No additional equipment is required. 6.3 Performance of test It was checked whether the measuring system has a display for measured values. 6.4 Evaluation The measuring system has a display for measured values. The main screen displays the current SHARP concentration at all times (updated every second). From here, it is easy to select the screens displaying the PM concentration (= BETA), the NEPH concentration, the ambient conditions, the flow conditions and the mass sensor data using the arrow keys ↑↓. 6.5 Assessment The measuring system is fitted with a measured value display. Minimum requirement fulfilled? yes 740300_2013_936_21209885F_EN.docx TÜV Rheinland Energie und Umwelt GmbH Air Pollution Control Report on the suitability test of the ambient air quality measuring system Model 5030i SHARP with PM2.5 pre-separator of the company Thermo Fisher Scientific for the component suspended particulate matter PM2.5, Report No.: 936/21209885/F Page 76 of 424 6.6 Detailed presentation of test results Figure 32 shows the user interface with the current concentration values. Figure 32: Display of the measured SHARP concentration 740300_2013_936_21209885F_EN.docx TÜV Rheinland Energie und Umwelt GmbH Air Pollution Control Report on the suitability test of the ambient air quality measuring system Model 5030i SHARP with PM2.5 pre-separator of the company Thermo Fisher Scientific for the component suspended particulate matter PM2.5, Report No.: 936/21209885/F 6.1 Page 77 of 424 4.1.2 Easy maintenance Necessary maintenance for the measuring systems should be possible without larger effort, if possible from outside. 6.2 Equipment No additional equipment required. 6.3 Performance of test Necessary regular maintenance works were carried out according to the instructions of the manual. 6.4 Evaluation The following maintenance works must be performed by the user: 1. Check of system status: The system status can be monitored and controlled directly on the system itself or online. 2. In general, the sampling inlet must be cleaned according to the manufacturer’s instructions while taking into account the local suspended particle concentrations (during suitability test every 4 weeks). 3. Inspection of filter tape supply – one filter tape is enough for approx. 650 filter tape changes per roll (approx. 215 days at cycles of 8 hours). Semi-annual filter tape changes are expected to be sufficient under normal conditions (no unscheduled filter changes due to significantly high dust concentrations). The “Filter Tape Counter” function allows for monitoring the current number of filter tape changes as well as configuring alarm thresholds which remind the user of upcoming changes. 4. An inspection of the sensors for ambient temperature and ambient pressure shall be carried out every three months according to the manufacturer’s specifications. 5. A flow rate check must be performed every three months according to the manufacturer’s specifications. 6. The system’s leak tightness shall be inspected every three months according to the manufacturer’s specifications. 7. The external pump exhaust filter shall be exchanged every six months. 8. As part of an annual basic maintenance, the carbon vanes of the vacuum pump shall be exchanged and the SHARP optics module shall be cleaned once a year. The cleaning of the SHARP optics module is ideally performed by an experienced service technician. Furthermore, it is recommended to carry out a yearly inspection and, if required, a re-calibration of the radiometric measurement using the foil set. 9. The cleaning of the sampling tube shall be paid attention to during the annual basic maintenance. The instructions of the manual (chapters 4 and 5) shall be observed when performing maintenance works. In general, all works can be carried out with commonly available tools. 740300_2013_936_21209885F_EN.docx TÜV Rheinland Energie und Umwelt GmbH Air Pollution Control Page 78 of 424 6.5 Report on the suitability test of the ambient air quality measuring system Model 5030i SHARP with PM2.5 pre-separator of the company Thermo Fisher Scientific for the component suspended particulate matter PM2.5, Report No.: 936/21209885/F Assessment Maintenance works can be carried out with commonly available tools taking reasonable time and effort. The semi-annual filter tape change and the works described in points 7ff are to be performed while the system is on standstill only. These works come up every six or twelve months. In the meantime, maintenance works are limited to the check of contaminations, plausibility checks and possible status/error messages. Minimum requirement fulfilled? yes 6.6 Detailed presentation of test results The maintenance works were carried out during the test in accordance with the instructions given in the manual. No problems were noticed while following the described procedures. All maintenance works could be performed smoothly with customary tools. 740300_2013_936_21209885F_EN.docx TÜV Rheinland Energie und Umwelt GmbH Air Pollution Control Report on the suitability test of the ambient air quality measuring system Model 5030i SHARP with PM2.5 pre-separator of the company Thermo Fisher Scientific for the component suspended particulate matter PM2.5, Report No.: 936/21209885/F 6.1 Page 79 of 424 4.1.3 Functional check If the operation or the functional check of the measuring system requires particular instruments, they shall be considered as part of the measuring system and be applied in the corresponding sub-tests and included in the assessment. Test gas units included in the measuring system shall indicate their operational readiness to the measuring system by a status signal and shall provide direct as well as remote control via the measuring system. 6.2 Equipment Manual, zero filter and span foil set. 6.3 Performance of test The system status is constantly monitored and problems are indicated by a series of different warning messages. Parameters which are relevant for a proper functioning of the measuring system (e.g. NEPH zero adjustment, flow rates, pump vacuum) can also be reviewed on the instrument itself and/or recorded continuously by a data logger. Furthermore, it is possible to check the zero point of the measuring system externally. For this, a zero filter is installed at the device inlet. The use of this filter allows the provision of particle-free air. During the test, the position of the zero point was determined approx. every 4 weeks using a zero filter. In order to check the stability of the beta measurement, the “mass transfer standard” foil set is required. This set comprises one null foil and two span foils. The null foil has the same approximate mass as a clean filter spot and the span foil is a calibrated mass increase above the null foil. Therefore, the foils come in a set and must not be mixed with other sets. The foil set is used for determining mass only. A comparison campaign was carried out once at the beginning and once at the end of the test in order to determine the mass coefficient. It is not possible to produce a reproducible signal for the sensitivity of the nephelometer using external test standards. However, the nephelometer is regularly flushed with zero air during operation (auto-zero function as part of every filter change), thus determining and documenting the position of the zero point on a regular basis. Information on the current and previous NEPH backgrounds can be retrieved from the instrument at all times. Since the nephelometer is continuously calibrated with a very stable radiometric measurement, a separate examination of the stability of the nephelometer’s signal under operating conditions can be omitted. 740300_2013_936_21209885F_EN.docx TÜV Rheinland Energie und Umwelt GmbH Air Pollution Control Report on the suitability test of the ambient air quality measuring system Model 5030i SHARP with PM2.5 pre-separator of the company Thermo Fisher Scientific for the component suspended particulate matter PM2.5, Report No.: 936/21209885/F Page 80 of 424 6.4 Evaluation All instrument functions listed in the manual are available and can be activated. The current system status is monitored continuously and problems are indicated by a series of different warning messages. An external check of the zero point using a zero filter is possible at any time. A check of the radiometric measurement using the “mass transfer standard” foil set can also be performed anytime. It is not possible to produce a reproducible signal for the sensitivity of the nephelometer using external test standards. However, the nephelometer is regularly flushed with zero air during operation (auto-zero function as part of every filter change), thus determining and documenting the position of the zero point on a regular basis. Information on the current and previous NEPH backgrounds can be retrieved from the instrument at all times. Since the nephelometer is continuously calibrated with a very stable radiometric measurement, a separate examination of the stability of the nephelometer’s signal under operating conditions can be omitted. 6.5 Assessment All system functions listed in the manual are available, can be activated and function well. The current system status is continuously monitored and displayed by a series of status messages. The results of the external zero checks performed with a zero filter during the field tests as well as the results of the regular mass coefficient checks can be found in Section 6.1 5.3.12 Long-term drift of this report. Minimum requirement fulfilled? yes 6.6 Detailed presentation of test results Please refer to Section 6.1 740300_2013_936_21209885F_EN.docx 5.3.12 Long-term drift TÜV Rheinland Energie und Umwelt GmbH Air Pollution Control Report on the suitability test of the ambient air quality measuring system Model 5030i SHARP with PM2.5 pre-separator of the company Thermo Fisher Scientific for the component suspended particulate matter PM2.5, Report No.: 936/21209885/F 6.1 Page 81 of 424 4.1.4 Set-up times and warm-up times The set-up times and warm-up times shall be specified in the instruction manual. 6.2 Equipment A clock was required for this test. 6.3 Performance of test The AMS were put into operation in accordance with the manufacturer’s description. The necessary set-up and warm-up times were recorded separately. Constructional measures undertaken prior to the measurement, such as the opening of an inlet through the cabinet roof, were not taken into account for evaluation. 6.4 Evaluation The set-up time comprises the time needed for all necessary works from system installation to start-up. The measuring system must be protected from weather inconsistencies, e.g. in an airconditioned measuring cabinet. Moreover, extensive on-site construction work is required in order to lead the sampling tube through the roof of a measuring cabinet. A non-stationary application is therefore only to be undertaken together with the associated peripheral devices. The following steps are strictly necessary for the installation of the measuring device: • Unpacking and installation of the measuring system (in a rack or on a bench) • Installation of the sampling tube, dynamic heating system and PM2.5 sampling inlet • Connection of the pump • Fitting of the ambient temperature sensor (near the sampling inlet) • Set-up of all connecting and control lines • Connection of power supply • Optional: Connection of peripheral recording and control systems (data logger, PC with iPort) to the respective ports • Switch-on of the measuring system • Set-up of filter tape The time it takes to perform these works makes up the set-up time. In this case, it amounts to approx. 1 hour. 740300_2013_936_21209885F_EN.docx TÜV Rheinland Energie und Umwelt GmbH Air Pollution Control Page 82 of 424 Report on the suitability test of the ambient air quality measuring system Model 5030i SHARP with PM2.5 pre-separator of the company Thermo Fisher Scientific for the component suspended particulate matter PM2.5, Report No.: 936/21209885/F The warm-up time is the time between the start of operation of the measuring system and the point when it is ready for measurement. After switching on the system, the system is in the equilibration phase until the BETA detector has adjusted to the ambient conditions. This phase has a duration of at least 12 hours. After the equilibration phase, the following actions are necessary for starting operation the first time: • Check of system settings with regard to flow, heating, filter tape parameters, recording of measured values, date and time • Check and, if required, adjustment of the temperature sensors (ambient temperature, nephelometer temperature, flow temperature) • Check and, if required, adjustment of rel. air humidity of the nephelometer • Check and, if required, adjustment of the ambient air pressure measurement • Check and, if required, adjustment of the flow rate • Leak test • Check and, if required, adjustment of the nephelometer’s zero point with a HEPA filter at the inlet • If necessary, check of the radiometric mass determination – calibration with mass foils Duration: approx. 1 hour In case of restarting operation after a short downtime, e.g. after a power outage, the above mentioned steps can be omitted with exception of a check of the system parameters, a plausibility test of the sensor values and an inspection of possible status/error messages. If required, potential changes in the basic parameterisation of the measuring instrument can likewise be performed in just a few minutes by staff familiarised with the instruments. 6.5 Assessment The set-up and warm-up times were determined. The measuring system can be operated at different measurement sites with manageable effort. The set-up time is approximately 1 hour and the warm-up time takes a minimum of approx. 12 hours after the measuring system has adjusted to ambient conditions. Minimum requirement fulfilled? yes 6.6 Detailed presentation of test results Not required for this test. 740300_2013_936_21209885F_EN.docx TÜV Rheinland Energie und Umwelt GmbH Air Pollution Control Report on the suitability test of the ambient air quality measuring system Model 5030i SHARP with PM2.5 pre-separator of the company Thermo Fisher Scientific for the component suspended particulate matter PM2.5, Report No.: 936/21209885/F 6.1 Page 83 of 424 4.1.5 Instrument design The instruction manual shall include specifications of the manufacturer regarding the design of the measuring system. The main elements are: Instrument shape (e.g. bench mounting, rack mounting, free mounting) Mounting position (e.g. horizontal or vertical mounting) Safety requirements Dimensions Weight Power consumption 6.2 Equipment A power consumption measuring instrument and a scale were used for this test. 6.3 Performance of test The installation of the delivered instruments was compared with the description given in the manuals. The specified power consumption was determined for a period of 24 h under normal operating conditions during field test. 6.4 Evaluation The measuring system must be installed in horizontal mounting position (e.g. on a bench or a rack) protected from weather inconsistencies. The temperature at the installation site shall be within the range of 5 °C to 40 °C with a relatively low amount of temperature fluctuation (no direct sunlight, no direct exposure to heater or air conditioner). The dimensions and weights of the measuring system conform to the specifications in the manual. The power consumption of the measuring system and pump is specified by the manufacturer as a maximum of approx. 880 W. During a 24-hour test, these specifications were checked. At no time the mentioned value was exceeded during these investigations. 6.5 Assessment The instrument design specifications listed in the operating manual are complete and correct. Minimum requirement fulfilled? yes 6.6 Detailed presentation of test results Not required for this test. 740300_2013_936_21209885F_EN.docx TÜV Rheinland Energie und Umwelt GmbH Air Pollution Control Page 84 of 424 6.1 Report on the suitability test of the ambient air quality measuring system Model 5030i SHARP with PM2.5 pre-separator of the company Thermo Fisher Scientific for the component suspended particulate matter PM2.5, Report No.: 936/21209885/F 4.1.6 Unintended adjustment It shall be possible to secure the adjustment of the measuring system against illicit or unintended adjustment during operation. 6.2 Equipment No additional equipment required. 6.3 Performance of test The measuring system is operated using the front panel pushbuttons and LCD display. A change of the parameters or the adjustment of sensors is only possible by pressing several key sequences. The measuring system can also be password protected. If a password protection is activated (lock icon), it is still possible to see data, parameters and settings on the front panel user interface. It is, however, not possible to perform any changes. As an outside installation of the measuring device is not possible, additional protection is given by installation at locations, to which unauthorised people have no access (e.g. locked measuring cabinet). 6.4 Evaluation Unintended and unauthorised adjustment of instrument parameters can be avoided by password protection. Even without password protection, the adjustment of sensors and change of the parameters can only be done by pressing several key sequences. Moreover, additional protection against unauthorised intervention is given by installing the system in a locked measuring cabinet. 6.5 Assessment The AMS is protected against unauthorised and unintended adjustment. In addition, the AMS shall be locked up in a measuring cabinet. Minimum requirement fulfilled? yes 6.6 Detailed presentation of test results Not required for this test. 740300_2013_936_21209885F_EN.docx TÜV Rheinland Energie und Umwelt GmbH Air Pollution Control Report on the suitability test of the ambient air quality measuring system Model 5030i SHARP with PM2.5 pre-separator of the company Thermo Fisher Scientific for the component suspended particulate matter PM2.5, Report No.: 936/21209885/F 6.1 Page 85 of 424 4.1.7 Data output The output signals shall be provided digitally (e.g. RS232) and/or as analogue signals (e.g. 4 mA to 20 mA). 6.2 Equipment PC with “iPort” software. 6.3 Performance of test The test was carried out using a PC with the software “iPort“(via Ethernet). The AMS was connected to a PC via Ethernet and the data were downloaded. The AMS also offers the possibility of outputting analogue signals and measured signals or communicating via serial interface RS 232/RS 485. 6.4 Evaluation The measured signals are offered as follows at the rear side of the instrument: Analogue: 0-0.1, 0-1, 0-5 and 0-10 V selectable concentration range 0-20 or 4-20 mA selectable concentration range Digital: 6.5 Ethernet with “iPort“ software RS 232 / RS 485 interface Assessment Measured signals are output as analogue signals (in V or mA) and digitally (via Ethernet, RS 232, RS 485). The connection of additional measuring and peripheral devices to the respective ports of the devices is possible (e.g. analogue inputs). Minimum requirement fulfilled? yes 740300_2013_936_21209885F_EN.docx TÜV Rheinland Energie und Umwelt GmbH Air Pollution Control Report on the suitability test of the ambient air quality measuring system Model 5030i SHARP with PM2.5 pre-separator of the company Thermo Fisher Scientific for the component suspended particulate matter PM2.5, Report No.: 936/21209885/F Page 86 of 424 6.6 Detailed presentation of test results Figure 33 shows a view of the rear side of the instrument with the respective measured value outputs. Figure 33: Rear view of Model 5030i SHARP 740300_2013_936_21209885F_EN.docx TÜV Rheinland Energie und Umwelt GmbH Air Pollution Control Report on the suitability test of the ambient air quality measuring system Model 5030i SHARP with PM2.5 pre-separator of the company Thermo Fisher Scientific for the component suspended particulate matter PM2.5, Report No.: 936/21209885/F 6.1 5.1 Page 87 of 424 General The manufacturer’s specifications in the instruction manual shall be by no means better than the results of the performance test. 6.2 Equipment No additional equipment required. 6.3 Performance of test The test results were compared with the specifications of the manual. 6.4 Evaluation Deviations found on the first draft of the manual from the actual design were cleared. 6.5 Assessment No differences between the instrument design and the descriptions given in the manual were detected. Minimum requirement fulfilled? yes 6.6 Detailed presentation of test results Please refer to Section 6.4 of this module. 740300_2013_936_21209885F_EN.docx TÜV Rheinland Energie und Umwelt GmbH Air Pollution Control Report on the suitability test of the ambient air quality measuring system Model 5030i SHARP with PM2.5 pre-separator of the company Thermo Fisher Scientific for the component suspended particulate matter PM2.5, Report No.: 936/21209885/F Page 88 of 424 6.1 5.2.1 Certification ranges The certification range intended for testing shall be determined. 6.2 Equipment No additional equipment required. 6.3 Performance of test The certification range intended for testing shall be determined. 6.4 Evaluation Standard VDI 4202, Part 1 contains the following minimum requirements on certification ranges for systems measuring suspended particulate matter in ambient air: Table 15: Certification ranges Measured component Lower limit of CR Upper limit of CR Limit value in µg/m³ in µg/m³ in µg/m³ 0 50 25 PM2.5 Evaluation period Calendar year The certification ranges are related to the limit value with the shortest assessment period and used for the assessment of the measuring system in the range of the limit value. This assessment of the measuring system in the range of the limit value is performed as part of the determination of the expanded uncertainty of the candidates according to Guide [4]. For this purpose, the following values are used as reference values in accordance with the specifications of the guide: PM2.5: 30 µg/m³ Reference is made to test point 6.1 5.4.10 Calculation of the expanded uncertainty of the instruments of this report. 6.5 Assessment It is possible to assess the measuring system in the range of the relevant limit values. Minimum requirement fulfilled? yes 6.6 Detailed presentation of test results Please refer to test point 6.1 struments of this report. 740300_2013_936_21209885F_EN.docx 5.4.10 Calculation of the expanded uncertainty of the in- TÜV Rheinland Energie und Umwelt GmbH Air Pollution Control Report on the suitability test of the ambient air quality measuring system Model 5030i SHARP with PM2.5 pre-separator of the company Thermo Fisher Scientific for the component suspended particulate matter PM2.5, Report No.: 936/21209885/F 6.1 Page 89 of 424 5.2.2 Measuring range The upper limit of the measuring range shall be greater or equal to the upper limit of the certification range. 6.2 Equipment No additional equipment required. 6.3 Performance of test It was tested, whether the upper limit of the measuring range of the measuring system is greater or equal to the upper limit of the certification range. 6.4 Evaluation As a standard, a measuring range of 0 – 10 000 µg/m³ is adjusted on the measuring system. As appropriate default setting of the analogue output for European conditions a measuring range of 0 – 200 or 0 – 1000 µg/m³ is recommended. (Recommended) measuring range: 0 – 200 or 0 – 1000 µg/m³ Upper limit of the certification range: PM2.5: 50 µg/m³ 6.5 Assessment A measuring range of 0 – 10 000 µg/m³ is set by default. It is possible to adjust other measuring ranges. The upper limit of the measuring range of the measuring system is greater than the respective upper limit of the certification range. Minimum requirement fulfilled? yes 6.6 Detailed presentation of test results Not required for this test. 740300_2013_936_21209885F_EN.docx TÜV Rheinland Energie und Umwelt GmbH Air Pollution Control Page 90 of 424 6.1 Report on the suitability test of the ambient air quality measuring system Model 5030i SHARP with PM2.5 pre-separator of the company Thermo Fisher Scientific for the component suspended particulate matter PM2.5, Report No.: 936/21209885/F 5.2.3 Negative output signals Negative output signals or measured values may not be suppressed (life zero). 6.2 Equipment No additional equipment required. 6.3 Performance of test The AMS was tested on its ability to display negative output signals in the laboratory and in the field. 6.4 Evaluation The AMS can display negative values both on the front panel and over data outputs. 6.5 Assessment Negative measured signals are displayed directly on the AMS and are transmitted correctly via the respective signal outputs of the measuring system. Minimum requirement fulfilled? yes 6.6 Detailed presentation of test results Not required for this test. 740300_2013_936_21209885F_EN.docx TÜV Rheinland Energie und Umwelt GmbH Air Pollution Control Report on the suitability test of the ambient air quality measuring system Model 5030i SHARP with PM2.5 pre-separator of the company Thermo Fisher Scientific for the component suspended particulate matter PM2.5, Report No.: 936/21209885/F 6.1 Page 91 of 424 5.2.4 Failure in the mains voltage In case of malfunction of the measuring system or failure in the mains voltage for a period of up to 72 h, uncontrolled emission of operation and calibration gas shall be avoided. The instrument parameters shall be secured by buffering against loss caused by failure in the mains voltage. When mains voltage returns, the instrument shall automatically reach the operation mode and start the measurement according to the operating instructions. 6.2 Equipment Not additional equipment required. 6.3 Performance of test A failure in the mains voltage was simulated and it was tested, whether the instrument remains undamaged and is ready for measurement after restart of the power supply. 6.4 Evaluation Since the measuring systems need neither operation nor calibration gases an uncontrolled escape of gases is not possible. In case of a failure in the mains voltage, the measuring system resumes operation automatically. However, at least the first 12 h worth of data after voltage returns shall be discarded, since the system needs an equilibration phase after restart until the BETA detector adjusts to ambient conditions (see point 6.1 4.1.4 Set-up times and warm-up times). 6.5 Assessment All instrument parameters are protected against loss through buffering. After the power supply has returned, the measuring device goes back to failure-free operational condition and resumes measurement. However, at least the first 12 h worth of data after voltage returns shall be discarded, since the system needs an equilibration phase after restart until the BETA detector adjusts to ambient conditions. Minimum requirement fulfilled? yes 6.6 Detailed presentation of test results Not required for this test. 740300_2013_936_21209885F_EN.docx TÜV Rheinland Energie und Umwelt GmbH Air Pollution Control Page 92 of 424 6.1 Report on the suitability test of the ambient air quality measuring system Model 5030i SHARP with PM2.5 pre-separator of the company Thermo Fisher Scientific for the component suspended particulate matter PM2.5, Report No.: 936/21209885/F 5.2.5 Operating states The measuring system shall allow the control of important operating states by telemetrically transmitted status signals. 6.2 Equipment PC for data acquisition. 6.3 Performance of test A PC was connected locally via Ethernet to the AMS and the transfer of data including system status was tested. Furthermore, it is possible to monitor and operate the instrument via serial interface. It is also easy to monitor and operate the AMS remotely with an appropriate router or modem. 6.4 Evaluation The measuring system enables an extensive telemetric control and operation in a variety of ways (Ethernet, RS232, RS485). 6.5 Assessment The measuring systems can be extensively monitored and operated from an external PC via modem or router. Minimum requirement fulfilled? yes 6.6 Detailed presentation of test results Not required for this test. 740300_2013_936_21209885F_EN.docx TÜV Rheinland Energie und Umwelt GmbH Air Pollution Control Report on the suitability test of the ambient air quality measuring system Model 5030i SHARP with PM2.5 pre-separator of the company Thermo Fisher Scientific for the component suspended particulate matter PM2.5, Report No.: 936/21209885/F 6.1 Page 93 of 424 5.2.6 Switch-over Switch-over between measurement and functional check and/or calibration shall be possible telemetrically by computer control or manual intervention. 6.2 Equipment No additional equipment required. 6.3 Performance of test The AMS can be monitored and partly operated by the user directly on the instrument or via telemetric remote control. Some functions, e.g. performing a span foil test for checking the mass coefficient of the radiometric measurement, can only be activated directly on the instrument. 6.4 Evaluation All operating procedures that do not require practical work on site can be monitored by the user directly on the instrument as well as by telemetric remote control. 6.5 Assessment In principle, all necessary operations for performing a functional check can be monitored directly on the system or via telemetric remote control. Minimum requirement fulfilled? yes 6.6 Detailed presentation of test results Not required for this test. 740300_2013_936_21209885F_EN.docx TÜV Rheinland Energie und Umwelt GmbH Air Pollution Control Page 94 of 424 6.1 Report on the suitability test of the ambient air quality measuring system Model 5030i SHARP with PM2.5 pre-separator of the company Thermo Fisher Scientific for the component suspended particulate matter PM2.5, Report No.: 936/21209885/F 5.2.7 Maintenance interval The maintenance interval of the measuring system shall be determined during the field test and specified. The maintenance interval should be three months, if possible, but at least two weeks. 6.2 Equipment No additional equipment required. 6.3 Performance of test This test was carried out in order to determine, which maintenance procedures are required at which period to maintain the correct functionality of the measuring system. Furthermore, the results of the zero and span drift test described in point 6.1 5.3.12 Long-term drift were taken into account for the determination of the maintenance interval. 6.4 Evaluation No drifts beyond the permissible limits were detected during the entire field test period. Therefore, the maintenance interval is determined by the specified maintenance procedures (see module 4.1.2). During operation, the maintenance works can be limited to checks of contamination, plausibility and status/error messages. 6.5 Assessment The maintenance interval is defined by the necessary maintenance procedures and has been set to 1 month. Minimum requirement fulfilled? yes 6.6 Detailed presentation of test results The necessary maintenance works can be found in module 4.1.2 of this report and in chapter 5 of the instruction manual. 740300_2013_936_21209885F_EN.docx TÜV Rheinland Energie und Umwelt GmbH Air Pollution Control Report on the suitability test of the ambient air quality measuring system Model 5030i SHARP with PM2.5 pre-separator of the company Thermo Fisher Scientific for the component suspended particulate matter PM2.5, Report No.: 936/21209885/F 6.1 Page 95 of 424 5.2.8 Availability The availability of the measuring system shall be determined during the field test and shall be at least 95 %. 6.2 Equipment No additional equipment required. 6.3 Performance of test The start and end times of the availability tests were defined by the start and end of the field tests at each test site. All measurement interruptions, e.g. due to system failures or maintenance works, were taken into account. 6.4 Evaluation Table 16 and Table 17 show a summary of the operation, maintenance and malfunction times. The measuring systems were operated over a period of 313 measurement days (see annex 5). This period includes a total of 22 days of zero filter operation, audits and days, which had to be rejected due to the change to zero filter (see annex 5). Outages caused by external influences, which cannot be attributed to the devices themselves, were recorded on 10 March 2011 and 14 March 2011 (power outage). Since the AMS needs some hours for stabilising, one day following the outages had to be discarded as well. Furthermore, SN 1 was switched off inadvertently on 26 April 2011. Therefore, both the 26 and 27 April 2011 could not be evaluated. An unintended switch-off of SN 1 was also recorded on 3 May 2011. This time, the system was down for a very short time, so that the data of the following day did not have to be discarded. On this account, the total operating time is reduced to 306 days for SN 1 and 309 days for SN 2. The systems presented the following malfunctions: SN 1: A malfunction of SN 1 was observed on 8 August 2012 at the test site Teddington (summer). It was, however, not noticed directly and the staff on site could not identify its cause. Troubleshooting was also delayed due to vacation of the staff and the associated communication problems. For this reason, the measuring system could only be brought back to normal operation on 6 September 2012. The cause of the failure was a faulty pressure sensor. The long outage period cannot only be attributed to the measuring system itself, since the identification and troubleshooting of such a problem by the staff is usually performed within a week. Therefore, this outage was taken up in the evaluation with a duration of 8 days. SN 2: SN 2 presented a malfunction of the nephelometer at the test site Bornheim (summer). The system had to be repaired, for which the values measured from 28 July 2011 to 4 August 2011 had to be discarded. On 9 August 2011, a failure of the filter tape was observed. The cause was not identified. Errors in the stabilisation of the SHARP signal were observed from 11 September 2012 to 13 September 2012 at the test site Teddington (summer). Again, the cause could not be identified. No further malfunctions of the instruments were observed. The customary maintenance works (not including zero filter operation), e.g. maintenance of the sampling inlet and check of flow rate / leak tightness, generally do not take more than approx. 1 h per day. For this reason, the pertaining daily averages were not discarded. 740300_2013_936_21209885F_EN.docx TÜV Rheinland Energie und Umwelt GmbH Air Pollution Control Report on the suitability test of the ambient air quality measuring system Model 5030i SHARP with PM2.5 pre-separator of the company Thermo Fisher Scientific for the component suspended particulate matter PM2.5, Report No.: 936/21209885/F Page 96 of 424 6.5 Assessment The availability was 97.4 % for SN 1 and 96.1 % for SN 2 without test-related outages, or 90.2 % for SN 1 and 89.0 % for SN 2 including test-related outages. Minimum requirement fulfilled? yes 6.6 Detailed presentation of test results Table 16: Determination of availability (without test-related outages) System 1 (SN 1) System 2 (SN 2) Operating time d 306 309 Outage time d 8 12 Maintenance d 0 0 Actual operating time d 298 297 Availability % 97.4 96.1 Table 17: Determination of availability (including test-related outages) System 1 (SN 1) System 2 (SN 2) Operating time d 306 309 Outage time d 8 12 Maintenance incl. zero filter operation d 22 22 Actual operating time d 276 275 Availability % 90.2 89.0 740300_2013_936_21209885F_EN.docx TÜV Rheinland Energie und Umwelt GmbH Air Pollution Control Report on the suitability test of the ambient air quality measuring system Model 5030i SHARP with PM2.5 pre-separator of the company Thermo Fisher Scientific for the component suspended particulate matter PM2.5, Report No.: 936/21209885/F 6.1 5.2.9 Page 97 of 424 Instrument software The version of the instrument software to be tested shall be displayed during switch-on of the measuring system. The test institute shall be informed on changes in the instrument software, which have influence on the performance of the measuring system. 6.2 Equipment No additional equipment required. 6.3 Performance of test It was tested, whether the instrument software version can be displayed on the instrument. The manufacturer was made aware that any change to the instrument software must be reported to the test institute. 6.4 Evaluation The current software version is not displayed on the instrument during switch-on. It can, however, be reviewed at any time by selecting the menu “Diagnostics”, item “Program Versions”. The test started in the year 2009 with the software version V00.05.41.114. The software was steadily enhanced and optimised during the course of testing. At the beginning of the field test in January 2011, software version V01.00.01.197 was implemented. This version was used during the whole field test. The software was updated to version V01.00.03.225 after conclusion of the regular field test and before starting the remaining laboratory tests. This software version was as well installed during the additional comparison campaign “Bornheim, summer 2013. In the meantime the software version was set to the current version V02.00.00.232+ due to a discontinuation of a processor board. An overview of software changes can be found in Section 4.1General. The reliability of the AMS was consistently increased with every change. The changes introduced up to version V02.00.00.232+ are not expected to affect the performance of the AMS significantly. 6.5 Assessment The version of the instrument software is shown on the display. Changes to the instrument software are communicated to the test institute. Minimum requirement fulfilled? yes 740300_2013_936_21209885F_EN.docx TÜV Rheinland Energie und Umwelt GmbH Air Pollution Control Report on the suitability test of the ambient air quality measuring system Model 5030i SHARP with PM2.5 pre-separator of the company Thermo Fisher Scientific for the component suspended particulate matter PM2.5, Report No.: 936/21209885/F Page 98 of 424 6.6 Detailed presentation of test results Figure 34: Software version (here V02.00.00.232+) displayed by selection of the menu “Diagnostics / Program Versions” Note: The subordinate software versions FIRMWARE (general parameters of the i-series), B/AMPL (beta / amplifier) and NEPH (nephelometer) listed in the software display above are fixed main software components. Changes to the subordinate programmes FIRMWARE (general parameters of the i-series), B/AMPL (beta / amplifier) and NEPH (nephelometer) are necessarily bound to a change in the main software. 740300_2013_936_21209885F_EN.docx TÜV Rheinland Energie und Umwelt GmbH Air Pollution Control Report on the suitability test of the ambient air quality measuring system Model 5030i SHARP with PM2.5 pre-separator of the company Thermo Fisher Scientific for the component suspended particulate matter PM2.5, Report No.: 936/21209885/F 6.1 Page 99 of 424 5.3.1 General The test is based on the minimum requirements of Standard VDI 4202 Part 1 (September 2010). 6.2 Equipment No additional equipment required. 6.3 Performance of test The test is based on the minimum requirements of Standard VDI 4202, Part 1 (September 2010). 6.4 Evaluation Standard VDI 4202, Part 1 and VDI 4203, Part 3 were republished after an extensive revision with latest update September 2010. Unfortunately, after this revision uncertainties and contradictions remain regarding the concrete minimum requirements on the one hand, and the general relevance of the test points on the other hand when testing particulate ambient air measuring devices. The following test points require clarification: 6.1 5.3.2 Repeatability standard deviation at zero point no minimum requirement defined 6.1 5.3.3 Repeatability standard deviation at reference point not relevant for particulate devices 6.1 5.3.4 Linearity (lack of fit) not relevant for particulate devices 6.1 5.3.7 Sensitivity coefficient of surrounding temperature no minimum requirement defined 6.1 5.3.8 Sensitivity coefficient of supply voltage no minimum requirement defined 6.1 5.3.11 Standard deviation from paired measurement no minimum requirement defined 6.1 5.3.12 Long-term drift no minimum requirement defined 6.1 5.3.13 Short-term drift not relevant for particulate devices 6.1 5.3.18 Overall uncertainty not relevant for particulate devices For this reason an official request to the competent German body was made, to define a coordinated procedure for dealing with inconsistencies in the Standard. 740300_2013_936_21209885F_EN.docx TÜV Rheinland Energie und Umwelt GmbH Air Pollution Control Page 100 of 424 Report on the suitability test of the ambient air quality measuring system Model 5030i SHARP with PM2.5 pre-separator of the company Thermo Fisher Scientific for the component suspended particulate matter PM2.5, Report No.: 936/21209885/F The following procedure was suggested: Test points 5.3.2, 5.3.7, 5.3.8, 5.3.11 and 5.3.12 are evaluated as before basing on the minimum requirements stated in VDI 4202 Part 1 of 2002 (i.e. using the reference values B0, B1 and B2). The performance of the test points 5.3.3, 5.3.4, 5.3.13 and 5.3.18 is omitted, as they are not relevant for particulate measuring devices. The competent German body agreed with the proposed procedure by decisions of 27 June 2011 and 07 October 2011. 6.5 Assessment The test is based on the minimum requirements of Standard VDI 4202, Part 1 (September 2010). Test points 5.3.2, 5.3.7, 5.3.8, 5.3.11 and 5.3.12 are evaluated as before basing on the minimum requirements stated in VDI 4202 Part 1 of 2002 (i.e. using the reference values B0, B1 and B2). The performance of the test points 5.3.3, 5.3.4, 5.3.13 and 5.3.18 is omitted, as they are not relevant for particulate measuring devices. Minimum requirement fulfilled? yes 6.6 Detailed presentation of test results Not required for this test. 740300_2013_936_21209885F_EN.docx TÜV Rheinland Energie und Umwelt GmbH Air Pollution Control Report on the suitability test of the ambient air quality measuring system Model 5030i SHARP with PM2.5 pre-separator of the company Thermo Fisher Scientific for the component suspended particulate matter PM2.5, Report No.: 936/21209885/F 6.1 Page 101 of 424 5.3.2 Repeatability standard deviation at zero point The repeatability standard deviation at zero point shall not exceed the requirements of Table 2 in the certification range according to Table 1 of Standard VDI 4202 Part 1 (September 2010). In case of deviating certification ranges, the repeatability standard deviation at zero point shall not exceed 2% of the upper limit of this certification range. Note: This item cannot be evaluated according to the current versions of Standards VDI 4202 Part 1 (September 2010) and VDI 4203 Part 3 (September 2010) when testing particulate measuring systems, due to the fact that a minimum requirement has not been defined. By resolution of the competent German body (see module 5.3.1), reference is made to the following requirement in the previous version of Standard VDI 4202 Part 1 (June 2002): The detection limit of the measuring system shall be smaller or equal to reference value B0. The detection limit shall be determined in the field. 6.2 Equipment Zero filter for testing the zero point. 6.3 Performance of test The detection limit is determined for candidates SN 1 and SN 2 by operating the devices with the respective zero filters installed at the inlets of both measuring systems. Sampling air free of suspended particulate matter was offered over a period of 15 days, for a duration of 24 h a day. The determination of the detection limit was done in the laboratory, since the provision of particulate-free air for such a long time was not possible under field conditions. 6.4 Evaluation The detection limit X is determined from the standard deviation sx0 of the SHARP measured values by applying particulate-free sampling air to both candidates. It corresponds to the standard deviation of the average x0 of the measured values x0i of each candidate multiplied with the Students factor: X = tn-1;0.95 ⋅ s x 0 Reference value: where ⋅ s x 0 = ∑ 1 ⋅ ( x 0i − x 0 ) 2 n − 1 i=1,n B0 = 2 µg/m³ 740300_2013_936_21209885F_EN.docx TÜV Rheinland Energie und Umwelt GmbH Air Pollution Control Report on the suitability test of the ambient air quality measuring system Model 5030i SHARP with PM2.5 pre-separator of the company Thermo Fisher Scientific for the component suspended particulate matter PM2.5, Report No.: 936/21209885/F Page 102 of 424 6.5 Assessment The investigations result in detection limits of 0.11 µg/m³ for system 1 (SN 1) and 0.07 µg/m³ for system 2 (SN 2). Minimum requirement fulfilled? yes 6.6 Detailed presentation of test results Table 18: Detection limit PM2.5 Number of values n System SN 1 System SN 2 15 15 Mean of the zero values x 0 µg/m³ 0.02 0.03 Standard deviation of values s x 0 µg/m³ 0.05 0.03 2.14 2.14 0.11 0.07 Students Factor tn-1;0.95 Detection limit X µg/m³ Single values from the determination of the detection limit can be looked up in annex 1 of the appendix. 740300_2013_936_21209885F_EN.docx TÜV Rheinland Energie und Umwelt GmbH Air Pollution Control Report on the suitability test of the ambient air quality measuring system Model 5030i SHARP with PM2.5 pre-separator of the company Thermo Fisher Scientific for the component suspended particulate matter PM2.5, Report No.: 936/21209885/F 6.1 Page 103 of 424 5.3.3 Repeatability standard deviation at reference point The repeatability standard deviation at reference point shall not exceed the requirements of Table 2 in the certification range according to Table 1 of Standard VDI 4202 Part 1 (September 2010). The limit value or the alert threshold shall be used as reference point. In case of deviating certification ranges, the repeatability standard deviation at reference point shall not exceed 2 % of the upper limit of this certification range. In this case a value ct at 70 % to 80 % of the upper limit of this certification range shall be used as reference point. Note: By resolution of the competent German body (see module 5.3.1), this test is not relevant for particulate measuring systems. 6.2 Equipment Not applicable. 6.3 Performance of test Not applicable. 6.4 Evaluation Not applicable. 6.5 Assessment Not applicable. Minimum requirement fulfilled? 6.6 Detailed presentation of test results Not applicable. 740300_2013_936_21209885F_EN.docx TÜV Rheinland Energie und Umwelt GmbH Air Pollution Control Page 104 of 424 6.1 Report on the suitability test of the ambient air quality measuring system Model 5030i SHARP with PM2.5 pre-separator of the company Thermo Fisher Scientific for the component suspended particulate matter PM2.5, Report No.: 936/21209885/F 5.3.4 Linearity (lack of fit) The analytical function describing the relationship between the output signal and the value of the air quality characteristic shall be linear. Reliable linearity is given, if deviations of the group averages of measured values about the calibration function meet the requirements of Table 2 of in the certification range according to Table 1 of Standard VDI 4202 Part 1 (September 2010). For all other certification ranges the group averages of measured values about the calibration function shall not exceed 5 % of the upper limit of the corresponding certification range. Note: By resolution of the competent German body (see module 5.3.1), this test is not relevant for particulate measuring systems. For PM2.5 particulate measuring systems, this test shall be performed according to minimum requirement 5.4.10 “Calculation of the expanded uncertainty of the instruments”. 6.2 Equipment See module 5.4.10 (PM2.5) 6.3 Performance of test For PM2.5 particulate measuring systems, this test shall be performed according to minimum requirement 5.4.10 “Calculation of the expanded uncertainty of the instruments” 6.4 Evaluation See module 5.4.10 (PM2.5) 6.5 Assessment For PM2.5 particulate measuring systems, this test shall be performed according to minimum requirement 5.4.10 “Calculation of the expanded uncertainty of the instruments”. Minimum requirement fulfilled? 6.6 Detailed presentation of test results See module 5.4.10 (PM2.5) 740300_2013_936_21209885F_EN.docx TÜV Rheinland Energie und Umwelt GmbH Air Pollution Control Report on the suitability test of the ambient air quality measuring system Model 5030i SHARP with PM2.5 pre-separator of the company Thermo Fisher Scientific for the component suspended particulate matter PM2.5, Report No.: 936/21209885/F 6.1 Page 105 of 424 5.3.5 Sensitivity coefficient of sample gas pressure The sensitivity coefficient of sample gas pressure at reference point shall not exceed the requirements of Table 2 of Standard VDI 4202 Part 1 (September 2010). A value ct at 70 % to 80 % of the upper limit of the certification range shall be used as reference point. Note: This test is not relevant for particulate measuring systems. 6.2 Equipment Not applicable. 6.3 Performance of test Not applicable. 6.4 Evaluation Not applicable. 6.5 Assessment Not applicable. Minimum requirement fulfilled? 6.6 Detailed presentation of test results Not applicable. 740300_2013_936_21209885F_EN.docx TÜV Rheinland Energie und Umwelt GmbH Air Pollution Control Page 106 of 424 6.1 Report on the suitability test of the ambient air quality measuring system Model 5030i SHARP with PM2.5 pre-separator of the company Thermo Fisher Scientific for the component suspended particulate matter PM2.5, Report No.: 936/21209885/F 5.3.6 Sensitivity coefficient of sample gas temperature The sensitivity coefficient of sample gas temperature at reference point shall not exceed the requirements of Table 2 of Standard VDI 4202 Part 1 (September 2010). A value ct at 70 % to 80 % of the upper limit of the certification range shall be used as reference point. Note: This test is not relevant for particulate measuring systems. 6.2 Equipment Not applicable. 6.3 Performance of test Not applicable. 6.4 Evaluation Not applicable. 6.5 Assessment Not applicable. Minimum requirement fulfilled? 6.6 Detailed presentation of test results Not applicable. 740300_2013_936_21209885F_EN.docx TÜV Rheinland Energie und Umwelt GmbH Air Pollution Control Report on the suitability test of the ambient air quality measuring system Model 5030i SHARP with PM2.5 pre-separator of the company Thermo Fisher Scientific for the component suspended particulate matter PM2.5, Report No.: 936/21209885/F 6.1 Page 107 of 424 5.3.7 Sensitivity coefficient of surrounding temperature The sensitivity coefficient of surrounding temperature at zero and reference point shall not exceed the requirements of Table 2 of Standard VDI 4202 Part 1 (September 2010). A value ct at 70 % to 80 % of the upper limit of the certification range shall be used as reference point. Note: This item cannot be evaluated according to the current versions of Standards VDI 4202 Part 1 (September 2010) and VDI 4203 Part 3 (September 2010) when testing particulate measuring systems, due to the fact that a minimum requirement has not been defined. By resolution of the competent German body (see module 5.3.1), reference is made to the following requirement in the previous version of Standard VDI 4202 Part 1 (June 2002): The temperature dependence of the measured value at zero concentration shall not exceed the reference value B0 if ambient temperature is changed by 15 K in the range of +5 °C to +20 °C or by 20 K in the range of +20 °C to +40 °C. The temperature dependence of the measured value in the range of the reference value B1 shall not exceed 5 % of the measured value if ambient temperature is changed by 15 K in the range of +5 °C and +20 °C or by 20 K in the range of +20 °C and +40 °C. 6.2 Equipment Climatic chamber for a temperature range of +5 to +40 °C, zero filter for testing the zero point and span foil set for testing the span point. 6.3 Performance of test In order to test the dependence of zero point and measured values on the surrounding temperature, the complete measuring systems were operated in a climatic chamber. For the zero point test zero filters were installed at the inlets of both measuring systems SN 1 and SN 2, to which particle-free sampling air was applied. The reference point test comprised a check of the mass coefficient in order to test the stability of the sensitivity of both candidates SN 1 and SN 2. It is not possible to produce a reproducible signal for the sensitivity of the nephelometer using external test standards. Since the nephelometer is continuously calibrated with a very stable radiometric measurement, a separate examination of the stability of the nephelometer’s signal at the reference point under operating conditions can be omitted. The potential dependence of the nephelometer’s signal on surrounding temperature is thus examined solely at the zero point. 740300_2013_936_21209885F_EN.docx TÜV Rheinland Energie und Umwelt GmbH Air Pollution Control Page 108 of 424 Report on the suitability test of the ambient air quality measuring system Model 5030i SHARP with PM2.5 pre-separator of the company Thermo Fisher Scientific for the component suspended particulate matter PM2.5, Report No.: 936/21209885/F The devices were exposed to the following surrounding temperature sequence in the climatic chamber: 20 °C – 5 °C – 20 °C – 40 °C – 20 °C. After an equilibration time of approx. 24 h per temperature step, the recording of measured values at zero point (3 x 24 h per temperature step) and at reference point (3 x per temperature step) started. 6.4 Evaluation Zero point: The values measured at the concentration of the respective 24 h single measurements were read out and evaluated. The absolute deviation in µg/m³ per temperature step was examined in relation to the default value at 20 °C. Reference value: B0 = 2 µg/m³ Reference point: The percentage change of the determined measured values for the mass coefficient was examined at each temperature step in relation to the default value at 20 °C. It should be noted that concentration values could not be simulated by checking the mass coefficient. It was therefore not possible to examine the range of B1. 6.5 Assessment The maximum dependence on surrounding temperature in the range 5 °C to 40 °C was 0.2 µg/m³ at zero. No deviation > -2.6 % of the default value at 20 °C could be observed at reference point. Minimum requirement fulfilled? yes 740300_2013_936_21209885F_EN.docx TÜV Rheinland Energie und Umwelt GmbH Air Pollution Control Report on the suitability test of the ambient air quality measuring system Model 5030i SHARP with PM2.5 pre-separator of the company Thermo Fisher Scientific for the component suspended particulate matter PM2.5, Report No.: 936/21209885/F 6.6 Page 109 of 424 Detailed presentation of test results Table 19: Dependence of the zero point (SHARP) on surrounding temperature, deviation in µg/m³, average of three measurements Temperature Deviation Start temperature End temperature SN 1 SN 2 °C °C µg/m³ µg/m³ 20 5 0.0 0.1 5 20 0.0 0.0 20 40 0.2 0.0 40 20 0.0 0.0 Table 20: Dependence of sensitivity (mass coefficient) on surrounding temperature, deviation in %, average of three measurements Temperature Deviation Start temperature End temperature SN 1 SN 2 °C °C [%] [%] 20 5 0.2 -1.3 5 20 -0.5 -2.6 20 40 2.0 -1.0 40 20 0.6 -0.5 740300_2013_936_21209885F_EN.docx TÜV Rheinland Energie und Umwelt GmbH Air Pollution Control Report on the suitability test of the ambient air quality measuring system Model 5030i SHARP with PM2.5 pre-separator of the company Thermo Fisher Scientific for the component suspended particulate matter PM2.5, Report No.: 936/21209885/F Page 110 of 424 Table 21: Dependence of the zero point (NEPH) on surrounding temperature, deviation in µg/m³, average of three measurements Temperature Deviation Start temperature End temperature SN 1 (NEPH) SN 2 (NEPH) °C °C µg/m³ µg/m³ 20 5 0.0 0.1 5 20 0.0 0.0 20 40 0.2 -0.1 40 20 0.0 0.1 The results of the three single measurements are presented in annexes 2 and 3 of the appendix. 740300_2013_936_21209885F_EN.docx TÜV Rheinland Energie und Umwelt GmbH Air Pollution Control Report on the suitability test of the ambient air quality measuring system Model 5030i SHARP with PM2.5 pre-separator of the company Thermo Fisher Scientific for the component suspended particulate matter PM2.5, Report No.: 936/21209885/F 6.1 Page 111 of 424 5.3.8 Sensitivity coefficient of supply voltage The sensitivity coefficient of supply voltage shall not exceed the requirements of Table 2 of Standard VDI 4202 Part 1 (September 2010). A value ct at 70 % to 80 % of the upper limit of the certification range shall be used as reference point. Note: This item cannot be evaluated according to the current versions of Standards VDI 4202 Part 1 (September 2010) and VDI 4203 Part 3 (September 2010) when testing particulate measuring systems, due to the fact that a minimum requirement has not been defined. By resolution of the competent German body (see module 5.3.1), reference is made to the following requirement in the previous version of Standard VDI 4202 Part 1 (June 2002): The change in the measured values at reference value B1 caused by normal changes in the mains voltage in the interval (230 +15/-20) V shall not exceed B0. 6.2 Equipment Adjustable isolating transformer and span foil set for testing the reference point. 6.3 Performance of test In order to test the dependence of the measured signals on supply voltage, the voltage was reduced from 230 V to 210 V and then increased with an intermediate step of 230 V to 245 V. The reference point test comprised a check of the mass coefficient in order to test the stability of the sensitivity of both candidates SN 1 and SN 2. Since the AMS is not intended for mobile application, a separate check of the dependence of the measured signals on the mains frequency was omitted. 6.4 Evaluation The percentage change of the determined measured values for the mass coefficient was examined at each voltage step in relation to the default value at 230 V. It should be noted that concentration values could not be simulated by checking the mass coefficient. It was therefore not possible to examine the range of B1. 740300_2013_936_21209885F_EN.docx TÜV Rheinland Energie und Umwelt GmbH Air Pollution Control Report on the suitability test of the ambient air quality measuring system Model 5030i SHARP with PM2.5 pre-separator of the company Thermo Fisher Scientific for the component suspended particulate matter PM2.5, Report No.: 936/21209885/F Page 112 of 424 6.5 Assessment No deviations > -1.4 % in relation to the default value at 230 V caused by voltage changes could be detected for PM2.5. Minimum requirement fulfilled? yes 6.6 Detailed presentation of test results Table 22 shows a summary of the test results. Table 22: Dependence of the measured values on mains voltage, deviation in % Mains voltage Deviation Start voltage End voltage SN 1 SN 2 V V [%] [%] 230 190 -0.2 -0.7 190 230 0.3 -1.3 230 245 0.1 -0.9 245 230 -0.4 -1.4 The single values are presented in annex 4 of the appendix. 740300_2013_936_21209885F_EN.docx TÜV Rheinland Energie und Umwelt GmbH Air Pollution Control Report on the suitability test of the ambient air quality measuring system Model 5030i SHARP with PM2.5 pre-separator of the company Thermo Fisher Scientific for the component suspended particulate matter PM2.5, Report No.: 936/21209885/F 6.1 Page 113 of 424 5.3.9 Cross-sensitivity The change in the measured value caused by interfering components in the sample gas shall not exceed the requirements of Table 2 of Standard VDI 4202 Part 1 (September 2010) at zero and reference point. Note: This test is not relevant for particulate measuring systems. Instead, minimum requirement 5.4.5 is valid. The results of this test can be found in module 5.4.5. 6.2 Equipment Not applicable. 6.3 Performance of test Not applicable. 6.4 Evaluation Not applicable. 6.5 Assessment Not applicable. Minimum requirement fulfilled? 6.6 Detailed presentation of test results Not applicable. 740300_2013_936_21209885F_EN.docx TÜV Rheinland Energie und Umwelt GmbH Air Pollution Control Report on the suitability test of the ambient air quality measuring system Model 5030i SHARP with PM2.5 pre-separator of the company Thermo Fisher Scientific for the component suspended particulate matter PM2.5, Report No.: 936/21209885/F Page 114 of 424 6.1 5.3.10 Averaging effect For gaseous components the measuring system shall allow the formation of hourly averages. The averaging effect shall not exceed the requirements of Table 2 of Standard VDI 4202 Part 1 (September 2010). Note: This test is not relevant for particulate measuring systems. 6.2 Equipment Not applicable. 6.3 Performance of test Not applicable. 6.4 Evaluation Not applicable. 6.5 Assessment Not applicable. Minimum requirement fulfilled? 6.6 Detailed presentation of test results Not applicable. 740300_2013_936_21209885F_EN.docx TÜV Rheinland Energie und Umwelt GmbH Air Pollution Control Report on the suitability test of the ambient air quality measuring system Model 5030i SHARP with PM2.5 pre-separator of the company Thermo Fisher Scientific for the component suspended particulate matter PM2.5, Report No.: 936/21209885/F 6.1 5.3.11 Page 115 of 424 Standard deviation from paired measurement The standard deviation from paired measurements under field conditions shall be determined with two identical measuring systems by paired measurements in the field test. It shall not exceed the requirements of Table 2 of Standard VDI 4202 Part 1 (September 2010). Note: This item cannot be evaluated according to the current versions of Standards VDI 4202 Part 1 (September 2010) and VDI 4203 Part 3 (September 2010) when testing particulate measuring systems, due to the fact that a minimum requirement has not been defined. By resolution of the competent German body (see module 5.3.1), reference is made to the following requirement in the previous version of Standard VDI 4202 Part 1 (June 2002): The “Reproduzierbarkeit” [reproducibility] RD of the measuring system shall be determined by parallel measurements with two identical measuring systems and shall be at least equal to 10. B1 shall be used as the reference value. 6.2 Equipment The reproducibility was determined with the auxiliary equipment described in Section 5. 6.3 Performance of test Reproducibility is defined as the maximum difference between two randomly chosen single values obtained under equal conditions. This test was carried out with two identical systems operated simultaneously during the field test. All measurement data obtained during the field test was evaluated. 6.4 Evaluation The reproducibility is calculated as follows: R = B1 ≥ 10 where U • • • • • • • • R U B1 sD n t(n;0,95) x1i x2i = = = = = = = = U = ±s D ⋅ t (n;0,95 ) and sD = 1 ⋅ 2n n ∑ (x 1i − x 2i ) 2 i=1 Reproducibility at B1 Uncertainty 25 µg/m³ for PM2.5 Standard deviation from paired measurements No. of paired measurements Students factor at confidence level of 95 % Measured signal of system 1 (e.g. SN 1) at ith concentration. Measured signal of system 2 (e.g. SN 2) at ith concentration. 740300_2013_936_21209885F_EN.docx TÜV Rheinland Energie und Umwelt GmbH Air Pollution Control Report on the suitability test of the ambient air quality measuring system Model 5030i SHARP with PM2.5 pre-separator of the company Thermo Fisher Scientific for the component suspended particulate matter PM2.5, Report No.: 936/21209885/F Page 116 of 424 6.5 Assessment The reproducibility for PM2.5 was 10 for the complete dataset of the field test. Minimum requirement fulfilled? yes 6.6 Detailed presentation of test results The test results are summarised in Table 23. The graphical representation for PM2.5 is shown in Figure 41 to Figure 45. Note: The determined uncertainties are applied to reference value B1 for each test site. Table 23: Test site Concentration averages, standard deviation, uncertainty range and reproducibility in the field, measured component PM2.5 No. of values c c (SN 1) (SN 2) µg/m³ µg/m³ c ges sD µg/m³ µg/m³ t U R µg/m³ Cologne (winter) 52 20.1 20.4 20.3 0.827 2.007 1.66 15 Bornheim (summer) 91 11.8 11.7 11.7 1.354 1.986 2.69 9 Bornheim (winter) 49 21.3 21.3 21.3 1.033 2.010 2.08 12 Teddington (summer) 50 7.1 7.3 7.2 0.956 2.009 1.92 13 All sites 242 14.5 14.6 14.6 1.255 1.970 2.47 10 • • • c (SN 1): Concentration averages, system SN 1 c (SN 2): Concentration averages, system SN 2 c ges : Concentration averages of systems SN 1 & SN 2 The single values are presented in annex 5 of the appendix. 740300_2013_936_21209885F_EN.docx TÜV Rheinland Energie und Umwelt GmbH Air Pollution Control Report on the suitability test of the ambient air quality measuring system Model 5030i SHARP with PM2.5 pre-separator of the company Thermo Fisher Scientific for the component suspended particulate matter PM2.5, Report No.: 936/21209885/F 6.1 5.3.12 Page 117 of 424 Long-term drift The long-term drift at zero point and reference point shall not exceed the requirements of Table 2 of Standard VDI 4202 Part 1 (September 2010) in the field test. A value ct at 70 % to 80 % of the upper limit of the certification range shall be used as reference point. Note: This item cannot be evaluated according to the current versions of Standards VDI 4202 Part 1 (September 2010) and VDI 4203 Part 3 (September 2010) when testing particulate measuring systems, due to the fact that a minimum requirement has not been defined. By resolution of the competent German body (see module 5.3.1), reference is made to the following requirement in the previous version of Standard VDI 4202 Part 1 (June 2002): The temporal change in the measured value at zero concentration shall not exceed the reference value B0 in 24 h and in the maintenance interval. The temporal change in the measured value in the range of the reference value B1 shall not exceed 5 % of B1 in 24 h and in the maintenance interval. 6.2 Equipment Zero filter for testing the zero point and span foil set for testing the reference point. 6.3 Performance of test The test was performed as part of the field test over a period 20 months. As part of the monthly regular checks (including those at the beginning and at the end of tests at each field test site), the measuring systems were operated with a zero filter at the device inlet over a period of at least 24 h each. The values obtained at zero concentration were evaluated. Furthermore, the stability of the mass coefficient was tested and evaluated as reference point check at the beginning and at the end of the tests at each field test site. It is not possible to produce a reproducible signal for the sensitivity of the nephelometer using external test standards. Since the nephelometer is continuously calibrated with a very stable radiometric measurement, a separate examination of the stability of the nephelometer’s signal at the reference point can be omitted. 740300_2013_936_21209885F_EN.docx TÜV Rheinland Energie und Umwelt GmbH Air Pollution Control Page 118 of 424 6.4 Report on the suitability test of the ambient air quality measuring system Model 5030i SHARP with PM2.5 pre-separator of the company Thermo Fisher Scientific for the component suspended particulate matter PM2.5, Report No.: 936/21209885/F Evaluation An evaluation of the drift at zero point and of the measured value in 24 h is not possible. The zero point drift was evaluated on the basis of the results of the external zero point measurements performed on a regular basis. For this, the values were compared with the “measured values” of the previous test and with the “measured values” of the first test. The reference point drift was evaluated on the basis of the results of the mass coefficient determination. Here again, the values were compared with the “measured values” of the previous test and with the “measured values” of the first test. The large deviation found for SN 1 during the span foil measurements carried out from 12 May 2011 to 19 July 2011 was caused by a damaged filter foil set. This was only detected on 14 November 2011, after another unusually large deviation was found. The test was then repeated with a new set of filter foils and the system passed showing no abnormalities. The deviations determined by comparison with the previous values (see yellow marking in Table 25) are therefore not attributable to the measuring system. It should be noted that concentration values could not be simulated by checking the mass coefficient. It was therefore not possible to examine the range of B1. 6.5 Assessment The maximum deviation at zero point was 2.4 µg/m³ in relation to the previous value and 2.2 µg/m³ in relation to the start value, and is therefore within the permissible limits of B0 = 2 µg/m³. The values obtained during the sensitivity drift tests amount to a maximum of -2.9 % in relation to the previous value for PM2.5. Minimum requirement fulfilled? yes 6.6 Detailed presentation of test results Table 24 presents the values obtained at zero concentration and the calculated deviations in relation to the previous value and to the start value in µg/m³. Figure 35 to Figure 36 presents a graph of the zero point drift during the entire test. Table 25 shows the deviations of the measured values from the respective previous value in %. Figure 37 and Figure 38 presents a graph of the drift of the measured values (in relation to the previous value). 740300_2013_936_21209885F_EN.docx TÜV Rheinland Energie und Umwelt GmbH Air Pollution Control Report on the suitability test of the ambient air quality measuring system Model 5030i SHARP with PM2.5 pre-separator of the company Thermo Fisher Scientific for the component suspended particulate matter PM2.5, Report No.: 936/21209885/F Table 24: Date 3/5/2011 3/6/2011 3/7/2011 4/8/2011 4/9/2011 4/10/2011 5/10/2011 5/11/2011 7/22/2011 7/23/2011 7/24/2011 9/17/2011 9/18/2011 10/22/2011 10/23/2011 11/11/2011 11/12/2011 11/13/2011 2/11/2012 2/12/2012 3/9/2012 3/10/2012 9/8/2012 9/9/2012 10/12/2012 10/13/2012 Page 119 of 424 Zero point drift SN 1 & SN 2, test with zero filter Measured Value SN 1 Deviation from previous value Deviation from start value µg/m³ µg/m³ µg/m³ 0.1 2.2 0.0 -0.1 0.0 0.0 0.0 0.0 0.0 0.0 0.0 0.0 0.1 -0.1 -0.1 0.0 -0.1 0.0 -0.1 2.0 0.0 0.0 0.0 0.0 0.0 0.0 2.2 -2.3 0.0 0.0 0.1 0.0 0.0 0.0 0.0 0.0 0.0 0.1 -0.3 0.0 0.1 -0.1 0.0 -0.1 2.0 -2.0 0.1 -0.1 0.0 0.0 0.0 2.2 -0.1 -0.1 -0.1 0.0 -0.1 -0.1 -0.1 -0.1 -0.1 0.0 0.1 -0.2 -0.2 0.0 -0.1 -0.1 -0.1 1.9 -0.1 0.0 -0.1 -0.1 0.0 -0.1 Date 3/5/2011 3/6/2011 3/7/2011 4/8/2011 4/9/2011 4/10/2011 5/10/2011 5/11/2011 7/22/2011 7/23/2011 7/24/2011 9/17/2011 9/18/2011 10/22/2011 10/23/2011 11/11/2011 11/12/2011 11/13/2011 2/11/2012 2/12/2012 3/9/2012 3/10/2012 9/8/2012 9/9/2012 10/12/2012 10/13/2012 Measured Value SN 2 Deviation from previous value Deviation from start value µg/m³ µg/m³ µg/m³ 0.0 0.0 -0.1 0.4 1.8 0.0 0.1 0.0 0.0 -0.1 2.2 -0.2 -0.1 -0.1 0.0 1.1 0.0 0.0 -0.1 2.3 0.0 0.0 -0.1 0.0 0.0 0.7 -0.1 0.0 0.5 1.4 -1.8 0.1 -0.1 0.1 -0.1 2.3 -2.4 0.2 0.0 0.2 1.0 -1.1 0.1 -0.2 2.4 -2.3 -0.1 0.0 0.0 0.0 0.7 -0.1 -0.1 0.3 1.7 -0.1 0.0 -0.1 0.0 -0.2 2.1 -0.3 -0.1 -0.2 0.0 1.0 -0.1 0.0 -0.2 2.2 0.0 -0.1 -0.1 -0.1 -0.1 0.7 740300_2013_936_21209885F_EN.docx TÜV Rheinland Energie und Umwelt GmbH Air Pollution Control Report on the suitability test of the ambient air quality measuring system Model 5030i SHARP with PM2.5 pre-separator of the company Thermo Fisher Scientific for the component suspended particulate matter PM2.5, Report No.: 936/21209885/F Page 120 of 424 Measured value [µg/m³] Zero point drift PM2,5 SN 1 5.0 4.0 3.0 2.0 1.0 0.0 -1.0 -2.0 -3.0 -4.0 -5.0 Time Figure 35: Zero point drift SN 1, measured component PM2.5 Measured value [µg/m³] Zero point drift PM2,5 SN 2 5.0 4.0 3.0 2.0 1.0 0.0 -1.0 -2.0 -3.0 -4.0 -5.0 Time Figure 36: Zero point drift SN 2, measured component PM2.5 740300_2013_936_21209885F_EN.docx TÜV Rheinland Energie und Umwelt GmbH Air Pollution Control Report on the suitability test of the ambient air quality measuring system Model 5030i SHARP with PM2.5 pre-separator of the company Thermo Fisher Scientific for the component suspended particulate matter PM2.5, Report No.: 936/21209885/F Table 25: Page 121 of 424 Sensitivity drift SN 1 & SN 2 Date Measured Value 1/27/2011 5/12/2011 7/19/2011 11/14/2011 3/8/2012 6/18/2012 10/19/2012 7170.9 7194.2 6890.2 7189.0 7332.3 7199.5 7214.0 SN 1 Deviation from previous value Deviation from start value % % 0.3 -4.2 4.3 2.0 -1.8 0.2 0.3 -3.9 0.3 2.3 0.4 0.6 Date Measured Value 1/27/2011 5/12/2011 7/19/2011 11/14/2011 3/8/2012 6/18/2012 10/19/2012 7178.5 7255.4 7270.6 7215.0 7006.9 7190.2 7119.2 SN 2 Deviation from previous value Deviation from start value % % 1.1 0.2 -0.8 -2.9 2.6 -1.0 1.1 1.3 0.5 -2.4 0.2 -0.8 740300_2013_936_21209885F_EN.docx TÜV Rheinland Energie und Umwelt GmbH Air Pollution Control Report on the suitability test of the ambient air quality measuring system Model 5030i SHARP with PM2.5 pre-separator of the company Thermo Fisher Scientific for the component suspended particulate matter PM2.5, Report No.: 936/21209885/F Page 122 of 424 Dev. from previous value [µg/m³] Span point drift PM2,5 SN 1 6.0 4.0 2.0 0.0 -2.0 -4.0 -6.0 Foilkit damaged, observed on Nov 14, Figure 37: Time Drift of the measured value SN 1, measured component PM2.5 Dev. from previous value [µg/m³] Span point drift PM2,5 SN 2 6.0 4.0 2.0 0.0 -2.0 -4.0 -6.0 Time Figure 38: Drift of the measured value SN 2, measured component PM2.5 740300_2013_936_21209885F_EN.docx TÜV Rheinland Energie und Umwelt GmbH Air Pollution Control Report on the suitability test of the ambient air quality measuring system Model 5030i SHARP with PM2.5 pre-separator of the company Thermo Fisher Scientific for the component suspended particulate matter PM2.5, Report No.: 936/21209885/F 6.1 5.3.13 Page 123 of 424 Short-term drift The short-term drift at zero point and reference point shall not exceed the requirements of Table 2 of Standard VDI 4202 Part 1 (September 2010) within 12 h (for benzene 24 h) in the laboratory test and within 24 h in the field test. A value ct at 70 % to 80 % of the upper limit of the certification range shall be used as reference point. Note: By resolution of the competent German body (see module 5.3.1), this test is not relevant for particulate measuring systems. 6.2 Equipment Not applicable. 6.3 Performance of test Not applicable. 6.4 Evaluation Not applicable. 6.5 Assessment Not applicable. Minimum requirement fulfilled? 6.6 Detailed presentation of test results Not applicable. 740300_2013_936_21209885F_EN.docx TÜV Rheinland Energie und Umwelt GmbH Air Pollution Control Report on the suitability test of the ambient air quality measuring system Model 5030i SHARP with PM2.5 pre-separator of the company Thermo Fisher Scientific for the component suspended particulate matter PM2.5, Report No.: 936/21209885/F Page 124 of 424 6.1 5.3.14 Response time The response time (rise) of the measuring system shall not exceed 180 s. The response time (fall) of the measuring system shall not exceed 180 s. The difference between the response time (rise) and response time (fall) of the measuring system shall not exceed 10 % of response time (rise) or 10 s, whatever value is larger. Note: This test is not relevant for particulate measuring systems. 6.2 Equipment Not applicable. 6.3 Performance of test Not applicable. 6.4 Evaluation Not applicable. 6.5 Assessment Not applicable. Minimum requirement fulfilled? 6.6 Detailed presentation of test results Not applicable. 740300_2013_936_21209885F_EN.docx TÜV Rheinland Energie und Umwelt GmbH Air Pollution Control Report on the suitability test of the ambient air quality measuring system Model 5030i SHARP with PM2.5 pre-separator of the company Thermo Fisher Scientific for the component suspended particulate matter PM2.5, Report No.: 936/21209885/F 6.1 5.3.15 Page 125 of 424 Difference between sample and calibration port The difference between the measured values obtained by feeding gas at the sample and calibration port shall not exceed the requirements of Table 2 of Standard VDI 4202 Part 1 (September 2010). A value ct at 70 % to 80 % of the upper limit of the certification range shall be used as reference point. Note: This test is not relevant for particulate measuring systems. 6.2 Equipment Not applicable. 6.3 Performance of test Not applicable. 6.4 Evaluation Not applicable. 6.5 Assessment Not applicable. Minimum requirement fulfilled? 6.6 Detailed presentation of test results Not applicable. 740300_2013_936_21209885F_EN.docx TÜV Rheinland Energie und Umwelt GmbH Air Pollution Control Report on the suitability test of the ambient air quality measuring system Model 5030i SHARP with PM2.5 pre-separator of the company Thermo Fisher Scientific for the component suspended particulate matter PM2.5, Report No.: 936/21209885/F Page 126 of 424 6.1 5.3.16 Converter efficiency In the case of measuring systems with a converter, the converter efficiency shall be at least 98 %. Note: This test is not relevant for particulate measuring systems. 6.2 Equipment Not applicable. 6.3 Performance of test Not applicable. 6.4 Evaluation Not applicable. 6.5 Assessment Not applicable. Minimum requirement fulfilled? 6.6 Detailed presentation of test results Not applicable. 740300_2013_936_21209885F_EN.docx TÜV Rheinland Energie und Umwelt GmbH Air Pollution Control Report on the suitability test of the ambient air quality measuring system Model 5030i SHARP with PM2.5 pre-separator of the company Thermo Fisher Scientific for the component suspended particulate matter PM2.5, Report No.: 936/21209885/F 6.1 5.3.17 Page 127 of 424 Increase of NO2 concentration due to residence in the measuring system In case of NOX measuring systems the increase of NO2 concentration due to residence in the measuring system shall not exceed the requirements of Table 2 of Standard VDI 4202 Part 1 (September 2010). The requirements of Table 2 apply to certification ranges according to Table 1 of Standard VDI 4202 Part 1 (September 2010). For deviating certification ranges the requirements shall be proportionally converted. Note: This test is not relevant for particulate measuring systems. 6.2 Equipment Not applicable. 6.3 Performance of test Not applicable. 6.4 Evaluation Not applicable. 6.5 Assessment Not applicable. Minimum requirement fulfilled? 6.6 Detailed presentation of test results Not applicable. 740300_2013_936_21209885F_EN.docx TÜV Rheinland Energie und Umwelt GmbH Air Pollution Control Report on the suitability test of the ambient air quality measuring system Model 5030i SHARP with PM2.5 pre-separator of the company Thermo Fisher Scientific for the component suspended particulate matter PM2.5, Report No.: 936/21209885/F Page 128 of 424 6.1 5.3.18 Overall uncertainty The expanded uncertainty of the measuring system shall be determined. The value determined shall not exceed the corresponding data quality objectives in the applicable EU Directives on air quality listed in Annex A, Table A1 of Standard VDI 4202 Part 1 (September 2010). Note: By resolution of the competent German body (see module 5.3.1), this test is not relevant for particulate measuring systems. Reference is made to module 5.4.10. 6.2 Equipment By resolution of the competent German body (see module 5.3.1), this test is not relevant for particulate measuring systems. Reference is made to module 5.4.10. 6.3 Performance of test By resolution of the competent German body (see module 5.3.1), this test is not relevant for particulate measuring systems. Reference is made to module 5.4.10. 6.4 Evaluation By resolution of the competent German body (see module 5.3.1), this test is not relevant for particulate measuring systems. Reference is made to module 5.4.10. 6.5 Assessment By resolution of the competent German body (see module 5.3.1), this test is not relevant for particulate measuring systems. Reference is made to module 5.4.10. Minimum requirement fulfilled? 6.6 Detailed presentation of test results By resolution of the competent German body (see module 5.3.1), this test is not relevant for particulate measuring systems. Reference is made to module 5.4.10. 740300_2013_936_21209885F_EN.docx TÜV Rheinland Energie und Umwelt GmbH Air Pollution Control Report on the suitability test of the ambient air quality measuring system Model 5030i SHARP with PM2.5 pre-separator of the company Thermo Fisher Scientific for the component suspended particulate matter PM2.5, Report No.: 936/21209885/F 6.1 Page 129 of 424 5.4.1 General Testing of measuring systems for particulate air pollutants is carried out in compliance with the minimum requirement stated in Table 5 of Standard VDI 4202, Part 1. Furthermore, the particle mass concentration shall be related to a defined volume. The relation to volume with respect to pressure and temperature shall be comprehensively described. 6.2 Equipment No additional equipment required. 6.3 Performance of test Testing was carried out in compliance with the minimum requirements stated in Table 5 of Standard VDI 4202, Part 1 (September 2010). It was tested, whether the measured particulate mass concentrations are related to a defined volume. 6.4 Evaluation Testing was carried out in compliance with the minimum requirements stated in Table 5 of Standard VDI 4202, Part 1 (September 2010). The Model 5030i SHARP measuring system combines two different methods of measurement (nephelometry + radiometry). Here, the highly sensitive but potentially inaccurate measurement technique (NEPH) is continuously calibrated by the non-sensitive but very precise measurement technique (BETA). The mass collected on the filter tape is determined by the radiometric measurement. The calculated mass is then related to a defined and actively regulated sampling volume, thus determining the particulate mass concentration. 6.5 Assessment Testing was carried out in compliance with the minimum requirements stated in Table 5 of Standard VDI 4202, Part 1 (September 2010). The calculated mass is related to a defined and actively regulated sampling volume, thus determining the particulate mass concentration. Minimum requirement fulfilled? yes 6.6 Detailed presentation of test results Not required for this test. 740300_2013_936_21209885F_EN.docx TÜV Rheinland Energie und Umwelt GmbH Air Pollution Control Page 130 of 424 6.1 Report on the suitability test of the ambient air quality measuring system Model 5030i SHARP with PM2.5 pre-separator of the company Thermo Fisher Scientific for the component suspended particulate matter PM2.5, Report No.: 936/21209885/F 5.4.2 Equivalency of the sampling system The equivalency between the PM10 sampling system and the reference method according to EN 12341 [T5] shall be demonstrated. Note: Not applicable to PM2.5 sampling systems. Reference is made to module 5.4.10 of this report. 6.2 Equipment Not applicable to PM2.5 sampling systems. Reference is made to module 5.4.10 of this report. 6.3 Performance of test Not applicable to PM2.5 sampling systems. Reference is made to module 5.4.10 of this report. 6.4 Evaluation Not applicable to PM2.5 sampling systems. Reference is made to module 5.4.10 of this report. 6.5 Assessment Not applicable to PM2.5 sampling systems. Reference is made to module 5.4.10 of this report. Minimum requirement fulfilled? -6.6 Detailed presentation of test results Not applicable to PM2.5 sampling systems. Reference is made to module 5.4.10 of this report. 740300_2013_936_21209885F_EN.docx TÜV Rheinland Energie und Umwelt GmbH Air Pollution Control Report on the suitability test of the ambient air quality measuring system Model 5030i SHARP with PM2.5 pre-separator of the company Thermo Fisher Scientific for the component suspended particulate matter PM2.5, Report No.: 936/21209885/F 6.1 Page 131 of 424 5.4.3 Reproducibility of the sampling systems The PM10 sampling systems of two identical systems under test shall be reproducible among themselves according to EN 12341 [T5]. This shall be demonstrated in the field test. Note: Not applicable to PM2.5 sampling systems. Reference is made to module 5.4.9 of this report. 6.2 Equipment Not applicable to PM2.5 sampling systems. Reference is made to module 5.4.9 of this report. 6.3 Performance of test Not applicable to PM2.5 sampling systems. Reference is made to module 5.4.9 of this report. 6.4 Evaluation Not applicable to PM2.5 sampling systems. Reference is made to module 5.4.9 of this report. 6.5 Assessment Not applicable to PM2.5 sampling systems. Reference is made to module 5.4.9 of this report. Minimum requirement fulfilled? 6.6 Detailed presentation of test results Not applicable to PM2.5 sampling systems. Reference is made to module 5.4.9 of this report. 740300_2013_936_21209885F_EN.docx TÜV Rheinland Energie und Umwelt GmbH Air Pollution Control Report on the suitability test of the ambient air quality measuring system Model 5030i SHARP with PM2.5 pre-separator of the company Thermo Fisher Scientific for the component suspended particulate matter PM2.5, Report No.: 936/21209885/F Page 132 of 424 6.1 5.4.4 Calibration The systems under test shall be calibrated in the field test by comparison measurements with the reference method. Here, the relationship between the output signal and the gravimetrically determined reference concentration shall the determined as a steady function. 6.2 Equipment See module 5.4.10. 6.3 Performance of test For PM2.5: The comparability of the measuring systems according to module 5.4.10 was demonstrated during the test. The determination of the calibration and analysis function was carried out using the complete dataset (209 (SN 1) and 217 (SN 2) valid paired values). The parameters of the calibration function y = m * x +b were determined by orthogonal regression. The analysis function is the reversal of the calibration function. It reads: x = 1/m * y – b/m The slope m of the regression line characterises the sensitivity of the measuring system; the ordinate intercept b characterises the zero point. 6.4 Evaluation This results in the following parameters: Table 26: Parameters of the calibration and analysis function, measured component PM2.5 System No. Calibration function Analysis function Y=m*x+b x = 1/m * y - b/m m b 1/m b/m µg/m³ / µg/m³ µg/m³ µg/m³ / µg/m³ µg/m³ System 1 (SN 1) 1.087 -0.408 0.920 -0.375 System 2 (SN 2) 1.055 0.066 0.948 0.063 740300_2013_936_21209885F_EN.docx TÜV Rheinland Energie und Umwelt GmbH Air Pollution Control Report on the suitability test of the ambient air quality measuring system Model 5030i SHARP with PM2.5 pre-separator of the company Thermo Fisher Scientific for the component suspended particulate matter PM2.5, Report No.: 936/21209885/F 6.5 Page 133 of 424 Assessment A statistical correlation between the reference measuring method and the device reading could be demonstrated. Minimum requirement fulfilled? yes 6.6 Detailed presentation of test results See module 5.4.10. 740300_2013_936_21209885F_EN.docx TÜV Rheinland Energie und Umwelt GmbH Air Pollution Control Page 134 of 424 6.1 Report on the suitability test of the ambient air quality measuring system Model 5030i SHARP with PM2.5 pre-separator of the company Thermo Fisher Scientific for the component suspended particulate matter PM2.5, Report No.: 936/21209885/F 5.4.5 Cross-sensitivity The interference caused by moisture in the sample may not exceed 10 % of the limit value in the range of the limit value. 6.2 Equipment No additional equipment required. 6.3 Performance of test The determination of interference caused by moisture in the sample was carried out under field conditions. For this purpose, the differences between the determined reference value (= nominal value) and the measured value of the respective candidate were calculated for days with more than 70 % relative humidity during the field test. The average difference was set as conservative estimate of the interference caused by moisture in the sample. In addition, the reference equivalence functions of both candidates were determined from the field investigations for days with more than 70 % relative humidity. 6.4 Evaluation The average difference between the determined reference value (= nominal value) and the measured value of the respective candidate was calculated for days with more than 70 % relative humidity during the field test. The relative deviation from the average concentration was calculated. Annual limit value PM2.5 = 25 µg/m³ 10 % of ALV = 2.5 µg/m³ Further investigations were made to determine whether the comparability of both candidates with the reference method according to Guide „Demonstration of Equivalence of Ambient Air Monitoring Methods” [4] is also given for days with more than 70 % relative humidity. 740300_2013_936_21209885F_EN.docx TÜV Rheinland Energie und Umwelt GmbH Air Pollution Control Report on the suitability test of the ambient air quality measuring system Model 5030i SHARP with PM2.5 pre-separator of the company Thermo Fisher Scientific for the component suspended particulate matter PM2.5, Report No.: 936/21209885/F 6.5 Page 135 of 424 Assessment No deviation of the measured signal from the nominal value > 0.5 µg/m³ caused by interference of moisture in the sample could be observed for PM2.5. No negative influence on the measured values at varying relative humidity was detected during the field test. Comparability of the candidates with the reference method according to Guide „Demonstration of Equivalence of Ambient Air Monitoring Methods” [4] is also given for days with a relative humidity > 70 %. Minimum requirement fulfilled? yes 6.6 Detailed presentation of test results A summary of the results is presented in Table 27. Table 27: Deviation between reference measurement and candidate on days with a relative humidity > 70 %, measured component PM2.5 Field test, days with a relative humidity >70 % Average µg/m³ Deviation from reference average in µg/m³ µg/m³ Deviation from reference average in % % Deviation from ALV in % % Reference SN 1 SN 2 12.1 12.6 12.6 - 0.5 0.5 - 4.1 4.1 - 2.0 2.0 The single values are presented in annexes 5 and 6 of the appendix. The presentation and the assessment of the measuring uncertainties W CM of days with a relative humidity > 70 % are shown in Table 28 and Table 29. The single values are presented in annexes 5 and 6 of the appendix. 740300_2013_936_21209885F_EN.docx TÜV Rheinland Energie und Umwelt GmbH Air Pollution Control Report on the suitability test of the ambient air quality measuring system Model 5030i SHARP with PM2.5 pre-separator of the company Thermo Fisher Scientific for the component suspended particulate matter PM2.5, Report No.: 936/21209885/F Page 136 of 424 Table 28: Comparison candidate SN 1 with reference instrument, rel. humidity > 70 %, all test sites, measured component PM2.5 Comparison candidate with reference according to Guide "Demonstration of Equivalence Of Ambient Air Monitoring Methods", January 2010 Candidate Modell 5030i SHARP SN SN 1 Test site All test sites, rH>70% Limit value 30 Status of measured values Raw data Allowed uncertainty 25 Results of regression analysis Slope b 1.07 significant Uncertainty of b 0.02 Ordinate intercept a -0.32 not significant Uncertainty of a 0.30 Results of the equivalence test Deviation at limit value 1.68 µg/m³ Uncertainty uc_s at limit v alue 2.75 µg/m³ Combined measurement uncertainty wCM 9.18 % Expanded measurement uncertainty W CM Status equivalence test 18.36 pass % Table 29: µg/m³ % Comparison candidate SN 2 with reference instrument, rel. humidity > 70 %, all test sites, measured component PM2.5 Comparison candidate with reference according to Guide "Demonstration of Equivalence Of Ambient Air Monitoring Methods", January 2010 Candidate Modell 5030i SHARP SN SN 2 Test site All test sites, rH>70% Limit value 30 Status of measured values Raw data Allowed uncertainty 25 Results of regression analysis Slope b 1.05 significant Uncertainty of b 0.02 Ordinate intercept a -0.01 not significant Uncertainty of a 0.29 Results of the equivalence test Deviation at limit value 1.59 µg/m³ Uncertainty uc_s at limit v alue 2.65 µg/m³ Combined measurement uncertainty wCM 8.84 % Expanded measurement uncertainty W CM Status equivalence test 17.68 pass % 740300_2013_936_21209885F_EN.docx µg/m³ % TÜV Rheinland Energie und Umwelt GmbH Air Pollution Control Report on the suitability test of the ambient air quality measuring system Model 5030i SHARP with PM2.5 pre-separator of the company Thermo Fisher Scientific for the component suspended particulate matter PM2.5, Report No.: 936/21209885/F 6.1 Page 137 of 424 5.4.6 Averaging effect The measuring system shall allow for formation of 24 h averages. The time of the sum of all filter changes within 24 h may not exceed 1 % of this averaging time. 6.2 Equipment A clock was required for this test. 6.3 Performance of test It was tested, whether the AMS allows the formation of daily averages. 6.4 Evaluation By default, the measuring system saves the measured values as 5-minute averages or hourly averages (configuration used during suitability testing) in the internal storage. These values can, for example, be read out on the iPort software and processed as required with a spread sheet analysis. Furthermore, it is also possible to parameterise the AMS in a way that daily averages are calculated internally and output as such. The filter tape transport itself takes approx. 1 min. After changing the filter tape, both the radiometric and nephelometric measurements are zeroed. The zeroing of the nephelometric measurement is carried out within 10 min after the pump has stopped, the radiometric measurement zeroes within 15 minutes after pump stop. It should be noted that the measuring system does not output new SHARP values during the first 10 min after filter tape change. After completing the zeroing of the nephelometer, the SHARP signal can be determined again, since it is calculated from the nephelometer concentration and the auto calibration factor. Nevertheless, the auto calibration factor is frozen until the end of the zeroing phase of the radiometric measurement and is only updated upon its completion. The time required for filter tape transport is 1 min. It corresponds to approx. 0.21 % lag time for 24-h measurements with three tape changes a day. The available time of the SHARP signal at cycles of 8 h is 470 min (=480 min – 10 min), covering 97.9 % of the total time. 6.5 Assessment It is possible to form daily averages based on the three measurement cycles using the described instrument configuration and a cycle duration of 8 hours. The time required for changing the filter tape amounts to a maximum of 0.21 %, thus lying well below the permissible 1 %. Minimum requirement fulfilled? yes 6.6 Detailed presentation of test results Not required for this test. 740300_2013_936_21209885F_EN.docx TÜV Rheinland Energie und Umwelt GmbH Air Pollution Control Page 138 of 424 6.1 Report on the suitability test of the ambient air quality measuring system Model 5030i SHARP with PM2.5 pre-separator of the company Thermo Fisher Scientific for the component suspended particulate matter PM2.5, Report No.: 936/21209885/F 5.4.7 Constancy of sample volumetric flow The sample volumetric flow averaged over the sampling time shall be constant within ± 3 % of the rated value. All instantaneous values of the sample volumetric flow shall be within a range of ± 5 % of the rated value during sampling. 6.2 Equipment A flow meter was used for testing this requirement, as indicated in Section 4. 6.3 Performance of test The sample volumetric flow was calibrated before testing at the first field test site, checked with a dry gas meter or a mass flow meter before testing at the other field test sites, and if necessary readjusted. The constancy of the sample volumetric flow is monitored internally with a reliable deviation from the nominal value of ±2.5 %. If this criterion is not met during operation, the measuring system performs a filter change. To determine the constancy of the sample volumetric flow, the internal data regarding flow rate and pump vacuum (= information on filter load) were recorded for the test site Cologne (winter), characterised partly by high concentrations, and the flow rates were evaluated on a 24-h basis. 6.4 Evaluation Average values, standard deviations as well as maximum and minimum values were determined from the flow rate measured values. 740300_2013_936_21209885F_EN.docx TÜV Rheinland Energie und Umwelt GmbH Air Pollution Control Report on the suitability test of the ambient air quality measuring system Model 5030i SHARP with PM2.5 pre-separator of the company Thermo Fisher Scientific for the component suspended particulate matter PM2.5, Report No.: 936/21209885/F 6.5 Page 139 of 424 Assessment The results of the flow rate checks performed before testing at each field test site are presented in Table 30. Table 30: Results of flow rate checks Flow rate check before testing at: SN 1 SN 2 [l/min] Deviation from nominal value [%] [l/min] Deviation from nominal value [%] Cologne, winter 16.33 -2.04 16.44 -1.38 Bornheim, summer 16.48 -1.14 16.51 -0.96 Bornheim, winter 16.66 -0.06 16.68 0.06 Teddington, summer 16.80 0.78 16.62 -0.30 Test site: The graphical representation of the flow rates at the test site used as example (Cologne, winter, nominal: 16.67 l/min) shows that all values determined during sampling deviate less than ±5 % from the respective nominal value. The deviation of the 24-h averages for the total flow rate of 16.67 l/min is as well significantly smaller than the specified ±3 % of the nominal value. All determined daily averages present deviations less than ±3 % from the nominal value; all instantaneous values deviate less than ±5 %. Minimum requirement fulfilled? yes 6.6 Detailed presentation of test results Table 31 and Table 32 show the determined flow parameters. Figure 39 and Figure 40 illustrate the flow measurements for both candidates SN 1 and SN 2. 740300_2013_936_21209885F_EN.docx TÜV Rheinland Energie und Umwelt GmbH Air Pollution Control Report on the suitability test of the ambient air quality measuring system Model 5030i SHARP with PM2.5 pre-separator of the company Thermo Fisher Scientific for the component suspended particulate matter PM2.5, Report No.: 936/21209885/F Page 140 of 424 Table 32: Flow rate No. 24h-values 103 Mean [l/min] 16.67 Max [l/min] 17.20 Mean [l/min] 16.67 Dev. from nominal [%] Std.Dev. [l/min] 0.02 0.00 Max [l/min] 16.74 18.0 120 17.5 100 17.0 80 16.5 60 16.0 40 15.5 20 Figure 39: 2/26/2011 0:00 4/17/2011 0:00 Min [l/min] 16.60 SN 1 Flow rate [l/min] 5%-Limit of flow rate SN 1 VAC [mmHg] SN1 SHARP [µg/m³] 0 6/6/2011 0:00 Flow of candidate SN 1 (field) 18.0 120 17.5 100 17.0 80 16.5 60 16.0 40 15.5 20 15.0 1/7/2011 0:00 Figure 40: Min [l/min] 16.56 Parameters for flow measurement (24-h average), SN 2 (field) 15.0 1/7/2011 0:00 Flow rate Dev. from nominal [%] Std.Dev. [l/min] 0.00 0.02 Pump vaccuum & SHARP-concentration No. 24h-values 102 Parameters for flow measurement (24-h average), SN 1 (field) 2/26/2011 0:00 Flow of candidate SN 2 (field) 740300_2013_936_21209885F_EN.docx 4/17/2011 0:00 Pump vaccuum and SHARP-concentration Table 31: 0 6/6/2011 0:00 SN 2 Flow rate [l/min] 5%-Limit of flow rate SN 2 VAC [mmHg] SN2 SHARP [µg/m³] TÜV Rheinland Energie und Umwelt GmbH Air Pollution Control Report on the suitability test of the ambient air quality measuring system Model 5030i SHARP with PM2.5 pre-separator of the company Thermo Fisher Scientific for the component suspended particulate matter PM2.5, Report No.: 936/21209885/F 6.1 Page 141 of 424 5.4.8 Tightness of the measuring system The complete measuring system shall be checked for tightness. Leakage shall not exceed 1 % of the sample volume sucked. 6.2 Equipment The test required an adapter for tightness check and a mass flow meter. 6.3 Performance of test The Model 5030i SHARP can perform a tightness check using an adapter. For testing the leak tightness, the instrument is switched to service mode. First, an external flow meter is installed at the inlet, followed by a recording of the flow rates indicated on the instrument itself and by the external measurement as well as of the displayed vacuum (VAC in mmHg). The instrument flow rate is compared with the flow rate of the external flow meter and adjusted. Then, the tightness check adapter is inserted into the inlet as connection between inlet and external flow meter. The adapter creates a significantly higher vacuum in the instrument for it reduces the size of the air sampling opening. The flow rates indicated by the instrument and by the external flow meter are compared again. Ideally (i.e. at absolute tightness), there should be no difference between both flow rates. The manufacturer specifies a maximum permissible difference of 0.42 l/min (= 2.5 % of the flow rate). If greater deviations were to be found, a leak test must be performed taking special care of checking the many fittings above the radiometric measuring head. If the cause cannot be found, the manufacturer should be contacted. The tightness check must only be performed with the tightness check adapter and the described procedure. It can otherwise damage the instrument. It is recommended to check the tightness of the measuring system on a quarterly basis according to the described procedure 6.4 Evaluation The tightness was checked with the adapter as part of the laboratory test. The criteria specified by the manufacturer upon which the tightness check is considered passed – maximum difference of 0.42 l/min (= 2.5 % of the flow rate) between the flow rates measured by the instrument and by the external flow meter under application of the adapter – proved to be appropriate parameters for monitoring the instrument’s tightness. The laboratory tests resulted in a maximum leakage < 1 % of the nominal flow rate of 16.67 l/min for both candidates. The tightness check must only be performed with the tightness check adapter and the described procedure. It can otherwise damage the instrument. 740300_2013_936_21209885F_EN.docx TÜV Rheinland Energie und Umwelt GmbH Air Pollution Control Report on the suitability test of the ambient air quality measuring system Model 5030i SHARP with PM2.5 pre-separator of the company Thermo Fisher Scientific for the component suspended particulate matter PM2.5, Report No.: 936/21209885/F Page 142 of 424 6.5 Assessment The criteria specified by the manufacturer upon which the tightness check is considered passed – maximum difference of ±0.42 l/min (= ±2.5 % of the flow rate) between the flow rates measured by the instrument and by the external flow meter under application of the adapter – proved to be appropriate parameters for monitoring the instrument’s tightness. The laboratory tests resulted in a maximum leakage < 1 % of the nominal flow rate of 16.67 l/min for both candidates. The tightness check must only be performed with the tightness check adapter and the described procedure. It can otherwise damage the instrument. Minimum requirement fulfilled? yes 6.6 Detailed presentation of test results Table 33 contains the values determined during the tightness check. Table 33: SN 1 SN 2 Results of the tightness check System’s measured value, without adapter Pump vacuum, without adapter System’s measured value, with adapter Pump vacuum, with adapter Ext. flow meter’s measured value, with adapter Difference of flow rates, with adapter Related to nominal flow rate l/min mm Hg l/min mm Hg l/min l/min % 1 16.65 66 16.58 106 16.59 0.01 0.1 2 16.67 66 16.59 106 16.66 0.07 0.4 3 16.63 66 16.58 106 16.64 0.06 0.4 Avg. 16.65 66 16.58 106 16.63 0.05 0.3 1 16.70 140 16.56 197 16.57 0.01 0.1 2 16.60 140 16.40 197 16.48 0.08 0.5 3 16.58 140 16.45 197 16.51 0.06 0.4 Avg. 16.63 140 16.47 197 16.52 0.05 0.3 740300_2013_936_21209885F_EN.docx TÜV Rheinland Energie und Umwelt GmbH Air Pollution Control Report on the suitability test of the ambient air quality measuring system Model 5030i SHARP with PM2.5 pre-separator of the company Thermo Fisher Scientific for the component suspended particulate matter PM2.5, Report No.: 936/21209885/F 6.1 Page 143 of 424 Methodology of the equivalence check (modules 5.4.9 – 5.4.11) According to the version of the Guide from January 2010 [4] the following 5 criteria must be fulfilled to proof the equivalence. 1. Of the full dataset at least 20 % of the results obtained using the standard method shall be greater than the upper assessment threshold specified in 2008/50/EC for annual limit values i.e.: 28 µg/m³ for PM10 and currently 17 µg/m³ for PM2.5. 2. The in-between uncertainty of the candidate must be less than 2.5 µg/m³ for all data and for two sub datasets corresponding to all the data split greater than or equal to and lower than 30 µg/m³ or 18 µg/m³ for PM10 and PM2.5 respectively. 3. The in-between uncertainty of the reference method must be less than 2.0 µg/m³. 4. The expanded uncertainty (W CM) is calculated at 50 µg/m³ for PM10 and 30 µg/m³ for PM2.5 for each individual candidate instrument against the average results of the reference method. For each of the following permutations, the expanded uncertainty must be less than 25 %: • Full dataset; • Datasets representing PM concentrations greater than or equal to 30 µg/m³ for PM10, or concentrations greater than or equal to 18 µg/m³ for PM2.5, provided that the subset contains 40 or more valid data pairs; • Datasets for each individual test site. 5. Preconditions for acceptance of the full dataset are that: the slope b is insignificantly different from 1: b − 1 ≤ 2 ⋅ u(b) , and the intercept a is insignificantly different from 0: a ≤ 2 ⋅ u(a) . If these preconditions are not met, the candidate method may be calibrat- ed using the values obtained for slope and/or intercept of all paired instruments together. The fulfilment of the 5 criteria is checked in the following chapters: In chapter 6.1 5.4.9 Determination of uncertainty between systems under test ubs criteria 1 and 2 will be checked. In chapter 6.1 5.4.10 Calculation of the expanded uncertainty of the instruments criteria 3, 4 and 5 will be checked. In chapter 6.1 5.4.11 Application of correction factors and terms, there is an exemplary evaluation for the case, that criterion 5 cannot be fulfilled without the application of correction factors or terms. 740300_2013_936_21209885F_EN.docx TÜV Rheinland Energie und Umwelt GmbH Air Pollution Control Page 144 of 424 6.1 Report on the suitability test of the ambient air quality measuring system Model 5030i SHARP with PM2.5 pre-separator of the company Thermo Fisher Scientific for the component suspended particulate matter PM2.5, Report No.: 936/21209885/F 5.4.9 Determination of uncertainty between systems under test ubs For the test of PM2.5 measuring systems the uncertainty between the systems under test shall be determined according to chapter 9.5.3.1 of the guidance document „Demonstration of Equivalence of Ambient Air Monitoring Methods“ in the field test at least at four sampling sites representative of the future application. 6.2 Equipment No additional equipment required. 6.3 Performance of test The test was carried out at four different comparisons during field test. Different seasons and varying concentrations for PM2.5 were taken into consideration. Of the complete dataset, at least 20 % of the concentration values determined with the reference method shall be greater than the upper assessment threshold according to 2008/50/EC [7]. For PM2.5 the upper assessment threshold is at 17 µg/m³. At each comparison campaign at least 40 valid data pairs were determined. Of the complete dataset (4 test sites, 209 valid data pairs for SN 1, 217 valid data pairs for SN 2) a total of 29.1 % of the measured values are above the upper assessment threshold of 17 µg/m³ for PM2.5. The measured concentrations were referred to ambient conditions. 6.4 Evaluation According to point 9.5.3.1 of the Guide „Demonstration of Equivalence of Ambient Air Monitoring Methods“ applies: The uncertainty between the candidates ubs must be ≤ 2.5 µg/m³. An uncertainty > 2.5 µg/m³ between the two candidates is an indication that the performance of one or both systems is not sufficient and the equivalence cannot be declared. The uncertainty is determined for: • All test sites and comparisons together (full dataset) • 1 dataset with measured values ≥ 18 µg/m³ for PM2.5 (Basis: averages of reference measurement) 740300_2013_936_21209885F_EN.docx TÜV Rheinland Energie und Umwelt GmbH Air Pollution Control Report on the suitability test of the ambient air quality measuring system Model 5030i SHARP with PM2.5 pre-separator of the company Thermo Fisher Scientific for the component suspended particulate matter PM2.5, Report No.: 936/21209885/F Page 145 of 424 Furthermore the evaluation of the following datasets is done for: • Each test site and comparison individually • 1 dataset with measured values < 18 µg/m³ for PM2.5 (Basis: averages of reference measurement) The uncertainty between the candidates ubs is calculated from the differences of all 24-hour results of the simultaneously operated candidate systems according to the following equation: n 2 = u bs with yi,1 and yi,2 n 6.5 Assessment ∑ (y i,1 − y i,2 ) 2 i =1 2n = results of the parallel measurements of individual 24-h values i = No. of 24-h values The uncertainty between the candidates ubs is with a maximum of 1.68 µg/m³ for PM2.5 below the required value of 2.5 µg/m³. Minimum requirement fulfilled? yes 740300_2013_936_21209885F_EN.docx TÜV Rheinland Energie und Umwelt GmbH Air Pollution Control Report on the suitability test of the ambient air quality measuring system Model 5030i SHARP with PM2.5 pre-separator of the company Thermo Fisher Scientific for the component suspended particulate matter PM2.5, Report No.: 936/21209885/F Page 146 of 424 6.6 Detailed presentation of test results Table 34 shows the values calculated for the uncertainty between systems under test ubs. The graphical representation is displayed in Figure 41 to Figure 47. Table 34: Uncertainty between systems under test ubs for candidates SN 1 and SN 2, measured component PM2.5 Candidate Test site No. of values Uncertainty ubs SN SN 1 / SN 2 µg/m³ All test sites 242 1.30 Single test sites SN 1 / SN 2 Cologne, winter 52 0.88 SN 1 / SN 2 Bornheim, summer 91 1.64 SN 1 / SN 2 Bornheim, winter 49 1.05 SN 1 / SN 2 Teddington, summer 50 1.19 Classification over reference value SN 1 / SN 2 Values ≥ 18 µg/m³ 51 1.68 SN 1 / SN 2 Values < 18 µg/m³ 148 1.26 740300_2013_936_21209885F_EN.docx TÜV Rheinland Energie und Umwelt GmbH Air Pollution Control Report on the suitability test of the ambient air quality measuring system Model 5030i SHARP with PM2.5 pre-separator of the company Thermo Fisher Scientific for the component suspended particulate matter PM2.5, Report No.: 936/21209885/F Page 147 of 424 Model 5030i SHARP, SN 1 / SN 2, All test sites, Raw data 130 120 110 100 Measured values Candidate 2 [µg/m³] 90 Regression line 80 y=x 70 60 y = 0.9587x + 0.6504 R² = 0.9746 50 40 30 20 10 0 0 10 20 30 40 50 60 70 80 90 100 110 120 130 Candidate 1 [µg/m³] Figure 41: Results of the parallel measurements with the candidates SN 1 / SN 2, measured component PM2.5, all test sites Model 5030i SHARP, SN 1 / SN 2, Cologne, Winter, Raw data 130 120 110 100 Measured values Candidate 2 [µg/m³] 90 Regression line 80 y=x 70 60 y = 0.9707x + 0.9087 R² = 0.9888 50 40 30 20 10 0 0 10 20 30 40 50 60 70 80 90 100 110 120 130 Candidate 1 [µg/m³] Figure 42: Results of the parallel measurements with the candidates SN 1 / SN 2, measured component PM2.5, test site Cologne (winter) 740300_2013_936_21209885F_EN.docx TÜV Rheinland Energie und Umwelt GmbH Air Pollution Control Report on the suitability test of the ambient air quality measuring system Model 5030i SHARP with PM2.5 pre-separator of the company Thermo Fisher Scientific for the component suspended particulate matter PM2.5, Report No.: 936/21209885/F Page 148 of 424 Model 5030i SHARP, SN 1 / SN 2, Bornheim, Summer, Raw data 130 120 110 100 Measured values Candidate 2 [µg/m³] 90 Regression line 80 y=x 70 60 y = 0.8521x + 1.6023 R² = 0.9488 50 40 30 20 10 0 0 10 20 30 40 50 60 70 80 90 100 110 120 130 Candidate 1 [µg/m³] Figure 43: Results of the parallel measurements with the candidates SN 1 / SN 2, measured component PM2.5, test site Bornheim (summer) Model 5030i SHARP, SN 1 / SN 2, Bornheim, Winter, Raw data 130 120 110 100 Measured values Candidate 2 [µg/m³] 90 Regression line 80 y=x 70 60 y = 1.0153x - 0.3456 R² = 0.9889 50 40 30 20 10 0 0 10 20 30 40 50 60 70 80 90 100 110 120 130 Candidate 1 [µg/m³] Figure 44: Results of the parallel measurements with the candidates SN 1 / SN 2, measured component PM2.5, test site Bornheim (winter) 740300_2013_936_21209885F_EN.docx TÜV Rheinland Energie und Umwelt GmbH Air Pollution Control Report on the suitability test of the ambient air quality measuring system Model 5030i SHARP with PM2.5 pre-separator of the company Thermo Fisher Scientific for the component suspended particulate matter PM2.5, Report No.: 936/21209885/F Page 149 of 424 Model 5030i SHARP, SN 1 / SN 2, Teddington, Summer, Raw data 130 120 110 100 Measured values Candidate 2 [µg/m³] 90 Regression line 80 y=x 70 60 y = 0.8726x + 1.0998 R² = 0.8706 50 40 30 20 10 0 0 10 20 30 40 50 60 70 80 90 100 110 120 130 Candidate 1 [µg/m³] Figure 45: Results of the parallel measurements with the candidates SN 1 / SN 2, measured component PM2.5, test site Teddington (summer) Model 5030i SHARP, SN 1 / SN 2, All test sites, ≥18 µg/m³, Raw data 130 120 110 100 Measured values Candidate 2 [µg/m³] 90 Regression line 80 y=x 70 60 y = 0.974x + 0.2512 R² = 0.9677 50 40 30 20 10 0 0 10 20 30 40 50 60 70 80 90 100 110 120 130 Candidate 1 [µg/m³] Figure 46: Results of the parallel measurements with the candidates SN 1 / SN 2, measured component PM2.5, all test sites, values ≥ 18 µg/m³ 740300_2013_936_21209885F_EN.docx TÜV Rheinland Energie und Umwelt GmbH Air Pollution Control Report on the suitability test of the ambient air quality measuring system Model 5030i SHARP with PM2.5 pre-separator of the company Thermo Fisher Scientific for the component suspended particulate matter PM2.5, Report No.: 936/21209885/F Page 150 of 424 Model 5030i SHARP, SN 1 / SN 2, All test sites, <18 µg/m³, Raw data 130 120 110 100 Measured values Candidate 2 [µg/m³] 90 Regression line 80 y=x 70 y = 0.8725x + 1.4145 R² = 0.8644 60 50 40 30 20 10 0 0 10 20 30 40 50 60 70 80 90 100 110 120 130 Candidate 1 [µg/m³] Figure 47: Results of the parallel measurements with the candidates SN 1 / SN 2, measured component PM2.5, all test sites, values < 18 µg/m³ 740300_2013_936_21209885F_EN.docx TÜV Rheinland Energie und Umwelt GmbH Air Pollution Control Report on the suitability test of the ambient air quality measuring system Model 5030i SHARP with PM2.5 pre-separator of the company Thermo Fisher Scientific for the component suspended particulate matter PM2.5, Report No.: 936/21209885/F 6.1 5.4.10 Page 151 of 424 Calculation of the expanded uncertainty of the instruments For the test of PM2.5 measuring systems the equivalency with the reference method shall be demonstrated according to chapter 9.5.3.2 to chapter 9.6 of the guidance document „Demonstration of Equivalence of Ambient Air Monitoring Methods“ in the field test at least at four sampling sites representative of the future application. The maximum expanded uncertainty of the systems under test shall be compared with data quality objectives according to Annex A of Standard VDI 4202 Part 1 (September 2010). 6.2 Equipment Auxiliary equipment described in Section 5. 6.3 Performance of test The test was carried out at four different comparisons during field test. Different seasons and varying concentrations for PM2.5 were taken into consideration. Of the complete dataset, at least 20 % of the concentration values determined with the reference method shall be greater than the upper assessment threshold according to 2008/50/EC [7]. For PM2.5 the upper assessment threshold is at 17 µg/m³. At each comparison campaign at least 40 valid data pairs were determined. Of the complete dataset (4 test sites, 209 valid data pairs for SN 1, 217 valid data pairs for SN 2) a total of 29.1 % of the measured values are above the upper assessment threshold of 17 µg/m³ for PM2.5. The measured concentrations were referred to ambient conditions. 6.4 Evaluation [Point 9.5.3.2] The calculation of the in-between uncertainty of the reference devices uref is carried out prior to the calculation of the expanded uncertainty of the candidates. The in-between uncertainty of the reference devices uref is determined analogous to the uncertainty between candidates and shall be ≤ 2 µg/m³. The evaluated results are illustrated in “Detailed presentation of test results” of this test item. A linear correlation yi = a + bxi is assumed between the results of both methods in order to evaluate the comparability of the candidates y and the reference procedure x. The correlation between the average values of the reference devices and the candidates is established by orthogonal regression. Regression is calculated for: • All test sites and comparisons together • Each test site and comparison separately • 1 dataset with measured values PM2.5 ≥ 18 µg/m³ (Basis: average value of reference measurement) 740300_2013_936_21209885F_EN.docx TÜV Rheinland Energie und Umwelt GmbH Air Pollution Control Report on the suitability test of the ambient air quality measuring system Model 5030i SHARP with PM2.5 pre-separator of the company Thermo Fisher Scientific for the component suspended particulate matter PM2.5, Report No.: 936/21209885/F Page 152 of 424 For further evaluation, the results of the uncertainty uc_s of the candidates compared with the reference method are described with the following equation, which describes uCR as a function of the PM concentration xi: 2 u CR (y i ) = With RSS 2 − u 2 ( x i ) + [a + (b − 1)x i ] (n − 2) RSS = Sum of the (relative) residuals from orthogonal regression u(xi) = random uncertainty of the reference procedure if value ubs, which is calculated for using the candidates, can be used in this test (refer to point 6.1 5.4.9 Determination of uncertainty between systems under test ubs) Algorithms for the calculation of ordinate intercept a as well as slope b and its variances by orthogonal regression are described in detail in annex B of [4]. The sum of the (relative) residuals RSS is calculated by the following equation: RSS = n ∑ (y i − a − bx i ) 2 i =1 Uncertainty uCR is calculated for: • All test sites and comparisons together • Each test site and comparison individually • 1 dataset with measured values PM2.5 ≥ 18 µg/m³ (Basis: average values of the reference measurement) Preconditions for acceptance of the full dataset are that: • The slope b is insignificantly different from 1: b − 1 ≤ 2 ⋅ u(b) and • The intercept a is insignificantly different from 0: a ≤ 2 ⋅ u(a) Where u(b) and u(a) are the standard uncertainties of the slope and intercept, respectively calculated as the square root of their variances. If these preconditions are not met, the candidate method may be calibrated according to point 9.7 of the Guide (refer to 6.1 5.4.11 Application of correction factors and terms. The calibration shall only be applied to the full dataset. 740300_2013_936_21209885F_EN.docx TÜV Rheinland Energie und Umwelt GmbH Air Pollution Control Report on the suitability test of the ambient air quality measuring system Model 5030i SHARP with PM2.5 pre-separator of the company Thermo Fisher Scientific for the component suspended particulate matter PM2.5, Report No.: 936/21209885/F Page 153 of 424 [Point 9.5.4] The combined uncertainty of the candidates wc,CM is calculated for each dataset by combining the contributions from 9.5.3.1 and 9.5.3.2 according to the following equation: w c2,CM ( y i ) = 2 u CR (y i ) y i2 For each dataset, the uncertainty wc,CM is calculated at the level of yi = 30 µg/m³ for PM2.5. [Point 9.5.5] The expanded relative uncertainty of the results of the candidates is calculated for each dataset by multiplication of wc,CM with a coverage factor k according to the following equation: WCM = k ⋅ w CM In practice: k=2 for large n [Point 9.6] The highest resulting uncertainty W CM is compared and assessed with the requirements on data quality of ambient air measurements according to EU Standard [7]. Two results are possible: 1. W CM ≤ W dqo → Candidate method is accepted as equivalent to the standard method. 2. W CM > W dqo → Candidate method is not accepted as equivalent to the standard method. The specified expanded relative uncertainty W dqo for particulate matter is 25 % [7]. 6.5 Assessment The determined uncertainties W CM without application of correction factors lay for all observed datasets below the defined expanded relative uncertainty W dqo of 25 % for fine dust. Minimum requirement fulfilled? yes The following Table 35 shows an overview of the results of the equivalence check for the candidate Model 5030i SHARP for PM2.5. In case that a criterion is fulfilled or not the text is represented in green or red. Furthermore, the five criteria from chapter 6.1 Methodology of the equivalence check (modules 5.4.9 – 5.4.11) are taken into account; the related cells are highlighted in colour. 740300_2013_936_21209885F_EN.docx TÜV Rheinland Energie und Umwelt GmbH Air Pollution Control Report on the suitability test of the ambient air quality measuring system Model 5030i SHARP with PM2.5 pre-separator of the company Thermo Fisher Scientific for the component suspended particulate matter PM2.5, Report No.: 936/21209885/F Page 154 of 424 Table 35: Overview equivalence test of Model 5030i SHARP for PM2.5 29.1% ≥ 17 μg m-3 Orthogonal Regression Betw een Instrument Uncertainties PM2.5 5030i Sharp nc-s 18.0 199 < 18 μg m-3 17.0 148 0.865 1.066 +/- 0.032 -0.040 +/- 0.317 0.56 1.26 ≥ 18 μg m-3 20.8 51 0.959 1.090 +/- 0.032 -0.900 +/- 0.975 0.76 1.68 All Data r2 Slope (b) +/- ub Intercept (a) +/- ua WCM / % 0.972 1.068 +/- 0.013 -0.103 +/- 0.225 Reference Candidate 0.61 1.30 KEY Criterion 1 Criterion 2 Criterion 3 Orthogonal Regression SN1 Limit Value of 30 μg m-3 Dataset nc-s Bornheim Winter 41 r2 Slope (b) +/- ub Intercept (a) +/- ua 0.975 1.075 +/- 0.027 -0.205 +/- 0.667 WCM / % % ≥ 17 μg m-3 19.53 56.1 Cologne Winter 41 0.970 1.086 +/- 0.030 -0.534 +/- 0.676 19.56 53.7 Bornheim Summer 78 0.931 1.110 +/- 0.033 -0.530 +/- 0.466 24.70 15.4 Teddington Summer 49 0.906 1.117 +/- 0.050 -0.656 +/- 0.407 21.43 4.1 < 18 μg m-3 157 0.847 1.120 +/- 0.035 -0.611 +/- 0.342 23.38 4.5 ≥ 18 μg m-3 52 0.952 1.111 +/- 0.034 -1.326 +/- 1.050 22.93 100.0 All Data 209 0.967 1.087 +/- 0.014 -0.408 +/- 0.240 20.28 28.2 Individual Datasets Combined Datasets Orthogonal Regression SN2 r2 Slope (b) +/- ub Intercept (a) +/- ua Criterion 5 Other Limit Value of 30 μg m-3 Dataset nc-s Criterion 4 WCM / % % ≥ 17 μg m-3 56.1 Bornheim Winter 41 0.968 1.104 +/- 0.031 -0.840 +/- 0.778 22.60 Cologne Winter 43 0.974 1.058 +/- 0.027 0.394 +/- 0.592 18.90 53.5 Bornheim Summer 70 0.931 0.947 +/- 0.030 1.099 +/- 0.427 14.77 15.7 Teddington Summer 63 0.848 1.016 +/- 0.051 0.207 +/- 0.433 11.83 3.2 < 18 μg m-3 166 0.817 1.057 +/- 0.035 0.123 +/- 0.344 17.55 4.8 ≥ 18 μg m-3 51 0.947 1.090 +/- 0.036 -1.159 +/- 1.101 21.88 100.0 All Data 217 0.962 1.055 +/- 0.014 18.34 27.2 Individual Datasets Combined Datasets 0.066 +/- 0.241 The check of the five criteria from chapter 6.1 Methodology of the equivalence check (modules 5.4.9 – 5.4.11) resulted as follows: Criterion 1: More than 20 % of the data are greater than 17 µg/m³. Criterion 2: The in-between uncertainty of the candidates is smaller than 2.5 µg/m³. Criterion 3: The in-between uncertainty of the reference is smaller than 2.0 µg/m³. 740300_2013_936_21209885F_EN.docx TÜV Rheinland Energie und Umwelt GmbH Air Pollution Control Report on the suitability test of the ambient air quality measuring system Model 5030i SHARP with PM2.5 pre-separator of the company Thermo Fisher Scientific for the component suspended particulate matter PM2.5, Report No.: 936/21209885/F Page 155 of 424 Criterion 4: Criterion 5: All of the expanded uncertainties are below 25 %. The slopes used for evaluation of the complete dataset are significantly greater than the permissible values for SN 1 and SN 2. Other: The evaluation of the complete dataset for both candidates together shows that the AMS demonstrates a very good correlation with the reference method with a slope of 1.068 and an intercept of -0.103 at an expanded total uncertainty of 18 %. The January 2010 version of The Guidance is ambiguous with respect to which slope and intercept should be used to correct a candidate should it fail the test of equivalence. After communication with the convenor of the EC working group, which is responsible for setting up the Guide (Mr Theo Hafkenscheid), it was decided that the requirement of the November 2005 version of the Guidance are still valid, and that the slope and intercept from the orthogonal regression of all the paired data should be used. These are shaded gold and marked ‘other’ in the key on the above Table 35. The 2006 UK Equivalence Report [8] highlighted that this was a flaw in the mathematics required for equivalence as per the November 2005 version of The Guidance as it penalised instruments that were more accurate (Appendix E Section 4.2 therein). This same flaw is copied in the January 2010 version. It is the opinion of TÜV Rheinland and their UK partners that the Model 5030i SHARP measuring system for PM2.5 is indeed being penalised by the mathematics for being accurate. It is proposed that the same pragmatic approach is taken here that was previously undertaken in earlier studies. Therefore, according to Table 35, the slope offset should be corrected for PM2.5 due to its significance. Nonetheless it should be noted that the determined uncertainties W CM lie below the specified expanded relative uncertainty W dqo of 25 % for particulate matter for all datasets considered without application of correction factors. In this particular case the slope for the complete dataset comparison is 1.068. Therefore, under point 6.1 5.4.11 Application of correction factors and terms, an additional evaluation using the respective calibration factor for the datasets is carried out. The intercept for the complete dataset comparison is -0.103. The reworked version of the Guide of January 2010 requires that when operating in networks, a candidate method needs to be tested annually at a number of sites and that the number of the instruments to be tested is dependent on the expanded measurement uncertainty of the device. The respective realisation is the responsibility of the network operator or of the responsible authority of the member state. However, TÜV Rheinland and their UK partners recommend that the expanded uncertainty for the full dataset is referred to for this, i.e. 18 %, which again would require an annual test at 4 measurement sites (Guide [4], chapter 9.9.2, Table 6). 740300_2013_936_21209885F_EN.docx TÜV Rheinland Energie und Umwelt GmbH Air Pollution Control Report on the suitability test of the ambient air quality measuring system Model 5030i SHARP with PM2.5 pre-separator of the company Thermo Fisher Scientific for the component suspended particulate matter PM2.5, Report No.: 936/21209885/F Page 156 of 424 6.6 Detailed presentation of test results Table 36 presents an overview on the uncertainties between the reference devices uref from the field tests. In Table 37, the results of the equivalence test including the determined expanded measuring uncertainties W CM from the field test are summarised. Table 36: Uncertainty between the reference devices uref for PM2.5 Reference device Test site Amount values No. Uncertainty ubs µg/m³ 1/2 Cologne, winter 48 0.58 1/2 Bornheim, summer 87 0.66 1/2 Bornheim, winter 41 0.91 1/2 Teddington, summer 65 0.17 1/2 All test sites 241 0.61 The uncertainty between the reference devices uref is < 2 µg/m³ for all test sites. 740300_2013_936_21209885F_EN.docx TÜV Rheinland Energie und Umwelt GmbH Air Pollution Control Report on the suitability test of the ambient air quality measuring system Model 5030i SHARP with PM2.5 pre-separator of the company Thermo Fisher Scientific for the component suspended particulate matter PM2.5, Report No.: 936/21209885/F Table 37: Page 157 of 424 Summary of the results of the equivalence test, SN 1 & SN 2, measured component PM2.5, raw data 29.1% ≥ 17 μg m-3 Orthogonal Regression Betw een Instrument Uncertainties PM2.5 5030i Sharp WCM / % nc-s r2 Slope (b) +/- ub Intercept (a) +/- ua Reference Candidate All Data 18.0 199 0.972 1.068 +/- 0.013 -0.103 +/- 0.225 0.61 1.30 < 18 μg m-3 17.0 148 0.865 1.066 +/- 0.032 -0.040 +/- 0.317 0.56 1.26 ≥ 18 μg m-3 20.8 51 0.959 1.090 +/- 0.032 -0.900 +/- 0.975 0.76 1.68 SN1 Dataset nc-s r 2 Bornheim Winter 41 0.975 1.075 Cologne Winter 41 0.970 Bornheim Summer 78 Teddington Summer < 18 μg m-3 Orthogonal Regression Limit Value of 30 μg m-3 WCM / % % ≥ 17 μg m-3 +/- 0.027 -0.205 +/- 0.667 19.53 56.1 1.086 +/- 0.030 -0.534 +/- 0.676 19.56 53.7 0.931 1.110 +/- 0.033 -0.530 +/- 0.466 24.70 15.4 49 0.906 1.117 +/- 0.050 -0.656 +/- 0.407 21.43 4.1 157 0.847 1.120 +/- 0.035 -0.611 +/- 0.342 23.38 4.5 Slope (b) +/- ub Intercept (a) +/- ua Individual Datasets Combined Datasets ≥ 18 μg m-3 52 0.952 1.111 +/- 0.034 -1.326 +/- 1.050 22.93 100.0 All Data 209 0.967 1.087 +/- 0.014 -0.408 +/- 0.240 20.28 28.2 Orthogonal Regression SN2 Limit Value of 30 μg m-3 Dataset nc-s r2 Bornheim Winter 41 0.968 1.104 Cologne Winter 43 0.974 1.058 WCM / % % ≥ 17 μg m-3 +/- 0.031 -0.840 +/- 0.778 22.60 56.1 +/- 0.027 18.90 53.5 Slope (b) +/- ub Intercept (a) +/- ua 0.394 +/- 0.592 Individual Datasets Combined Datasets Bornheim Summer 70 0.931 0.947 +/- 0.030 1.099 +/- 0.427 14.77 15.7 Teddington Summer 63 0.848 1.016 +/- 0.051 0.207 +/- 0.433 11.83 3.2 < 18 μg m-3 166 0.817 1.057 +/- 0.035 0.123 +/- 0.344 17.55 4.8 ≥ 18 μg m-3 51 0.947 1.090 +/- 0.036 -1.159 +/- 1.101 21.88 100.0 All Data 217 0.962 1.055 +/- 0.014 18.34 27.2 0.066 +/- 0.241 740300_2013_936_21209885F_EN.docx TÜV Rheinland Energie und Umwelt GmbH Air Pollution Control Report on the suitability test of the ambient air quality measuring system Model 5030i SHARP with PM2.5 pre-separator of the company Thermo Fisher Scientific for the component suspended particulate matter PM2.5, Report No.: 936/21209885/F Page 158 of 424 100 PM2.5 5030i Sharp / μg m-3 90 Bornheim Winter 80 Cologne Winter 70 Bornheim Summer 60 Teddington Summer < 18 μg m-3 Line 50 ≥ 18 μg m-3 Line 40 All Data Line 30 20 10 0 0 10 20 30 40 50 60 70 80 90 100 PM2.5 Reference / μg m-3 Figure 48: Reference vs. candidate, SN 1 & SN 2, measured component PM2.5, all test sites 740300_2013_936_21209885F_EN.docx TÜV Rheinland Energie und Umwelt GmbH Air Pollution Control Report on the suitability test of the ambient air quality measuring system Model 5030i SHARP with PM2.5 pre-separator of the company Thermo Fisher Scientific for the component suspended particulate matter PM2.5, Report No.: 936/21209885/F Page 159 of 424 100 90 SN1 PM2.5 5030i Sharp / μg m-3 80 70 60 50 40 30 20 10 0 0 10 20 30 40 50 60 70 80 90 100 PM2.5 Reference / μg m-3 Reference vs. candidate, SN 1, measured component PM2.5, all test sites Figure 49: 100 90 SN2 PM2.5 5030i Sharp / μg m-3 80 70 60 50 40 30 20 10 0 0 10 20 30 40 50 60 70 80 90 100 PM2.5 Reference / μg m-3 Figure 50: Reference vs. candidate, SN 2, measured component PM2.5, all test sites 740300_2013_936_21209885F_EN.docx TÜV Rheinland Energie und Umwelt GmbH Air Pollution Control Report on the suitability test of the ambient air quality measuring system Model 5030i SHARP with PM2.5 pre-separator of the company Thermo Fisher Scientific for the component suspended particulate matter PM2.5, Report No.: 936/21209885/F Page 160 of 424 100 SN1 Cologne Winter 90 PM2.5 5030i Sharp / μg m-3 80 70 60 50 40 30 20 10 0 0 10 20 30 40 50 60 70 80 90 100 PM2.5 Reference / μg m-3 Reference vs. candidate, SN 1, measured component PM2.5, Cologne (winter) Figure 51: 100 SN2 Cologne Winter 90 PM2.5 5030i Sharp / μg m-3 80 70 60 50 40 30 20 10 0 0 10 20 30 40 50 60 70 80 90 100 PM2.5 Reference / μg m-3 Figure 52: Reference vs. candidate, SN 2, measured component PM2.5, Cologne (winter) 740300_2013_936_21209885F_EN.docx TÜV Rheinland Energie und Umwelt GmbH Air Pollution Control Report on the suitability test of the ambient air quality measuring system Model 5030i SHARP with PM2.5 pre-separator of the company Thermo Fisher Scientific for the component suspended particulate matter PM2.5, Report No.: 936/21209885/F Page 161 of 424 100 SN1 Bornheim Summer 90 PM2.5 5030i Sharp / μg m-3 80 70 60 50 40 30 20 10 0 0 10 20 30 40 50 60 70 80 90 100 PM2.5 Reference / μg m-3 Reference vs. candidate, SN 1, measured component PM2.5, Bornheim (summer) Figure 53: 100 SN2 Bornheim Summer 90 PM2.5 5030i Sharp / μg m-3 80 70 60 50 40 30 20 10 0 0 10 20 30 40 50 60 70 80 90 100 PM2.5 Reference / μg m-3 Figure 54: Reference vs. candidate, SN 2, measured component PM2.5, Bornheim (summer) 740300_2013_936_21209885F_EN.docx TÜV Rheinland Energie und Umwelt GmbH Air Pollution Control Report on the suitability test of the ambient air quality measuring system Model 5030i SHARP with PM2.5 pre-separator of the company Thermo Fisher Scientific for the component suspended particulate matter PM2.5, Report No.: 936/21209885/F Page 162 of 424 100 SN1 Bornheim Winter 90 PM2.5 5030i Sharp / μg m-3 80 70 60 50 40 30 20 10 0 0 10 20 30 40 50 60 70 80 90 100 PM2.5 Reference / μg m-3 Reference vs. candidate, SN 1, measured component PM2.5, Bornheim (winter) Figure 55: 100 SN2 Bornheim Winter 90 PM2.5 5030i Sharp / μg m-3 80 70 60 50 40 30 20 10 0 0 10 20 30 40 50 60 70 80 90 100 PM2.5 Reference / μg m-3 Figure 56: Reference vs. candidate, SN 2, measured component PM2.5, Bornheim (winter) 740300_2013_936_21209885F_EN.docx TÜV Rheinland Energie und Umwelt GmbH Air Pollution Control Report on the suitability test of the ambient air quality measuring system Model 5030i SHARP with PM2.5 pre-separator of the company Thermo Fisher Scientific for the component suspended particulate matter PM2.5, Report No.: 936/21209885/F Page 163 of 424 100 SN1 Teddington Summer 90 PM2.5 5030i Sharp / μg m-3 80 70 60 50 40 30 20 10 0 0 10 20 30 40 50 60 70 80 90 100 PM2.5 Reference / μg m-3 Reference vs. candidate, SN 1, measured component PM2.5, Teddington (summer) Figure 57: 100 SN2 Teddington Summer 90 PM2.5 5030i Sharp / μg m-3 80 70 60 50 40 30 20 10 0 0 10 20 30 40 50 60 70 80 90 100 PM2.5 Reference / μg m-3 Figure 58: Reference vs. candidate, SN 2, measured component PM2.5, Teddington (summer) 740300_2013_936_21209885F_EN.docx TÜV Rheinland Energie und Umwelt GmbH Air Pollution Control Report on the suitability test of the ambient air quality measuring system Model 5030i SHARP with PM2.5 pre-separator of the company Thermo Fisher Scientific for the component suspended particulate matter PM2.5, Report No.: 936/21209885/F Page 164 of 424 100 90 SN1 PM2.5 5030i Sharp / μg m-3 80 70 60 50 40 30 20 10 0 0 10 20 30 40 50 60 70 80 90 100 PM2.5 Reference / μg m-3 Reference vs. candidate, SN 1, measured component PM2.5, values ≥ 18 µg/m³ Figure 59: 100 90 SN2 PM2.5 5030i Sharp / μg m-3 80 70 60 50 40 30 20 10 0 0 10 20 30 40 50 60 70 80 90 100 PM2.5 Reference / μg m-3 Figure 60: Reference vs. candidate, SN 2, measured component PM2.5, values ≥ 18 µg/m³ 740300_2013_936_21209885F_EN.docx TÜV Rheinland Energie und Umwelt GmbH Air Pollution Control Report on the suitability test of the ambient air quality measuring system Model 5030i SHARP with PM2.5 pre-separator of the company Thermo Fisher Scientific for the component suspended particulate matter PM2.5, Report No.: 936/21209885/F 6.1 5.4.11 Page 165 of 424 Application of correction factors and terms If the highest resulting expanded uncertainty of the candidate method is larger than the expanded relative uncertainty, which is defined in the requirements on the data quality of ambient air measurements according to EU-Guideline [7], the application of correction factors or terms is permitted. The corrected values have to fulfil the requirements according to point 9.5.3.2 et seqq. of the Guide „Demonstration of Equivalence of Ambient Air Monitoring Methods“. 6.2 Equipment No additional equipment required. 6.3 Performance of test Refer to module 5.4.10. 6.4 Evaluation If evaluation of the raw data according to module 5.4.10 leads to a case where W CM > W dqo, which means that the candidate systems is not regarded equivalent to the reference method, it is permitted to apply a correction factor or term resulting from the regression equation obtained from the full dataset. The corrected values shall satisfy the requirements for all datasets or subsets (refer to module 5.4.10). Moreover, a correction factor may be applied even for W CM ≤ W dqo in order to improve the accuracy of the candidate systems. Three different cases may occur: a) Slope b not significantly different from 1: b − 1 ≤ 2u(b) , intercept a significantly different from 0: a > 2u(a) b) Slope b significantly different from 1: b − 1 > 2u(b) , intercept a not significantly different from 0: a ≤ 2u(a) c) Slope b significantly different from 1: b − 1 > 2u(b) intercept a significantly different from 0: a > 2u(a) With respect to a) The value of the intercept a may be used as a correction term to correct all input values yi according to the following equation. y i,corr = y i − a 740300_2013_936_21209885F_EN.docx TÜV Rheinland Energie und Umwelt GmbH Air Pollution Control Report on the suitability test of the ambient air quality measuring system Model 5030i SHARP with PM2.5 pre-separator of the company Thermo Fisher Scientific for the component suspended particulate matter PM2.5, Report No.: 936/21209885/F Page 166 of 424 The resulting values of yi,corr may then be used to calculate the following new terms by linear regression: y i,corr = c + dx i and u c2 _ s ( y i,corr ) = RSS 2 − u 2 ( x i ) + [c + (d − 1)x i ] + u 2 (a) (n − 2) with u(a) = uncertainty of the original intercept a, the value of which has been used to obtain yi,corr. Algorithms for the calculation of intercepts as well as slopes and their variances by orthogonal regression are described in detail in annex B of [4]. RSS is determined analogue to the calculation in module 5.4.10. With respect to b) The value of the slope b may be used as a term to correct all input values yi according to the following equation. y y i,corr = i b The resulting values of yi,corr may then be used to calculate the following new terms by linear regression: y i,corr = c + dx i and u c2 _ s ( y i,corr ) = RSS 2 − u 2 ( x i ) + [c + (d − 1)x i ] + x i2 u 2 (b) (n − 2) with u(b) = uncertainty of the original slope b, the value of which has been used to obtain yi,corr. Algorithms for the calculation of intercepts as well as slopes and their variances by orthogonal regression are described in detail in annex B of [4]. RSS is determined analogue to the calculation in module 5.4.10. With respect to c) The values of the slope b and of the intercept a may be used as correction terms to correct all input values yi according to the following equation. y −a y i,corr = i b The resulting values of yi,corr may then be used to calculate the following new terms by linear regression: y i,corr = c + dx i 740300_2013_936_21209885F_EN.docx TÜV Rheinland Energie und Umwelt GmbH Air Pollution Control Report on the suitability test of the ambient air quality measuring system Model 5030i SHARP with PM2.5 pre-separator of the company Thermo Fisher Scientific for the component suspended particulate matter PM2.5, Report No.: 936/21209885/F Page 167 of 424 and u c2 _ s ( y i,corr ) = RSS 2 − u 2 ( x i ) + [c + (d − 1)x i ] + x i2 u 2 (b) + u 2 (a) (n − 2) with u(b) = uncertainty of the original slope b, the value of which has been used to obtain yi,corr and with u(a) = uncertainty of the original intercept a, the value of which has been used to obtain yi,corr. Algorithms for the calculation of intercepts as well as slopes and their variances by orthogonal regression are described in detail in annex B of [4]. RSS is determined analogue to the calculation in module 5.4.10. The values for uc_s,corr are used for the calculation of the combined relative uncertainty of the candidate systems after correction according to the following equation: w c2,CM,corr ( y i ) = u c2 _ s,corr ( y i ) y i2 For the corrected dataset, uncertainty wc,CM,corr is calculated at the daily limit value by taking yi as the concentration at the limit value. The expanded relative uncertainty W CM,corr is calculated according to the following equation: WCM´,corr = k ⋅ w CM,corr In practice: k=2 for large number of available experimental results The highest resulting uncertainty W CM,corr is compared and assessed with the requirements on data quality of ambient air measurements according to EU Standard [7]. Two results are possible: 1. W CM ≤ W dqo → Candidate method is accepted as equivalent to the standard method. 2. W CM > W dqo → Candidate method is not accepted as equivalent to the standard method. The specified expanded relative uncertainty W dqo for particulate matter is 25 % [7]. 6.5 Assessment The candidate systems fulfil the requirements on data quality of ambient air quality measurements during the test even without application of correction factors. A correction of the slope leads nevertheless to a significant improvement of the expanded measuring uncertainty of the full data comparison. Minimum requirement fulfilled? yes 740300_2013_936_21209885F_EN.docx TÜV Rheinland Energie und Umwelt GmbH Air Pollution Control Page 168 of 424 Report on the suitability test of the ambient air quality measuring system Model 5030i SHARP with PM2.5 pre-separator of the company Thermo Fisher Scientific for the component suspended particulate matter PM2.5, Report No.: 936/21209885/F The evaluation of the full dataset for both candidates delivers, nevertheless, a significant slope (see Table 35). The slope for the full dataset is 1.068 with an uncertainty of the slope of merely 0.013. The 2006 UK Equivalence Report [8] highlighted that this was a flaw in the mathematics required for equivalence as per the November 2005 version of The Guidance as it penalised instruments that were more accurate (Appendix E Section 4.2 therein). This same flaw is copied in the January 2010 version. It is the opinion of TÜV Rheinland and their UK partners that the Model 5030i SHARP measuring system for PM2.5 is indeed being penalised by the mathematics for being accurate. It is proposed that the same pragmatic approach is taken here that was previously undertaken in earlier studies. The slope for the full dataset is 1.068. For this reason, a slope correction of the entire dataset was performed and evaluated again with the corrected values. All datasets fulfil the requirements on data quality after the correction. The measurement uncertainty was improved significantly, only at the test sites “Bornheim (summer)” and “Teddington (summer)” a slight worsening could be observed for SN 2 (see Table 38 in comparison to Table 35). The version of the Guide of January 2010 requires that when operating in networks, a candidate method needs to be tested annually at a number of sites corresponding to the highest expanded uncertainty found during equivalence testing. These criteria are banded in 5 % steps (Guide [4], point 9.9.2, Table 6). We have to bear in mind that the highest determined expanded uncertainty lies in the range 10 % to 15 % after the correction of the slope. The respective realisation of the above mentioned requirement on on-going QA/QC in networks is the responsibility of the network operator or of the responsible authority of the member state. However, TÜV Rheinland and their UK partners recommend that the expanded uncertainty for the full dataset is referred to for this, namely 18.0 % (uncorrected dataset) and 12.0 % (dataset after slope correction), which again would require an annual test at 4 and 3 measurement sites respectively. 740300_2013_936_21209885F_EN.docx TÜV Rheinland Energie und Umwelt GmbH Air Pollution Control Report on the suitability test of the ambient air quality measuring system Model 5030i SHARP with PM2.5 pre-separator of the company Thermo Fisher Scientific for the component suspended particulate matter PM2.5, Report No.: 936/21209885/F 6.6 Page 169 of 424 Detailed presentation of test results Table 38 shows the results of the evaluations of the equivalence check after the application of the correction factor for the slope on the complete dataset. Table 38: PM2.5 5030i Sharp Slope Corrected Summary of the results of the equivalence check, SN 1 & SN 2, after slope correction 29.1% ≥ 17 μg m-3 Orthogonal Regression WCM / % nc-s r2 All Data 12.0 199 0.972 0.999 < 18 μg m-3 10.5 148 0.865 ≥ 18 μg m-3 16.0 51 0.959 SN1 Dataset Slope (b) +/- ub Intercept (a) +/- ua Betw een Instrument Uncertainties Reference Candidate +/- 0.012 -0.084 +/- 0.210 0.61 1.22 0.994 +/- 0.030 0.006 +/- 0.297 0.56 1.18 1.020 +/- 0.030 -0.803 +/- 0.913 0.76 1.57 Orthogonal Regression Limit Value of 30 μg m-3 WCM / % % ≥ 17 μg m-3 +/- 0.025 -0.175 +/- 0.624 13.10 56.1 1.017 +/- 0.028 -0.481 +/- 0.633 13.23 53.7 0.931 1.037 +/- 0.031 -0.469 +/- 0.437 16.06 15.4 49 0.906 1.043 +/- 0.047 -0.590 +/- 0.381 10.59 4.1 < 18 μg m-3 157 0.847 1.043 +/- 0.033 -0.520 +/- 0.320 12.76 4.5 ≥ 18 μg m-3 52 0.952 1.039 +/- 0.032 -1.195 +/- 0.983 17.53 100.0 All Data 209 0.967 1.017 +/- 0.013 -0.367 +/- 0.224 13.22 28.2 nc-s r 2 41 0.968 nc-s r2 Bornheim Winter 41 0.975 1.006 Cologne Winter 41 0.970 Bornheim Summer 78 Teddington Summer Slope (b) +/- ub Intercept (a) +/- ua Individual Datasets Combined Datasets Orthogonal Regression SN2 Limit Value of 30 μg m-3 Dataset Bornheim Winter Slope (b) +/- ub 1.033 Intercept (a) +/- ua +/- 0.029 -0.763 +/- 0.729 WCM / % % ≥ 17 μg m-3 15.75 56.1 Cologne Winter 43 0.974 0.990 +/- 0.025 0.386 +/- 0.554 11.81 53.5 Bornheim Summer 70 0.931 0.885 +/- 0.028 1.052 +/- 0.400 21.04 15.7 Teddington Summer 63 0.848 0.947 +/- 0.048 0.234 +/- 0.406 13.89 3.2 Individual Datasets Combined Datasets < 18 μg m-3 166 0.817 0.983 +/- 0.033 0.176 +/- 0.323 12.08 4.8 ≥ 18 μg m-3 51 0.947 1.019 +/- 0.033 -1.033 +/- 1.032 18.45 100.0 All Data 217 0.962 0.987 +/- 0.013 13.68 27.2 0.079 +/- 0.226 740300_2013_936_21209885F_EN.docx TÜV Rheinland Energie und Umwelt GmbH Air Pollution Control Report on the suitability test of the ambient air quality measuring system Model 5030i SHARP with PM2.5 pre-separator of the company Thermo Fisher Scientific for the component suspended particulate matter PM2.5, Report No.: 936/21209885/F Page 170 of 424 6.1 5.5 Requirements on multiple-component measuring systems Multiple-component measuring systems shall comply with the requirements set for each component, also in the case of simultaneous operation of all measuring channels. 6.2 Equipment Not applicable. 6.3 Performance of test Not applicable. 6.4 Evaluation Not applicable. 6.5 Assessment Not applicable. Minimum requirement fulfilled? 6.6 - Detailed presentation of test results Not applicable. 740300_2013_936_21209885F_EN.docx TÜV Rheinland Energie und Umwelt GmbH Air Pollution Control Report on the suitability test of the ambient air quality measuring system Model 5030i SHARP with PM2.5 pre-separator of the company Thermo Fisher Scientific for the component suspended particulate matter PM2.5, Report No.: 936/21209885/F Page 171 of 424 7. Recommendations for practical use Works in the maintenance interval (4 weeks) The following procedures are required to be undertaken at regular intervals: • Regular visual inspection / telemetric monitoring • Check of system status • Check of error messages • Contamination check • Check of the instrument functions according to the instructions of the manufacturer • Maintenance of the sampling inlet according to the instructions of the manufacturer For the rest, the manufacturer's directions and recommendations shall be followed. 740300_2013_936_21209885F_EN.docx TÜV Rheinland Energie und Umwelt GmbH Air Pollution Control Page 172 of 424 Report on the suitability test of the ambient air quality measuring system Model 5030i SHARP with PM2.5 pre-separator of the company Thermo Fisher Scientific for the component suspended particulate matter PM2.5, Report No.: 936/21209885/F Further maintenance works The following works are necessary in addition to the regular works in the maintenance interval: • Inspection of filter tape supply – one filter tape is enough for approx. 650 filter tape changes per roll (approx. 215 days at cycles of 8 hours). Semi-annual filter tape changes are expected to be sufficient under normal conditions (no unscheduled filter changes due to significantly high dust concentrations). The “Filter Tape Counter” function allows for monitoring the current number of filter tape changes as well as configuring alarm thresholds which remind the user of upcoming changes. • An inspection of the sensors for ambient temperature and ambient pressure shall be carried out every three months according to the manufacturer’s specifications. • A flow rate check must be performed every three months according to the manufacturer’s specifications. • The system’s leak tightness shall be inspected every three months according to the manufacturer’s specifications. • The external pump exhaust filter shall be exchanged every six months. • As part of an annual basic maintenance, the carbon vanes of the vacuum pump shall be exchanged and the SHARP optics module shall be cleaned once a year. The cleaning of the SHARP optics module is ideally performed by an experienced service technician. Furthermore, it is recommended to carry out a yearly inspection and, if required, a re-calibration of the radiometric measurement using the foil set. • The cleaning of the sampling tube shall be paid attention to during the annual basic maintenance. Further details are provided in the user manual. Department of Environmental Protection/Air Pollution Control ______________________________ ______________________________ Dipl.-Ing Karsten Pletscher Dipl.- Ing Guido Baum Cologne, 20 September 2013 936/21209885/F 740300_2013_936_21209885F_EN.docx TÜV Rheinland Energie und Umwelt GmbH Air Pollution Control Report on the suitability test of the ambient air quality measuring system Model 5030i SHARP with PM2.5 pre-separator of the company Thermo Fisher Scientific for the component suspended particulate matter PM2.5, Report No.: 936/21209885/F Page 173 of 424 8. Literature [1] [2] [3] [4] [5] [6] [7] [8] [9] Standard VDI 4202, Part 1, “Performance criteria for performance tests of automated ambient air measuring systems – Point-related measurement methods for gaseous and particulate air pollutants”, June 2002 & September 2010 Standard VDI 4203, Part 3, “Testing of automated measuring systems – Test procedures for point-related ambient air measuring systems for gaseous and particulate air pollutants”, August 2004 & September 2010 Standard EN 14907, “Ambient air quality – Standard gravimetric measurement method for the determination of the PM2.5 mass fraction of suspended particulate matter”, German version EN 14907: 2005 Guide “Demonstration of Equivalence of Ambient Air Monitoring Methods”, English version of January 2010 Operating manual Modell 5030i SHARP, 12 March 2013 Operating manual LVS3, Stand 2000 Directive 2008/50/EC of the European Parliament and of the Council of 21 May 2008 on ambient air quality and cleaner air for Europe Report “UK Equivalence Programme for Monitoring of Particulate Matter”, Report No.: BV/AQ/AD202209/DH/2396 of 5 June 2006 Technical specification CEN/TS 16450, “Ambient air – Automated measuring systems for the measurement of the concentration of particulate matter (PM10; PM2.5)”, English Version of May 2013 740300_2013_936_21209885F_EN.docx TÜV Rheinland Energie und Umwelt GmbH Air Pollution Control Report on the suitability test of the ambient air quality measuring system Model 5030i SHARP with PM2.5 pre-separator of the company Thermo Fisher Scientific for the component suspended particulate matter PM2.5, Report No.: 936/21209885/F Page 174 of 424 9. Appendix Appendix 1 Annex 1: Annex 2: Annex 3: Annex 4: Annex 5: Annex 6: Annex 7: Annex 8: Measured and calculated values Detection limit Temperature dependence of zero point Temperature dependence of the sensitivity Dependence on supply voltage Measured values at the field test sites Ambient conditions at the field test sites Measuring Values from the additional campaign Bornheim, summer 2013 Ambient conditions during the additional campaign Bornheim, summer 2013 Appendix 2 Filter weighing procedure Appendix 3 Manuals 740300_2013_936_21209885F_EN.docx TÜV Rheinland Energie und Umwelt GmbH Air Pollution Control Report on the suitability test of the ambient air quality measuring system Model 5030i SHARP with PM2.5 pre-separator of the company Thermo Fisher Scientific for the component suspended particulate matter PM2.5, Report No.: 936/21209885/F Page 175 of 424 740300_2013_936_21209885F_EN.docx TÜV Rheinland Energie und Umwelt GmbH Air Pollution Control Page 176 of 424 740300_2013_936_21209885F_EN.docx Report on the suitability test of the ambient air quality measuring system Model 5030i SHARP with PM2.5 pre-separator of the company Thermo Fisher Scientific for the component suspended particulate matter PM2.5, Report No.: 936/21209885/F TÜV Rheinland Energie und Umwelt GmbH Luftreinhaltung Report on the suitability test of the ambient air quality measuring system Model 5030i SHARP with PM2.5 pre-separator of the company Thermo Fisher Scientific for the component suspended particulate matter PM2.5, Report-No.: 936/21209885/F Annex 1 Page 177 of 424 Detection limit Page 1 of 1 Manufacturer Thermo Fisher Scientific Type Model 5030i SHARP Serial-No. SN 1 / SN 2 Standards 11/13/2012 11/14/2012 11/15/2012 11/16/2012 11/17/2012 11/18/2012 11/19/2012 11/20/2012 11/21/2012 11/22/2012 11/23/2012 11/24/2012 11/25/2012 11/26/2012 11/27/2012 No. of values Mean Standard deviation s x0 Measured values [µg/m³] SN 1 0.0 0.1 0.0 0.0 0.0 0.1 0.1 0.0 -0.1 0.0 0.0 0.0 0.1 0.0 0.0 15 0.02 0.05 11/13/2012 11/14/2012 11/15/2012 11/16/2012 11/17/2012 11/18/2012 11/19/2012 11/20/2012 11/21/2012 11/22/2012 11/23/2012 11/24/2012 11/25/2012 11/26/2012 11/27/2012 No. of values Mean Standard deviation s x0 Measured values [µg/m³] SN 2 0.0 0.0 0.0 0.0 0.0 0.0 0.0 0.1 0.0 0.0 0.1 0.0 0.1 0.1 0.0 15 0.03 0.03 Detection limit x 0.11 Detection limit x 0.07 No. Date 1 2 3 4 5 6 7 8 9 10 11 12 13 14 15 Date s xo = ( ZP Zero filter ∑ 1 )⋅ ( x 0i − x 0 ) 2 n − 1 i=1,n 740300_2013_936_21209885F_EN.docx TÜV Rheinland Energie und Umwelt GmbH Luftreinhaltung Report on the suitability test of the ambient air quality measuring system Model 5030i SHARP with PM2.5 pre-separator of the company Thermo Fisher Scientific for the component suspended particulate matter PM2.5, Report-No.: 936/21209885/F Page 178 of 424 Dependence of zero point on ambient temperature (SHARP) Annex 2 Page 1 of 2 Manufacturer Thermo Fisher Scientifc Standards Type Model 5030i SHARP Serial-No. SN 1 / SN 2 Cycle 1 SN 1 ZP Zero filter Cycle 3 No. 1 2 3 4 5 Temperature [°C] 20 5 20 40 20 Measured value [µg/m³] 0.0 0.0 0.0 0.6 0.0 Dev. [µg/m³] 0.0 0.0 0.6 0.0 Measured value [µg/m³] 0.0 -0.1 0.0 0.1 -0.1 Dev. [µg/m³] -0.1 0.0 0.0 -0.1 Measured value [µg/m³] 0.0 0.1 0.0 0.1 0.1 Dev. [µg/m³] 0.1 0.1 0.1 0.1 No. 1 2 3 4 5 Temperature [°C] 20 5 20 40 20 Measured value [µg/m³] 0.0 0.0 0.0 0.0 0.0 Dev. [µg/m³] 0.1 0.0 0.0 0.1 Measured value [µg/m³] 0.0 0.0 0.0 -0.1 0.0 Dev. [µg/m³] 0.0 -0.1 -0.1 0.0 Measured value [µg/m³] 0.0 0.1 0.0 -0.1 0.0 Dev. [µg/m³] 0.1 0.1 0.0 0.1 SN 2 ZP Cycle 2 ZP 740300_2013_936_21209885F_EN.docx TÜV Rheinland Energie und Umwelt GmbH Luftreinhaltung Report on the suitability test of the ambient air quality measuring system Model 5030i SHARP with PM2.5 pre-separator of the company Thermo Fisher Scientific for the component suspended particulate matter PM2.5, Report-No.: 936/21209885/F Page 179 of 424 Dependence of zero point on ambient temperature (NEPH) Annex 2 Page 2 of 2 Manufacturer Thermo Fisher Scientifc Standards Type Model 5030i SHARP Serial-No. SN 1 (NEPH) / SN 2 (NEPH) Cycle 1 SN 1 (NEPH) ZP Zero filter Cycle 3 No. 1 2 3 4 5 Temperature [°C] 20 5 20 40 20 Measured value [µg/m³] 0.0 0.0 0.0 0.7 0.0 Dev. [µg/m³] 0.0 0.0 0.7 0.0 Measured value [µg/m³] 0.0 -0.1 0.0 0.1 -0.1 Dev. [µg/m³] -0.1 0.0 0.0 -0.1 Measured value [µg/m³] 0.0 0.1 0.1 0.1 0.1 Dev. [µg/m³] 0.1 0.1 0.1 0.1 No. 1 2 3 4 5 Temperature [°C] 20 5 20 40 20 Measured value [µg/m³] -0.1 0.0 0.0 0.0 0.1 Dev. [µg/m³] 0.1 0.0 0.0 0.1 Measured value [µg/m³] 0.0 0.1 -0.1 -0.1 0.0 Dev. [µg/m³] 0.0 -0.1 -0.2 0.0 Measured value [µg/m³] 0.0 0.1 0.0 -0.1 0.0 Dev. [µg/m³] 0.2 0.1 -0.1 0.1 SN 2 (NEPH) ZP Cycle 2 ZP 740300_2013_936_21209885F_EN.docx TÜV Rheinland Energie und Umwelt GmbH Luftreinhaltung Report on the suitability test of the ambient air quality measuring system Model 5030i SHARP with PM2.5 pre-separator of the company Thermo Fisher Scientific for the component suspended particulate matter PM2.5, Report-No.: 936/21209885/F Page 180 of 424 Dependence of measured value on ambient temperature Annex 3 Page 1 of 1 Manufacturer Thermo Fisher Scientific Standards Type Model 5030i SHARP Serial-No. SN 1 / SN 2 Cycle 1 SN 1 RP Measured value No. 1 2 3 4 5 Temperature [°C] 20 5 20 40 20 Temperature [°C] 20 5 20 40 20 Measured value No. 1 2 3 4 5 SN 2 RP 740300_2013_936_21209885F_EN.docx 7075.9 7215.5 7061.3 7232.8 7174.1 7119.6 7086.9 7039.8 7180.4 7142.2 Cycle 2 Dev. [%] 2.0 -0.2 2.2 1.4 Measured value Dev. [%] -0.5 -1.1 0.9 0.3 Measured value 7168.1 7117.7 7052.1 7209.8 7097.4 7299.4 7128.1 7014.5 7093.8 7120.4 ZP Reference foils Cycle 3 Dev. [%] -0.7 -1.6 0.6 -1.0 Measured value Dev. [%] -2.3 -3.9 -2.8 -2.5 Measured value 7075.9 7024.4 7091.7 7209.8 7177.1 7171.4 7103.4 6973.1 7108.8 7210.4 Dev. [%] -0.7 0.2 1.9 1.4 Dev. [%] -0.9 -2.8 -0.9 0.5 TÜV Rheinland Energie und Umwelt GmbH Luftreinhaltung Report on the suitability test of the ambient air quality measuring system Model 5030i SHARP with PM2.5 pre-separator of the company Thermo Fisher Scientific for the component suspended particulate matter PM2.5, Report-No.: 936/21209885/F Page 181 of 424 Dependence of measured value on mains voltage Annex 4 Page 1 of 1 Manufacturer Thermo Fisher Scientific Standards Type Model 5030i SHARP Serial-No. SN 1 / SN 2 Cycle 1 SN 1 RP Measured value No. 1 2 3 4 5 Mains voltage [V] 230 190 230 245 230 Mains voltage [V] 230 190 230 245 230 Measured value No. 1 2 3 4 5 SN 2 RP 7193.2 7140.8 7118.4 7259.1 7046.9 7112.4 7144.7 7033.4 7154.2 7047.2 Cycle 2 Dev. [%] -0.7 -1.0 0.9 -2.0 Measured value Dev. [%] 0.5 -1.1 0.6 -0.9 Measured value 7073.2 7112.4 7159.4 6976.9 7158.2 7135.7 7094.3 7131.4 7012.4 7095.2 ZP Reference foils Cycle 3 Dev. [%] 0.6 1.2 -1.4 1.2 Measured value Dev. [%] -0.6 -0.1 -1.7 -0.6 Measured value 7145.8 7117.6 7188.8 6976.9 7127.1 7183.2 7051.4 6978.4 7063.6 6985.7 Dev. [%] -0.4 0.6 -2.4 -0.3 Dev. [%] -1.8 -2.9 -1.7 -2.7 740300_2013_936_21209885F_EN.docx TÜV Rheinland Energie und Umwelt GmbH Luftreinhaltung Report on the suitability test of the ambient air quality measuring system Model 5030i SHARP with PM2.5 pre-separator of the company Thermo Fisher Scientific for the component suspended particulate matter PM2.5, Report-No.: 936/21209885/F Page 182 of 424 Annex 5 Measured values from field test sites, related to actual conditions Manufacturer Thermo Fisher Scientific Type of instrument Model 5030i SHARP Serial-No. SN 1 / SN 2 No. Date 1 2 3 4 5 6 7 8 9 10 11 12 13 14 15 16 17 18 19 20 21 22 23 24 25 26 27 28 29 30 3/8/2011 3/9/2011 3/10/2011 3/11/2011 3/12/2011 3/13/2011 3/14/2011 3/15/2011 3/16/2011 3/17/2011 3/18/2011 3/19/2011 3/20/2011 3/21/2011 3/22/2011 3/23/2011 3/24/2011 3/25/2011 3/26/2011 3/27/2011 3/28/2011 3/29/2011 3/30/2011 3/31/2011 4/1/2011 4/2/2011 4/3/2011 4/4/2011 4/5/2011 4/6/2011 740300_2013_936_21209885F_EN.docx Page 1 of 11 PM2,5 Measured values in µg/m³ (ACT) Ref. 1 PM2,5 [µg/m³] 31.1 19.1 Ref. 2 PM2,5 [µg/m³] 31.8 18.8 Ref. 1 PM10 [µg/m³] 43.9 30.5 Ref 2. PM10 [µg/m³] 43.8 28.7 Ratio PM2,5/PM10 [%] 71.7 63.9 16.7 16.1 33.5 33.1 49.2 13.3 18.2 37.4 55.0 50.7 28.4 13.1 20.0 37.8 57.8 49.6 28.1 16.2 27.7 44.1 67.3 68.0 38.4 15.6 25.6 43.1 65.8 67.1 38.4 83.0 71.5 86.3 84.8 74.1 73.5 20.4 22.4 41.7 20.3 18.6 27.6 20.3 22.3 41.6 20.4 20.2 27.5 28.6 34.7 55.7 33.1 33.3 36.9 28.0 34.3 54.8 31.6 32.7 37.2 72.0 64.8 75.4 63.0 58.7 74.2 24.6 20.5 44.7 15.6 6.0 8.5 24.8 20.7 44.2 15.6 5.1 7.7 35.6 32.4 65.4 24.0 10.5 13.3 35.4 31.9 65.6 23.4 9.3 13.0 69.5 64.2 67.8 65.8 56.2 61.7 14.6 8.8 11.0 13.0 13.7 9.0 11.4 12.9 22.1 17.9 19.2 23.6 22.4 16.6 19.0 23.8 63.6 51.6 58.7 54.6 SN 1 PM2,5 [µg/m³] 31.3 20.5 SN 2 PM2,5 [µg/m³] 31.6 19.8 Remark Cologne, Winter Complete power loss Recovery after re-start 17.6 14.3 17.9 12.6 Power loss, only Thermo Recovery after re-start 54.0 56.5 31.9 10.0 18.5 24.8 49.3 20.8 20.0 29.4 11.9 24.0 20.5 47.4 13.9 5.3 9.7 16.0 12.9 7.5 9.0 12.3 55.7 54.1 30.5 10.2 19.3 25.3 46.9 19.9 18.7 29.1 12.4 24.1 20.7 49.5 14.7 7.3 9.6 16.8 13.1 8.8 10.8 14.2 Test site TÜV Rheinland Energie und Umwelt GmbH Luftreinhaltung Report on the suitability test of the ambient air quality measuring system Model 5030i SHARP with PM2.5 pre-separator of the company Thermo Fisher Scientific for the component suspended particulate matter PM2.5, Report-No.: 936/21209885/F Annex 5 Page 183 of 424 Measured values from field test sites, related to actual conditions Manufacturer Thermo Fisher Scientific Type of instrument Model 5030i SHARP Serial-No. SN 1 / SN 2 No. Date 31 32 33 34 35 36 37 38 39 40 41 42 43 44 45 46 47 48 49 50 51 52 53 54 55 56 57 58 59 60 4/7/2011 4/8/2011 4/9/2011 4/10/2011 4/11/2011 4/12/2011 4/13/2011 4/14/2011 4/15/2011 4/16/2011 4/17/2011 4/18/2011 4/19/2011 4/20/2011 4/21/2011 4/22/2011 4/23/2011 4/24/2011 4/25/2011 4/26/2011 4/27/2011 4/28/2011 4/29/2011 4/30/2011 5/1/2011 5/2/2011 5/3/2011 5/4/2011 5/5/2011 5/6/2011 Page 2 of 11 PM2,5 Measured values in µg/m³ (ACT) Ref. 1 PM2,5 [µg/m³] 13.7 19.0 Ref. 2 PM2,5 [µg/m³] 13.1 19.8 Ref. 1 PM10 [µg/m³] 23.2 34.9 Ref 2. PM10 [µg/m³] 24.2 34.8 Ratio PM2,5/PM10 [%] 56.7 55.7 11.1 15.2 9.0 12.5 19.6 13.3 11.8 15.1 8.2 12.2 19.4 11.4 23.4 31.3 18.0 24.4 32.0 31.9 22.3 31.5 17.1 23.2 31.5 31.9 50.1 48.2 49.0 51.9 61.5 38.8 17.0 17.5 20.0 17.2 17.9 20.8 26.4 30.3 33.9 26.6 30.7 34.2 64.6 58.0 59.8 19.6 17.0 20.7 17.6 17.8 19.3 13.3 7.0 9.2 9.3 11.5 13.7 13.6 27.4 31.3 45.1 28.0 27.3 22.0 12.9 14.9 15.1 20.2 19.5 31.1 73.6 55.7 16.2 19.0 12.9 6.7 9.3 9.0 11.4 27.4 31.0 44.3 28.0 25.9 21.0 13.0 16.1 15.9 20.5 20.1 30.7 60.8 72.0 61.0 52.9 59.8 59.2 56.1 44.2 SN 1 PM2,5 [µg/m³] 16.6 SN 2 PM2,5 [µg/m³] 14.1 Remark Test site Cologne, Winter Zero point Zero point Zero point 15.8 9.3 11.8 22.6 12.6 21.0 15.8 19.8 23.4 25.1 22.8 17.0 33.2 25.9 22.4 16.6 20.0 13.4 8.5 9.2 13.5 13.3 13.5 14.3 9.4 12.4 23.8 13.2 21.6 16.6 21.1 23.4 26.0 23.0 18.3 33.1 25.4 21.2 20.7 28.2 20.1 21.1 14.1 9.4 9.0 10.8 15.0 12.9 14.7 SN1 switched off involuntarily Recovery after re-start SN1 switched off for short time Outlier Ref. PM2,5 740300_2013_936_21209885F_EN.docx TÜV Rheinland Energie und Umwelt GmbH Luftreinhaltung Report on the suitability test of the ambient air quality measuring system Model 5030i SHARP with PM2.5 pre-separator of the company Thermo Fisher Scientific for the component suspended particulate matter PM2.5, Report-No.: 936/21209885/F Page 184 of 424 Annex 5 Measured values from field test sites, related to actual conditions Manufacturer Thermo Fisher Scientific Type of instrument Model 5030i SHARP Serial-No. SN 1 / SN 2 No. Date 61 62 63 64 65 66 67 68 69 70 71 72 73 74 75 76 77 78 79 80 81 82 83 84 85 86 87 88 89 90 5/7/2011 5/8/2011 7/25/2011 7/26/2011 7/27/2011 7/28/2011 7/29/2011 7/30/2011 7/31/2011 8/1/2011 8/2/2011 8/3/2011 8/4/2011 8/5/2011 8/6/2011 8/7/2011 8/8/2011 8/9/2011 8/10/2011 8/11/2011 8/12/2011 8/13/2011 8/14/2011 8/15/2011 8/16/2011 8/17/2011 8/18/2011 8/19/2011 8/20/2011 8/21/2011 740300_2013_936_21209885F_EN.docx Page 3 of 11 PM2,5 Measured values in µg/m³ (ACT) Ref. 1 PM2,5 [µg/m³] 19.1 12.3 12.1 11.8 14.3 17.5 10.2 Ref. 2 PM2,5 [µg/m³] 17.6 12.2 11.2 11.8 13.7 19.0 7.9 Ref. 1 PM10 [µg/m³] 46.1 23.4 17.8 19.6 21.5 26.5 16.8 Ref 2. PM10 [µg/m³] 47.5 23.0 17.8 19.1 20.9 25.2 16.6 Ratio PM2,5/PM10 [%] 39.2 53.0 65.4 61.2 65.9 70.6 54.2 9.8 12.7 10.3 17.0 8.7 8.6 9.5 11.4 10.1 16.6 8.4 10.6 13.3 18.0 19.0 24.4 13.8 17.1 14.2 19.2 20.1 26.1 14.7 18.0 70.4 64.8 52.1 66.5 60.2 54.7 2.8 2.8 2.7 5.3 5.5 3.0 3.1 4.0 3.2 6.4 5.2 3.8 5.6 7.9 10.8 12.1 11.4 6.4 6.4 7.5 11.2 12.7 11.1 7.0 49.5 44.1 27.1 47.0 47.3 50.2 2.6 6.0 6.0 14.7 9.0 6.6 3.6 5.4 6.0 14.0 8.7 6.2 7.0 13.5 13.7 25.8 16.8 13.3 6.7 13.9 12.9 25.0 15.9 12.8 45.5 41.7 45.1 56.3 54.1 48.8 10.4 10.3 17.1 17.2 60.4 SN 1 PM2,5 [µg/m³] 20.3 12.4 SN 2 PM2,5 [µg/m³] 21.7 13.4 6.2 11.6 13.6 7.6 5.5 13.4 12.8 9.5 17.1 9.6 9.3 6.3 3.0 1.7 5.0 7.6 4.5 3.3 3.7 4.8 9.2 6.2 14.0 9.6 8.8 9.6 12.7 14.2 16.6 Remark Cologne, Winter Recovery after zero point SN2 NEPH malfunction SN2 in repair SN2 in repair SN2 in repair SN2 in repair SN2 in repair SN2 in repair SN2 in repair 6.7 5.2 5.2 1.9 SN 2 filter tape error 14.4 6.7 4.4 4.0 4.2 9.7 10.9 11.8 11.0 6.8 8.9 12.8 Test site Bornheim, Summer TÜV Rheinland Energie und Umwelt GmbH Luftreinhaltung Report on the suitability test of the ambient air quality measuring system Model 5030i SHARP with PM2.5 pre-separator of the company Thermo Fisher Scientific for the component suspended particulate matter PM2.5, Report-No.: 936/21209885/F Annex 5 Page 185 of 424 Measured values from field test sites, related to actual conditions Manufacturer Thermo Fisher Scientific Type of instrument Model 5030i SHARP Serial-No. SN 1 / SN 2 No. Date 91 92 93 94 95 96 97 98 99 100 101 102 103 104 105 106 107 108 109 110 111 112 113 114 115 116 117 118 119 120 8/22/2011 8/23/2011 8/24/2011 8/25/2011 8/26/2011 8/27/2011 8/28/2011 8/29/2011 8/30/2011 8/31/2011 9/1/2011 9/2/2011 9/3/2011 9/4/2011 9/5/2011 9/6/2011 9/7/2011 9/8/2011 9/9/2011 9/10/2011 9/11/2011 9/12/2011 9/13/2011 9/14/2011 9/15/2011 9/16/2011 9/17/2011 9/18/2011 9/19/2011 9/20/2011 Page 4 of 11 PM2,5 Measured values in µg/m³ (ACT) Ref. 1 PM2,5 [µg/m³] 10.9 19.2 6.7 11.5 4.9 Ref. 2 PM2,5 [µg/m³] 10.8 19.1 7.4 12.1 5.5 Ref. 1 PM10 [µg/m³] 19.7 29.9 16.9 18.8 10.7 Ref 2. PM10 [µg/m³] 19.3 30.1 16.7 18.6 10.7 Ratio PM2,5/PM10 [%] 55.8 63.7 41.9 63.4 48.8 5.9 9.1 14.5 17.7 14.9 6.2 8.1 13.9 18.2 15.0 7.7 11.4 17.1 26.0 27.5 25.1 7.6 11.5 16.6 23.6 26.1 24.1 53.0 51.1 57.2 66.9 60.6 8.2 4.8 5.2 6.1 8.0 5.0 5.6 5.8 12.7 9.2 11.1 12.5 12.1 9.1 10.6 13.2 65.3 53.8 49.8 46.1 6.8 7.1 12.1 11.8 57.9 5.7 5.2 6.3 6.7 11.1 13.0 5.5 6.1 7.2 7.2 12.2 13.7 9.4 11.6 16.3 15.3 24.3 23.0 9.3 11.6 16.8 15.6 24.9 25.1 59.5 48.5 40.6 44.9 47.4 55.4 3.2 7.8 3.9 8.2 7.0 12.5 7.1 11.6 50.4 66.2 SN 1 PM2,5 [µg/m³] 12.4 23.0 6.2 11.4 5.1 2.1 2.9 6.1 9.3 14.5 14.3 11.7 14.1 6.1 3.4 2.9 5.5 3.0 6.2 7.6 4.9 3.6 4.4 4.8 9.9 SN 2 PM2,5 [µg/m³] 11.8 20.5 5.7 9.2 4.4 1.9 3.4 5.6 8.0 14.2 15.1 12.0 14.3 9.9 2.8 3.3 6.0 3.3 6.5 8.1 5.5 4.5 6.0 7.4 10.3 Remark Test site Bornheim, Summer Inlet -> Zero filter Zero point Zero point Zero filter -> Inlet 3.7 6.9 740300_2013_936_21209885F_EN.docx TÜV Rheinland Energie und Umwelt GmbH Luftreinhaltung Report on the suitability test of the ambient air quality measuring system Model 5030i SHARP with PM2.5 pre-separator of the company Thermo Fisher Scientific for the component suspended particulate matter PM2.5, Report-No.: 936/21209885/F Page 186 of 424 Annex 5 Measured values from field test sites, related to actual conditions Manufacturer Thermo Fisher Scientific Type of instrument Model 5030i SHARP Serial-No. SN 1 / SN 2 No. Date 121 122 123 124 125 126 127 128 129 130 131 132 133 134 135 136 137 138 139 140 141 142 143 144 145 146 147 148 149 150 9/21/2011 9/22/2011 9/23/2011 9/24/2011 9/25/2011 9/26/2011 9/27/2011 9/28/2011 9/29/2011 9/30/2011 10/1/2011 10/2/2011 10/3/2011 10/4/2011 10/5/2011 10/6/2011 10/7/2011 10/8/2011 10/9/2011 10/10/2011 10/11/2011 10/12/2011 10/13/2011 10/14/2011 10/15/2011 10/16/2011 10/17/2011 10/18/2011 10/19/2011 10/20/2011 740300_2013_936_21209885F_EN.docx Page 5 of 11 PM2,5 Measured values in µg/m³ (ACT) Ref. 1 PM2,5 [µg/m³] Ref. 2 PM2,5 [µg/m³] Ref. 1 PM10 [µg/m³] 12.4 19.2 26.1 Ref 2. PM10 [µg/m³] 12.3 18.9 26.2 Ratio PM2,5/PM10 [%] 6.4 12.2 7.8 13.4 15.7 14.5 21.3 18.8 38.3 21.7 20.6 39.8 70.0 17.1 12.4 16.0 11.8 23.4 24.5 50.6 13.5 9.8 4.5 5.5 3.6 14.8 9.8 2.5 4.1 3.1 15.9 7.0 10.8 8.1 16.3 6.5 10.4 7.6 60.9 51.8 45.6 42.9 6.0 4.7 1.3 1.9 4.2 5.9 6.4 5.2 2.0 3.2 4.2 8.5 10.1 11.9 5.5 5.3 11.5 14.8 10.4 12.5 5.0 5.0 11.7 14.0 60.7 40.9 31.2 49.3 36.3 50.2 11.1 18.6 4.3 3.8 9.3 13.7 20.1 6.7 5.2 9.5 17.0 28.0 11.6 16.7 27.3 11.5 73.7 70.0 47.7 11.9 15.8 67.9 37.3 49.1 SN 1 PM2,5 [µg/m³] 6.5 9.8 16.5 14.6 17.3 12.1 22.9 17.7 19.8 10.3 13.0 25.6 18.5 8.9 3.4 4.5 3.8 7.3 4.4 6.1 3.5 5.9 9.3 12.4 11.0 17.7 26.3 6.4 6.6 12.1 SN 2 PM2,5 [µg/m³] 6.6 9.5 12.6 15.3 15.5 14.0 21.0 18.5 17.4 11.7 13.2 29.1 17.1 10.1 2.5 4.7 5.2 5.7 5.1 5.9 3.4 5.8 9.6 10.5 11.1 17.6 20.7 4.8 6.5 13.2 Remark Test site Bornheim, Summer Outlier Ref. PM10 TÜV Rheinland Energie und Umwelt GmbH Luftreinhaltung Report on the suitability test of the ambient air quality measuring system Model 5030i SHARP with PM2.5 pre-separator of the company Thermo Fisher Scientific for the component suspended particulate matter PM2.5, Report-No.: 936/21209885/F Annex 5 Page 187 of 424 Measured values from field test sites, related to actual conditions Manufacturer Thermo Fisher Scientific Type of instrument Model 5030i SHARP Serial-No. SN 1 / SN 2 No. Date 151 152 153 154 155 156 157 158 159 160 161 162 163 164 165 166 167 168 169 170 171 172 173 174 175 176 177 178 179 180 10/21/2011 10/22/2011 10/23/2011 10/24/2011 10/25/2011 10/26/2011 10/27/2011 10/28/2011 10/29/2011 10/30/2011 10/31/2011 11/1/2011 11/2/2011 11/3/2011 11/4/2011 11/5/2011 11/6/2011 11/7/2011 11/8/2011 11/9/2011 11/10/2011 11/11/2011 11/12/2011 11/13/2011 1/16/2012 1/17/2012 1/18/2012 1/19/2012 1/20/2012 1/21/2012 Page 6 of 11 PM2,5 Measured values in µg/m³ (ACT) Ref. 1 PM2,5 [µg/m³] 17.6 Ref. 2 PM2,5 [µg/m³] 18.1 Ref. 1 PM10 [µg/m³] 28.0 Ref 2. PM10 [µg/m³] 26.4 Ratio PM2,5/PM10 [%] 65.5 23.0 15.4 11.0 6.0 18.1 17.8 23.2 15.4 12.1 6.7 19.3 18.0 27.2 27.3 65.6 11.7 12.2 16.8 16.3 72.0 22.5 17.2 9.2 13.7 22.3 17.3 10.8 14.3 30.8 28.4 75.7 17.8 21.0 17.5 21.1 56.4 66.5 55.2 34.6 43.7 24.0 14.3 26.9 54.7 34.3 43.6 23.4 13.9 27.9 62.1 39.5 53.1 28.6 17.3 35.1 63.5 40.6 54.2 29.9 17.3 35.3 87.5 85.9 81.4 81.1 81.4 78.0 21.5 20.6 32.7 19.5 3.5 6.2 21.5 22.3 33.2 18.9 3.5 5.9 24.1 28.9 44.3 28.9 4.1 8.6 24.7 28.1 45.6 26.4 5.3 9.5 88.1 75.1 73.4 69.4 74.2 67.3 SN 1 PM2,5 [µg/m³] 14.8 6.5 22.9 15.5 18.0 11.8 23.7 19.7 14.1 12.5 15.9 24.3 59.4 37.3 48.0 28.7 16.1 SN 2 PM2,5 [µg/m³] Remark Test site Inlet -> Zero filter Zero point / Outlier Ref PM10 Zero point Zero filter -> Inlet Bornheim, Summer 13.5 7.8 20.2 14.4 18.0 12.0 21.2 19.3 14.2 10.9 15.7 23.4 51.4 31.3 44.3 24.3 14.2 Zero point Zero point Zero point 21.6 36.7 22.4 3.6 7.4 5.3 27.2 35.1 22.1 3.8 8.3 7.1 Bornheim, Winter 740300_2013_936_21209885F_EN.docx TÜV Rheinland Energie und Umwelt GmbH Luftreinhaltung Report on the suitability test of the ambient air quality measuring system Model 5030i SHARP with PM2.5 pre-separator of the company Thermo Fisher Scientific for the component suspended particulate matter PM2.5, Report-No.: 936/21209885/F Page 188 of 424 Annex 5 Measured values from field test sites, related to actual conditions Manufacturer Thermo Fisher Scientific Type of instrument Model 5030i SHARP Serial-No. SN 1 / SN 2 No. Date 181 182 183 184 185 186 187 188 189 190 191 192 193 194 195 196 197 198 199 200 201 202 203 204 205 206 207 208 209 210 1/22/2012 1/23/2012 1/24/2012 1/25/2012 1/26/2012 1/27/2012 1/28/2012 1/29/2012 1/30/2012 1/31/2012 2/1/2012 2/2/2012 2/3/2012 2/4/2012 2/5/2012 2/6/2012 2/7/2012 2/8/2012 2/9/2012 2/10/2012 2/11/2012 2/12/2012 2/13/2012 2/14/2012 2/15/2012 2/16/2012 2/17/2012 2/18/2012 2/19/2012 2/20/2012 740300_2013_936_21209885F_EN.docx Page 7 of 11 PM2,5 Measured values in µg/m³ (ACT) Ref. 1 PM2,5 [µg/m³] 5.4 7.0 Ref. 2 PM2,5 [µg/m³] 5.1 7.9 Ref 2. PM10 [µg/m³] 12.9 13.5 21.5 25.5 27.6 24.3 Ratio PM2,5/PM10 [%] 43.1 59.0 20.0 22.3 16.0 Ref. 1 PM10 [µg/m³] 11.4 11.7 20.9 28.3 29.3 24.1 19.9 22.7 17.0 64.0 61.2 36.5 25.3 20.1 29.0 62.4 60.2 36.6 25.1 20.2 28.9 69.2 71.2 44.2 31.6 25.6 37.6 69.8 71.6 42.8 31.4 25.3 36.7 90.9 85.0 84.0 80.0 79.2 77.9 24.1 31.9 25.2 33.4 30.1 25.6 32.4 25.7 34.4 32.6 31.3 41.3 37.6 43.6 38.7 30.1 40.4 35.5 42.7 37.7 81.1 78.7 69.7 78.6 82.0 74.1 79.0 68.2 SN 1 PM2,5 [µg/m³] 7.7 9.1 17.3 22.4 24.3 16.0 18.1 69.8 66.5 38.3 26.0 23.1 27.9 34.1 26.9 38.2 28.8 37.7 33.2 SN 2 PM2,5 [µg/m³] 8.4 10.3 16.8 21.2 24.3 16.4 19.2 71.5 67.4 38.4 27.6 21.8 28.3 34.8 27.8 38.3 28.6 40.1 34.6 Remark Bornheim, Winter Inlet -> Zero point Zero point Zero point 39.6 10.3 7.1 15.6 9.7 36.0 9.8 6.7 14.2 9.1 41.9 16.6 14.7 20.8 11.3 41.0 15.7 15.0 21.9 11.9 91.1 62.3 46.6 69.7 80.8 10.3 10.6 16.6 17.6 61.0 37.2 11.4 8.5 17.1 10.3 3.4 9.9 9.9 37.4 11.2 8.4 15.9 8.6 3.6 10.4 9.9 Test site TÜV Rheinland Energie und Umwelt GmbH Luftreinhaltung Report on the suitability test of the ambient air quality measuring system Model 5030i SHARP with PM2.5 pre-separator of the company Thermo Fisher Scientific for the component suspended particulate matter PM2.5, Report-No.: 936/21209885/F Annex 5 Page 189 of 424 Measured values from field test sites, related to actual conditions Manufacturer Thermo Fisher Scientific Type of instrument Model 5030i SHARP Serial-No. SN 1 / SN 2 No. Date 211 212 213 214 215 216 217 218 219 220 221 222 223 224 225 226 227 228 229 230 231 232 233 234 235 236 237 238 239 240 2/21/2012 2/22/2012 2/23/2012 2/24/2012 2/25/2012 2/26/2012 2/27/2012 2/28/2012 2/29/2012 3/1/2012 3/2/2012 3/3/2012 3/4/2012 3/5/2012 3/6/2012 3/7/2012 7/17/2012 7/18/2012 7/19/2012 7/20/2012 7/21/2012 7/22/2012 7/23/2012 7/24/2012 7/25/2012 7/26/2012 7/27/2012 7/28/2012 7/29/2012 7/30/2012 Page 8 of 11 PM2,5 Measured values in µg/m³ (ACT) Ref. 1 PM2,5 [µg/m³] 9.9 13.3 8.3 12.1 Ref. 2 PM2,5 [µg/m³] 10.5 14.4 8.6 11.6 Ref. 1 PM10 [µg/m³] 16.3 20.8 9.1 14.7 Ref 2. PM10 [µg/m³] 17.4 22.2 10.2 14.9 Ratio PM2,5/PM10 [%] 60.4 64.5 87.3 80.1 26.5 19.6 18.7 27.6 19.6 15.9 26.4 18.9 16.0 26.5 18.0 13.3 38.6 26.0 21.8 34.3 29.1 18.9 39.6 25.6 21.7 33.7 29.8 18.0 67.7 74.6 79.8 79.5 63.7 78.8 31.5 6.1 15.2 15.5 4.2 3.8 4.6 5.1 5.8 7.1 8.5 11.4 17.8 21.0 12.3 30.0 4.6 12.8 14.5 4.5 4.2 4.6 4.9 6.1 6.8 8.8 11.5 18.5 21.4 11.8 42.8 8.1 21.5 24.8 8.5 8.9 9.1 10.3 10.9 10.6 12.7 17.7 26.5 41.3 7.1 20.5 22.4 8.9 9.4 8.9 10.8 10.7 10.6 12.8 17.7 26.6 73.2 70.6 66.7 63.4 50.1 44.2 51.2 47.7 55.0 65.3 67.8 64.6 68.4 20.0 20.3 59.7 5.0 4.8 10.0 9.8 49.2 SN 1 PM2,5 [µg/m³] 11.6 15.4 11.6 13.0 15.7 29.3 20.6 16.1 20.7 18.8 12.9 23.4 26.8 5.8 14.6 17.1 2.6 2.8 4.9 4.8 7.7 7.7 10.9 11.8 18.3 18.2 14.7 5.6 4.3 4.3 SN 2 PM2,5 [µg/m³] 11.0 16.0 8.6 12.3 14.5 27.6 17.7 16.0 21.8 17.3 13.3 21.1 24.1 6.1 15.0 15.3 6.9 9.9 3.8 6.4 7.1 8.1 9.4 12.2 19.5 19.4 13.7 4.6 3.3 4.5 Remark Test site Bornheim, Winter Teddington, Summer Outlier Ref. PM10 740300_2013_936_21209885F_EN.docx TÜV Rheinland Energie und Umwelt GmbH Luftreinhaltung Report on the suitability test of the ambient air quality measuring system Model 5030i SHARP with PM2.5 pre-separator of the company Thermo Fisher Scientific for the component suspended particulate matter PM2.5, Report-No.: 936/21209885/F Page 190 of 424 Annex 5 Measured values from field test sites, related to actual conditions Manufacturer Thermo Fisher Scientific Type of instrument Model 5030i SHARP Serial-No. SN 1 / SN 2 No. Date 241 242 243 244 245 246 247 248 249 250 251 252 253 254 255 256 257 258 259 260 261 262 263 264 265 266 267 268 269 270 7/31/2012 8/1/2012 8/2/2012 8/3/2012 8/4/2012 8/5/2012 8/6/2012 8/7/2012 8/8/2012 8/9/2012 8/10/2012 8/11/2012 8/12/2012 8/13/2012 8/14/2012 8/15/2012 8/16/2012 8/17/2012 8/18/2012 8/19/2012 8/20/2012 8/21/2012 8/22/2012 8/23/2012 8/24/2012 8/25/2012 8/26/2012 8/27/2012 8/28/2012 8/29/2012 740300_2013_936_21209885F_EN.docx Page 9 of 11 PM2,5 Measured values in µg/m³ (ACT) Ref. 1 PM2,5 [µg/m³] 9.2 5.9 5.3 Ref. 2 PM2,5 [µg/m³] 9.4 5.9 5.5 4.8 4.6 3.4 3.5 8.1 11.5 13.3 15.3 7.3 4.8 7.7 7.2 6.5 6.7 6.9 6.5 7.4 5.3 4.8 3.6 3.4 8.1 11.6 13.3 15.0 7.1 4.6 7.7 7.1 6.6 6.7 6.9 6.4 7.3 Ref. 1 PM10 [µg/m³] 14.9 12.7 12.6 13.2 10.3 9.2 7.7 7.8 12.0 15.9 20.2 25.6 14.4 9.0 13.6 19.6 16.0 13.7 10.7 10.8 12.4 13.8 14.4 14.1 9.7 Ref 2. PM10 [µg/m³] 15.7 12.6 13.0 11.9 10.6 9.6 8.0 8.0 12.7 16.8 21.0 26.3 14.6 9.3 14.1 19.9 16.2 13.9 10.9 11.2 12.6 14.1 13.8 14.6 10.1 14.0 12.0 13.6 12.0 Ratio PM2,5/PM10 [%] 60.7 46.7 42.3 48.3 50.4 44.4 43.4 65.7 70.5 64.7 58.3 49.6 51.4 55.4 36.2 40.8 48.9 63.8 58.4 58.8 SN 1 PM2,5 [µg/m³] 10.9 2.9 3.9 4.7 5.3 3.6 4.1 2.6 SN 2 PM2,5 [µg/m³] 11.3 3.8 5.7 4.3 4.6 4.4 6.0 3.3 11.2 12.2 13.9 12.8 5.6 5.2 6.8 10.3 7.4 5.3 6.9 7.8 9.1 6.5 5.7 4.5 3.5 3.9 5.4 3.2 6.4 4.1 Remark Test site Teddington, Summer Outlier Ref. PM2,5 SN1 malfunction SN1 defective SN1 defective SN1 defective SN1 defective SN1 defective SN1 defective SN1 defective SN1 defective SN1 defective SN1 defective SN1 defective SN1 defective SN1 defective SN1 defective SN1 defective SN1 defective SN1 defective SN1 defective SN1 defective SN1 defective SN1 defective TÜV Rheinland Energie und Umwelt GmbH Luftreinhaltung Report on the suitability test of the ambient air quality measuring system Model 5030i SHARP with PM2.5 pre-separator of the company Thermo Fisher Scientific for the component suspended particulate matter PM2.5, Report-No.: 936/21209885/F Annex 5 Page 191 of 424 Measured values from field test sites, related to actual conditions Manufacturer Thermo Fisher Scientific Type of instrument Model 5030i SHARP Serial-No. SN 1 / SN 2 No. Date 271 272 273 274 275 276 277 278 279 280 281 282 283 284 285 286 287 288 289 290 291 292 293 294 295 296 297 298 299 300 8/30/2012 8/31/2012 9/1/2012 9/2/2012 9/3/2012 9/4/2012 9/5/2012 9/6/2012 9/7/2012 9/8/2012 9/9/2012 9/10/2012 9/11/2012 9/12/2012 9/13/2012 9/14/2012 9/15/2012 9/16/2012 9/17/2012 9/18/2012 9/19/2012 9/20/2012 9/21/2012 9/22/2012 9/23/2012 9/24/2012 9/25/2012 9/26/2012 9/27/2012 9/28/2012 Ref. 1 PM2,5 [µg/m³] Page 10 of 11 PM2,5 Measured values in µg/m³ (ACT) Ref. 2 PM2,5 [µg/m³] 8.9 10.7 11.2 8.6 11.0 11.4 4.4 4.4 4.7 5.1 8.9 3.4 5.9 6.5 8.2 5.4 5.5 7.6 12.4 3.1 2.5 5.6 4.6 3.3 4.7 5.3 8.6 3.3 6.0 6.3 8.2 6.0 5.2 7.4 12.4 3.2 2.6 5.7 4.5 3.5 Ref. 1 PM10 [µg/m³] 11.5 13.4 11.8 12.6 14.9 16.8 21.0 24.1 Ref 2. PM10 [µg/m³] 11.2 13.3 11.6 12.0 15.0 17.7 20.8 24.2 Ratio PM2,5/PM10 [%] SN 1 PM2,5 [µg/m³] 50.9 51.9 46.7 4.6 7.4 5.3 8.5 9.2 4.3 6.6 6.9 7.1 6.2 5.6 8.5 13.1 1.8 2.0 7.3 5.3 2.8 SN 2 PM2,5 [µg/m³] 6.3 6.6 3.6 8.6 8.0 8.7 7.7 10.2 Remark Test site SN 1 defective SN1 defective SN1 defective SN1 defective SN1 defective SN1 defective SN1 defective Stop PM10 Reference Inlet -> Zero filter Zero point Zero point Audits SN2 stabilisation problems SHARP SN2 stabilisation problems SHARP SN2 stabilisation problems SHARP Teddington, Summer 8.7 7.3 2.7 7.0 5.6 7.1 4.4 7.1 8.0 11.6 1.8 2.6 5.4 6.6 3.2 740300_2013_936_21209885F_EN.docx TÜV Rheinland Energie und Umwelt GmbH Luftreinhaltung Report on the suitability test of the ambient air quality measuring system Model 5030i SHARP with PM2.5 pre-separator of the company Thermo Fisher Scientific for the component suspended particulate matter PM2.5, Report-No.: 936/21209885/F Page 192 of 424 Annex 5 Measured values from field test sites, related to actual conditions Manufacturer Thermo Fisher Scientific Type of instrument Model 5030i SHARP Serial-No. SN 1 / SN 2 No. Date 301 302 303 304 305 306 307 308 309 310 311 312 313 9/29/2012 9/30/2012 10/1/2012 10/2/2012 10/3/2012 10/4/2012 10/5/2012 10/6/2012 10/7/2012 10/8/2012 10/9/2012 10/10/2012 10/11/2012 740300_2013_936_21209885F_EN.docx Ref. 1 PM2,5 [µg/m³] 8.3 4.8 4.0 3.7 3.6 3.5 3.3 11.5 16.7 15.4 8.3 13.8 6.3 Page 11 of 11 PM2,5 Measured values in µg/m³ (ACT) Ref. 2 PM2,5 [µg/m³] 8.2 4.6 3.9 3.7 3.4 3.5 3.3 11.2 16.2 15.4 8.5 13.9 6.4 Ref. 1 PM10 [µg/m³] Ref 2. PM10 [µg/m³] Ratio PM2,5/PM10 [%] SN 1 PM2,5 [µg/m³] 8.4 5.0 3.9 3.8 2.4 2.8 4.3 12.3 21.1 17.4 5.8 12.8 5.6 SN 2 PM2,5 [µg/m³] 6.8 5.2 4.2 4.2 2.6 4.2 4.8 13.3 16.7 17.5 6.4 12.6 7.1 Remark Test site Teddington, Summer TÜV Rheinland Energie und Umwelt GmbH Luftreinhaltung Report on the suitability test of the ambient air quality measuring system Model 5030i SHARP with PM2.5 pre-separator of the company Thermo Fisher Scientific for the component suspended particulate matter PM2.5, Report-No.: 936/21209885/F Page 193 of 424 Annex 6 No. 1 2 3 4 5 6 7 8 9 10 11 12 13 14 15 16 17 18 19 20 21 22 23 24 25 26 27 28 29 30 * volatile PM-compounds, Ambient conditions at field test sites Date Test site Mean PM2,5-conc. [µg/m³] 3/8/2011 Cologne, Winter 31.4 3/9/2011 18.9 3/10/2011 3/11/2011 16.4 3/12/2011 3/13/2011 13.2 3/14/2011 19.1 3/15/2011 37.6 3/16/2011 56.4 3/17/2011 50.1 3/18/2011 28.2 3/19/2011 3/20/2011 20.4 3/21/2011 22.3 3/22/2011 41.6 3/23/2011 20.4 3/24/2011 19.4 3/25/2011 27.5 3/26/2011 3/27/2011 24.7 3/28/2011 20.6 3/29/2011 44.4 3/30/2011 15.6 3/31/2011 5.5 4/1/2011 8.1 4/2/2011 4/3/2011 14.2 4/4/2011 8.9 4/5/2011 11.2 4/6/2011 13.0 determined with parallel operated TEOM-FDMS-systems PM2,5 volatiles [µg/m³]* 6.4 5.2 Ratio volatiles / PM2,5 [%] 20.5 27.7 3.1 3.5 2.0 19.0 7.2 9.3 8.8 10.2 5.8 5.5 5.2 10.7 7.6 7.1 9.4 5.0 6.6 6.7 13.9 6.9 2.5 3.3 4.3 4.8 3.3 3.8 4.4 19.2 16.6 17.6 36.3 15.2 27.1 23.3 25.7 37.1 36.7 34.0 26.5 32.4 31.4 44.6 44.8 40.7 34.0 37.3 34.4 34.0 Mean ambient temperature [°C] 7.9 7.1 9.2 8.1 12.1 11.2 9.8 12.3 9.5 5.7 6.0 5.0 5.3 6.9 9.4 10.7 10.9 11.8 7.7 9.3 7.2 9.6 12.6 13.8 13.9 17.6 10.9 10.0 11.8 16.2 Max. ambient temperature [°C] 14.4 10.6 10.1 11.4 16.4 14.1 13.8 19.6 16.9 7.2 7.6 12.1 13.2 16.1 17.2 18.6 18.6 18.0 11.6 16.3 13.7 18.5 15.9 15.6 18.8 24.3 15.8 15.0 15.1 23.0 Page 1 of 11 Ambient pressure [hPa] 1013 1010 1008 1008 998 1001 1010 1006 1000 1009 1018 1027 1027 1029 1031 1030 1021 1010 1010 1006 1009 1007 1008 1011 1014 1006 1009 1017 1020 1019 Rel. humidity [%] 54.0 75.8 68.9 69.5 61.6 77.3 81.2 66.2 71.9 86.9 89.1 59.5 57.7 56.5 62.7 66.8 67.2 59.4 64.8 60.9 60.2 62.1 66.7 78.2 78.1 62.2 85.3 65.3 71.9 73.9 Wind velocity [m/s] 2.3 3.5 5.3 3.8 3.3 2.0 0.3 2.2 2.5 4.7 1.1 1.2 0.9 1.0 1.1 1.2 1.0 1.6 1.5 1.1 1.9 1.1 2.4 3.7 2.3 2.6 2.0 2.7 2.1 1.8 Wind direction [°] 147 232 231 197 147 156 114 96 126 267 135 123 150 166 184 161 174 183 105 196 172 168 170 230 175 159 251 214 173 196 Precipitation [mm] 0.0 0.9 0.0 0.3 0.3 1.5 0.0 0.0 0.0 0.0 11.1 0.0 0.0 0.0 0.0 0.0 0.0 0.0 0.0 0.0 0.0 0.0 0.0 6.5 0.0 0.0 8.7 0.0 0.9 0.0 740300_2013_936_21209885F_EN.docx TÜV Rheinland Energie und Umwelt GmbH Luftreinhaltung Report on the suitability test of the ambient air quality measuring system Model 5030i SHARP with PM2.5 pre-separator of the company Thermo Fisher Scientific for the component suspended particulate matter PM2.5, Report-No.: 936/21209885/F Page 194 of 424 Annex 6 No. 31 32 34 34 35 36 37 38 39 40 41 42 43 44 45 46 47 48 49 50 51 52 53 54 55 56 57 58 59 60 * volatile PM-compounds, Ambient conditions at field test sites Date Test site Mean PM2,5-conc. [µg/m³] 13.4 19.4 4/7/2011 Cologne, Winter 4/8/2011 4/9/2011 4/10/2011 11.4 4/11/2011 15.1 4/12/2011 8.6 4/13/2011 12.3 4/14/2011 19.5 4/15/2011 12.4 4/16/2011 4/17/2011 4/18/2011 17.1 4/19/2011 17.7 4/20/2011 20.4 4/21/2011 4/22/2011 4/23/2011 4/24/2011 4/25/2011 20.2 4/26/2011 17.3 4/27/2011 4/28/2011 17.0 4/29/2011 19.2 4/30/2011 13.1 5/1/2011 6.8 5/2/2011 9.3 5/3/2011 9.2 5/4/2011 11.4 5/5/2011 5/6/2011 13.6 determined with parallel operated TEOM-FDMS-systems 740300_2013_936_21209885F_EN.docx PM2,5 volatiles [µg/m³]* 5.5 Ratio volatiles / PM2,5 [%] 40.7 2.9 3.2 4.4 3.1 2.2 2.5 3.0 2.8 2.9 3.0 2.6 2.5 2.3 2.4 1.9 7.5 5.4 2.8 2.5 2.3 2.1 2.2 2.9 3.8 2.8 33.9 26.2 22.4 24.7 17.8 15.8 14.2 12.0 11.0 31.5 14.7 19.0 32.9 23.0 24.4 25.2 20.3 Mean ambient temperature [°C] 13.8 12.9 11.3 14.0 16.0 7.7 10.1 8.0 10.4 11.9 11.4 14.3 15.5 16.6 17.8 20.0 18.0 18.1 16.8 16.7 10.8 14.2 17.2 16.9 14.8 11.0 10.0 9.7 14.1 18.6 Max. ambient temperature [°C] 21.6 18.2 18.9 23.1 25.0 12.4 14.3 14.2 17.0 16.9 19.2 21.2 25.5 25.7 26.3 27.8 28.9 28.0 26.0 23.4 12.5 20.5 24.9 24.2 22.4 17.8 17.2 16.2 19.8 24.8 Page 2 of 11 Ambient pressure [hPa] 1019 1018 1018 1016 1012 1018 1013 1013 1014 1017 1017 1011 1009 1008 1006 1003 1005 1011 1013 1011 1010 1005 1002 1002 1002 1004 1011 1016 1015 1012 Rel. humidity [%] 67.2 64.7 59.8 60.2 58.8 66.7 57.1 65.4 53.6 51.7 53.7 48.6 52.4 51.3 54.1 51.8 58.0 51.7 50.3 51.5 90.4 77.6 56.8 47.4 44.5 53.3 49.4 61.5 46.9 41.1 Wind velocity [m/s] 3.0 2.9 1.3 1.1 3.9 4.1 2.0 0.6 1.2 0.9 1.2 1.9 1.2 1.1 0.7 1.3 0.7 1.0 1.2 1.8 0.7 0.7 1.7 1.7 1.6 2.0 1.0 1.3 2.2 2.5 Wind direction [°] 245 255 183 191 244 257 203 159 169 166 139 149 146 154 180 146 152 172 153 166 213 176 112 141 111 116 164 168 119 110 Precipitation [mm] 0.0 0.0 0.0 0.0 2.7 0.9 0.0 0.0 0.0 0.0 0.0 0.0 0.0 0.0 0.0 8.3 0.0 0.0 0.0 2.1 8.9 0.3 3.0 0.0 0.0 0.0 0.0 0.0 0.0 0.0 TÜV Rheinland Energie und Umwelt GmbH Luftreinhaltung Report on the suitability test of the ambient air quality measuring system Model 5030i SHARP with PM2.5 pre-separator of the company Thermo Fisher Scientific for the component suspended particulate matter PM2.5, Report-No.: 936/21209885/F Page 195 of 424 Annex 6 No. 61 62 63 64 65 66 67 68 69 70 71 72 73 74 75 76 77 78 79 80 81 82 83 84 85 86 87 88 89 90 * volatile PM-compounds, Ambient conditions at field test sites Date Test site Mean PM2,5-conc. [µg/m³] 18.4 12.3 11.6 11.8 14.0 18.2 9.0 5/7/2011 Cologne, Winter 5/8/2011 7/25/2011 Bornheim, Summer 7/26/2011 7/27/2011 7/28/2011 7/29/2011 7/30/2011 7/31/2011 9.7 8/1/2011 12.1 8/2/2011 10.2 8/3/2011 16.8 8/4/2011 8.6 8/5/2011 9.6 8/6/2011 8/7/2011 3.0 8/8/2011 3.4 8/9/2011 3.0 8/10/2011 5.8 8/11/2011 5.3 8/12/2011 3.4 8/13/2011 8/14/2011 3.1 8/15/2011 5.7 8/16/2011 6.0 8/17/2011 14.3 8/18/2011 8.8 8/19/2011 6.4 8/20/2011 8/21/2011 10.3 determined with parallel operated TEOM-FDMS-systems PM2,5 volatiles [µg/m³]* 2.5 1.7 Ratio volatiles / PM2,5 [%] 13.8 13.7 2.9 4.2 5.1 3.5 1.6 1.2 1.7 1.4 2.6 3.2 1.8 1.7 1.3 -0.2 -0.1 2.3 1.3 1.0 2.0 0.1 0.9 1.6 3.1 2.8 1.8 1.7 1.2 24.1 29.9 27.9 39.0 12.6 13.8 13.4 15.8 36.8 18.3 43.5 -6.8 -4.8 38.9 25.3 29.7 3.8 15.7 27.6 21.6 31.5 27.7 11.9 Mean ambient temperature [°C] 21.9 22.1 17.2 17.0 17.3 17.7 16.9 14.5 13.4 19.1 23.2 19.7 22.3 20.6 19.3 17.8 15.5 13.8 18.0 20.9 18.5 20.1 17.4 17.9 19.1 21.1 22.5 16.8 20.7 23.2 Max. ambient temperature [°C] 28.3 28.6 22.8 20.6 24.3 24.5 20.2 16.1 16.6 26.1 30.0 24.1 29.2 25.0 25.4 22.4 18.4 17.8 22.4 25.5 21.7 23.7 19.9 22.4 23.9 27.8 31.3 21.2 28.1 31.4 Page 3 of 11 Ambient pressure [hPa] 1011 1013 1001 1006 1010 1011 1011 1010 1009 1008 1007 1006 1005 1004 996 998 1000 1012 1013 1004 1003 1001 1000 1009 1010 1007 1004 1011 1011 1007 Rel. humidity [%] 37.0 34.7 73.8 78.4 84.8 85.6 76.2 80.4 76.2 68.1 60.8 82.9 71.6 75.8 85.0 64.0 74.7 76.8 57.5 53.8 78.9 77.0 86.2 71.8 69.0 73.8 76.6 80.0 66.6 74.8 Wind velocity [m/s] 3.4 4.1 0.8 1.1 0.7 0.6 2.9 2.3 0.9 0.9 1.5 1.1 0.8 1.1 1.4 1.5 2.5 2.7 1.3 1.2 1.1 0.7 1.1 1.2 0.7 0.7 1.2 1.5 0.8 1.0 Wind direction [°] 109 97 193 259 229 228 299 288 244 177 143 195 204 221 171 209 219 265 224 220 228 185 219 230 190 206 174 235 157 184 Precipitation [mm] 0.0 0.0 1.2 0.0 51.7 5.9 0.0 0.0 0.0 0.0 0.0 5.4 3.6 0.6 7.7 1.8 6.2 14.8 0.0 0.3 2.1 0.0 17.4 0.0 0.6 4.7 20.9 3.3 0.0 0.3 740300_2013_936_21209885F_EN.docx TÜV Rheinland Energie und Umwelt GmbH Luftreinhaltung Report on the suitability test of the ambient air quality measuring system Model 5030i SHARP with PM2.5 pre-separator of the company Thermo Fisher Scientific for the component suspended particulate matter PM2.5, Report-No.: 936/21209885/F Page 196 of 424 Annex 6 No. 91 92 93 94 95 96 97 98 99 100 101 102 103 104 105 106 107 108 109 110 111 112 113 114 115 116 117 118 119 120 * volatile PM-compounds, Ambient conditions at field test sites Date Test site Mean PM2,5-conc. [µg/m³] 10.9 19.1 7.1 11.8 5.2 8/22/2011 Bornheim, Summer 8/23/2011 8/24/2011 8/25/2011 8/26/2011 8/27/2011 8/28/2011 8/29/2011 6.1 8/30/2011 8.6 8/31/2011 14.2 9/1/2011 17.9 9/2/2011 14.9 9/3/2011 9/4/2011 8.1 9/5/2011 4.9 9/6/2011 5.4 9/7/2011 5.9 9/8/2011 9/9/2011 6.9 9/10/2011 9/11/2011 5.6 9/12/2011 5.6 9/13/2011 6.7 9/14/2011 6.9 9/15/2011 11.7 9/16/2011 13.3 9/17/2011 9/18/2011 3.5 9/19/2011 8.0 9/20/2011 determined with parallel operated TEOM-FDMS-systems 740300_2013_936_21209885F_EN.docx PM2,5 volatiles [µg/m³]* 3.2 2.9 1.8 3.1 1.7 0.7 1.2 0.9 1.5 2.9 4.3 2.2 2.3 1.0 0.4 1.7 1.3 1.0 1.0 1.1 1.4 1.0 0.9 1.0 1.5 1.1 Ratio volatiles / PM2,5 [%] 29.2 15.4 25.3 26.0 32.1 15.0 17.3 20.7 23.8 14.5 12.3 8.3 32.2 21.4 13.9 24.9 18.0 12.7 14.8 12.8 Mean ambient temperature [°C] 20.4 22.6 20.1 20.8 19.4 15.3 15.6 14.5 13.6 14.8 16.4 21.2 24.5 20.2 16.6 17.4 14.9 14.7 19.0 23.8 16.2 19.4 16.7 15.2 14.1 17.1 16.8 13.3 13.6 15.6 Max. ambient temperature [°C] 24.4 27.8 27.2 27.6 30.2 20.0 19.7 18.4 18.4 21.4 23.4 29.4 30.9 27.4 21.4 20.6 18.1 16.2 21.6 29.7 22.1 24.6 20.8 19.6 20.4 21.9 21.4 16.5 18.1 18.5 Page 4 of 11 Ambient pressure [hPa] 1009 1005 1007 1003 999 1007 1009 1008 1008 1007 1006 1004 1002 1002 1009 1005 1004 1003 1004 1001 1003 1004 1006 1011 1013 1006 1001 998 1008 1014 Rel. humidity [%] 76.5 78.4 76.6 83.4 83.7 77.0 69.2 66.7 73.6 72.0 71.6 72.2 67.0 79.5 62.9 66.8 73.1 84.7 86.9 73.0 86.0 71.1 67.3 65.1 75.3 72.6 70.6 76.4 75.8 78.0 Wind velocity [m/s] 1.2 0.9 0.7 1.0 1.5 1.1 1.3 2.0 0.8 0.7 0.6 0.8 1.3 1.1 1.9 2.6 2.2 1.1 0.4 1.5 0.7 1.7 1.6 1.5 0.6 1.4 1.0 1.0 1.4 0.5 Wind direction [°] 253 206 192 176 195 207 212 243 236 225 182 160 132 223 217 219 246 209 167 155 165 204 219 224 207 145 207 200 231 196 Precipitation [mm] 0.0 0.0 0.6 2.1 29.1 0.3 0.0 0.0 0.0 0.0 0.0 0.0 3.6 0.6 0.0 4.8 5.7 3.3 0.0 0.0 16.2 0.0 0.0 0.0 0.0 0.0 3.6 4.5 0.9 0.0 TÜV Rheinland Energie und Umwelt GmbH Luftreinhaltung Report on the suitability test of the ambient air quality measuring system Model 5030i SHARP with PM2.5 pre-separator of the company Thermo Fisher Scientific for the component suspended particulate matter PM2.5, Report-No.: 936/21209885/F Page 197 of 424 Annex 6 No. 121 122 123 124 125 126 127 128 129 130 131 132 134 134 135 136 137 138 139 140 141 142 143 144 145 146 147 148 149 150 * volatile PM-compounds, Ambient conditions at field test sites Date Test site Mean PM2,5-conc. [µg/m³] 9/21/2011 Bornheim, Summer 9/22/2011 7.1 9/23/2011 12.8 9/24/2011 9/25/2011 15.1 9/26/2011 9/27/2011 9/28/2011 9/29/2011 16.6 9/30/2011 12.1 10/1/2011 10/2/2011 10/3/2011 14.2 10/4/2011 9.8 10/5/2011 3.5 10/6/2011 4.8 10/7/2011 3.4 10/8/2011 10/9/2011 6.2 10/10/2011 5.0 10/11/2011 1.6 10/12/2011 2.5 10/13/2011 4.2 10/14/2011 7.2 10/15/2011 10/16/2011 12.4 10/17/2011 19.4 10/18/2011 5.5 10/19/2011 4.5 10/20/2011 9.4 determined with parallel operated TEOM-FDMS-systems PM2,5 volatiles [µg/m³]* 1.0 1.1 1.6 1.4 1.1 Ratio volatiles / PM2,5 [%] 15.1 12.4 Mean ambient temperature [°C] 16.9 15.2 Page 5 of 11 Max. ambient temperature [°C] 20.5 18.7 Ambient pressure [hPa] 1011 1011 Rel. humidity [%] 69.5 72.2 Wind velocity [m/s] 0.8 1.2 Wind direction [°] 204 231 Precipitation [mm] 0.0 0.0 1.2 0.5 0.3 0.8 1.6 1.2 2.3 3.6 2.1 1.4 3.2 3.6 0.9 0.6 1.0 1.2 1.5 0.8 1.2 1.5 1.0 155 176 213 168 214 199 213 272 258 190 261 251 226 209 151 162 157 163 197 225 223 0.0 0.0 0.0 0.0 0.0 0.0 0.3 5.7 6.0 5.4 0.3 0.0 17.9 0.0 0.0 0.0 0.0 0.0 3.0 0.0 0.0 7.1 Outage of weather station 3.1 1.7 1.1 1.2 3.5 3.4 1.4 1.9 1.1 0.5 0.8 1.9 0.7 0.8 0.0 0.5 1.7 2.0 2.3 4.9 2.2 0.6 1.9 10.0 8.9 24.0 14.1 53.3 23.0 14.1 30.6 14.3 50.2 -0.7 11.8 23.1 18.4 25.2 39.9 13.6 20.7 18.4 18.1 17.8 18.8 17.8 17.5 13.2 9.9 8.7 12.2 17.7 16.3 12.5 9.9 8.7 7.8 8.5 10.5 9.2 8.1 5.6 26.8 28.0 26.8 26.5 20.5 20.0 19.3 13.4 11.4 16.3 21.3 18.0 15.8 15.8 15.9 14.8 14.8 16.6 15.0 14.0 10.6 1017 1018 1016 1013 1013 1011 1001 1005 1009 1011 1009 1010 1012 1022 1024 1020 1016 1011 1003 1010 1018 68.3 70.6 75.4 65.9 72.4 70.8 71.2 81.6 85.5 84.5 74.4 77.4 91.1 76.3 69.6 68.8 73.8 78.5 82.0 74.4 79.8 740300_2013_936_21209885F_EN.docx TÜV Rheinland Energie und Umwelt GmbH Luftreinhaltung Report on the suitability test of the ambient air quality measuring system Model 5030i SHARP with PM2.5 pre-separator of the company Thermo Fisher Scientific for the component suspended particulate matter PM2.5, Report-No.: 936/21209885/F Page 198 of 424 Annex 6 No. 151 152 153 154 155 156 157 158 159 160 161 162 163 164 165 166 167 168 169 170 171 172 173 174 175 176 177 178 179 180 * volatile PM-compounds, Page 6 of 11 Ambient conditions at field test sites Date Test site Mean PM2,5-conc. [µg/m³] 17.8 10/21/2011 Bornheim, Summer 10/22/2011 10/23/2011 23.1 10/24/2011 15.4 11.6 10/25/2011 6.3 10/26/2011 18.7 10/27/2011 10/28/2011 17.9 10/29/2011 11.9 10/30/2011 10/31/2011 11/1/2011 22.4 11/2/2011 17.2 11/3/2011 10.0 14.0 11/4/2011 11/5/2011 11/6/2011 55.0 11/7/2011 34.4 11/8/2011 43.7 11/9/2011 23.7 11/10/2011 14.1 11/11/2011 27.4 11/12/2011 11/13/2011 21.5 1/16/2012 21.4 Bornheim, Winter 1/17/2012 33.0 1/18/2012 19.2 1/19/2012 3.5 1/20/2012 6.1 1/21/2012 determined with parallel operated TEOM-FDMS-systems 740300_2013_936_21209885F_EN.docx PM2,5 volatiles [µg/m³]* 4.2 5.4 6.1 4.0 2.0 1.6 3.5 3.2 3.1 2.6 4.4 4.8 5.3 3.2 2.2 1.6 6.4 4.8 5.6 5.4 4.5 4.5 6.7 6.0 3.1 3.9 4.7 2.6 2.6 2.3 Ratio volatiles / PM2,5 [%] 23.6 26.3 25.7 17.0 24.5 18.9 18.0 22.1 21.4 30.5 32.2 15.4 Mean ambient temperature [°C] 5.2 6.8 7.4 9.8 10.9 9.4 10.1 14.0 13.5 13.5 11.9 12.2 12.5 13.7 Max. ambient temperature [°C] 11.4 11.9 13.6 12.4 13.0 15.7 13.4 20.1 17.2 18.2 17.2 15.6 14.7 17.3 11.6 13.9 12.8 22.8 32.1 16.3 28.0 14.4 11.8 24.7 73.2 42.0 Ambient pressure [hPa] 1019 1013 1007 999 997 1006 1008 1016 1015 1014 1009 1007 1002 995 Rel. humidity [%] 79.3 69.3 71.6 67.2 68.8 74.9 80.4 75.8 79.8 86.7 87.0 83.2 80.8 69.7 Wind velocity [m/s] 1.1 3.9 2.3 3.8 1.9 0.9 2.7 0.7 1.0 0.4 1.0 2.0 2.9 3.8 Wind direction [°] 154 128 138 132 132 171 126 149 132 170 152 134 124 140 Precipitation [mm] 0.0 0.0 0.0 0.0 0.0 0.0 0.0 0.0 0.9 0.0 0.3 1.8 0.3 0.0 4.1 2.4 0.6 0.5 1.5 4.1 3.1 5.3 135 131 138 123 126 253 239 261 0.0 0.0 0.3 0.3 6.6 12.8 5.1 6.9 Outage of weather station 7.2 5.4 -0.9 -0.6 3.1 7.2 3.1 7.3 9.4 10.1 3.9 4.7 7.1 11.9 5.4 10.3 1024 1023 1020 1022 1018 1006 1008 1000 81.6 83.7 81.8 81.5 84.3 84.8 85.5 81.9 TÜV Rheinland Energie und Umwelt GmbH Luftreinhaltung Report on the suitability test of the ambient air quality measuring system Model 5030i SHARP with PM2.5 pre-separator of the company Thermo Fisher Scientific for the component suspended particulate matter PM2.5, Report-No.: 936/21209885/F Page 199 of 424 Annex 6 No. 181 182 183 184 185 186 187 188 189 190 191 192 193 194 195 196 197 198 199 200 201 202 203 204 205 206 207 208 209 210 * volatile PM-compounds, Ambient conditions at field test sites Date Test site Mean PM2,5-conc. [µg/m³] 5.2 7.4 1/22/2012 Bornheim, Winter 1/23/2012 1/24/2012 1/25/2012 19.9 1/26/2012 22.5 1/27/2012 16.5 1/28/2012 1/29/2012 63.2 1/30/2012 60.7 1/31/2012 36.5 2/1/2012 25.2 2/2/2012 20.2 2/3/2012 28.9 2/4/2012 2/5/2012 24.9 2/6/2012 32.2 2/7/2012 25.5 2/8/2012 33.9 2/9/2012 31.3 2/10/2012 2/11/2012 2/12/2012 2/13/2012 37.8 2/14/2012 10.1 2/15/2012 6.9 2/16/2012 14.9 2/17/2012 9.4 2/18/2012 2/19/2012 2/20/2012 10.5 determined with parallel operated TEOM-FDMS-systems PM2,5 volatiles [µg/m³]* 0.8 1.3 2.7 5.0 6.2 4.0 3.2 6.6 6.9 5.8 5.2 3.8 5.9 8.2 4.9 4.8 4.3 5.4 6.7 Ratio volatiles / PM2,5 [%] 14.5 17.6 8.7 23.1 1.9 0.4 2.3 21.5 25.1 27.7 24.5 10.4 11.4 15.9 20.7 18.6 20.3 19.8 15.0 16.8 15.8 21.4 Mean ambient temperature [°C] 6.4 4.2 2.3 2.5 2.6 2.3 1.6 -0.4 -0.1 -2.7 -5.2 -7.0 -8.5 -8.5 -7.9 -8.9 -7.6 -5.7 -5.4 -5.7 -7.6 -4.2 0.4 3.1 3.5 4.2 5.6 6.5 1.5 1.0 Max. ambient temperature [°C] 9.3 7.1 5.5 4.2 4.0 7.4 4.4 0.3 0.9 0.9 0.7 -0.8 -4.0 -3.7 -3.6 -3.6 -4.3 0.0 -2.2 -0.3 -2.1 -1.5 1.9 5.0 5.3 5.3 7.1 9.4 4.8 5.1 Page 7 of 11 Ambient pressure [hPa] 1003 1008 1014 1012 1010 1016 1021 1020 1017 1018 1023 1026 1031 1031 1027 1029 1031 1030 1030 1031 1028 1024 1012 1006 1008 1016 1013 1005 1017 1026 Rel. humidity [%] 77.0 83.7 87.4 81.0 78.6 85.6 81.0 81.2 75.8 62.8 53.6 50.2 69.0 69.8 57.9 57.8 61.6 68.4 81.1 64.9 67.2 69.3 89.7 88.5 81.1 90.4 87.7 81.8 84.7 76.4 Wind velocity [m/s] 4.7 3.0 0.9 3.9 4.1 1.1 0.9 1.4 1.5 2.0 2.2 1.5 1.0 1.0 1.7 1.1 1.8 0.8 1.6 1.1 1.1 0.9 0.7 4.4 5.7 1.2 1.7 2.5 2.9 0.8 Wind direction [°] 271 268 188 126 127 124 166 238 110 116 144 186 252 182 142 152 148 187 259 116 198 233 208 280 303 246 229 213 270 179 Precipitation [mm] 1.8 3.6 0.0 0.0 0.6 0.0 0.3 0.0 0.0 0.0 0.0 0.0 0.0 0.0 0.0 0.0 0.0 0.0 0.0 0.6 0.0 0.0 2.1 4.2 0.6 2.1 1.2 1.5 0.9 0.0 740300_2013_936_21209885F_EN.docx TÜV Rheinland Energie und Umwelt GmbH Luftreinhaltung Report on the suitability test of the ambient air quality measuring system Model 5030i SHARP with PM2.5 pre-separator of the company Thermo Fisher Scientific for the component suspended particulate matter PM2.5, Report-No.: 936/21209885/F Page 200 of 424 Annex 6 No. 211 212 213 214 215 216 217 218 219 220 221 222 223 224 225 226 227 228 229 230 231 232 234 234 235 236 237 238 239 240 * volatile PM-compounds, Ambient conditions at field test sites Date Test site Mean PM2,5-conc. [µg/m³] 10.2 13.9 8.4 11.9 2/21/2012 Bornheim, Winter 2/22/2012 2/23/2012 2/24/2012 2/25/2012 2/26/2012 26.5 2/27/2012 19.2 2/28/2012 17.4 2/29/2012 27.0 3/1/2012 18.8 3/2/2012 14.6 3/3/2012 3/4/2012 30.8 3/5/2012 5.4 3/6/2012 14.0 3/7/2012 15.0 7/17/2012 Teddington, Summer 4.3 7/18/2012 4.0 7/19/2012 4.6 7/20/2012 5.0 7/21/2012 6.0 7/22/2012 6.9 7/23/2012 8.6 7/24/2012 11.4 7/25/2012 18.1 7/26/2012 21.2 7/27/2012 12.0 7/28/2012 7/29/2012 7/30/2012 4.9 determined with parallel operated TEOM-FDMS-systems 740300_2013_936_21209885F_EN.docx PM2,5 volatiles [µg/m³]* 1.3 Ratio volatiles / PM2,5 [%] 13.1 2.4 3.6 6.3 6.4 5.9 5.1 7.0 4.6 4.6 6.0 9.7 3.6 3.8 5.4 3 2.0 1.6 0.8 1.3 1.5 2.0 2.0 2.9 4.6 5.4 1.8 1.3 1.2 29.0 30.5 24.2 30.9 29.3 26.0 24.7 31.6 31.4 67.6 27.3 36.4 69.0 50.6 34.3 14.9 22.4 21.0 22.7 17.8 16.1 21.8 44.7 23.9 Mean ambient temperature [°C] 4.4 6.3 8.2 9.9 7.0 5.2 7.7 9.4 10.4 8.8 9.0 8.7 8.6 5.6 4.8 5.2 19.2 16.4 16.4 16.2 16.9 18.6 21.4 22.8 24.2 21.8 19.9 17.1 13.6 16.3 Max. ambient temperature [°C] 8.5 11.2 10.3 13.7 10.9 6.9 10.3 10.7 13.3 10.6 11.8 10.9 11.5 7.8 10.3 7.8 25.2 19.6 21.2 20.0 22.8 23.8 29.4 30.8 32.3 28.3 25.1 23.8 19.9 22.0 Page 8 of 11 Ambient pressure [hPa] 1023 1017 1016 1017 1016 1019 1016 1016 1017 1018 1016 1015 1008 1010 1018 1011 1001 991 994 1001 1007 1007 1002 997 998 996 992 992 995 997 Rel. humidity [%] 70.8 69.6 86.2 86.4 78.1 87.2 77.4 86.5 87.9 90.5 87.0 82.3 84.6 70.7 72.5 76.5 76.1 83.8 71.7 69.7 64.9 61.9 57.0 56.3 47.1 62.0 60.4 55.5 78.7 66.3 Wind velocity [m/s] 1.8 1.6 1.0 2.8 3.4 1.9 1.1 1.8 0.6 0.8 2.2 1.2 2.6 4.6 1.6 3.8 0.3 0.4 0.2 0.7 0.3 0.6 0.4 0.3 1.0 1.1 0.9 0.3 0.2 0.3 Wind direction [°] 176 156 191 256 269 244 211 252 142 178 151 161 129 162 173 218 213 212 270 221 189 203 197 213 117 125 256 236 198 195 Precipitation [mm] 0.0 3.0 0.0 1.2 0.3 0.6 0.6 0.0 0.0 0.0 0.0 0.3 10.2 0.0 0.0 9.8 0.5 1.3 0.0 0.3 0.0 0.0 0.0 0.0 0.0 0.0 0.0 0.0 6.1 4.3 TÜV Rheinland Energie und Umwelt GmbH Luftreinhaltung Report on the suitability test of the ambient air quality measuring system Model 5030i SHARP with PM2.5 pre-separator of the company Thermo Fisher Scientific for the component suspended particulate matter PM2.5, Report-No.: 936/21209885/F Page 201 of 424 Annex 6 No. 241 242 243 244 245 246 247 248 249 250 251 252 253 254 255 256 257 258 259 260 261 262 263 264 265 266 267 268 269 270 * volatile PM-compounds, Ambient conditions at field test sites Date Test site Mean PM2,5-conc. [µg/m³] 9.3 5.9 5.4 7/31/2012 Teddington, Summer 8/1/2012 8/2/2012 8/3/2012 8/4/2012 5.1 8/5/2012 4.7 8/6/2012 3.5 8/7/2012 3.4 8/8/2012 8.1 8/9/2012 11.5 8/10/2012 13.3 8/11/2012 15.1 8/12/2012 7.2 8/13/2012 4.7 8/14/2012 7.7 8/15/2012 7.1 8/16/2012 6.6 8/17/2012 6.7 8/18/2012 6.9 8/19/2012 6.4 8/20/2012 7.4 8/21/2012 8/22/2012 8/23/2012 8/24/2012 8/25/2012 8/26/2012 8/27/2012 8/28/2012 8/29/2012 determined with parallel operated TEOM-FDMS-systems PM2,5 volatiles [µg/m³]* 2.3 2.0 1.5 1.7 2.3 2.2 0.5 1.5 2.3 2.7 4.4 5.0 3.2 2.5 3.0 2.1 2.0 2.2 2.4 2.3 2.8 3.0 2.0 2.3 2.6 1.9 1.5 2.1 2.0 1.5 Ratio volatiles / PM2,5 [%] 25.0 33.9 28.4 46.1 45.7 15.5 44.9 28.8 23.5 32.8 33.4 44.6 53.9 38.6 29.8 31.1 32.2 34.5 35.7 37.4 Mean ambient temperature [°C] 17.2 18.4 17.7 17.8 16.4 17.3 16.0 17.2 19.0 21.0 21.4 19.8 19.8 19.2 21.1 19.0 19.8 23.4 24.2 22.7 19.7 17.7 17.6 17.4 17.1 16.7 16.9 18.3 18.0 15.0 Max. ambient temperature [°C] 21.0 23.3 22.6 22.7 21.0 22.4 23.3 21.1 25.5 28.3 29.4 24.4 26.1 23.2 26.1 23.3 22.9 28.3 32.2 30.8 27.8 23.3 23.9 22.7 20.6 22.5 23.3 21.4 23.7 20.6 Page 9 of 11 Ambient pressure [hPa] 994 989 993 993 990 988 995 1003 1005 1007 1005 997 992 992 991 989 996 993 995 997 1001 998 998 992 983 987 999 992 995 993 Rel. humidity [%] 84.5 75.5 73.1 71.6 80.7 77.6 77.5 80.7 73.0 62.7 59.5 63.9 70.6 81.2 66.3 71.8 65.3 55.8 67.6 68.7 77.3 76.0 69.3 69.0 81.7 81.9 69.4 74.9 74.2 85.2 Wind velocity [m/s] 0.4 0.7 0.8 0.8 0.6 0.4 0.2 0.3 0.2 0.4 0.5 1.9 0.8 0.7 0.9 1.0 1.1 0.8 0.2 0.4 0.2 0.1 0.2 0.2 0.8 0.5 0.4 0.8 0.5 0.6 Wind direction [°] 170 185 195 180 200 210 190 201 263 202 142 78 171 184 139 187 160 180 214 208 215 207 210 190 174 243 206 195 190 184 Precipitation [mm] 0.5 0.0 0.0 2.3 1.8 2.3 0.8 0.8 0.0 0.0 0.0 0.0 0.0 1.5 0.0 0.5 0.0 0.0 0.0 0.0 0.0 0.3 0.0 0.0 2.8 27.9 0.0 0.8 0.3 4.1 740300_2013_936_21209885F_EN.docx TÜV Rheinland Energie und Umwelt GmbH Luftreinhaltung Report on the suitability test of the ambient air quality measuring system Model 5030i SHARP with PM2.5 pre-separator of the company Thermo Fisher Scientific for the component suspended particulate matter PM2.5, Report-No.: 936/21209885/F Page 202 of 424 Annex 6 No. 271 272 273 274 275 276 277 278 279 280 281 282 283 284 285 286 287 288 289 290 291 292 293 294 295 296 297 298 299 300 * volatile PM-compounds, Ambient conditions at field test sites Date Test site Mean PM2,5-conc. [µg/m³] 8/30/2012 Teddington, Summer 8/31/2012 9/1/2012 9/2/2012 9/3/2012 9/4/2012 8.8 9/5/2012 10.8 9/6/2012 11.3 9/7/2012 9/8/2012 9/9/2012 9/10/2012 9/11/2012 4.4 9/12/2012 9/13/2012 4.7 9/14/2012 5.2 9/15/2012 8.7 9/16/2012 3.4 9/17/2012 5.9 9/18/2012 6.4 9/19/2012 8.2 9/20/2012 5.7 9/21/2012 5.3 9/22/2012 7.5 9/23/2012 12.4 9/24/2012 3.2 9/25/2012 2.6 9/26/2012 5.7 9/27/2012 4.6 9/28/2012 3.4 determined with parallel operated TEOM-FDMS-systems 740300_2013_936_21209885F_EN.docx PM2,5 volatiles [µg/m³]* 0.9 1.2 1.8 2.7 3.3 3.0 1.2 2.5 2.4 2.6 1.9 2.5 1.3 1.5 2.0 1.8 2.1 1.6 2.0 1.0 1.4 1.9 2.1 1.8 6.3 2.3 1.1 0.8 1.3 1.4 Ratio volatiles / PM2,5 [%] 33.8 10.8 22.1 30.5 43.2 34.2 24.4 46.7 33.7 14.9 17.3 32.9 39.9 24.6 50.7 70.8 43.7 14.7 27.2 41.1 Mean ambient temperature [°C] 12.6 15.3 16.6 16.8 18.4 18.9 14.7 16.3 17.5 17.1 20.1 17.5 12.8 13.4 16.3 14.3 17.0 15.6 15.5 11.7 12.2 13.3 12.1 12.5 11.8 12.2 12.6 12.4 12.6 12.3 Max. ambient temperature [°C] 17.7 19.4 22.7 19.5 26.9 26.6 21.9 23.2 28.4 28.3 27.4 21.0 19.4 20.4 21.4 21.3 24.3 19.6 20.7 19.3 18.3 19.3 17.3 17.2 14.7 16.6 16.2 16.2 18.8 18.3 Page 10 of 11 Ambient pressure [hPa] 1005 1010 1006 1007 1006 1005 1010 1008 1005 998 991 991 997 998 998 997 997 994 994 1000 1004 1001 998 1000 981 971 971 980 993 997 Rel. humidity [%] 70.1 60.5 75.4 88.3 74.1 64.6 63.9 67.9 63.9 64.8 66.5 75.3 63.4 72.4 63.9 70.8 71.9 75.9 67.9 64.2 65.9 70.9 77.3 60.6 93.8 80.9 80.1 88.7 77.0 84.5 Wind velocity [m/s] 1.5 0.7 0.2 0.1 0.2 1.1 1.0 0.2 0.1 0.1 0.8 0.9 0.4 0.5 0.3 0.7 0.2 0.2 0.2 0.7 0.4 0.2 0.4 0.8 1.3 0.5 0.7 0.6 0.4 0.4 Wind direction [°] 302 289 210 238 239 295 144 198 219 208 191 192 252 267 205 257 204 207 207 278 260 203 273 89 80 190 158 222 227 193 Precipitation [mm] 0.0 0.0 0.0 0.0 0.0 0.0 0.0 0.0 0.0 0.0 0.0 0.0 0.0 2.5 0.0 0.0 0.0 0.0 0.0 0.0 0.0 0.0 1.3 0.0 30.0 10.2 4.1 2.5 0.0 1.5 TÜV Rheinland Energie und Umwelt GmbH Luftreinhaltung Report on the suitability test of the ambient air quality measuring system Model 5030i SHARP with PM2.5 pre-separator of the company Thermo Fisher Scientific for the component suspended particulate matter PM2.5, Report-No.: 936/21209885/F Annex 6 Page 203 of 424 Ambient conditions at field test sites No. Date Test site 301 302 303 304 305 306 307 308 309 310 311 312 313 9/29/2012 9/30/2012 10/1/2012 10/2/2012 10/3/2012 10/4/2012 10/5/2012 10/6/2012 10/7/2012 10/8/2012 10/9/2012 10/10/2012 10/11/2012 Teddington, Summer Mean PM2,5-conc. [µg/m³] 8.3 4.7 3.9 3.7 3.5 3.5 3.3 11.4 16.4 15.4 8.4 13.8 6.4 PM2,5 volatiles [µg/m³]* 1.7 2.2 2.0 2.5 1.5 1.8 1.6 1.6 4.4 4.7 3.1 3.3 3.4 Ratio volatiles / PM2,5 [%] 20.7 47.4 50.8 66.7 44.5 51.2 47.8 14.3 26.9 30.2 37.1 24.1 53.8 Mean ambient temperature [°C] 10.4 14.9 13.0 13.8 10.5 13.8 11.0 8.9 11.9 11.5 12.0 12.4 13.4 Max. ambient temperature [°C] 17.5 17.9 17.0 18.3 15.0 17.3 16.7 16.2 14.4 12.9 15.0 16.0 15.6 Page 11 of 11 Ambient pressure [hPa] 1003 997 993 989 988 989 992 999 1003 996 999 994 983 Rel. humidity [%] 75.1 79.1 92.0 84.5 81.8 76.1 87.0 81.2 81.3 94.6 71.6 68.2 90.0 Wind velocity [m/s] 0.4 0.7 0.2 0.7 0.2 0.5 0.4 0.3 0.2 0.5 0.7 0.7 0.5 Wind direction [°] 233 186 194 186 232 198 226 231 160 138 82 98 171 Precipitation [mm] 0.0 2.5 4.8 2.8 0.5 4.6 3.6 2.3 1.8 2.3 1.3 1.3 1.3 * volatile PM-compounds, determined with parallel operated TEOM-FDMS-systems 740300_2013_936_21209885F_EN.docx TÜV Rheinland Energie und Umwelt GmbH Luftreinhaltung Report on the suitability test of the ambient air quality measuring system Model 5030i SHARP with PM2.5 pre-separator of the company Thermo Fisher Scientific for the component suspended particulate matter PM2.5, Report-No.: 936/21209885/F Page 204 of 424 Annex 7 Measured values from additional test site Bornheim, Summer 2013, related to actual conditions Manufacturer Thermo Fisher Scientific Type of instrument Model 5030i SHARP Serial-No. SN 1 / SN 2 No. Date 1 2 3 4 5 6 7 8 9 10 11 12 13 14 15 16 17 18 19 20 21 22 23 24 25 26 27 28 29 30 6/7/2013 6/8/2013 6/9/2013 6/10/2013 6/11/2013 6/12/2013 6/13/2013 6/14/2013 6/15/2013 6/16/2013 6/17/2013 6/18/2013 6/19/2013 6/20/2013 6/21/2013 6/22/2013 6/23/2013 6/24/2013 6/25/2013 6/26/2013 6/27/2013 6/28/2013 6/29/2013 6/30/2013 7/1/2013 7/2/2013 7/3/2013 7/4/2013 7/5/2013 7/6/2013 740300_2013_936_21209885F_EN.docx Page 1 of 2 PM2,5 Measured values in µg/m³ (ACT) Ref. 1 PM2,5 [µg/m³] 17.0 Ref. 2 PM2,5 [µg/m³] 16.1 Ref. 1 PM10 [µg/m³] 28.6 Ref 2. PM10 [µg/m³] 29.9 Ratio PM2,5/PM10 [%] 56.6 14.0 16.1 13.0 7.1 5.6 5.0 5.1 7.3 12.2 17.8 31.9 8.7 4.2 3.3 3.1 8.7 6.3 9.1 9.8 8.8 6.0 7.4 7.7 7.9 3.6 7.5 12.9 13.3 13.6 15.4 12.2 6.4 5.4 5.7 5.3 7.6 13.3 17.3 32.7 10.1 4.5 4.1 3.0 8.0 6.6 9.4 9.6 8.7 5.8 6.9 7.6 7.9 3.8 7.9 13.1 13.1 20.1 26.1 20.8 14.6 13.4 10.8 10.6 16.7 21.3 28.6 48.7 15.5 7.2 5.7 4.6 13.9 12.9 14.6 14.2 14.2 11.7 14.6 13.4 12.5 9.0 13.5 20.9 18.7 21.3 27.1 20.7 14.0 12.7 10.8 10.2 16.6 20.9 29.1 48.5 14.9 6.8 5.9 5.5 13.2 12.7 14.5 13.8 14.7 11.5 14.4 13.2 12.0 9.9 13.6 19.9 18.5 66.9 59.1 60.7 47.4 42.1 49.3 50.0 44.8 60.3 60.9 66.5 62.1 62.2 63.8 59.8 61.8 50.4 63.5 69.2 60.4 50.9 49.4 57.7 64.6 39.1 56.9 63.8 71.1 SN 1 PM2,5 [µg/m³] SN 2 PM2,5 [µg/m³] Remark Test site Bornheim 17.0 5.6 5.7 7.2 6.3 9.8 14.1 21.4 31.7 9.6 4.3 3.3 3.9 12.7 6.5 12.7 10.6 9.4 5.8 7.9 9.3 8.5 4.7 9.3 15.1 14.5 14.1 5.0 4.1 5.9 5.9 9.4 13.0 20.3 26.8 8.5 3.7 3.8 3.6 10.6 5.8 9.6 8.1 7.3 4.8 6.0 7.8 11.7 4.4 10.5 15.2 12.9 TÜV Rheinland Energie und Umwelt GmbH Luftreinhaltung Report on the suitability test of the ambient air quality measuring system Model 5030i SHARP with PM2.5 pre-separator of the company Thermo Fisher Scientific for the component suspended particulate matter PM2.5, Report-No.: 936/21209885/F Annex 7 Page 205 of 424 Measured values from additional test site Bornheim, Summer 2013, related to actual conditions Manufacturer Thermo Fisher Scientific Type of instrument Model 5030i SHARP Serial-No. SN 1 / SN 2 No. Date 31 32 33 34 35 36 37 38 39 40 41 42 43 44 45 46 47 48 49 7/7/2013 7/8/2013 7/9/2013 7/10/2013 7/11/2013 7/12/2013 7/13/2013 7/14/2013 7/15/2013 7/16/2013 7/17/2013 7/18/2013 7/19/2013 7/20/2013 7/21/2013 7/22/2013 7/23/2013 7/24/2013 7/25/2013 Page 2 of 2 PM2,5 Measured values in µg/m³ (ACT) Ref. 1 PM2,5 [µg/m³] 11.3 11.3 14.2 9.7 13.6 16.5 15.3 14.5 17.4 20.4 13.6 Ref. 2 PM2,5 [µg/m³] 10.7 10.6 14.5 10.2 14.3 16.8 15.3 14.5 17.4 18.4 13.2 9.0 10.1 12.9 15.5 14.1 20.3 11.1 7.3 9.5 12.3 14.8 13.6 20.0 12.1 Ref. 1 PM10 [µg/m³] 14.9 16.3 24.9 19.1 26.6 Ref 2. PM10 [µg/m³] 14.4 16.1 22.6 17.5 24.9 Ratio PM2,5/PM10 [%] 75.1 67.6 60.4 54.4 54.2 20.4 22.2 26.2 30.2 18.7 17.0 16.3 17.3 18.0 23.2 25.4 31.5 21.3 20.7 21.5 25.6 28.9 18.0 17.3 14.8 16.0 17.7 22.0 24.5 30.3 20.3 74.5 66.5 67.1 65.5 72.9 52.7 58.7 70.7 67.2 55.3 65.2 55.7 SN 1 PM2,5 [µg/m³] 13.3 13.2 18.0 13.6 20.1 23.4 18.2 20.0 19.9 24.1 16.6 13.3 11.6 14.8 13.9 17.6 16.9 20.5 12.1 SN 2 PM2,5 [µg/m³] 12.0 11.2 14.5 11.7 16.3 17.7 15.7 16.1 18.2 22.8 14.7 11.6 9.2 12.4 12.9 17.5 15.2 17.9 11.3 Remark Test site Bornheim Outlier Reference PM10 Outlier reference PM2,5 740300_2013_936_21209885F_EN.docx TÜV Rheinland Energie und Umwelt GmbH Luftreinhaltung Report on the suitability test of the ambient air quality measuring system Model 5030i SHARP with PM2.5 pre-separator of the company Thermo Fisher Scientific for the component suspended particulate matter PM2.5, Report-No.: 936/21209885/F Page 206 of 424 Annex 8 No. Ambient conditions at the additional test site Bornheim, Summer 2013 Date Test site Mean PM2,5-conc. [µg/m³] 16.6 1 6/7/2013 Bornheim 2 6/8/2013 3 6/9/2013 4 6/10/2013 5 6/11/2013 6 6/12/2013 7 6/13/2013 8 6/14/2013 9 6/15/2013 10 6/16/2013 11 6/17/2013 12 6/18/2013 13 6/19/2013 14 6/20/2013 15 6/21/2013 16 6/22/2013 17 6/23/2013 18 6/24/2013 19 6/25/2013 20 6/26/2013 21 6/27/2013 22 6/28/2013 23 6/29/2013 24 6/30/2013 25 7/1/2013 26 7/2/2013 27 7/3/2013 28 7/4/2013 29 7/5/2013 30 7/6/2013 * volatile PM-compounds, determined with parallel operated TEOM-FDMS-system 740300_2013_936_21209885F_EN.docx 13.8 15.7 12.6 6.8 5.5 5.3 5.2 7.5 12.7 17.6 32.3 9.4 4.3 3.7 3.0 8.4 6.5 9.3 9.7 8.8 5.9 7.2 7.7 7.9 3.7 7.7 13.0 13.2 PM2,5 volatiles [µg/m³]* Ratio volatiles / PM2,5 [%] 3.2 1.3 0.3 1.1 0.4 0.6 1.7 2.3 4.6 3.0 1.1 1.3 0.4 1.0 0.9 1.9 2.1 2.1 0.7 1.3 1.4 1.6 0.7 0.4 1.3 2.0 25.4 19.5 4.7 21.4 6.9 8.6 13.3 13.0 14.3 32.3 24.6 35.0 13.6 12.2 14.6 20.8 21.1 24.3 12.4 18.3 17.9 20.5 19.0 5.3 10.4 15.4 Mean ambient temperature Max. ambient temperature [°C] [°C] 21.7 29.1 21.1 26.8 15.6 19.2 14.4 18.1 18.8 23.8 21.1 23.7 17.0 27.6 16.1 21.2 17.2 22.6 17.7 23.7 23.3 29.7 27.2 34.8 26.9 35.0 20.5 25.1 19.0 23.4 19.0 23.7 16.2 19.2 14.2 17.4 13.4 16.8 13.9 16.7 13.2 17.1 14.1 16.7 14.8 18.8 17.7 22.4 18.8 25.4 21.6 27.1 17.5 20.1 20.0 24.7 19.8 24.8 22.4 29.3 Page 1 of 2 Ambient pressure [hPa] 1010 1005 1001 1005 1008 1008 1007 1009 1005 1007 1004 1005 1003 1003 1005 1004 1005 1013 1018 1018 1014 1010 1012 1012 1008 1003 1004 1014 1020 1020 Rel. humidity [%] 55.5 62.3 78.7 75.9 61.5 67.1 77.9 65.4 63.1 63.9 64.7 61.3 67.8 78.5 69.8 67.8 69.9 76.9 71.1 70.9 78.5 86.1 73.9 66.4 74.9 62.7 85.6 71.1 74.4 65.4 Wind velocity [m/s] 1.0 2.1 1.8 1.2 0.6 1.0 1.3 0.6 1.4 0.7 0.9 0.4 1.9 1.0 1.6 1.8 1.6 1.8 1.8 1.1 0.7 0.3 2.6 0.6 0.7 0.6 0.2 0.9 0.3 1.0 Wind direction [°] 211 243 273 253 198 181 209 181 209 226 185 178 244 187 196 198 216 255 259 250 230 174 269 198 215 183 213 232 222 191 Precipitation [mm] 0.0 0.0 4.5 0.6 0.0 0.0 22.5 0.0 0.0 0.0 0.0 0.0 0.0 34.6 0.3 1.5 0.9 1.5 0.3 9.8 3.9 16.4 1.8 0.0 21.0 0.3 16.0 0.0 0.0 0.0 TÜV Rheinland Energie und Umwelt GmbH Luftreinhaltung Report on the suitability test of the ambient air quality measuring system Model 5030i SHARP with PM2.5 pre-separator of the company Thermo Fisher Scientific for the component suspended particulate matter PM2.5, Report-No.: 936/21209885/F Annex 8 Page 207 of 424 Ambient conditions at the additional test site Bornheim, Summer 2013 No. Date Test site 31 32 33 34 35 36 37 38 39 40 41 42 43 44 45 46 47 48 49 7/7/2013 7/8/2013 7/9/2013 7/10/2013 7/11/2013 7/12/2013 7/13/2013 7/14/2013 7/15/2013 7/16/2013 7/17/2013 7/18/2013 7/19/2013 7/20/2013 7/21/2013 7/22/2013 7/23/2013 7/24/2013 7/25/2013 Bornheim Mean PM2,5-conc. [µg/m³] 11.0 11.0 14.4 10.0 14.0 16.7 15.3 14.5 17.4 19.4 13.4 8.2 9.8 12.6 15.2 13.8 20.1 11.6 PM2,5 volatiles [µg/m³]* 1.1 1.4 2.7 1.8 1.4 3.4 2.8 3.7 2.0 2.7 2.0 2.0 1.7 1.7 1.8 2.2 1.8 5.0 4.5 Ratio volatiles / PM2,5 [%] 10.0 12.9 19.2 18.1 10.0 20.4 18.5 25.5 11.3 14.2 14.8 21.3 17.5 14.6 14.4 12.8 24.9 38.4 Mean ambient temperature Max. ambient temperature [°C] [°C] 23.1 29.7 23.0 29.8 23.4 29.9 19.5 24.2 15.7 19.7 16.5 21.9 17.7 22.9 18.9 24.2 21.3 27.8 22.5 29.2 23.2 29.3 24.5 31.6 23.5 29.1 21.1 26.6 25.3 32.3 27.6 35.1 25.5 33.7 21.7 27.6 22.5 28.1 Page 2 of 2 Ambient pressure [hPa] 1020 1019 1014 1012 1013 1013 1014 1014 1013 1013 1014 1014 1013 1011 1009 1006 1004 1006 1006 Rel. humidity [%] 58.8 59.6 59.4 62.6 70.1 70.8 68.3 69.1 62.9 58.8 59.0 56.8 58.3 68.5 57.4 52.2 62.0 78.7 81.7 Wind velocity [m/s] 1.2 1.4 1.4 3.5 1.7 1.2 1.1 1.7 0.8 0.8 1.2 1.7 2.3 1.3 1.1 0.9 0.6 0.7 0.7 Wind direction [°] 218 214 237 261 215 250 241 249 188 184 218 224 241 226 155 167 159 213 145 Precipitation [mm] 0.0 0.0 0.0 0.0 0.0 0.0 0.0 0.0 0.0 0.0 0.0 0.0 0.0 0.0 0.0 0.0 0.0 3.6 15.1 * volatile PM-compounds, determined with parallel operated TEOM-FDMS-system 740300_2013_936_21209885F_EN.docx TÜV Rheinland Energie und Umwelt GmbH Luftreinhaltung Page 208 of 424 Report on the suitability test of the ambient air quality measuring system Model 5030i SHARP with PM2.5 pre-separator of the company Thermo Fisher Scientific for the component suspended particulate matter PM2.5, Report-No.: 936/21209885/F Appendix 2 Filter weighing procedure A) German test sites (Cologne and Bornheim) A.1 Carrying out the weighing All weightings are done in an air-conditioned weighing room. Ambient conditions are 20 °C ±1 °C and 50 % ±5 % relative humidity, which conforms to the requirements of Standard EN 14907. The filters used in the field test are weighed manually. In order to condition the filters (including control filters), they are placed on sieves to avoid overlap. The specifications for pre- and post-weighing are specified beforehand and conform to the Standard. Before sampling = pre-weighing Conditioning 48 h + 2 h Filter weighing Re-conditioning 24 h +2 h Filter weighing and immediate packaging After sampling = post-weighing Conditioning 48 h + 2 h Filter weighing Re-conditioning 24 h + 2 h Filter weighing The balance is always ready for use. An internal calibration process is started prior to each weighing series. The standard weight of 200 mg is weighed as reference and the boundary conditions are noted down if nothing out of the ordinary results from the calibration process. Deviations of prior weighings conform to the Standard and do not exceed 20 µg (refer to Figure 61). All six control filters are weighed afterwards and a warning is displayed for control filters with deviations > 40 µg during evaluation. These control filters are not used for postweighing. Instead, the first three acceptable control filters are used while the others remain in the protective jar in order to replace a defective or deviating filter, if necessary. Figure 62 shows an exemplary process over a period of more than four months. All filters which display a difference of more than 40 µg between the first and second weighing are excluded from the pre-weighing process. Filters exhibiting deviations of more than 60 µg are not considered for evaluation after post-weighing, as conforming to standards. 740300_2013_936_21209885F_EN.docx TÜV Rheinland Energie und Umwelt GmbH Luftreinhaltung Report on the suitability test of the ambient air quality measuring system Model 5030i SHARP with PM2.5 pre-separator of the company Thermo Fisher Scientific for the component suspended particulate matter PM2.5, Report-No.: 936/21209885/F Page 209 of 424 Weighed filters are packed in separate polystyrene jars for transport and storage. These jars remain closed until the filter is placed in. Virgin filters can be stored in the weighing room for up to 28 days before sampling. Another pre-weighing is carried out if this period is exceeded. Sampled filters can be stored for not more than 15 days at a temperature of 23 °C or less. The filters are stored at 7 °C in a refrigerator. 740300_2013_936_21209885F_EN.docx TÜV Rheinland Energie und Umwelt GmbH Luftreinhaltung Report on the suitability test of the ambient air quality measuring system Model 5030i SHARP with PM2.5 pre-separator of the company Thermo Fisher Scientific for the component suspended particulate matter PM2.5, Report-No.: 936/21209885/F Page 210 of 424 A2 Filter evaluation The filters are evaluated with the help of a corrective term in order to minimise relative mass changes caused by the weighing room conditions. Equation: Dust = MFpost – ( MTara x ( MKonpost / MKonpre ) ) (F1) MKonpre = average mass of the 3 control filters after 48 h and 72 h pre-weighing MKonpost = average mass of the 3 control filters after 48 h and 72 h post-weighing MTara = average mass of the filter after 48 h and 72 h pre-weighing MFpost = average mass of the loaded filter after 48 h and 72 h post-weighing Dust = corrected dust mass of the filter This shows that the method becomes independent from weighing room conditions due to the corrective calculation. Influence due to the water content of the filter mass between virgin and loaded filter can be controlled and do not change the dust content of sampled filters. Hence, point 9.3.2.5 of EN 14907 is fulfilled. The example of the standard weight between November 2008 and February 2009 shows that the permissible difference of max. 20 µg from the previous measurement is not exceeded. Stability of standard weight between Nov 08 and Feb 09 0.20010 Weight [g] 0.20005 Standard weight 0.20000 Mean standard weight 0.19995 0.19990 0 5 10 15 No. of weighing Figure 61: Stability of standard weight 740300_2013_936_21209885F_EN.docx 20 25 TÜV Rheinland Energie und Umwelt GmbH Luftreinhaltung Report on the suitability test of the ambient air quality measuring system Model 5030i SHARP with PM2.5 pre-separator of the company Thermo Fisher Scientific for the component suspended particulate matter PM2.5, Report-No.: 936/21209885/F Table 39: Page 211 of 424 Stability of standard weight Date Weighing No. 12.11.2008 13.11.2008 10.12.2008 11.12.2008 17.12.2008 18.12.2008 07.01.2009 08.01.2009 14.01.2009 15.01.2009 21.01.2009 22.01.2009 29.01.2009 30.01.2009 04.02.2008 05.02.2009 11.02.2009 12.02.2009 18.02.2009 19.02.2009 26.02.2009 27.02.2009 1 2 3 4 5 6 7 8 9 10 11 12 13 14 15 16 17 18 19 20 21 22 Standard weight g 0.20002 0.20001 0.20002 0.20002 0.20003 0.20002 0.20001 0.20001 0.20000 0.20001 0.20001 0.20001 0.20001 0.20000 0.20001 0.20001 0.20001 0.20000 0.20000 0.20000 0.20000 0.19999 Difference to the previous weighing µg -10 10 0 10 -10 -10 0 -10 10 0 0 0 -10 10 0 0 -10 0 0 0 -10 Marked in yellow = average value Marked in green = lowest value Marked in blue = highest value 740300_2013_936_21209885F_EN.docx TÜV Rheinland Energie und Umwelt GmbH Luftreinhaltung Report on the suitability test of the ambient air quality measuring system Model 5030i SHARP with PM2.5 pre-separator of the company Thermo Fisher Scientific for the component suspended particulate matter PM2.5, Report-No.: 936/21209885/F Page 212 of 424 Stability control filter Emfab 0.09280 Weight [g] 0.09260 0.09240 TM1 0.09220 TM2 0.09200 TM3 0.09180 Mean TM1 0.09160 Mean TM2 0.09140 Mean TM3 0.09120 0.09100 0 5 10 15 No. of weighing Figure 62: Stability of the control filters 740300_2013_936_21209885F_EN.docx 20 25 TÜV Rheinland Energie und Umwelt GmbH Luftreinhaltung Report on the suitability test of the ambient air quality measuring system Model 5030i SHARP with PM2.5 pre-separator of the company Thermo Fisher Scientific for the component suspended particulate matter PM2.5, Report-No.: 936/21209885/F Table 40: Page 213 of 424 Stability of the control filters Weighing No. 1 2 3 4 5 6 7 8 9 10 11 12 13 14 15 16 17 18 19 20 21 22 TM1 0.09257 0.09258 0.09260 0.09260 0.09262 0.09264 0.09262 0.09260 0.09262 0.09263 0.09263 0.09263 0.09267 0.09265 0.09266 0.09269 0.09268 0.09267 0.09266 0.09268 0.09264 0.09264 Control filter No. TM2 0.09155 0.09155 0.09155 0.09157 0.09156 0.09157 0.09154 0.09156 0.09156 0.09160 0.09158 0.09158 0.09160 0.09157 0.09159 0.09162 0.09162 0.09161 0.09161 0.09160 0.09161 0.09159 TM3 0.09110 0.09113 0.09115 0.09116 0.09117 0.09116 0.09114 0.09116 0.09113 0.09117 0.09118 0.09117 0.09118 0.09116 0.09119 0.09122 0.09121 0.09121 0.09118 0.09120 0.09117 0.09116 Average 0.09264 0.09158 0.09117 Standard deviation 3.2911E-05 2.4937E-05 2.8558E-05 rel. standard deviation 0.036 0.027 0.031 Median lowest value highest value 0.09264 0.09257 0.09269 0.09158 0.09154 0.09162 0.09117 0.09110 0.09122 Marked in yellow = average value Marked in green = lowest value Marked in blue = highest value 740300_2013_936_21209885F_EN.docx TÜV Rheinland Energie und Umwelt GmbH Luftreinhaltung Report on the suitability test of the ambient air quality measuring system Model 5030i SHARP with PM2.5 pre-separator of the company Thermo Fisher Scientific for the component suspended particulate matter PM2.5, Report-No.: 936/21209885/F Page 214 of 424 B) UK test site (Teddington) B.1 Implementation of Weighing Protocols NPL (National Physical Laboratory) were subcontracted to weigh filters manually for the field study. In line with EN14907 filters were kept in the weighing room for less than 28 days; the glove box used for weighing was maintained at (20 ± 1) °C and (50 ± 5) %; and filters were weighed twice before and after sampling. Table 41 summarises the conditioning and weighing timescales utilised: Table 41: Conditioning and weighing timescales Pre Sampling Post Sampling Condition minimum of 48 hours Weigh Filters Condition 24 hours Weigh Filters Condition 48 hours Weigh Filters Condition 24 hours Weigh Filters At the start of each weighing session the balance was exercised to remove mechanical stiffness, and then calibrated. At the start and end of each batch of filters, a 50 and 200 mg check weight were weighed. In line with the recommendations of the UK PM Equivalence Report [8], filters were weighed relative to a 100 mg check weight, and not a tare filter, as the latter was shown to lose mass over time. Four filters were weighed between check weights, as the balance drift over time had been shown to be small. 740300_2013_936_21209885F_EN.docx TÜV Rheinland Energie und Umwelt GmbH Luftreinhaltung Report on the suitability test of the ambient air quality measuring system Model 5030i SHARP with PM2.5 pre-separator of the company Thermo Fisher Scientific for the component suspended particulate matter PM2.5, Report-No.: 936/21209885/F Page 215 of 424 The Check weight Mass (CM) of the filter was calculated for each weighing session using E A.1 below: CM = (m check , Beg + mcheck , End ) E A.1 2 Where: Mcheck,bef = Mass of check weight weighed immediately prior to sample filter. Mcheck,aft = Mass of check weight weighed immediately after sample filter. The Relative Mass (RM) of the filter was calculated for each weighing session using E A.2 below: RM = m filter − CM E A.2 Where: mfilter = Mass of sample filter Particulate Mass (PM) is calculated using the following equation in accordance with EN14907. RM End 1 + RM End 2 RM Beg1 + RM Beg 2 PM = − 2 2 E A.3 Where: Beg1 denotes weighing session 1 prior to sampling Beg2 denotes weighing session 2 prior to sampling End1 denotes weighing session 1 after sampling End2 denotes weighing session 2 after sampling 740300_2013_936_21209885F_EN.docx TÜV Rheinland Energie und Umwelt GmbH Luftreinhaltung Page 216 of 424 Report on the suitability test of the ambient air quality measuring system Model 5030i SHARP with PM2.5 pre-separator of the company Thermo Fisher Scientific for the component suspended particulate matter PM2.5, Report-No.: 936/21209885/F Pre Spread (SPre), Post Spread (SPost) and Blank Spread (SBlank) were calculated using the following equations: S Pr e = RM Anf 1 − RM Anf 2 E A.4 S Post = RM End 1 − RM End 2 E A.5 CM End 2 + CM End 1 CM Anf 2 + CM Anf 1 S Blank = − 2 2 E A.6 As with the UK PM Equivalence Report [8], it was not possible to weigh all filters within the 15 day timeframe suggested in EN14907. However, as filters were removed immediately from the reference samplers and placed in the refrigerator, it was not necessary to determine if TAmbient exceeded 23 ºC. It is felt that as 15 days was impractical for a relatively small scale field study, it is less likely to be attainable if this methodology were adopted by a National or Regional network, and as such, the methodology employed herein is representative of how the reference samplers would be operated in practice. A.2 Analysis of Protocols Employed 740300_2013_936_21209885F_EN.docx TÜV Rheinland Energie und Umwelt GmbH Luftreinhaltung Report on the suitability test of the ambient air quality measuring system Model 5030i SHARP with PM2.5 pre-separator of the company Thermo Fisher Scientific for the component suspended particulate matter PM2.5, Report-No.: 936/21209885/F Page 217 of 424 The distributions of pre and post weight for all EMFAB filters weighed relative to the tare filter and check weight are shown in Figure 63. If filters lose relative mass between weightings, then the distribution will be shifted to the right, whereas if there is a gain in the relative mass the distribution will shift to the left. EN14907 states that unsampled filters should be rejected if the difference between the masses of the two pre weightings is greater than 40 µg. Similarly, EN14907 states that sampled filters should be rejected if the difference between the masses of the two post weight- 740300_2013_936_21209885F_EN.docx TÜV Rheinland Energie und Umwelt GmbH Luftreinhaltung Page 218 of 424 Report on the suitability test of the ambient air quality measuring system Model 5030i SHARP with PM2.5 pre-separator of the company Thermo Fisher Scientific for the component suspended particulate matter PM2.5, Report-No.: 936/21209885/F ings is greater than 60 µg. Filters were not rejected based on these criteria. The observed distributions of repeat mass measurements are considered unlikely to have had a significant effect on the results. 740300_2013_936_21209885F_EN.docx TÜV Rheinland Energie und Umwelt GmbH Luftreinhaltung Report on the suitability test of the ambient air quality measuring system Model 5030i SHARP with PM2.5 pre-separator of the company Thermo Fisher Scientific for the component suspended particulate matter PM2.5, Report-No.: 936/21209885/F Figure 63: Page 219 of 424 Distribution for Emfab filters of (A) Pre spread weighed relative to the check weight and (B) Post spread weighed relative to the check weight. 740300_2013_936_21209885F_EN.docx TÜV Rheinland Energie und Umwelt GmbH Luftreinhaltung Page 220 of 424 Report on the suitability test of the ambient air quality measuring system Model 5030i SHARP with PM2.5 pre-separator of the company Thermo Fisher Scientific for the component suspended particulate matter PM2.5, Report-No.: 936/21209885/F Appendix 3 Manuals 740300_2013_936_21209885F_EN.docx Model 5030i SHARP Instruction Manual Synchronized Hybrid Ambient Real-time Particulate Monitor Part Number 108148-00 25Mar2014 © 2011 Thermo Fisher Scientific Inc. All rights reserved. Specifications, terms and pricing are subject to change. Not all products are available in all countries. Please consult your local sales representative for details. Thermo Fisher Scientific Air Quality Instruments 27 Forge Parkway Franklin, MA 02038 1-508-520-0430 www.thermo.com/aqi WEEE Compliance This product is required to comply with the European Union’s Waste Electrical & Electronic Equipment (WEEE) Directive 2002/96/EC. It is marked with the following symbol: Thermo Fisher Scientific has contracted with one or more recycling/disposal companies in each EU Member State, and this product should be disposed of or recycled through them. Further information on Thermo Fisher Scientific’s compliance with these Directives, the recyclers in your country, and information on Thermo Fisher Scientific products which may assist the detection of substances subject to the RoHS Directive are available at: www.thermo.com/WEEERoHS. Thermo Fisher Scientific WEEE Compliance About This Manual This manual provides information about installing, operating, maintaining, and servicing the Model 5030i Synchronized Hybrid Ambient Real-time Particulate (SHARP) Monitor. It also contains important alerts to ensure safe operation and prevent equipment damage. The manual is organized into the following chapters and appendices to provide direct access to specific operation and service information. Thermo Fisher Scientific ● Chapter 1 “Introduction” provides an overview of product features, describes the principle of operation, and lists the specifications. ● Chapter 2 “Installation” describes how to unpack, setup, and startup the instrument. ● Chapter 3 “Operation” describes the front panel display screens, the front panel pushbuttons, and the menu-driven firmware. ● Chapter 4 “Calibration” provides the procedures for calibrating the analyzer and describes the required equipment. ● Chapter 5 “Preventive Maintenance” provides maintenance procedures to ensure reliable and consistent instrument operation. ● Chapter 6 “Troubleshooting” presents guidelines for diagnosing analyzer failures, isolating faults, and includes recommended actions for restoring proper operation. ● Chapter 7 “Servicing” presents safety alerts for technicians working on the analyzer, step-by-step instructions for repairing and replacing components, and a replacement parts list. It also includes contact information for product support and technical information. ● Chapter 8 “System Description” describes the function and location of the system components, provides an overview of the firmware structure, and includes a description of the system electronics and input/output connections. ● Chapter 9 “Optional Equipment” describes the optional equipment that can be used with this analyzer. ● Chapter 10 “Model 5014i to 5030i Upgrade Procedures” describes the 5014i to 5030i upgrade procedures. ● Appendix A “Warranty” is a copy of the warranty statement. Model 5030i SHARP Instruction Manual i About This Manual Safety ● Appendix B “C-Link Protocol Commands” provides a description of the C-Link protocol commands that can be used to remotely control an analyzer using a host device such as a PC or datalogger. ● Appendix C “MODBUS Protocol” provides a description of the MODBUS Protocol Interface and is supported both over RS232/485 (RTU protocol) as well as TCP/IP over Ethernet. ● Appendix D “Gesytec (Bayern-Hessen) Protocol” provides a description of the Gesytec (Bayern-Hessen or BH) Protocol Interface and is supported both over RS-232/485 as well as TCP/IP over Ethernet. ● Appendix E “ESM Protocol Commands” provides a description of the ESM Protocol commands (from the prior 5030 platform) that can be used to remotely control an analyzer using a host device such as a PC or datalogger. Safety Review the following safety information carefully before using the analyzer. This manual provides specific information on how to operate the analyzer, however, if the analyzer is used in a manner not specified by the manufacturer, the protection provided by the equipment may be impaired. Safety and Equipment Damage Alerts This manual contains important information to alert you to potential safety hazards and risks of equipment damage. Refer to the following types of alerts you may see in this manual. Safety and Equipment Damage Alert Descriptions Alert Description DANGER A hazard is present that could result in death or serious personal injury if the warning is ignored. ▲ WARNING A hazard or unsafe practice could result in serious personal injury if the warning is ignored. ▲ CAUTION A hazard or unsafe practice could result in minor to moderate personal injury if the warning is ignored. ▲ Equipment Damage A hazard or unsafe practice could result in property damage if the warning is ignored. ▲ Safety and Equipment Damage Alerts in this Manual Alert Description WARNING ii Model 5030i SHARP Instruction Manual The Model 5030i is supplied with a three-wire grounded power cord. Under no circumstances should this grounding system be defeated. ▲ Thermo Fisher Scientific About This Manual Safety and Equipment Damage Alerts Alert Description If the equipment is operated in a manner not specified by the manufacturer, the protection provided by the equipment may be impaired. ▲ The service procedures in this manual are restricted to qualified service personnel only. ▲ The detector assembly should be replaced by a qualified technician knowledgeable in dealing with radiation precautions. By removing the detector assembly, the C-14 radioactive source is partially exposed. Safety glasses must be worn during this replacement procedure. The amount of C-14 meets the USNRC regulations as an exempt amount of radioactive source <100 μCi. ▲ The detector pre-amp assembly has a power backup built in. “DO NOT OPEN” caution handeling. Backup power will dissipate after 8 hours. ▲ CAUTION The detector window is very fragile. Handle with great care and do not wipe or touch the window. Furthermore, do not touch the solder cable connection (electrode) with your bare fingers. The oils from your skin can damage the detector. ▲ Safety glasses must be worn while replacing the detector assembly. ▲ If the LCD panel breaks, do not let the liquid crystal contact your skin or clothes. If the liquid crystal contacts your skin or clothes, wash it off immediately using soap and water. ▲ Equipment Damage Do not attempt to lift the analyzer by the cover or other external fittings. ▲ Some internal components can be damaged by small amounts of static electricity. A properly grounded antistatic wrist strap must be worn while handling any internal component. ▲ Disconnect the serial cable before changing the RS-232 and RS-485 selection to prevent damage to any equipment currently connected to the analyzer. ▲ Do not use solvents or other cleaning products to clean the outside case. ▲ Do not remove the LCD panel or frame from the LCD module. ▲ The LCD polarizing plate is very fragile, handle it carefully. ▲ Do not wipe the LCD polarizing plate with a dry cloth, as it may easily scratch the plate. ▲ Do not use alcohol, acetone, MEK or other ketone based or aromatic solvent to clean the LCD module, but rather Thermo Fisher Scientific Model 5030i SHARP Instruction Manual iii About This Manual Electrical/Safety Certifications Alert Description use a soft cloth moistened with a naphtha cleaning solvent. ▲ Do not place the LCD module near organic solvents or corrosive gases. ▲ Do not shake or jolt the LCD module. ▲ Electrical/Safety Certifications The product has been tested and has been documented to be in compliance with the following U.S. and Canadian safety standards: UL Standard 61010-1:2004 2nd Edition CAN/CSA C22.2 No. 1010-1:2004 2nd Edition IEC 61326-2-3: 2006 Thermo Fisher Scientific certifies that this product operates in compliance with the EC Directive 89/336/EEC in reference to electrical emissions and immunity. Specifically, the equipment meets the requirements of EN 61326-1:1998 for Immunity and Emissions. In addition, the hardware has been tested for personal or fire safety hazards in accordance with EN610101:2001 (Safety) in fulfillment of EC Directive 73/23/EEC. FCC Compliance Changes or modifications to this unit not expressly approved by the party responsible for compliance could void the user’s authority to operate the equipment. Note This equipment has been tested and found to comply within the limits for a Class A digital device, pursuant to Part 15 of the FCC Rules. These limits are designed to provide reasonable protection against harmful interference when the equipment is operated in a commercial environment. This equipment generates, uses, and can radiate radio frequency energy and, if not installed and used in accordance with the instruction manual, may cause harmful interference to radio communications. Operation of this equipment in a residential area is likely to cause harmful interference, in which case the user will be required to correct the interference at his or her own expense. ▲ iv Model 5030i SHARP Instruction Manual Thermo Fisher Scientific About This Manual WEEE Symbol WEEE Symbol The following symbol and description identify the WEEE marking used on the instrument and in the associated documentation. Symbol Description Marking of electrical and electronic equipment which applies to waste electrical and electronic equipment falling under the Directive 2002/96/EC (WEEE) and the equipment that has been put on the market after 13 August 2005. ▲ Where to Get Help Service is available from exclusive distributors worldwide. Contact one of the phone numbers below for product support and technical information or visit us on the web at www.thermo.com/aqi. 1-866-282-0430 Toll Free 1-508-520-0430 International Thermo Fisher Scientific Model 5030i SHARP Instruction Manual v About This Manual Where to Get Help vi Model 5030i SHARP Instruction Manual Thermo Fisher Scientific Contents Thermo Fisher Scientific Chapter 1 Introduction ........................................................................................................ 1-1 Principle of Operation ........................................................................ 1-3 Specifications ...................................................................................... 1-8 Chapter 2 Installation ......................................................................................................... 2-1 Packaging and Transport..................................................................... 2-1 Lifting ................................................................................................. 2-2 Unpacking and Inspection .................................................................. 2-2 Acceptance Testing and Startup Procedures ........................................ 2-3 Acceptance Test ............................................................................... 2-4 One-Point Temperature Verification ............................................... 2-7 One-Point RH Sensor Verification................................................... 2-7 One-Point Barometric Pressure Verification ..................................... 2-8 One-Point Volumetric Flow Rate Verification ................................. 2-8 Leak Check Procedure...................................................................... 2-9 Nephelometer Source Verification.................................................... 2-9 Nephelometer Zero Check ............................................................... 2-9 Setup ................................................................................................. 2-10 Inlet System ................................................................................... 2-10 Heater ............................................................................................ 2-11 Sample Tube Extension Lengths .................................................... 2-13 Rack Mounting Option ................................................................. 2-13 Monitor Installation ....................................................................... 2-13 Connecting External Devices ............................................................ 2-17 Terminal Board PCB Assemblies .................................................... 2-17 I/O Terminal Board .................................................................... 2-17 D/O Terminal Board .................................................................. 2-19 25-Pin Terminal Board ............................................................... 2-20 Power Connections ........................................................................ 2-22 Startup .............................................................................................. 2-22 Data Content .................................................................................... 2-23 Shutdown ......................................................................................... 2-23 Important Tips.................................................................................. 2-23 Chapter 3 Operation ............................................................................................................ 3-1 Display ................................................................................................ 3-1 Pushbuttons ........................................................................................ 3-2 Soft Keys .......................................................................................... 3-3 Alphanumeric Entry Screen.............................................................. 3-4 Model 5030i SHARP Instruction Manual vii Contents Firmware Overview ............................................................................. 3-4 Power-Up Screen ............................................................................. 3-6 Run Screens ..................................................................................... 3-6 Ambient Conditions Run Screen................................................... 3-7 Sample Conditions Run Screen ..................................................... 3-8 Mass Sensor Data Run Screen ....................................................... 3-8 Hybrid Data Run Screen ............................................................... 3-9 Main Menu ...................................................................................... 3-9 Range Menu ..................................................................................... 3-10 Concentration Units ...................................................................... 3-10 SHARP Range ............................................................................... 3-11 Set Custom Ranges ........................................................................ 3-12 Custom Ranges ........................................................................... 3-13 Integration Time ............................................................................... 3-13 24-Hour Average............................................................................... 3-14 24-Hour Average Start Time .......................................................... 3-14 Calibration Factors Menu ................................................................. 3-14 PM Background ............................................................................. 3-15 PM Coefficient .............................................................................. 3-15 SHARP Background ...................................................................... 3-16 SHARP Coefficient ........................................................................ 3-16 Nephelometer Background Values ................................................. 3-16 Nephelometer Mode ................................................................... 3-17 Values ......................................................................................... 3-17 Restore Previous Values............................................................... 3-17 Nephelometer Coefficient .............................................................. 3-18 Instrument Controls Menu ............................................................... 3-18 Set Flow/Pump .............................................................................. 3-19 Flow ............................................................................................ 3-19 Pump .......................................................................................... 3-19 Set Heater ...................................................................................... 3-20 Control ....................................................................................... 3-20 RH Threshold ............................................................................. 3-20 Temperature Threshold .............................................................. 3-21 Filter Tape Control ........................................................................ 3-21 Manual ....................................................................................... 3-21 Mass Limit .................................................................................. 3-22 Next Time .................................................................................. 3-22 Period ......................................................................................... 3-22 Counter ...................................................................................... 3-23 Tape/Zero Ratio.......................................................................... 3-23 Volumetric Conditions ..................................................................... 3-24 Temperature Compensation........................................................ 3-24 Standard Temperature ................................................................ 3-24 Pressure Compensation ............................................................... 3-25 Standard Pressure ........................................................................ 3-25 viii Model 5030i SHARP Instruction Manual Thermo Fisher Scientific Contents Datalogging Settings ...................................................................... 3-25 Select Srec/Lrec ........................................................................... 3-26 View Logged Data....................................................................... 3-26 Number of Records ..................................................................... 3-27 Date and Time ............................................................................ 3-27 Erase Log .................................................................................... 3-28 Select Content............................................................................. 3-28 Choose Field Data....................................................................... 3-29 Concentrations............................................................................ 3-29 Other Measurements ................................................................... 3-30 Analog Inputs.............................................................................. 3-31 Commit Content ........................................................................ 3-32 Reset to Default Content ............................................................ 3-32 Configure Datalogging ................................................................ 3-33 Logging Period Min .................................................................... 3-33 Memory Allocation Percent......................................................... 3-33 Data Treatment .......................................................................... 3-34 Flag Status Data .......................................................................... 3-34 Communication Settings................................................................ 3-35 Serial Settings .............................................................................. 3-35 Baud Rate ................................................................................... 3-35 Data Bits ..................................................................................... 3-36 Parity .......................................................................................... 3-36 Stop Bits ..................................................................................... 3-36 RS-232/RS-485 Selection............................................................ 3-37 Instrument ID............................................................................. 3-37 Gesytec Serial Nunber ................................................................. 3-38 Communication Protocol............................................................ 3-38 Streaming Data Configuration .................................................... 3-38 Streaming Data Interval .............................................................. 3-39 Choose Stream Data ................................................................... 3-39 Concentrations............................................................................ 3-40 Other Measurements ................................................................... 3-40 Analog Inputs.............................................................................. 3-41 TCP/IP Settings .......................................................................... 3-41 Use DHCP ................................................................................. 3-42 IP Address ................................................................................... 3-42 Netmask...................................................................................... 3-43 Default Gateway ......................................................................... 3-43 Host Name ................................................................................. 3-43 Network Time Protocol Server .................................................... 3-44 I/O Configuration.......................................................................... 3-44 Output Relay Settings ................................................................. 3-44 Logic State .................................................................................. 3-45 Instrument State ......................................................................... 3-45 Alarms ......................................................................................... 3-46 Thermo Fisher Scientific Model 5030i SHARP Instruction Manual ix Contents Non-Alarm ................................................................................. 3-46 Digital Input Settings .................................................................. 3-46 Logic State .................................................................................. 3-47 Instrument Action ....................................................................... 3-47 Analog Output Configuration (Select Channel) .......................... 3-48 Allow Over/Under Range ............................................................ 3-48 Analog Output Configuration (Select Action) ............................. 3-49 Select Range ................................................................................ 3-49 Minimum and Maximum Value ................................................. 3-49 Choose Signal to Output ............................................................ 3-51 Analog Input Configuration ........................................................ 3-52 Descriptor ................................................................................... 3-53 Units ........................................................................................... 3-53 Decimal Places ............................................................................ 3-54 Number of Table Points.............................................................. 3-54 Table Points ................................................................................ 3-55 Volts ........................................................................................... 3-55 User Value .................................................................................. 3-55 Screen Contrast .............................................................................. 3-56 Service Mode ................................................................................. 3-56 Date/Time ..................................................................................... 3-57 Timezone ....................................................................................... 3-57 Diagnostics Menu ............................................................................. 3-58 Program Versions ........................................................................... 3-58 Voltages ......................................................................................... 3-59 Motherboard Voltages ................................................................. 3-59 Interface Board Voltages ............................................................. 3-59 I/O Board Voltages ..................................................................... 3-60 Detector Board Voltages ............................................................. 3-60 Nephelometer Board Voltages ..................................................... 3-60 RH/Temperature ........................................................................... 3-61 Pressure/Vacuum ........................................................................... 3-61 Flow ............................................................................................... 3-61 Detector Status............................................................................... 3-62 Nephelometer Status ...................................................................... 3-62 CRn ............................................................................................... 3-62 Analog Input Readings ................................................................... 3-63 Analog Input Voltages .................................................................... 3-63 Digital Inputs ................................................................................. 3-63 Relay States .................................................................................... 3-64 Test Analog Outputs ...................................................................... 3-64 Set Analog Outputs ..................................................................... 3-64 Instrument Configuration .............................................................. 3-65 Contact Information ...................................................................... 3-65 Alarms Menu .................................................................................... 3-66 Instrument Alarms ......................................................................... 3-66 x Model 5030i SHARP Instruction Manual Thermo Fisher Scientific Contents Filter Tape Counter .................................................................... 3-67 Max Filter Tape Counter ............................................................ 3-67 Detector Alarms ............................................................................. 3-67 Min and Max Alpha Alarms ........................................................ 3-68 Min and Max Beta Alarms .......................................................... 3-68 Nephelometer Alarms .................................................................... 3-68 Nephelometer Temperature ........................................................ 3-69 Min and Max Nephelometer Temperature Limits ....................... 3-69 Nephelometer RH....................................................................... 3-70 Min and Max Nephelometer RH Limits ..................................... 3-70 LED Current .............................................................................. 3-70 Min and Max LED Source Current Limits.................................. 3-71 Reference Detector Voltage ......................................................... 3-71 RH/Temperature Alarms ............................................................... 3-72 Ambient RH ............................................................................... 3-72 Min and Max Ambient RH Limits .............................................. 3-72 Sample RH ................................................................................. 3-73 Min and Max Sample RH Limits ................................................ 3-73 Ambient Temperature ................................................................. 3-73 Min and Max Ambient Temperature Limits ............................... 3-74 Flow Temperature ....................................................................... 3-74 Min and Max Flow Temperature Limits ..................................... 3-75 Board Temperature ..................................................................... 3-75 Min and Max Board Temperature Limits.................................... 3-75 Pressure/Vacuum Alarms................................................................ 3-76 Barometric Pressure ..................................................................... 3-76 Min and Max Barometric Pressure Limits ................................... 3-76 Vacuum ...................................................................................... 3-77 Min and Max Vacuum Limits ..................................................... 3-77 Flow ............................................................................................ 3-78 Min and Max Flow Limits .......................................................... 3-78 Flow Alarms ................................................................................... 3-78 Flow ............................................................................................ 3-79 Min and Max Flow Limits .......................................................... 3-79 Concentration Alarms .................................................................... 3-79 Average PM................................................................................. 3-80 Min and Max Average PM Concentration Limits ....................... 3-80 Average SHARP .......................................................................... 3-81 Min and Max Average SHARP Concentration Limits ................. 3-81 Average Nephelometer ................................................................ 3-81 Min and Max Average Nephelometer Concentration Limits ....... 3-82 Instant PM .................................................................................. 3-82 Min and Max Instant PM Concentration Limits ......................... 3-82 Instant SHARP ........................................................................... 3-83 Min and Max Instant SHARP Concentration Limits .................. 3-83 Instant Nephelometer ................................................................. 3-84 Thermo Fisher Scientific Model 5030i SHARP Instruction Manual xi Contents Min and Max Instant Nephelometer Concentration Limits ........ 3-84 Service Menu .................................................................................... 3-85 RH/Temperature Calibration ......................................................... 3-85 Ambient Temperature ................................................................. 3-86 Flow Temperature ....................................................................... 3-86 Ambient Relative Humidity ........................................................ 3-86 Pressure/Vacuum Calibration ......................................................... 3-87 Barometer Pressure Calibration ................................................... 3-87 Calibrate Barometer Pressure Offset ............................................ 3-88 Calibrate Barometer Pressure Span .............................................. 3-88 Restore Default Calibration......................................................... 3-88 Vacuum/Flow Calibration ........................................................... 3-89 Calibrate Vacuum/Flow Offset.................................................... 3-89 Calibrate Vacuum Pressure Span ................................................. 3-89 Calibrate Flow Pressure Span ...................................................... 3-90 Restore Default Calibration......................................................... 3-90 Flow Calibration ............................................................................ 3-91 Auto Flow Calibration ................................................................ 3-91 Manual Flow Calibration ............................................................ 3-92 Mass Calibration ............................................................................ 3-92 Thermal Mass Coefficient ........................................................... 3-92 Vacuum Mass Coefficient ........................................................... 3-93 Barometer Mass Coefficient ........................................................ 3-93 Mass Coefficient ......................................................................... 3-93 Auto Mass Coefficient ................................................................. 3-94 Manual Mass Coefficient ............................................................ 3-94 Alpha Efficiency Coefficient ........................................................ 3-94 Detector Calibration ...................................................................... 3-95 Auto Detector Calibration........................................................... 3-95 Manual Detector Calibration ...................................................... 3-96 Beta/Ref/Alpha Counts ............................................................... 3-96 High Voltage............................................................................... 3-96 Beta Ref Threshold ..................................................................... 3-97 Alpha Threshold ......................................................................... 3-97 Nephelometer Calibration .............................................................. 3-97 Nephelometer RH....................................................................... 3-98 Nephelometer Temperature ........................................................ 3-98 Nephelometer Source Level ......................................................... 3-98 Analog Output Calibration ............................................................ 3-99 Analog Output Calibrate Zero .................................................... 3-99 Analog Output Calibrate Full-Scale .......................................... 3-100 Analog Input Calibration ............................................................. 3-100 Analog Input Calibrate Zero ..................................................... 3-101 Analog Input Calibrate Full-Scale ............................................. 3-101 Display Pixel Test ........................................................................ 3-102 Restore User Defaults ................................................................... 3-102 xii Model 5030i SHARP Instruction Manual Thermo Fisher Scientific Contents Restore Factory Defaults .............................................................. 3-102 Password Menu ............................................................................... 3-103 Set Password ................................................................................ 3-103 Lock Instrument .......................................................................... 3-104 Lock/Unlock and Local/Remote Operation .............................. 3-104 Change Password ......................................................................... 3-104 Remove Password......................................................................... 3-105 Unlock Instrument....................................................................... 3-105 Thermo Fisher Scientific Chapter 4 Calibration .......................................................................................................... 4-1 Frequency of Calibration..................................................................... 4-1 Equipment Required ........................................................................... 4-1 Pre-Calibration ................................................................................... 4-2 Calibration Procedure ......................................................................... 4-2 RH/Temperature Calibration ........................................................... 4-3 Ambient Temperature ................................................................... 4-3 Ambient Relative Humidity .......................................................... 4-3 Flow Temperature ......................................................................... 4-4 Pressure/Vacuum Calibration ........................................................... 4-4 Barometer Pressure Calibration ..................................................... 4-4 Calibrate Vacuum/Flow Zero ........................................................ 4-5 Calibrate Vacuum Pressure Span ................................................... 4-5 Calibrate Flow Pressure Span ........................................................ 4-6 Flow Calibration .............................................................................. 4-7 Auto Flow Calibration .................................................................. 4-7 Mass Calibration .............................................................................. 4-7 Mass Coefficient ........................................................................... 4-9 Auto Mass Coefficient ................................................................... 4-9 Detector Calibration ...................................................................... 4-12 Auto Detector Calibration........................................................... 4-12 Nephelometer Calibration .............................................................. 4-13 Nephelometer RH....................................................................... 4-13 Nephelometer Temperature ........................................................ 4-13 Nephelometer Source Level ......................................................... 4-14 Chapter 5 Preventive Maintenance ................................................................................. 5-1 Safety Precautions ............................................................................... 5-1 Replacement Parts ............................................................................... 5-2 Cleaning the Outside Case .................................................................. 5-2 Cleaning the Inlets .............................................................................. 5-2 U.S. EPA PM10 Inlet ........................................................................ 5-2 European PM10/PM2.5 Inlet .............................................................. 5-3 Cyclone Maintenance....................................................................... 5-4 Heater and Sample Tube.................................................................. 5-5 Weather Proofing ............................................................................. 5-5 Model 5030i SHARP Instruction Manual xiii Contents Fan Filter Inspection and Cleaning ..................................................... 5-5 Pump Rebuilding ................................................................................ 5-6 Leak Test ............................................................................................ 5-6 Filter Tape Replacement ..................................................................... 5-7 Greasing the Cam ............................................................................... 5-8 External Pump Exhaust Filter.............................................................. 5-8 Cleaning the SHARP Optics Assembly ............................................. 5-10 xiv Chapter 6 Troubleshooting................................................................................................. 6-1 Safety Precautions ............................................................................... 6-1 Troubleshooting Guides ...................................................................... 6-1 Board-Level Connection Diagrams ..................................................... 6-8 Connector Pin Descriptions .............................................................. 6-10 Service Locations ............................................................................... 6-25 Chapter 7 Servicing ............................................................................................................. 7-1 Safety Precautions ............................................................................... 7-3 Firmware Updates ............................................................................... 7-4 Accessing the Service Mode ................................................................. 7-4 Replacement Parts List ........................................................................ 7-5 Cable List ............................................................................................ 7-7 External Device Connection Components .......................................... 7-8 Removing the SHARP Optics Assembly ........................................... 7-11 Removing the Measurement Case Assembly and Lowering the Partition Panel ................................................................................................. 7-12 Fuse Replacement ............................................................................. 7-14 Fan/Filter Replacement ..................................................................... 7-14 Detector Amplifier Assembly Replacement........................................ 7-15 Detector Amplifier Board Calibration ............................................... 7-17 External Pump Replacement ............................................................. 7-17 Pressure Board Replacement ............................................................. 7-18 Pressure Board Calibration ................................................................ 7-20 Analog Output Testing ..................................................................... 7-21 Analog Output Calibration ............................................................... 7-24 Analog Input Calibration .................................................................. 7-25 Calibrating the Input Channels to Zero Volts ................................ 7-25 Calibrating the Input Channels to Full-Scale ................................. 7-26 Themistor Replacement .................................................................... 7-26 I/O Expansion Board (Optional) Replacement ................................. 7-27 Digital Output Board Replacement................................................... 7-29 Motherboard Replacement ................................................................ 7-30 Measurement Interface Board Replacement ...................................... 7-31 Photo Interrupt Board Replacement.................................................. 7-32 Proportional Valve Replacement ....................................................... 7-33 Detector Assembly Replacement ....................................................... 7-34 Model 5030i SHARP Instruction Manual Thermo Fisher Scientific Contents Flow RTD Replacement ................................................................... 7-36 Transformer Replacement ................................................................. 7-37 Radius Tube Replacement................................................................. 7-38 Ambient RH/Temperature Replacement ........................................... 7-39 Front Panel Board Replacement ........................................................ 7-41 LCD Module Replacement ............................................................... 7-42 Removing the SHARP Optics Cover................................................. 7-44 External Solenoid Valve Replacement ............................................... 7-45 SHARP RH/Temp Sensor Replacement ........................................... 7-46 SHARP Interface Board Replacement ............................................... 7-47 Delrin Nut Replacement ................................................................... 7-49 Internal SHARP Cable Assembly Replacement ................................. 7-51 Case Cable Replacement ................................................................... 7-52 External Zeroing Filter ...................................................................... 7-53 Service Locations ............................................................................... 7-54 Chapter 8 Thermo Fisher Scientific System Description .......................................................................................... 8-1 Hardware ............................................................................................ 8-1 Nephelometer Assembly ................................................................... 8-4 Primary Measurement Head ............................................................ 8-4 Detector Amplifier ........................................................................... 8-4 Cam Photo Interrupt Board ............................................................. 8-4 Counter Wheel Interrupt Board Assembly ....................................... 8-4 Proportional Valve ........................................................................... 8-4 Cam Motor ...................................................................................... 8-4 Tape Motor...................................................................................... 8-4 Pressure Board.................................................................................. 8-5 External Solenoid ............................................................................. 8-5 Pump Intake T-Fitting ..................................................................... 8-5 Firmware ............................................................................................. 8-5 Instrument Control .......................................................................... 8-5 Monitoring Signals........................................................................... 8-6 Output Communication .................................................................. 8-6 Electronics .......................................................................................... 8-6 Motherboard .................................................................................... 8-6 Nephelometer Interface Board ......................................................... 8-7 Nephelometer interface board connectors ..................................... 8-7 Measurement Interface Board .......................................................... 8-7 Measurement Interface Board Connectors..................................... 8-8 Flow Sensor System .......................................................................... 8-8 Pressure Sensor Assembly ................................................................. 8-8 Detector Amplifier Assembly............................................................ 8-8 Digital Output Board ....................................................................... 8-8 I/O Expansion Board (Optional) ..................................................... 8-9 Front Panel Connector Board .......................................................... 8-9 I/O Components................................................................................. 8-9 Model 5030i SHARP Instruction Manual xv Contents Analog Voltage Outputs ................................................................... 8-9 Analog Current Outputs (Optional) .............................................. 8-10 Analog Voltage Inputs (Optional) .................................................. 8-10 Digital Relay Outputs .................................................................... 8-10 Digital Inputs ................................................................................. 8-11 Serial Ports ..................................................................................... 8-11 RS-232 Connection ....................................................................... 8-11 RS-485 Connection ....................................................................... 8-12 Ethernet Connection ...................................................................... 8-12 External Accessory Connector ........................................................ 8-12 xvi Chapter 9 Optional Equipment........................................................................................... 9-1 Inlet Assemblies................................................................................... 9-1 Sampling Tube Extensions .................................................................. 9-1 I/O Expansion Board Assembly ........................................................... 9-1 25 Pin Terminal Board Assembly ........................................................ 9-1 Terminal Block and Cable Kits ........................................................... 9-2 Cables ................................................................................................. 9-2 Mounting Options .............................................................................. 9-3 Roof Flange Assembly ......................................................................... 9-8 Chapter 10 Model 5014i to 5030i Upgrade Procedures ................................................. 10-1 Instrument Preparation ..................................................................... 10-1 SHARP Connection Bracket Assembly Installation ........................... 10-2 Radius Tube Adapter Installation ...................................................... 10-5 SHARP External Valve Installation ................................................... 10-7 SHARP Optics Assembly Installation ................................................ 10-9 Upgrade of the Heater Tube Assembly ............................................ 10-10 Model Label Change ....................................................................... 10-11 Power On Instrument ..................................................................... 10-11 Appendix A Warranty............................................................................................................. A-1 Appendix B C-Link Protocol Commands ............................................................................ B-1 Instrument Identification Number ...................................................... B-1 Commands ......................................................................................... B-2 Commands List ................................................................................ B-3 Measurements ................................................................................... B-11 Alarms ............................................................................................... B-14 Diagnostics ....................................................................................... B-23 Datalogging....................................................................................... B-27 Calibration ........................................................................................ B-34 Keys/Display ..................................................................................... B-44 Measurement Configuration ............................................................. B-45 Hardware Configuration ................................................................... B-51 Model 5030i SHARP Instruction Manual Thermo Fisher Scientific Contents Communications Configuration ....................................................... B-54 I/O Configuration............................................................................. B-61 Record Layout Definition ................................................................. B-66 Format Specifier for ASCII Responses ............................................ B-66 Format Specifier for Binary Responses ........................................... B-66 Format Specifier for Erec Layout .................................................... B-67 Text ............................................................................................ B-67 Value String ................................................................................ B-67 Value Source ............................................................................... B-67 Alarm Information ...................................................................... B-68 Translation Table ........................................................................ B-68 Selection Table ............................................................................ B-68 Button Designator....................................................................... B-68 Examples ..................................................................................... B-69 Thermo Fisher Scientific Appendix C MODBUS Protocol ............................................................................................C-1 Serial Communication Parameters ..................................................... C-1 TCP Communication Parameters ...................................................... C-2 Application Data Unit Definition ...................................................... C-2 Slave Address................................................................................... C-2 MBAP Header ................................................................................ C-2 Function Code ................................................................................ C-3 Data ................................................................................................ C-3 Error Check .................................................................................... C-3 Function Codes .................................................................................. C-3 (0x01/0x02) Read Coils/Read Inputs .............................................. C-3 (0x03/0x04) Read Holding Registers/Read Input Registers ............. C-5 (0x05) Force (Write) Single Coil ..................................................... C-7 MODBUS Parameters Supported ...................................................... C-8 Appendix D Gesytec (Bayern-Hessen) Protocol .............................................................. D-1 Serial Communication Parameters ..................................................... D-1 TCP Communication Parameters ...................................................... D-2 Instrument Address ............................................................................ D-2 Abbreviations Used ............................................................................ D-2 Basic Command Structure ................................................................. D-2 Block Checksum Characters <BCC> .................................................. D-3 Gesytec Commands ........................................................................... D-3 Instrument Control Command (ST) ............................................... D-3 Data Sampling/Data Query Command (DA).................................. D-4 Measurements reported in response to DA command ..................... D-7 Operating and Error Status ............................................................. D-8 Appendix E ESM Protocol Commands ................................................................................ E-1 ESM Commands Supported ............................................................... E-1 Model 5030i SHARP Instruction Manual xvii Contents xviii Model 5030i SHARP Instruction Manual Thermo Fisher Scientific Figures Figure 1–1. SHARP Monitor Sample Path .......................................................... 1-3 Figure 1–2. Nephelometer Sample and Zero Flow Schematic .......................... 1-5 Figure 2–1. Remove the Packing Material ......................................................... 2-3 Figure 2–2. Model 5030i Sampling Room Air Under Stable Conditions ........... 2-7 Figure 2–3. Model 5030i Side View—inches [millimeters] ............................ 2-10 Figure 2–4. Model 5030i Top View—inches [millimeters] ............................. 2-11 Figure 2–5. Model 5030i Vertical View ........................................................... 2-12 Figure 2–6. Heater Assembly ........................................................................... 2-14 Figure 2–7. Rear Panel Plumbing Schematic ................................................... 2-16 Figure 2–8. I/O Terminal Board Views ............................................................. 2-18 Figure 2–9. Pin-Out of Rear Panel Connector................................................... 2-19 Figure 2–10. D/O Terminal Board Views.......................................................... 2-20 Figure 2–11. 25-Pin Terminal Board Views ...................................................... 2-21 Figure 3–1. Front Panel Display .......................................................................... 3-2 Figure 3–2. Front Panel Pushbuttons .................................................................. 3-2 Figure 3–3. Flowchart of Menu-Driven Firmware .............................................. 3-5 Figure 3–4. Pin-Out of Rear Panel Connector................................................... 3-12 Figure 3–5. Common Flags ............................................................................... 3-31 Figure 3–6. Detector A Flags ............................................................................ 3-31 Figure 4–1. Differential Pressure and Vacuum Calibration Ports ...................... 4-6 Figure 5–1. U.S. EPA PM10 Inlet .......................................................................... 5-3 Figure 5–2. European PM10 Inlet ......................................................................... 5-4 Figure 5–3. PM2.5 Sharp-Cut-Cyclone ................................................................. 5-5 Figure 5–4. Inspecting and Cleaning the Fan ..................................................... 5-6 Figure 5–5. Replacing the Filter Tape ................................................................ 5-8 Figure 5–6. Replacing the External Pump Exhaust Filter ................................... 5-9 Figure 6–1. Board-Level Connection Diagram - Common Electronics ............... 6-8 Figure 6–2. Board-Level Connection Diagram - Measurement System ............ 6-9 Figure 6–3. Board-Level Connection Diagram - SHARP ................................... 6-10 Figure 7–1. Properly Grounded Antistatic Wrist Strap ...................................... 7-4 Figure 7–2. Model 5030i Component Layout ..................................................... 7-9 Figure 7–3. SHARP Optics Component Layout ................................................. 7-10 Figure 7–4. Removing the SHARP Optics Assembly ........................................ 7-11 Figure 7–5. Removing the Measurement Case Assembly and Lowering the Partition Panel .................................................................................................... 7-12 Figure 7–6. Replacing the Fan .......................................................................... 7-15 Thermo Fisher Scientific Model 5030i SHARP Instruction Manual xix Figures Figure 7–7. Replacing the Detector Amplifier Assembly ................................. 7-16 Figure 7–8. Replacing the Pump ....................................................................... 7-18 Figure 7–9. Replacing the Pressure Board Assembly....................................... 7-19 Figure 7–10. Replacing the Pressure Board Assembly Plumbing Connection . 7-20 Figure 7–11. Rear Panel Analog Input and Output Pins ................................... 7-23 Figure 7–12. Replacing the Thermistor............................................................. 7-27 Figure 7–13. Replacing the I/O Expansion Board (Optional) ............................ 7-28 Figure 7–14. Rear Panel Board Connectors ...................................................... 7-29 Figure 7–15. Replacing the Measurement Interface Board ............................. 7-32 Figure 7–16. Replacing the Photo Interrupt Board ........................................... 7-33 Figure 7–17. Replacing the Proportional Valve ................................................ 7-34 Figure 7–18. Replacing the Detector Assembly ............................................... 7-36 Figure 7–19. Replacing the RTD ....................................................................... 7-37 Figure 7–20. Replacing the Transformer .......................................................... 7-38 Figure 7–21. Replacing the Radius Tube .......................................................... 7-39 Figure 7–22. Replacing the Ambient RH/Temperature Assembly ................... 7-41 Figure 7–23. Replacing the Front Panel Board and the LCD Module............... 7-42 Figure 7–24. Removing the SHARP Optics Cover ............................................. 7-44 Figure 7–25. Replacing the External Solenoid Valve ....................................... 7-45 Figure 7–26. Disconnecting the RH/Temp Connector ...................................... 7-47 Figure 7–27. SHARP Interface Board Connections........................................... 7-48 Figure 7–28. Replacing the SHARP Optics Board ............................................. 7-49 Figure 7–29. Replacing the Delrin Nut ............................................................. 7-50 Figure 7–30. Replacing the Internal SHARP Cable Assembly .......................... 7-52 Figure 7–31. Replacing the Case Cable ............................................................ 7-53 Figure 7–32. Replacing the External Zeroing Filter .......................................... 7-54 Figure 8–1. Model 5030i Hardware Components .............................................. 8-2 Figure 8–2. SHARP Optics Component ............................................................... 8-3 Figure 9–1. Bench Mounting ............................................................................... 9-4 Figure 9–2. EIA Rack Mounting .......................................................................... 9-5 Figure 9–3. Retrofit Rack Mounting.................................................................... 9-6 Figure 9–4. Rack Mount Option Assembly ......................................................... 9-7 Figure 9–5. Roof Flange Assembly ..................................................................... 9-8 Figure 9–6. Securing the Roof Flange................................................................. 9-9 Figure 10–1. SHARP Optics Connection Bracket .............................................. 10-2 Figure 10–2. Tape Pick-up Spool Removal ....................................................... 10-3 Figure 10–3. Filter Tape Installation Pathway .................................................. 10-4 Figure 10–4. Connecting Connection Bracket Wiring to Measurement Interface Board ................................................................................................................... 10-5 Figure 10–5. Radius Tube Adapter Install ........................................................ 10-6 xx Model 5030i SHARP Instruction Manual Thermo Fisher Scientific Figures Figure 10–6. Radius Tube Adapter Alignment Check ...................................... 10-6 Figure 10–7. Rear Valve Assembly Installation ............................................... 10-7 Figure 10–8. Plumbing Diagram ....................................................................... 10-8 Figure 10–9. Optics Installation........................................................................ 10-9 Figure 10–10. Connecting the Optics to the Optics Connector........................ 10-9 Figure 10–11. Upgrading 5030i Heater Assembly ......................................... 10-10 Figure 10–12. Connecting Heater to Optics Assembly Cover ........................ 10-11 Figure 10–13. Front Panel Label Replacement............................................... 10-11 Figure B–1. Flags Field ..................................................................................... B-12 Thermo Fisher Scientific Model 5030i SHARP Instruction Manual xxi Figures xxii Model 5030i SHARP Instruction Manual Thermo Fisher Scientific Tables Table 1–1. Model 5030i Specifications ............................................................. 1-8 Table 2–1. Pressure Units Conversion ................................................................ 2-6 Table 2–2. I/O Terminal Board Pin Descriptions .............................................. 2-18 Table 2–3. Default Analog Outputs .................................................................. 2-19 Table 2–4. D/O Terminal Board Pin Descriptions............................................. 2-20 Table 2–5. 25-Pin Terminal Board Pin Descriptions ......................................... 2-21 Table 3–1. Front Panel Pushbuttons ................................................................... 3-3 Table 3–2. Standard Ranges............................................................................. 3-11 Table 3–3. Default Analog Outputs .................................................................. 3-12 Table 3–4. Analog Output Zero to Full-Scale ................................................... 3-50 Table 3–5. Signal Type Group Choices ............................................................. 3-51 Table 6–1. Troubleshooting - General Guide ..................................................... 6-2 Table 6–2. Troubleshooting - Alarm Messages ................................................. 6-5 Table 6–3. Motherboard Connector Pin Descriptions ...................................... 6-10 Table 6–4. Measurement Interface Board Connector Pin Descriptions .......... 6-15 Table 6–5. Front Panel Board Connector Pin Diagram ..................................... 6-20 Table 6–6. I/O Expansion Board (Optional) Connector Pin Descriptions ......... 6-21 Table 6–7. Digital Output Board Connector Pin Descriptions .......................... 6-23 Table 6–8. SHARP Measurement Interface Board Pin Connections................ 6-24 Table 7–1. Model 5030i Replacement Parts ...................................................... 7-5 Table 7–2. Model 5030i Cables.......................................................................... 7-7 Table 7–3. External Device Connection Components ........................................ 7-8 Table 7–4. Analog Output Channels and Rear Panel Pin Connections ............ 7-23 Table 7–5. Analog Input Channels and Rear Panel Pin Connections............... 7-23 Table 8–1. RS-232 DB9 Connector Pin Configuration ...................................... 8-12 Table 8–2. RS-485 DB9 Connector Pin Configuration ...................................... 8-12 Table 9–1. Cable Options.................................................................................... 9-2 Table 9–2. Color Codes for 25-Pin and 37-Pin Cables ....................................... 9-3 Table 9–3. Mounting Options ............................................................................. 9-3 Table B–1. Error Response Messages ............................................................... B-3 Table B–2. C-Link Protocol Commands .............................................................. B-3 Table B–3. Record Output Formats .................................................................. B-31 Table B–4. Stream Time Values ....................................................................... B-34 Table B–5. Standard Ranges ............................................................................ B-49 Table B–6. Contrast Levels............................................................................... B-51 Table B–7. Allow Mode Command Values ...................................................... B-56 Thermo Fisher Scientific Model 5030i SHARP Instruction Manual xxiii Tables Table B–8. Reply Termination Formats ............................................................ B-58 Table B–9. Set Layout Ack Values.................................................................... B-59 Table B–10. Power Up Mode Values................................................................ B-60 Table B–11. Analog Current Output Range Values .......................................... B-61 Table B–12. Analog Voltage Output Range Values ......................................... B-62 Table B–13. Default Analog Output Channel Assignments ............................. B-63 Table C–1. Read Coils for 5030i ......................................................................... C-8 Table C–2. Read Registers for 5030i .................................................................. C-9 Table C–3. Write Coils for 5030i ...................................................................... C-11 Table D–1. Operating Status for Model 5030i .................................................. D-8 Table D–2. Error Status for Model 5030i .......................................................... D-8 Table E–1. Read Commands for 5030i ............................................................... E-1 Table E–2. Write Commands for 5030i .............................................................. E-2 Table E–3. Control Commands for 5030i ............................................................ E-2 xxiv Model 5030i SHARP Instruction Manual Thermo Fisher Scientific Chapter 1 Introduction The Model 5030i Synchronized Hybrid Ambient Real-time Particulate (SHARP) Monitor is a hybrid nephelometric/radiometric particulate mass monitor capable of providing precise, real-time measurements with a superior detection limit. The SHARP Monitor measures the mass concentration of ambient PM10, PM2.5, and PM1.0 aerosol in real-time. The SHARP Monitor incorporates a high sensitivity light scattering photometer whose output signal is continuously reference to the time-averaged measurements of an integral beta attenuation mass sensor, as developed on the Model 5014i Beta. This system achieves heretofore-unattained shortterm precision and accuracy. The SHARP Monitor incorporates advanced firmware to optimize the continuous mass calibration of the nephelometric signal, ensuring that the measured mass concentration remains independent of changes in the particle population being sampled. The SHARP Monitor incorporates a dynamic heating system (DHS) designed to maintain the relative humidity of the air passing through the filter tape of the radiometric stage below the user-defined threshold, typically below the point at which the collected particles accrete and retain liquid water. This DHS system minimizes the internal temperature rise by not heating when sample relative humidity is below the threshold to which the heater is controlling. As the ambient RH increases above the threshold, the applied heating is optimized to maintain the RH threshold at the sample filter tape. The purpose of this heating system is specifically designed to force the continuous mass monitor to agree with the gravimetric reference method and the relative humidity conditions to which the reference filter samples are conditioned. Furthermore, sufficient flexibility is provided within the firmware to configure the heating conditions to satisfy global monitoring protocols. The measuring range of the Model 5030i is 0-10,000 μg/m3. A complete particulate measuring assembly consists of the following main parts: Thermo Fisher Scientific ● SHARP Optics Module ● SHARP Beta Module ● Ambient Inlet Sampling System (PM10, PM2.5, PM1.0) ● Dynamic Heater Model 5030i SHARP Instruction Manual 1-1 Introduction Principle of Operation ● Diaphragm Vacuum Pump ● External Ambient T/RH Sensor Assembly ● Internal Data Recording Unit and External Communication Ports ● Optional 6-Foot Sample Extension Tubes ● Optional Tripod Support ● Optional Roof Flange Kit The Model 5030i combines proven technology, easy to use menu-driven firmware, and advanced diagnostics to offer unsurpassed flexibility and reliability. The Model 5030i has the following features: 1-2 Model 5030i SHARP Instruction Manual ● 320 x 240 pixels graphics display ● Menu-driven firmware ● Field programmable ranges ● Multiple user-defined analog outputs ● Analog input options ● Linearity through all ranges ● User-selectable digital input/output capabilities ● Standard communications features include RS-232/485 and Ethernet ● C-Link, MODBUS, Geysitech (Bayern-Hessen), ESM Protocol, streaming data, and NTP (Network Time Protocol) protocols. Simultaneous connections from different locations over Ethernet. ● Radon gas activity measurement (Rn-222; noble gas) and mass refinement ● Flexible data storage configurations ● Volumetric air flow rate control with actual standard conditions concentration data output ● Processor controlled calibration of all sensors ● 880 nm near forward scattering nephelometer ● Beta Detector Life ~10 years ● C-14 activity below USA authorized limit values; shipped as nonhazardous material under Code UN2911; easy handling of the source and instrument. No license is needed in most countries. Thermo Fisher Scientific Introduction Principle of Operation For details of the analyzer’s principle of operation and product specifications, see the following topics: ● “Principle of Operation” on page 1-3 ● “Specifications” on page 1-8 Thermo Fisher Scientific is pleased to supply this continuous ambient particulate monitor. We are committed to the manufacture of instruments exhibiting high standards of quality, performance, and workmanship. Thermo service personnel are available for assistance with any questions or problems that may arise in the use of this instrument. For more information on servicing, see the “Servicing” chapter. Principle of Operation The Model 5030i is based on the principles of aerosol light scattering (nephelometer) and beta attenuation (Model 5014i Beta) to measure precise and accurate ambient aerosol concentrations. The Model 5030i SHARP aerosol sample pathway is shown in Figure 1–1. Conditioned Aerosol Sample SHARP Board SHARP Box shown with Cover Off Beta Attenuation Nephelometer Figure 1–1. SHARP Monitor Sample Path Thermo Fisher Scientific Model 5030i SHARP Instruction Manual 1-3 Introduction Principle of Operation The SHARP optical assembly senses the light scattered by the aerosol passing through an 880 nm illumination beam. The nephelometry response is linear with aerosol concentration; independent of sample flow rate; and a running one-minute average and dynamic average are continuously calculated. A relative humidity (RH) measurement is located at the sample filter-tape assuring a representative measurement of the aerosol conditioning prior to real-time mass determination. Thereafter, the aerosol is deposited onto a glass fiber filter tape. The filter tape will accumulate an aerosol sample towards a threshold value, whereupon the filter tape will automatically advance prior to reaching saturation. During the collection of aerosol onto the filter tape the SHARP Monitor uses the radiometric principle of beta attenuation through a known sample area to continuously collect and detect the deposited mass. Additionally, the beta-attenuation chamber measures alpha emissions from the accumulated aerosol and excludes negative mass artifacts from the presence of daughter nuclides from radon gas decay to achieve a “refined mass” measurement. Simultaneous refined mass measurement and sample volume measurement through a calibrated orifice provide a continuous concentration measurement of the ambient mass concentration. 1-4 Model 5030i SHARP Instruction Manual Thermo Fisher Scientific Introduction Principle of Operation HEPA FILTER β SOURCE Figure 1–2. Nephelometer Sample and Zero Flow Schematic Thermo Fisher Scientific Model 5030i SHARP Instruction Manual 1-5 Introduction Principle of Operation A clean filter spot is introduced by an automatic filter change to the combined sampling and detection chamber at least every 24 hours, usually centered at midnight. However, the official filter tape change frequency for TUV and U.S. EPA testing is for both PM2.5 and PM10 is every 8 hours. The automatic filter changes are controlled by the instrument firmware which halts the pump operation, lowers the vacuum chamber plate, advances the filter tape a fixed length, raises the vacuum chamber plate, and initiates the pump operation and a zeroing of the sample spot. Immediately after a filter change, a new measurement cycle is initiated with an automatic zero adjustment of the mass signal. The filter change interval and time of day can be user adjusted. Additionally, automatic filter changes will occur if the mass on the filter exceeds 1,500 μg since the last filter change or if the flow rate through the filter tape is reduced by more than 5% due to potentially restrictive particle deposition. Using the example of PM2.5 monitoring, ambient air is drawn into a 10 micron (μm) size selective inlet which discriminates against 50% of the particles with an equivalent aerodynamic diameter above 10 μm. This inlet has been approved previously through prior U.S. EPA designations (RFPS0699-130, 131, and 132) and is also listed within 40 CFR Part 50, Appendix L as a 10-MICRON INLET (including model SA246b). Further particle discrimination is achieved by inserting a PM2.5 cyclone between the 10-micron inlet and sample tube. European-style inlets are also available with the 5030i.The volumetric flow rate at the inlet entrance is 16.67 liters per minute (1 m3/hour). In addition, the ambient temperature and relative humidity is measured via a naturally aspirated radiation shield and standard sensor as part of the volumetric flow control and dynamic heating system. The ambient particulate is then drawn down a vertically mounted heated sample tube. The heat applied to the sampe is adjustable to either a fixed temperature or a RH-threshold at the filter spot. The purpose of heating the sample is to reduce particle bound water and to decrease the relative humidity (RH) of the sample stream. This is done to reduce positive artifact measurement that can potentially occur as a result of condensation on the filter tape or conditions of elevated humidity. The heater is controlled by the CPU and the power applied is proportional to the conditions. Downstream of the heated tube, is the nephelometer assembly. The particulate travels through the insulated nephelometer in a laminar pathway and is introduced to the radial tube upstream of the beta attenuation head. The nephelometer assembly contains an 880 nanometer pulsed light source, a reference detector for illumination output control, a hybrid silicon photodetector, temperature sensor, relative humidity sensor, programmable PCB, and communications cable. The nephelometer assembly has six ranges that are automatically selected to provide the most precise reading possible. During scheduled auto-zeroing 1-6 Model 5030i SHARP Instruction Manual Thermo Fisher Scientific Introduction Principle of Operation events, a rear-panel mounted zeroing solenoid is activated and HEPAfiltered air is delivered to the nehpelometer, whereby each range is zeroed. The results of the zeroing are available via display and C-Link read commands. At the location where the nephelometer attaches to the 5030i instrument case, a radial insulated tube joins the sampling tube to the collection chamber. The particulate is drawn onto the glass fiber filter tape between the proportional detector and the 14C beta source. Here, the beta beam passes upwards through the filter tape and accumulated particulate layer. The intensity of the beta beam is attenuated with the increasing mass load resulting in a reduced beta intensity measured by the proportional detector. From a continuously integrated count rate the mass on the filter tape is calculated. During sampling, the mass on the filter spot is always known and the rate of particulate accumulation is observed. A continuous measurement of the flow rate determines the sample volume. A proportional valve is used to maintain the sample flow rate at its nominal value. From both integrated sample volume and mass detection the particulate concentration is calculated. At any given time the output signal delivers the concentration of particulate in actual or standard conditions. The Model 5030i outputs particulate matter concentrations to the front panel display as SHARP, PM, and NEPH, which are the hybrid, beta attenuation and nephelometer derived particulate concentrations, respectively. Displayed concentrations, analog outputs, also makes the data available over the serial or Ethernet connection. Additionally, the Model 5030i proportional radiation detector is sensitive to natural alpha activity of the aerosol passing through the sampling system. The additional alpha count rate is used to measure the presence of Radon gas and infer the daughter nuclides of Radon gas. These daughter nuclides create a small beta emission. This externally sampled beta emission is perceived by the detector to be a higher count rate and the higher the count rate, the less apparent mass detected. Therefore, by measuring the natural alpha activity due to Radon gas, the proportional beta interference from the daughter nuclide emissions are subtracted from the count rate to provide a refined mass measurement. This potential error from Radon gas interference may be (in lower strength radioactive devices; e.g.; <100 μCi) as high as actual particle concentrations, especially after filter change or when the natural activity concentration changes. The Model 5030i has implemented this procedure to determine separately the natural activity in the aerosol and to eliminate this error. This procedure further allows the Model 5030i to provide a more stable reading at lower ambient particulate concentrations compared to similar methods. Furthermore, from this information the activity concentration of the natural noble gas Radon is derived. Thermo Fisher Scientific Model 5030i SHARP Instruction Manual 1-7 Introduction Specifications The beta measurement chamber houses an RTD temperature sensor. The T-sensor directly measures the temperature of the incoming sample stream for a continuous air mass compensation, and the flow system. The flow and ambient sensor measurements are combined within a firmware algorithm to maintain an accurate measurement and control of volumetric flow at the inlet and through the differential orifice. The Model 5030i also includes three pressure sensors to measure the differential pressure across a subsonic orifice, vacuum under the filter tape, and barometric pressure. The flow P-sensor is solely used for measurement at the orifice for flow rate control. The vacuum sensor is used for air mass compensation, as an indicator for clogging of the system and is included in the volumetric flow control. The barometric P-sensor is used for air mass compensation and for volumetric flow rate regulation. The volumetric flow system is built on a calibrated feedback signal from the CPU to the proportional valve signal. By using this flow control, flow stability is easily maintained. With regard to the hybrid, 5030i SHARP Monitor methodology, the nephelometer and beta attenuation concentrations are calculated and both values are digitally filtered (e.g. averaged) with an elastic time constant that is a function of the real-time concentrations. The time constant of this dynamic digital filter will vary with concentrations. It is the ratio of those two digitally filtered concentrations that becomes a dynamic correction factor for the real-time nephelometer, and the product of this correction factor and nephelometer becomes the SHARP Monitor concentrations. Specifications Table 1–1 lists the specifications for the Model 5030i. Table 1–1. Model 5030i Specifications Safety/Electrical Designations Designed to meet: CE: EN 61326:1997 + A1:1998 + A2:2001 + A3:2003, EN:61010-1 UL: 61010-1:2004 CSA: C22.2 No. 61010-1:2004 FCC: Part 15 Subpart B, Class B Source and Detector IR LED, 6mW, 880 nm Silicon/Hybrid Amplifier Photodetector β Source: Carbon-14, <3.7 MBq (<100 μCi) Sealed Source Device Proportional Radiation Detector Standard System Configuration Menu-driven software for user interaction via 320 x 420 pixels graphics display 1-8 Model 5030i SHARP Instruction Manual Thermo Fisher Scientific Introduction Specifications Connecting and Interface Cables, and Vacuum Pump 3-foot heated sample tube Ambient T/RH Assembly Consumables for average first year’s operation (ambient) iPort Software for Local or Remote Communication Sample Heater 3-foot insulated heater tube Three Modes of Heater Control OFF – Heater is turned off in non condensing environment TEMP – fixed sample temperature RH – Dynamic Heating of sample at set sample RH threshold (e.g., 50% RH) Instrument Performance (16.67 l/min, 1s, stable conditions) Measurement Range: 0 to 1.0, 2.0, 3.0, 5.0, 10.0 mg/m3 0 to 100, 1,000, 2,000, 3,000, 5,000, 10,000 μg/m3 Minimum Detection Limit: <0.5 μg/m3 (1 hour) @ 2 σ <0.2 μg/m3 (24-hour) @ 2 σ Resolution: 0.1 μg/m³ (not to be confused with precision) Precision: ±2.0 μg/m³ <80 μg/m³; ±5 μg/m³ >80 μg/m³ (24-hour) Accuracy for Mass Measurement: ±5% using NIST-traceable mass foil set Data Averaging and Output Real-time Mass Conc Average: 1 minute Long-Term Averaging: 60 to 3,600 sec and 24-hour Data Output Rate: every 1 second Operating Range The temperature of the sampled air may vary between -30 and 50 °C. The 5030i units must be weather protected within the range of 4 °C to 50 °C. An optional Complete Outdoor Enclosure provides complete weather protection. Non-condensing; <95% RH inside 5030i Sample Flow Volumetric flow control system uses a calibrated subsonic precision orifice and the measured ambient temperature and pressure to maintain constant volumetric flow rates. Nominal Flow Rate: 16.67 L/min Flow Precision ±2% of measured value Flow Accuracy <5% of measured value Data Storage Internal data logging of user-specified variables; capacity of 190,000 records. Thermo Fisher Scientific Model 5030i SHARP Instruction Manual 1-9 Introduction Specifications Filter Media Sample Filter: Glass fiber filter type (width 40 mm; length: 17 m) Whatman, Inc. Approximately 650 filter tape changes per roll. Inlet Accessories European or U.S. EPA PM10 Inlets European or U.S. EPA PM2.5 Inlet Configurations PM2.5 VSSC™ PM1.0 SCC Tripod Data Output and Input iPort software to view and change system operation from PC Outputs: Selectable Voltage, RS232/RS485, TCP/IP, 10 Status Relays, and Power Fail Indication (standard). 0-20 or 4-20 mA Isolated Current Output (optional) Inputs: 16 Digital Inputs (standard), Eight 0 to 10 VDC Analog Inputs (optional) 8 User-Defined Analog Outputs (0 -1 or 0 -5 VDC) Protocols: C-Link, MODBUS, Geystitech (Bayern-Hessen), ESM Protocol, streaming data, and NTP (Network Time Protocol) protocols. Simultaneous connections from different locations over Ethernet. 2 User-Defined Contact Closure Alarm Circuits 4 Averaged Analog Inputs (0–5 VDC) with user-defined conversion to engineering units Data Storage Maximum of 190,000 Concentration records with date, time, and flags Up to 32 types of logged data parameters, increased parameters reduces number of records Power Requirements Model 5030i: 100-240 VAC, 50-60 Hz (to be specified upon order) Pump: 115 VAC, 50-60 Hz, 4.25 A Maximum Power: 805 Watts (115V); 880 Watts (220-240V) Physical Dimensions W: 16.75” (42.5 cm) x D: 23” (58.4 cm) x H: 8.62” (21.9 cm) Weight: 40 lbs. (19 kg) Optional/Accessories 6-foot extension tubes Tripod Outdoor Ambient Shelter with HVAC 1-10 Model 5030i SHARP Instruction Manual Thermo Fisher Scientific Chapter 2 Installation The following installation procedures for the Model 5030i describes packaging, lifting the instrument, unpacking the instrument, setup and installation, including the sample tube and pump, and attaching the analog and/or digital outputs to a recording device. The installation should always be followed by instrument calibration as described in the “Calibration” chapter of this manual. This chapter provides the following recommendations and procedures for installing the instrument: Packaging and Transport Thermo Fisher Scientific ● “Packaging and Transport” on page 2-1 ● “Lifting” on page 2-2 ● “Unpacking and Inspection” on page 2-2 ● “Acceptance Testing and Startup Procedures” on page 2-3 ● “Setup” on page 2-10 ● “Connecting External Devices” on page 2-17 ● “Startup” on page 2-22 ● “Data Content” on page 2-23 ● “Shutdown” on page 2-23 ● “Important Tips” on page 2-23 The Model 5030i instrument, power cord, and operator manual are shipped in an ISTA 2A-certified packaging and all other items/accessories are shipped separately. The ISTA 2A-certified packaging is comprised of the instrument within an inner box which is secured within an outer box using foam end-caps and corner bracing. In this configuration, the packaging is ready for shipping by carrier domestically and internationally. Model 5030i SHARP Instruction Manual 2-1 Installation Lifting The inner box that the instrument resides in is an ISTA 1A-certified packaging and is appropriate for transporting the instrument on local paved roads to the monitoring site. Precautions should be taken to secure this package from shifting during local transport. Using the ISTA-2A packaging is strongly recommended for transporting the instrument over poor roads or on highways. Lifting When lifting the instrument, use a procedure appropriate to lifting a heavy object, such as bending at the knees while keeping your back straight and upright. Grasp the instrument at the bottom in the front and at the rear of the unit. Although one person may lift the unit, it is desirable to have two persons lifting, one by grasping the bottom in the front and the other by grasping the bottom in the rear. Equipment Damage Do not attempt to lift the instrument by the cover or other external fittings. ▲ Unpacking and Inspection If there is obvious damage to the shipping container when the instrument is received, notify the carrier immediately and hold for inspection. The carrier is responsible for any damage incurred during shipment. Use the following procedure to unpack and inspect the instrument. 1. Remove the instrument from its shipping container(s) and set it on a table or bench that allows easy access to both the front and rear. 2. Remove the cover to expose the internal components. 3. Remove the packing material in the analyzer (Figure 2–1). 2-2 Model 5030i SHARP Instruction Manual Thermo Fisher Scientific Installation Acceptance Testing and Startup Procedures Remove Packing (2 pieces) Units without Optional I/O Board Remove Packing (2 pieces) Units with Optional I/O Board Figure 2–1. Remove the Packing Material 4. Check for possible damage during shipment. 5. Check that all connectors and circuit boards are firmly attached. 6. Re-install the cover. 7. Remove any protective plastic material from the case exterior. 8. Remove the external pump from its shipping container and place next to the instrument. Acceptance Testing and Startup Procedures The Model 5030i has been bench tested and calibrated at the factory prior to shipping. The mass sensors, RH sensors, flowmeter temperature sensor, external ambient temperature sensor, barometric pressure, and volumetric flow rate have been calibrated to traceable standards. For a quick start, proceed immediately to the “Startup” procedures and skip the “Bench Acceptance Test”. To assure the best quality data, it is recommended that you perform an acceptance test. Furthermore, as part of a quality assurance program acceptance testing will be conducted prior to field installation. This is an excellent opportunity to compare the monitor to the primary and transfer standards utilized by the end-user within their specific monitoring Thermo Fisher Scientific Model 5030i SHARP Instruction Manual 2-3 Installation Acceptance Testing and Startup Procedures program. Furthermore, it is an opportunity to assure that the monitor is operating according to the manufacturer specifications. After acceptance testing, a completed monitoring installation will require final volumetric flow rate verification. Acceptance Test Prior to installing the Model 5030i, you should perform the acceptance testing procedures. These tests are conducted to evaluate the out-of-box performance of the instrument, perform any necessary calibrations prior to final site installation, and familiarize the user with the menu structure. Use the following procedure to perform the bench acceptance test. Equipment Required: Model 5030i Power Cord Ambient Temperature/RH Cable Assembly Vacuum Pump Assembly Flow Adapter Assembly NIST-traceable Thermometer NIST-traceable Hygrometer NIST-traceable Barometer NIST-traceable Manometer(s) NIST-traceable Volumetric Flow Transfer Standard (Do not use the heated sample tube assembly at this point.) 1. After unpacking the instrument place the Model 5030i and accessories onto a table or bench located within a stable indoor environment. Remove the side-panel cover and inspect the filter tape. Leave cover OFF until after acceptance testing has been completed. Note Prior to continuing with acceptance testing, the instrumentation and accessories should have sufficient time to equilibrate to room temperature due to temperature variations during shipping and/or storage. ▲ 2. Following a sufficient equilibration period, connect the power cord to the rear of the instrument and to a properly grounded power supply. 2-4 Model 5030i SHARP Instruction Manual Thermo Fisher Scientific Installation Acceptance Testing and Startup Procedures Note If the Model 5030i turns ON at this point, set the power switch to the OFF position and then proceed. ▲ 3. Connect the pump intake to the vacuum port mounted on the rear panel of the instrument using the 3/8-inch vacuum tubing assembly with the plastic T-fitting. Connect the pump exhaust tube to Port #2 on the 3-way solenoid on the rear panel. 4. Connect Port #1 of the rear panel 3-way solenoid to 3/8-inch compression fitting on the 5/8-inch x 3/8-inch reducing T-fitting using the 3/8-inch vacuum tubing assembly with HEPA filter. 5. Connect the vacuum pump power cord to the white circular grounded power supply, labeled PUMP, on the rear panel of the instrument. 6. Connect the 4-pin Temperature/RH cable to the 4-pin connector labeled RH/TEMP on the rear of the monitor. 7. Be sure that the pressure sensor calibration port toggle switches on the rear panel are pushed outward and away from the barbed +/- Delta P. 8. Set monitor power switch to the ON position. During startup, the iSeries splash screen will be shown followed by a mechanical filter tape change and a cycling of the pump power. To continue with the acceptance testing: ● From the Main Menu select Diagnostics > RH/Temperature. RH/TEMPERATURES: AMBIENT RH SAMPLE RH AMBIENT TEMP FLOW TEMP BOARD TEMP RANGE AVG 40.0 36.4 22.9 23.9 24.9 % % o C o C o Cª DIAGS ALARM The RH/Temperatures screen (read only) displays the current relative humidity in percent and the temperature readings in °C. The board temperature is the air temperature measured by a sensor located on the measurement interface board. Thermo Fisher Scientific Model 5030i SHARP Instruction Manual 2-5 Installation Acceptance Testing and Startup Procedures ● Press to return to the Diagnostics menu, and choose Pressure/Vacuum. PRESSURE/VACUUM: BAROMETRIC 760.1 mmHg VACUUM 60.5 mmHg FLOW 21.5 mmHg RANGE AVG DIAGS ALARM The Pressure/Vacuum screen (read only) displays the barometric, vacuum, and flow pressure readings in mmHg. The pressure is measured by a pressure transducer. The vacuum is the amount of vacuum under the filter tape. The flow pressure is the pressure differential across the orifice. Table 2–1. Pressure Units Conversion Pressure Conversions mmHg = atm x 0.75006 mmHg = inHg x 25.4 mmHg = hPa x 0.75006 Assuming adequate time has passed for thermal equilibration (approximately 1 hour), and the vacuum pump has been drawing room air into the instrument, compare the ambient temperature, sample temperature, and flow temperature to your NIST traceable thermometer placed at the inlet tube (see Figure 2–2). Note Please be sure that the pump exhaust or any other heat source is not influencing the sensor reading of the temperature/RH cable assembly. Please be sure the side panel has been removed for at least 60 minutes. ▲ 2-6 Model 5030i SHARP Instruction Manual Thermo Fisher Scientific Installation Acceptance Testing and Startup Procedures Ta Figure 2–2. Model 5030i Sampling Room Air Under Stable Conditions One-Point Temperature Verification Record the temperature sensor readings from the Model 5030i and compare to your NIST-traceable thermometer. Each of these measurements should be within ±2 °C tolerance of your NIST-traceable thermometer. Within this tolerance, the temperature sensors have passed the acceptance test. If the sensors are slightly out of tolerance (±3 °C), the acceptance test should be classified as marginal. If the sensor performance is outside this range, please perform a temperature sensor calibration. For more information about the temperature sensor calibration, see the “Calibration” chapter. One-Point RH Sensor Verification Record the ambient RH sensor and nephelometer RH sensor readings from the Model 5030i and compare to your NIST-traceable Hygrometer. The Model 5030i RH sensors should compare within ±2% RH tolerance of your NIST-traceable hygrometer. If the RH sensor performance is within this tolerance, the acceptance test has passed. Note The ambient temperature verification should be completed prior to performing the RH-sensor verification due to a thermal compensation applied to the RH-sensor. Furthermore, try to avoid RH comparisons <30% RH and >80% RH. ▲ Thermo Fisher Scientific Model 5030i SHARP Instruction Manual 2-7 Installation Acceptance Testing and Startup Procedures If the RH sensors are slightly out of tolerance, ±5% RH, the acceptance test should be classified as marginal. If the sensor performance is outside this range, please perform a RH-sensor calibration. For more information about the RH sensor calibration, see the “Calibration” chapter. It is recommended that the NIST-traceable hygrometer should also compare well with the RH-measurement used within a gravimetric laboratory that is part of a compliance program. One-Point Barometric Pressure Verification Record the Model 5030i barometric pressure sensor reading. This value is in units of mmHg. If necessary, using the pressure unit conversion (Table 2–1) to convert your NIST-traceable measurement to units of mmHg for an appropriate comparison. The Model 5030i barometric sensor should compare within ±10.0 mmHg tolerance of your NIST-traceable barometer. If the Model 5030i sensor performance is within this tolerance, the acceptance test has passed. If the sensor is slightly out of tolerance, ±12 mmHg, the acceptance test should be classified as marginal. If the sensor performance is outside this range, please perform a sensor calibration. For more information about the barometric pressure sensor calibration, see the “Calibration” chapter. One-Point Volumetric Flow Rate Verification The flow rate of the Model 5030i should be verified during this acceptance test. Prior to this test it is important for the previous temperature and pressure acceptance tests to be completed. Should the ambient temperature, flow temperature or barametric sensors require calibration, this should be done prior to the flow rate verification. ● Press to return to the Diagnostics menu, and choose Flows. FLOW: RANGE 16.67 LPM AVG DIAGS ALARM The Flow screen (read only) displays the volumetric flow rate in liters per minute. The flow is measured by the internal pressure board sensors. 2-8 Model 5030i SHARP Instruction Manual Thermo Fisher Scientific Installation Acceptance Testing and Startup Procedures Attach the small sample tube adapter to the Model 5030i inlet. Depending upon your NIST-traceable volumetric flow transfer standard (FTS), you may either attach your FTS now or add the flow audit adapter to accommodate any flexible tubing that your FTS may require. Allow 60 seconds to stabilize the flow after connecting. Record the Model 5030i Volumetric Flow Rate as Qm and the FTS flow rate as Qi, assuring that both are being recorded in units of actual liters per minute. Take three readings each from Qm and Qi and average the respective values. Use the following equation to calculate the percent difference: % D = 100 × Qm − Qi Qi If %D is within ±4%, then the Model 5030i volumetric flow rate acceptance test has passed. If the Model 5030i volumetric flow rate is slightly out of tolerance, ±5%, the acceptance test should be classified as marginal. If the volumetric flow rate performance is outside this range, please perform a volumetric flow calibration. For more information about the volumetric flow rate calibration, see the “Calibration” chapter. Leak Check Procedure Nephelometer Source Verification Nephelometer Zero Check Thermo Fisher Scientific The leak check of the 5030i SHARP is conducted by first measuring the volumetric flow rate at the inlet adapter. Next, place the factory-supplied leak check adapter on top of the inlet adapter and then install the flowmeter on top of the leak check adapter. Compare the volumetric flow rate of the 5030i to the flow meter and calculate the difference. If the difference is less than 0.80 L/min (80 ml/min) then the leak check passes. If it is greater than 80 ml/min, check for leaks in the system by checking the various fittings upstream of the measurement head. If the source of the leak cannot be found, the instrument requires service by a trained technician. The nephelometer light source has been factory set to a current of approximately 65 milliamps (mA). Should this valve be outside a range of 60–70 mA, the source current should be adjusted in the calibration menu. The 5030i has an auto-zero function and it is common during setup to potentially disturb the zero. To evaluate the zero of the 5030i, place a HEPA filter at the inlet for approximately five minutes, or until the concentration has stabilized. The nephelometer concentration should be ±1 μg/m³. If this is not the case, the HEPA filter should be removed, and a Model 5030i SHARP Instruction Manual 2-9 Installation Setup nephelometer zero should be conducted. After re-zeroing the nephelometer, repeat the zero check steps above. Setup Inlet System Setting up this monitor includes siting the monitor per local government agency requirements, creating a waterproof inlet system installation with vertical support, connecting the inlet system to the instrument through the dynamic heater system, connecting vacuum lines, establishing datalogging setting, and making the power connections. When siting the inlet system, it is best to first establish the instrument location and height within the air monitoring station. From whatever chosen surface the instrument is to rest on (rack or table top), add approximately 24 inches to that height to allow for overall height of the 5030i monitor. Next allow approximately 40 inches to attach the heated sample tube to the top of the 5030i via 5/8-inch OD tubing unions that use Teflon ferrules. Figure 2–3. Model 5030i Side View—inches [millimeters] It is also important to locate the roof flange installation in vertical alignment with the inlet of the instrument. By reviewing the top view drawing of the instrument (Figure 2–3), the roof flange must be centered in direct alignment with the 5/8-inch OD tube entering the 5030i instrument. 2-10 Model 5030i SHARP Instruction Manual Thermo Fisher Scientific Installation Setup Figure 2–4. Model 5030i Top View—inches [millimeters] Heater Once the x-y coordinates of the instrument and roof flange system are established and a waterproof flange system has been installed, perform a dry run by attaching the heated sample tube on top of the 5030i base. If the heated tube protrudes through the roof flange, either the instrument should be lowered or an elongated PVC sleeve and cap system should cover the heater while maintaining a waterproof seal. However, for the remainder of this description, it is assumed the heater will fit within the ceiling height of the air monitoring station. Based on the vertical height requirements, use additional 5/8-inch OD stainless tubing and connectors to make up the difference between the desired inlet height and the top of the heater. Additional routing is necessary for the ambient T/RH sensor assembly. Thermo Fisher Scientific Model 5030i SHARP Instruction Manual 2-11 Installation Setup Ambient Inlet (PM10 or PM2.5) Ambient T/RH Sensor Assembly T-Fitting Tripod Adapter T/RH Sensor Cable Tripod 5/8 S.S. Tubing 5/8 Union w/Teflon Ferrule 3 Ft Universal Heater HEPA Filter 3-Way Valve Exhaust Exhaust Intake Figure 2–5. Model 5030i Vertical View 2-12 Model 5030i SHARP Instruction Manual Thermo Fisher Scientific Installation Setup Sample Tube Extension Lengths There is one standard length of heated sample tube at one meter. Sample tube extensions are used for added height. Rack Mounting Option One limiting factor when siting the Model 5030i is placement within a standard 19-inch rack mounting. Future planning should be made to reserve the topmost rack mounting position available due to the vertical positioning of the sample tube directly from the roof into the top of the Model 5030i. In addition, modification to the rack cabinet to accommodate the vertical tubing connection also needs to be considered prior to installation. For more information, see Chapter 9 “Optional Equipment”. Review the following installation steps prior to field installation. Monitor Installation Once all height requirements are established, the following steps are usually taken to complete the installation. 1. Remove cover to the 5030i base instrument and inspect for proper filter tape installation. 2. Place 5030i unit in place of intended operation. 3. Attach the insulated heater tube assembly to the 5/8-inch OD tube on top of the 5030i (Figure 2–6). Thermo Fisher Scientific Model 5030i SHARP Instruction Manual 2-13 Installation Setup Tubing Connector Fasten Screws (2) Fasten Captive Hardware (2) To Rear Panel 5030i “H1” Fasten Nut SHARP Figure 2–6. Heater Assembly 4. Attach a second tubing connector to the top of the heater tube. 5. Carefully push additional 5/8-inch OD stainless steel tubing through the roof flange and then drop into the tubing union on top of the heater. 6. Any exposed 5/8-inch OD stainless steel tubing should be insulated with additional pipe insulation inside the shelter. 7. Sleeve any additional water tight capping over the tubing that now extends above the roof line. 8. Sleeve the white Delrin plastic tripod adapter over the 5/8-inch OD tubing to an appropriate height to accommodate the tripod and 2-14 Model 5030i SHARP Instruction Manual Thermo Fisher Scientific Installation Setup ambient T/RH sensor assembly. Tighten this adapter against the stainless steel tubing using the two setscrews. 9. Sleeve the tripod over the tripod adapter to a proper height and tighten. If using a tripod, using the adjustable legs of the tripod, plumb the inlet tube assembly. 10. Attach the white ambient T/RH sensor radiation shield assembly onto a portion of the exposed tripod adapter. 11. Attach and tighten the 5/8-inch to 3/8-inch reducing T-fitting to the 5/8-inch stainless steel tubing. 12. Place the PM10 or PM2.5 inlet into the 5/8-inch stainless T-fitting. 13. Feed one end of the black 25-foot T/RH cable trough he roof flange assembly and connect to the bottom of the ambient T/RH assembly. 14. Connect the other end of the T/RH cable to the back of the instrument (RH Temp). 15. Attach the heater power connector to HEATER 1. 16. Using the available 3/8-inch green vacuum tubing, connect the intake of the pump to the vacuum fitting at the rear panel of the 5030i. 17. Plug the pump power chord into the AC PUMP receptacle at the rear of the 5030i instrument. Thermo Fisher Scientific Model 5030i SHARP Instruction Manual 2-15 Installation Setup Heater Assembly 3-Ft. HEPA Filter RH Temperature Final Assembly H1 SHARP Electric Connection RH Zero In Exhaust Local PC Pump Power Pump Zero Air Make-up Figure 2–7. Rear Panel Plumbing Schematic 2-16 Model 5030i SHARP Instruction Manual Thermo Fisher Scientific Installation Connecting External Devices Connecting External Devices Several components are available for connecting external devices to iSeries instruments. These connection options include: ● Individual terminal board PCB assemblies (standard) ● Terminal block and cable kits (optional) ● Individual cables (optional) For detailed information on the optional connection components, refer to the “Optional Equipment” chapter. For associated part numbers, refer to “External Device Connection Components” on page 7-8. Terminal Board PCB Assemblies The terminal board PCB assemblies are circuit boards with a D-Sub connector on one side and a series of screw terminals on the other side. These assemblies provide a convenient mechanism for connecting wires from a data system to the analyzer’s I/O connectors. The following terminal board PCB assemblies are available for iSeries instruments: I/O Terminal Board ● I/O terminal board PCB assembly, 37 pin (standard) ● D/O terminal board PCB assembly, 37 pin (standard) ● 25-pin terminal board PCB assembly, (included with optional I/O expansion board) Figure 2–8 shows the recommended method for attaching the cable (customer supplied) to the terminal board using the included tie-down and spacer. Table 2–2 identifies the connector pins and associated signals. Note Not all of the I/O available in the instrument is brought out on the supplied terminal board. If more I/O is desired, an alternative means of connection is required. See optional “Terminal Block and Cable Kits”. ▲ Thermo Fisher Scientific Model 5030i SHARP Instruction Manual 2-17 Installation Connecting External Devices See Detail “B” See Detail “A” Component Side Viewed from Top of Board Detail “A” Detail “B” Assembled Connector Figure 2–8. I/O Terminal Board Views Table 2–2. I/O Terminal Board Pin Descriptions 2-18 Model 5030i SHARP Instruction Manual Screw Signal Description Screw Signal Description 1 Analog1 13 Power_Fail_NC 2 Analog ground 14 Power_Fail_COM 3 Analog2 15 Power_Fail_NO 4 Analog ground 16 TTL_Input1 5 Analog3 17 TTL_Input2 6 Analog ground 18 TTL_Input3 7 Analog4 19 TTL_Input4 8 Analog ground 20 Digital ground 9 Analog5 21 TTL_Input5 10 Analog ground 22 TTL_Input6 11 Analog6 23 TTL_Input7 12 Analog ground 24 Digital ground Thermo Fisher Scientific Installation Connecting External Devices The analog outputs are arranged on the rear panel connector as shown in Figure 2–9. See Table 2–3 for channels and pin connections. Figure 2–9. Pin-Out of Rear Panel Connector Table 2–3. Default Analog Outputs Channel Connector Pin I/O Terminal Pin Description 1 14 1 PM 2 33 3 AVG PM 3 15 5 NEPH 4 34 7 AVG NEPH 5 17 9 SHARP 6 36 11 AVG SHARP Ground 16, 18, 19, 35, 37 2, 4, 6, 8, 10, 12 Signal Ground Note All channels are user definable. If any customization has been made to the analog output configuration, the default selections may not apply. ▲ D/O Terminal Board Thermo Fisher Scientific Figure 2–10 shows the recommended method for attaching the cable (customer supplied) to the terminal board using the included tie-down and spacer. Table 2–4 identifies the connector pins and associated signals. Model 5030i SHARP Instruction Manual 2-19 Installation Connecting External Devices See Detail “A” See Detail “B” Component Side Viewed from Top of Board Detail “A” Detail “B” Assembled Connector Figure 2–10. D/O Terminal Board Views Table 2–4. D/O Terminal Board Pin Descriptions 25-Pin Terminal Board 2-20 Model 5030i SHARP Instruction Manual Screw Signal Description Screw Signal Description 1 Relay1_ContactA 13 Relay7_ContactA 2 Relay1_ContactB 14 Relay7_ContactB 3 Relay2_ContactA 15 Relay8_ContactA 4 Relay2_ContactB 16 Relay8_ContactB 5 Relay3_ContactA 17 Relay9_ContactA 6 Relay3_ContactB 18 Relay9_ContactB 7 Relay4_ContactA 19 Relay10_ContactA 8 Relay4_ContactB 20 Relay10_ContactB 9 Relay5_ContactA 21 (not used) 10 Relay5_ContactB 22 +24V 11 Relay6_ContactA 23 (not used) 12 Relay6_ContactB 24 +24V The 25-pin terminal board is included with the optional I/O Expansion Board. Figure 2–11 shows the recommended method for attaching the cable (customer supplied) to the terminal board using the included tie- Thermo Fisher Scientific Installation Connecting External Devices down and spacer. Table 2–5 identifies the connector pins and associated signals. See Detail “A” See Detail “B” Component Side Viewed from Top of Board Detail “A” Detail “B Assembled Connector Figure 2–11. 25-Pin Terminal Board Views Table 2–5. 25-Pin Terminal Board Pin Descriptions Thermo Fisher Scientific Screw Signal Description Screw Signal Description 1 IOut1 13 Analog_In1 2 Isolated ground 14 Analog_In2 3 IOut2 15 Analog_In3 4 Isolated ground 16 Ground 5 IOut3 17 Analog_In4 6 Isolated ground 18 Analog_In5 7 IOut4 19 Analog_In6 8 Isolated ground 20 Ground 9 IOut5 21 Analog_In7 10 Isolated ground 22 Analog_In8 11 IOut6 23 Ground 12 Isolated ground 24 Ground Model 5030i SHARP Instruction Manual 2-21 Installation Startup Power Connections Before the power is connected, be sure that the front panel power switch is OFF and be sure to verify that the local power matches the label on the back of the analyzer. WARNING The Model 5030i is supplied with a three-wire grounded power cord. Under no circumstances should this grounding system be defeated. ▲ Startup Use the following procedure when starting the instrument. 1. Turn the power ON and allow 12 hours for the beta detector to stabilize. 2. Although the instrument has been calibrated at the factory, if the instrument has been equilibrated, temperature sensors may be checked. (Assure that the heater is off and that the instrument is sampling room air at a constant temperature for at least 1-2 hours with the cover removed.) 3. After a 12-hour stabilization, the following steps should be performed: a. From the Main Menu, choose Instrument Controls. Under Instrument Controls: i. Flow should be set to 16.67 LPM ii. Heater Control should be set to RH with a RH Threshold of 50–58%. For lower RH threshold settings, please contact technical support. iii. Filter Tape mass limit should be set to 1,500 μg iv. Filter Tape–Next Time; this should have a start date v. Filter Tape Period should be set to 8 hours for PM2.5 and PM10. U.S. EPA applications may adjust this value as high as 24 hours for PM10 only. However, 8 hours is recommended for consistent performance. vi. Volumetric Conditions should be set to ACT for both Temp and Press vii. Lrecs and Srecs should be chosen for datalogging and all parameters should be selected in the order they appear from “Concentrations” to “Other Measurements”. Default Lrecs are 2-22 Model 5030i SHARP Instruction Manual Thermo Fisher Scientific Installation Data Content set to 60 minute logging with 30% memory and Srecs are 5minute logging with 70% memory allocated. If there are any changes, be sure to Commit Content. b. From the Main Menu, choose Service. Under Service: Note If Service Mode is not displayed, refer to “Accessing the Service Mode” on page 7-4, then return to the beginning of this step. ▲ i. Check/Calibrate Ambient Temperature, Nephelometer Temperature, and Flow Temperature ii. Check/Calibrate Nephelometer Ambient RH iii. Check Calibrate Barometric Pressure Span iv. Check/Calibrate Flow Calibration v. Perform a Beta Auto Detector Calibration (30 minutes) vi. Perform a Mass Foil Calibration (factory calibrated) vii. Mass Coefficients are set at the factory. viii. Perform a Nephelometer Zero Calibration (5 minutes) Data Content Shutdown Please use iPort to access data download from the instrument. Use the following procedure when shutting down the instrument. 1. Turn the power OFF. 2. Cover instrument ports when not in use. Important Tips Thermo Fisher Scientific DO NOT ● Do not pressurize the monitor. ● Do not allow liquids to enter the sample port. ● Do not expose the instrument to excessive vibration or magnetic interference. ● Do not remove/adjust the beta attenuation bench of the 5030i. ● Do not remove the C-14 radioactive source at any time. Model 5030i SHARP Instruction Manual 2-23 Installation Important Tips DO 2-24 Model 5030i SHARP Instruction Manual ● Operate the instrument in a climate-controlled environment (4–50 °C). ● Set DHCP to ON when changing the IP address. Thermo Fisher Scientific Chapter 3 Operation This chapter describes the front panel display screens, front panel pushbuttons, and menu-driven firmware. For details, see the following topics: Display Thermo Fisher Scientific ● “Display” on page 3-1 ● “Pushbuttons” on page 3-2 ● “Firmware Overview” on page 3-4 ● “Range Menu” on page 3-10 ● “Integration Time” on page 3-13 ● “24-Hour Average” on page 3-14 ● “Calibration Factors Menu” on page 3-14 ● “Instrument Controls Menu” on page 3-18 ● “Diagnostics Menu” on page 3-57 ● “Alarms Menu” on page 3-66 ● “Service Menu” on page 3-85 ● “Password Menu” on page 3-103 The 320 x 240 pixels graphics liquid-crystal display (LCD) shows the sample concentrations, instrument parameters, instrument controls, help, and error messages. Some menus contain more items than can be displayed and to move the cursor up at one time. For these menus, use and down to each item. Model 5030i SHARP Instruction Manual 3-1 Operation Pushbuttons Figure 3–1. Front Panel Display CAUTION If the LCD panel breaks, do not let the liquid crystal contact your skin or clothes. If the liquid crystal contacts your skin or clothes, wash it off immediately using soap and water. ▲ Pushbuttons The Pushbuttons allow the user to traverse the various screens/menus. Figure 3–2. Front Panel Pushbuttons 3-2 Model 5030i SHARP Instruction Manual Thermo Fisher Scientific Operation Pushbuttons Table 3–1 lists the front panel pushbuttons and their functions. Table 3–1. Front Panel Pushbuttons Key Name Function = Soft Keys The (soft keys) are used to provide shortcuts that allow the user to jump to user-selectable menu screens. For more information on processing soft keys, see “Soft Keys” below. = Run is used to display the Run screen. The Run The screen normally displays the current SHARP concentrations, but also has additional Run screens for ambient conditions, sample conditions, and mass sensor data. Press and to scroll through the different Run screens. = Menu The is used to display the Main Menu when in the Run screen, or back up one level in the menu system. For more information about the Main Menu, see “Main Menu” later in this chapter. = Help The is context-sensitive, that is, it provides additional information about the screen that is being displayed. Press for a brief explanation about the current screen or menu. Help messages are displayed using lower case letters to easily distinguish them from the operating screens. Press to return to the Run screen, or any other key to exit a help screen. = Up, Down = Left, Right = Enter Soft Keys , , , and The four arrow pushbuttons ( ) move the cursor up, down, left, and right or change values and states in specific screens. The is used to select a menu item, accept/set/save a change, and/or toggle on/off functions. The soft keys are multi-functional keys that use part of the display to identify their function. The function of the soft keys is to provide a shortcut to the most often used menus and screens. They are located directly underneath the display, and user-defined labels in the lower part of the display indicate the function of each key at that time. To change a soft key, place the menu cursor “>” on the item of the selected menu or screen you wish to set. Press followed by the selected soft key within 1 second of pressing the right-arrow key. The “edit soft key prompt” will be displayed for configuration of the new label. Note Not all menu items may be assigned to soft keys. If a particular menu or screen item cannot be assigned, the key assignment screen will not come up upon entering right-arrow-soft key combinations. All items under the Service menu (including the menu itself) cannot be assigned soft keys. ▲ Thermo Fisher Scientific Model 5030i SHARP Instruction Manual 3-3 Operation Firmware Overview EDIT SOFT KEY PROMPT: CURRENTLY: RANGE RANGE ABCDEFGHIJKLMN BKSP OPQRSTUVWXYZ PAGE 0123456789 ./- SAVE RANGE AVG DIAGS ALARM Programmable Soft Key Labels Alphanumeric Entry Screen The alphanumeric entry screen is used to enter strings consisting of letters, numbers, and other characters. The cursor may be positioned within the and keys. If a character is entered over an entry line using the existing character, that character will be overwritten. Use the and keys to switch between the entry line and the keyboard as well as to move within the keyboard. To select a character to add to the string, use the cursor keys to position the cursor over the desired character, and then key to add that character to the entry line. press the On the right side of the keyboard are special functions. BKSP is used to move the cursor in the entry line one place to the left, deleting the character that was to the left of the cursor and moving any character at or to the right of the cursor one place to the left. PAGE is used to change the keyboard character page. For the English language, this switches between upper and lower-case alphabetic characters. SAVE stores the string from the entry line into the parameter. Alternately, if the active cursor is moved to the entry line, may be pressed to store the string from the entry line into the parameter. Entry Line Keyboard ● ANGE ABCDEFGHIJKLMN ● OPQRSTUVWXYZ 0123456789 ./● RANGE Firmware Overview 3-4 Model 5030i SHARP Instruction Manual AVG ● BKSP PAGE SAVE DIAGS ALARM ANGE abcdefghijklmn opqrstuvwxyz 0123456789 ./RANGE AVG BKSP PAGE SAVE DIAGS ALARM The Model 5030i utilizes the menu-driven firmware as illustrated by the flowchart in Figure 3–3. The Power-Up screen, shown at the top of the flowchart, is displayed each time the instrument is turned on. This screen is displayed while the instrument is warming up and performing self-checks. After the warm-up period, the Run screen is automatically displayed. The Run screen normally displays the current SHARP concentrations, but also has additional Run screens for ambient conditions, sample conditions, and mass sensor data. From the Run screen, the Main Menu can be displayed by pressing . The Main Menu contains a list of submenus. Each Thermo Fisher Scientific Thermo Fisher Scientific Integration Time Conc Units SHARP Range Set Custom Ranges Range Avg SHARP Avg Time 24Hr Averages SHARP Bkg SHARP Coef Neph Bkg Neph Mode Stdby Sample Cal Span Values Restore Prev Values Calibration Factors Measurement Mode Set Flow/Pump Set Heater Control Off RH Temp RH Threshold Temp Threshold Filter Tape Control Manual Bench Tape Mass Limit Next Time Start Date/Time Period Counter Tape/Zero Ratio Volumetric Conditions Temperature Pressure Datalogging Settings Select SREC/LREC View Logged Data Erase Log Select Content Commit Content Reset to Default Content Configure Datalogging Communication Settings Serial Settings Instrument ID Communication Protocol Streaming Data Config TCP/IP Settings I/O Config Output Relay Settings 1-10 Digital Input Settings 1-16 Analog Output Config All Voltage Channels All Current Channels Voltage Channel 1-6 Current Channel 1-6 Screen Contrast Service Mode (on/off) Date/Time Timezone Instrument Controls Main Menu Run Screens Self Test Screen Power-up Screen Alarms Service Program Versions Alarms Detected RH/TEMP Calibration Voltages Instrument Alarms Ambient RH Motherboard Filter Tape Counter Ambient Temp Interface Board Filter Tape Change Sample Temp I/O Board Bench Flow Temp Pres/Vacuum Calibration Detector Board Motherboard Status Nephelometer Board Interface Status Baro Press RH/Temperatures I/O EXP Status Vac/Flow Detector Alarms Flow Calibration Ambient RH Sample RH Board Status Auto Ambient Temp Alpha Manual Mass Calibration Sample Temp Beta Neph Alarms Flow Temp Thermal Coefficient Board Temp Board Status Vacuum Coefficient Pressure/Vacuum Neph Sample Baro Coefficient Barometric Neph Cal Mass Coefficient Vacuum Neph Temp Alpha Eff Coefficient Detector Calibration Flow Neph RH Flows LED Current Auto Detector Status Ref Det Volt Manual RH/Temperature Alarms Neph Calibration Mass Alpha Ambient RH Neph RH Beta Sample RH Neph Temp Beta Corr Ambient Temp Neph SRC Level Analog Out Calibration Beta Ref Sample Temp Nephelometer Status Flow temp Voltage Channel 1-6 NEPH Temp Board Temp Current Channel 1-6 Pressure/Vacuum Alarms Analog Input Calibration NEPH RH LED Current Baro Pres Input Channel 1-8 Display Pixel test Ref Detector Vacuum CRn Restore User Defaults Flow Analog Input Readings Flow Alarms Restore Factory Defaults Conc Alarms IN 1-8 Analog Input Voltages Analog In 1-8 Digital Inputs Input 1-16 Relay States Output 1-10 Test Analog Outputs ALL Voltage Channel 1-6 Instrument Configuration I/O Expansion Board Detector A Detector B Contact Info Diagnostics Set Password Lock Instrument Change Password Remove Password Unlock Password Password Operation Firmware Overview submenu contains related instrument settings. This chapter describes each submenu and screen in detail. Refer to the appropriate sections for more information. Figure 3–3. Flowchart of Menu-Driven Firmware Model 5030i SHARP Instruction Manual 3-5 Operation Firmware Overview Power-Up Screen The Power-Up screen is displayed when power is applied to the Model 5030i. This screen is displayed while the internal components are warming up and diagnostic checks are being performed. Please wait while booting... Run Screens The Run screens display the SHARP concentration, ambient conditions, sample conditions, and mass sensor data. The status bar displays the time (24-hour format), the password (lock) icon, service (wrench) icon, alarm (bell) icon, and optional zero/span sample solenoid valve status, if installed. Status Bar Icons The password (lock) icon indicates that no parameter changes can be made from the front panel. The alarm (bell) icon indicates that an alarm is active. The service (wrench) icon indicates that the instrument is in the service mode. 3-6 Model 5030i SHARP Instruction Manual Thermo Fisher Scientific Operation Firmware Overview The Run screen normally displays the current SHARP concentrations, but also has additional Run screens for ambient conditions, sample conditions, and mass sensor data. Pressing and will scroll through the different Run screens. Status Bar X CONCENTRATION μg/ m3 6.1 .2 SHARP 12:34 Status Bar RANGE Ambient Conditions Run Screen AVG x Concentration Mass Units PPM Status Bar Icons DIAGS ALARM The Ambient Conditions Run screen displays the real-time volumetric flow rate at the inlet, the ambient temperature, the barometric pressure, and the ambient relative humidity. Status Bar X AMBIENT CONDITIONS o T AMB P BAR RH AMB 12:34 Status Bar RANGE W 16.67LPM C 25.0mm 760.0Hg.2 40.0%% FLOW Thermo Fisher Scientific W AVG x PPM Status Bar Icons DIAGS ALARM Model 5030i SHARP Instruction Manual 3-7 Operation Firmware Overview Sample Conditions Run Screen The Ambient Conditions Run screen displays the sample filter temperature, the sample filter relative humidity, the differential pressure across the orifice, and the vacuum under the filter tape. Title Bar X SAMPLE CONDITIONS 25.0 C 40.0%mm 20.0Hg .2 mm 65.0Hg % o TFLOW RHSMP PFLOW PVAC 12:34 Status Bar RANGE Mass Sensor Data Run Screen W AVG x PPM Status Bar Icons DIAGS ALARM The Mass Sensor Data Run screen displays the real-time beta counts during attenuation and the initial beta counts from a fresh filter spot. Title Bar X MASS SENSOR DATA BRAW W 9800.21/s BZERO 10000.91/sPPM 12:34 Status Bar RANGE 3-8 Model 5030i SHARP Instruction Manual AVG x Status Bar Icons DIAGS ALARM Thermo Fisher Scientific Operation Firmware Overview Hybrid Data Run Screen The Hybrid Data Run screen displays the mass concentration values from the rea-time beta attenuation method (PM) and the real-time nephelometer method (NEPH). These values are entered into the dynamic digital filtering algorithm to calibrate the nephelometer in real-time. Title Bar X HYBRID DATA μg/ PM 19.4m3 NEPH 22.7μg/ m3 PPM NEPH Status Bar RANGE Main Menu Thermo Fisher Scientific W 12:34 AVG x Status Bar Icons DIAGS ALARM The Main Menu contains a number of submenus. Instrument parameters and settings can be read and modified within the submenus according to their function. The concentration appears above the Main Menu and submenus in every screen. The Service menu is visible only when the instrument is in service mode. For more information on the service mode, see “Service Mode” later in this chapter. ● Use and to move the cursor up and down. ● Press ● Press to return to the Main Menu or Run screen. to make a selection. to return to the Model 5030i SHARP Instruction Manual 3-9 Operation Range Menu XXLO WCONCENTRATIONXXLO SHARP 15.0 µg/m3 3 x 12:34 MAIN MENU: >RANGE INTEGRATION TIME 24HR AVERAGE CALIBRATION FACTORS INSTRUMENT CONTROLS DIAGNOSTICS ALARMS RANGE W AVG x ª DIAGS ALARM SERVICE PASSWORD Range Menu The Range menu allows the operator to select the concentration units, PM standard ranges, and to set the custom ranges. ● In the Main Menu, choose Range RANGE: >CONC UNITS XSHARP RANGE SET CUSTOM RANGES RANGE Concentration Units AVG μg/m3 10000 3 DIAGS ALARM The Concentration Units screen defines how the particles concentration readings are expressed. Concentration units of micrograms per cubic meter (μg/m3) and milligrams per cubic meter (mg/m3) are available. When switching the selected units, the instrument’s analog ranges all default to the highest range. For example, when switching from mg/m3 to μg/m3, the ranges default to 10000 μg/m3. Therefore, whenever you change units, you should also check the range settings. Note If the units change, the instrument should be re-calibrated. A display warning will appear. ▲ ● 3-10 Model 5030i SHARP Instruction Manual In the Main Menu, choose Range > Conc Units. Thermo Fisher Scientific Operation Range Menu CONC UNITS: CURRENTLY: SET TO: mg/m3 μg/m3 ? 3 ©ª CHANGE VALUE RANGE SHARP Range AVG SAVE DIAGS ALARM The SHARP Range screen defines the concentration range of the analog outputs. For example, a SHARP range of 0–100 μg/m3 sets the analog output to concentrations between 0 and 100 μg/m3 by default. The display shows the current SHARP range. The next line of the display is used to change the range. Table 3–2 lists the standard ranges. ● In the Main Menu, choose Range > SHARP Range. SHARP RANGE: CURRENTLY: SET TO: 100.0 1000 ? ©ª CHANGE VALUE SAVE VALUE RANGE AVG DIAGS ALARM Table 3–2. Standard Ranges mg/m3 μg/m3 0.1 100 1.0 1000 2.0 2000 3.0 3000 5.0 5000 10.00 10000 C1 C1 C2 C2 C3 C3 C1, C2, and C3 are custom ranges. For more information about custom ranges, see “Set Custom Ranges” below. Thermo Fisher Scientific Model 5030i SHARP Instruction Manual 3-11 Operation Range Menu The analog outputs are arranged on the rear panel connector as shown in Figure 3–4. See Table 3–3 for channels and pin connections. Figure 3–4. Pin-Out of Rear Panel Connector Table 3–3. Default Analog Outputs Channel Connector Pin I/O Terminal Pin Description 1 14 1 PM 2 33 3 Neph 3 15 5 Flow 4 34 7 Ambient Temperature 5 17 9 Flow Temperature 6 36 11 Ambient Relative Humidity Ground 16, 18, 19, 35, 37 2, 4, 6, 8, 10, 12 Signal Ground Note All channels are user definable. If any customization has been made to the analog output configuration, the default selections may not apply. ▲ Set Custom Ranges 3-12 Model 5030i SHARP Instruction Manual The Set Custom Ranges menu lists three custom ranges, which are userdefined. In the mg/m3 mode, any value between 0.1 mg/m3 and 10.00 mg/m3 can be specified as a range. In the μg/m3 mode, any value between 100 μg/m3 and 10000 μg/m3 can be specified as a range. Thermo Fisher Scientific Operation Integration Time ● In the Main Menu, choose Range > Set Custom Ranges. CUSTOM RANGES: >CUSTOM RANGE 1 CUSTOM RANGE 2 CUSTOM RANGE 3 RANGE Custom Ranges AVG 555.6 1875.0 8125.0 DIAGS ALARM The Custom Ranges screen is used to define the custom ranges. The display shows the current custom range. The next line of the display is used to set the range. For more information about selecting ranges, see “SHARP Range” above. ● In the Main Menu, choose Range > Set Custom Ranges > Custom Range 1, 2, or 3. CUSTOM RANGE 1: CURRENTLY: 555.6 SET TO: 000555.7 ? §¨ MOVE CURSOR ©ª CHANGE VALUE SAVE RANGE Integration Time AVG DIAGS ALARM The Integration Time screen allows the user to adjust the compounded averaging of the beta attenuation mass and concentration. The default value should be set to 20 minutes and may be adjusted between 15–60 minutes. The display shows the current integration time is set to 15. The next line of the display is used to change the integration time. ● In the Main Menu, choose Integration Time. INTEGRATION TIME: CURRENTLY: SET TO: 15 MIN 20 MIN? ©ª CHANGE VALUE SAVE VALUE RANGE Thermo Fisher Scientific AVG DIAGS ALARM Model 5030i SHARP Instruction Manual 3-13 Operation 24-Hour Average 24-Hour Average The 24-Hour Average screen defines a start time during which concentration measurement is averaged over a daily 24-hours period. The average concentration of the primary readings are calculated for that time period and averaged out. A new 24-hour average concentration is displayed once per day. The display shows the current 24-hour average SHARP concentration. The next line of the display is used to change the 24-hour averaging time. ● In the Main Menu, choose 24HR Averages. 24HR AVERAGE: PM NEPH SHARP >START TIME RANGE 24-Hour Average Start Time AVG 9999 9999 9999 00:00 DIAGS ALARM The 24-Hour Average Start Time screen allows the user to adjust the 24hour averaging start time. ● In the Main Menu, choose 24HR Averages > Avg Time. 24HR AVERAGE START TIME: CURRENTLY: 00:00 SET TO: 01:00 ? ¨ SET HOURS ©ª CHANGE VALUE SAVE RANGE Calibration Factors Menu AVG DIAGS ALARM Calibration factors are determined during automatic and manual calibration and are used to correct the concentration readings. The Calibration Factors menu displays the calibration factors as shown below. The instrument can also be calibrated manually using this menu. For more information about calibration, see Chapter 4, “Calibration”. The calibration factors for the SHARP BKG (offset) and SHARP COEF (slope) are set to 0.0 and 1.0 by default. Should regional settings require an adjustment to these values that DO NOT compromise regulatory approvals for this instrument, those values can be adjusted at this point. ● 3-14 Model 5030i SHARP Instruction Manual In the Main Menu, choose Calibration Factors. Thermo Fisher Scientific Operation Calibration Factors Menu CALIBRATION FACTORS: >PM BKG 0.0 PM COEF 1.000 SHARP BKG 0.0 SHARP COEF 1.000 NEPH BKG VALUES RANGE AVG DIAGS ALARM NEPH COEF PM Background 0.000 The PM Background screen allows the user to manually adjust the PM Intercept. The PM concentration based on the SET BKG TO is displayed to facilitate the setting. The PM concentration displayed in the Run portion of the screen is NOT affected by the SET BKG until the value is saved. ● In the Main Menu, choose Calibration Factors > PM Bkg. PM BACKGROUND: CURRENTLY: SET TO: 0.0 xxxxx0.7 ? §¨ MOVE CURSOR ©ª CHANGE VALUE SAVE RANGE PM Coefficient AVG DIAGS ALARM The PM Coefficient screen allows the user to manually adjust the PM coefficient. The PM concentration based on the SET COEF TO is displayed to facilitate setting. The PM concentration displayed in the Run portion of the screen is NOT affected by the SET COEF until the value is saved. ● In the Main Menu, choose Calibration Factors > PM Coef. PM COEFFICIENT: CURRENTLY: SET TO: 1.000 1.02 ? §¨ MOVE CURSOR ©ª CHANGE VALUE SAVE RANGE Thermo Fisher Scientific AVG DIAGS ALARM Model 5030i SHARP Instruction Manual 3-15 Operation Calibration Factors Menu SHARP Background The SHARP Background screen allows the user to manually adjust the SHARP Intercept. The SHARP concentration based on the SET BKG TO is displayed to facilitate the setting. The SHARP concentration displayed in the Run portion of the screen is NOT affected by the SET BKG until the value is saved. ● In the Main Menu, choose Calibration Factors > SHARP Bkg. SHARP BACKGROUND: CURRENTLY: 0.0 SET TO: xxxxx0.7 ? §¨ MOVE CURSOR ©ª CHANGE VALUE SAVE RANGE SHARP Coefficient AVG DIAGS ALARM The SHARP Coefficient screen allows the user to manually adjust the SHARP coefficient. The SHARP concentration based on the SET COEF TO is displayed to facilitate setting. The SHARP concentration displayed in the Run portion of the screen is NOT affected by the SET COEF until the value is saved. ● In the Main Menu, choose Calibration Factors > SHARP Coef. SHARP COEFFICIENT: CURRENTLY: 1.000 SET TO: 1.02 ? §¨ MOVE CURSOR ©ª CHANGE VALUE SAVE RANGE Nephelometer Background Values Model 5030i SHARP Instruction Manual DIAGS ALARM The Nephelometer Backgrounds are determined during automatic and manual calibration and are used to maintain a stable zero. The nephelometer background menu is shown below. The instrument can also be calibrated manually using this menu. For more information about calibration, see Chapter 4, “Calibration”. ● 3-16 AVG In the Main Menu, choose Calibration Factors > Neph Bkg Values. Thermo Fisher Scientific Operation Calibration Factors Menu NEPHELOMETER BKG: >NEPH MODE VALUES RESTORE PREV VALUES RANGE Nephelometer Mode AVG DIAGS ALARM The Nephelometer Mode screen allows the user to place the nephelometer into one of three modes. Available modes are Sample, Zero, and Stdby. The sample mode begins photometric detection. The zero mode begins a zeroing process that will begin with a filter tape change and the standby mode (Stdby) mode will stall any measurement by the nephelometer. ● In the Main Menu, choose Calibration Factors > Neph Bkg > Neph Mode. NEPHELOMETER MODE: CURRENTLY: STDBY SET TO: SAMPLE ? ©ª CHANGE VALUE SAVE VALUE RANGE Values In the Main Menu, choose Calibration Factors > Neph Bkg > Values. 1 2 3 4 5 BEFORE 0.00278 0.00278 0.01119 0.04452 0.17809 RANGE AVG AFTER 0.00277 0.00277 0.01122 0.04459 0.17808 DIAGS ALARM The Restore Previous Values screen is used to restore the prior background values should a poor zero occur. ● Thermo Fisher Scientific DIAGS ALARM The Values screen displays the optional background for each range of the nephelometer. These values can be control-charted by the user to help evaluate any optional drift. ● Restore Previous Values AVG In the Main Menu, choose Calibration Factors > Neph Bkg > Restore Prev Values. Model 5030i SHARP Instruction Manual 3-17 Operation Instrument Controls Menu ● RESTORE PREV BKG VALUES? ● RESTORE ● RESTORE PREV BKG VALUES? RESTORE ARE YOU SURE YOU WANT TO?x PRESS ¨ TO CONFIRM RESTORE ● RANGE Nephelometer Coefficient AVG ● DIAGS ALARM RANGE AVG DIAGS ALARM The Nephelometer Coefficient screen allows the user to manually adjust the Nephelometer coefficient. The Nephelometer concentration based on the SET COEF TO is displayed to facilitate setting. The Nephelometer concentration displayed in the Run portion of the screen is NOT affected by the SET COEF until the value is saved. ● In the Main Menu, choose Calibration Factors > Neph Coef. NEPH COEFFICIENT: CURRENTLY: 227.346 SET TO: 232.500 ? §¨ MOVE CURSOR ©ª CHANGE VALUE SAVE RANGE Instrument Controls Menu Model 5030i SHARP Instruction Manual DIAGS ALARM The Instrument Controls menu contains a number of items that may be selected to control various instrument operational parameters. The firmware controls listed in this menu enable control of the listed instrument functions. ● 3-18 AVG In the Main Menu, choose Instrument Controls. Thermo Fisher Scientific Operation Instrument Controls Menu INSTRUMENT CONTROLS: >SET FLOW/PUMP SET HEATER FILTER TAPE CONTROL VOLUMETRIC CONDITIONS DATALOGGING SETTINGS RANGE AVG ª DIAGS ALARM COMMUNICATION SETTINGS I/O CONFIGURATION SCREEN CONTRAST SERVICE MODE DATE/TIME TIMEZONE Set Flow/Pump The Set Flow/Pump menu allows the user to manually adjust the flow values, and to change the operating state of the pump to ON or OFF. ● In the Main Menu, choose Instrument Controls > Set Flow/Pump. FLOW/PUMP: >FLOW PUMP RANGE Flow AVG 16.67 ON DIAGS ALARM The Flow screen is used to view and adjust the flow. ● In the Main Menu, choose Instrument Controls > Set Flow/Pump > Flow. FLOW: CURRENTLY: SET TO: 16.67 LPM 16.67 LPM? ©ª INC/DEC SAVE VALUE RANGE Pump DIAGS ALARM The Pump screen allows the user to toggle the pump to either ON or OFF. ● Thermo Fisher Scientific AVG In the Main Menu, choose Instrument Controls > Set Flow/Pump > Pump. Model 5030i SHARP Instruction Manual 3-19 Operation Instrument Controls Menu PUMP: CURRENTLY: SET TO: ON OFF ? TOGGLE VALUE RANGE Set Heater AVG DIAGS ALARM The Set Heater menu allows the user to set the status of the heater, RH threshold, and temperature threshold in various modes. ● In the Main Menu, choose Instrument Controls > Set Heater. HEATER: >CONTROL RH THRESHOLD TEMP THRESHOLD RANGE Control AVG DIAGS ALARM The Control screen is used to set the status of the heater to either ON/OFF, RH threshold, or TEMP threshold. ● In the Main Menu, choose Instrument Controls > Set Heater > Control. HEATER CONTROL: CURRENTLY: SET TO: ©ª CHANGE VALUE RANGE RH Threshold Model 5030i SHARP Instruction Manual AVG OFF RH ? SAVE DIAGS ALARM The RH Threshold screen is used to change the RH threshold value in percent. The RH threshold is typically compatible with the gravimetric method being used for comparison. ● 3-20 OFF 40 % 30 oC In the Main Menu, choose Instrument Controls > Set Heater > RH Threshold. Thermo Fisher Scientific Operation Instrument Controls Menu RH THRESHOLD: CURRENTLY: SET TO: 65 % 35 %? ©ª INC/DEC SAVE VALUE RANGE Temperature Threshold AVG DIAGS ALARM The Temperature Threshold screen is used to change the temperature threshold value. ● In the Main Menu, choose Instrument Controls > Set Heater > Temp Threshold. TEMP THRESHOLD: CURRENTLY: SET TO: 25 30 o o C C? ©ª INC/DEC SAVE VALUE RANGE Filter Tape Control AVG DIAGS ALARM The Filter Tape Control menu allows the user to manually move or set the next time period for tape control. ● In the Main Menu, choose Instrument Controls > Filter Tape Control. FILTER TAPE CONTROL: >MANUAL MASS LIMIT 1,500 μg NEXT TIME 05MAY08 00:00 PERIOD 8 HRS COUNTER 0 RANGE Manual DIAGS ALARM The Manual screen allows the user to move or stop the filter tape and open or close the measurement bench. ● Thermo Fisher Scientific AVG In the Main Menu, choose Instrument Controls > Filter Tape Control > Manual. Model 5030i SHARP Instruction Manual 3-21 Operation Instrument Controls Menu MANUAL: >BENCH(S) TAPE CLOSE STOP TOGGLE VALUE RANGE Mass Limit AVG DIAGS ALARM The Mass Limit screen allows the user to set the mass limit. The default is 1,500 μg (or 1.5 mg) and is specified as part of any U.S. EPA and TUV approvals. However, the limit can be increased as much as 5,000 μg for non-regulatory monitoring. ● In the Main Menu, choose Instrument Controls > Filter Tape Control > Mass Limit. MASS LIMIT: CURRENTLY: SET TO: 1500 1501 ? §¨ MOVE CURSOR ©ª CHANGE VALUE SAVE RANGE Next Time AVG The Next Time screen is used to view and set the initial date and time (24hour format) for the next filter tape change. ● In the Main Menu, choose Instrument Controls > Filter Tape Control > Next Time. ● START DATE AND TIME: 05 MAY 2008 00:00 ● PRESS TO EDIT ● ● RANGE Period 3-22 Model 5030i SHARP Instruction Manual DIAGS ALARM AVG ● DIAGS ALARM START DATE AND TIME: 01 NOV 2008 00:00 ? SETTING: DAYS ¨ SET MONTHS ©ª CHANGE VALUE SAVE VALUE RANGE AVG DIAGS ALARM The Period screen allows the user to set the period. The next filter tape change would be scheduled after the number of hours the period is set for. The official tape change for TUV and U.S. EPA for PM2.5 and PM10 is set for 8 hours. Thermo Fisher Scientific Operation Instrument Controls Menu ● In the Main Menu, choose Instrument Controls > Filter Tape Control > Period. PERIOD: CURRENTLY: SET TO: 24 HRS 000008 HRS? §¨ MOVE CURSOR ©ª CHANGE VALUE SAVE RANGE Counter AVG DIAGS ALARM The Counter screen allows the user to record the current filter tape count and reset the tape count to zero. ● In the Main Menu, choose Instrument Controls > Filter Tape Control > Counter. FILTER TAPE COUNTER: 0 RESET TO ZERO RANGE Tape/Zero Ratio AVG DIAGS ALARM The Tape/Zero Ratio screen allows the user to set the occurrence of nephelometer zeroing after X filter changes. For PM2.5 X = 42 and for PM10 X = 14 based on a 2-week zeroing cycle. A conservative ratio of 1:1 will zero the nephelometer with every filter tape change. ● In the Main Menu, choose Instrument Controls > Filter Tape Control > Tape/Zero Ratio. TAPE/NEPH ZERO RATIO: CURRENTLY: 1:1 SET TO: 2:1 ? ©ª CHANGE VALUE SAVE VALUE RANGE Thermo Fisher Scientific AVG DIAGS ALARM Model 5030i SHARP Instruction Manual 3-23 Operation Volumetric Conditions Volumetric Conditions The Volumetric Conditions menu allows the user to turn temperature/pressure compensation on and off and to set the standard pressure and temperature values in various modes. ● In the Main Menu, choose Instrument Controls > Volumetric Conditions. VOLUMETRIC CONDITIONS: >TEMPERATURE ACT PRESSURE STD RANGE Temperature Compensation AVG DIAGS ALARM The Temperature screen is used to turn the temperature correction to actual or standard. ● Press to toggle and set the temperature compensation to actual or standard. TEMPERATURE: >COMPENSATION STANDARD RANGE Standard Temperature AVG ACT 25 oC DIAGS ALARM The Standard Temperature screen is used to set the standard temperature. ● In the Main Menu, choose Instrument Controls > Volumetric Conditions > Temperature > Standard. STANDARD TEMPERATURE: CURRENTLY: 25 SET TO: 0.0 o o C C ? ©ª INC/DEC SAVE VALUE RANGE 3-24 Model 5030i SHARP Instruction Manual AVG DIAGS ALARM Thermo Fisher Scientific Operation Volumetric Conditions Pressure Compensation The Pressure Compensation screen is used to turn the pressure correction to actual or standard. ● Press standard. to toggle and set the pressure compensation to actual or PRESSURE: >COMPENSATION STANDARD RANGE Standard Pressure AVG 760 mmHg 760 mmHg DIAGS ALARM The Standard Pressure screen is used to set the standard pressure. ● In the Main Menu, choose Instrument Controls > Volumetric Conditions > Pressure > Standard. STANDARD PRESSURE: CURRENTLY: ACT SET TO: 760 mmHg ? ©ª INC/DEC SAVE VALUE RANGE Datalogging Settings AVG DIAGS ALARM The iSeries instruments include a built-in datalogging capability as a standard feature. The operator is allowed to create two different types of records, which for historical reasons, are named lrecs and srecs. Each record can contain up to 32 different fields, or data items, and records can be created at user-defined intervals ranging from 1 to 60 minutes. Record generation is tied to the instrument’s real-time clock. For example, if the logging period for srecs is set to 30 minutes, a new srec will be generated on every hour and every half hour (10:00, 10:30, 11:00 …). Lrecs and srecs function independent of each other. So, for example, an srec containing just the current SHARP level could be generated every 5 minutes while an lrec containing a full set of diagnostic data could be generated once every hour. The analyzer's computer system includes three megabytes of flash memory which is enough to store a full lrec containing 32 data items and a full srec Thermo Fisher Scientific Model 5030i SHARP Instruction Manual 3-25 Operation Volumetric Conditions containing 32 items once each minute for a week (>20,000 total records). If logging is limited to the minimum content of date, time, SHARP concentration and error flags, the analyzer can store data once each minute for 4 months (>190,000 total records). The Datalogging Settings menu allows the user flexibility in how data is stored and recorded. ● In the Main Menu, choose Instrument Controls > Datalogging Settings. DATALOGGING: >SELECT SREC/LREC VIEW LOGGED DATA ERASE LOG SELECT CONTENT COMMIT CONTENT RANGE AVG SREC ª DIAGS ALARM RESET TO DEFAULT CONTENT CONFIGURE DATALOGGING Select Srec/Lrec The Select Srec/Lrec screen is used to select the log record type for other operations in this menu. ● In the Main Menu, choose Instrument Controls > Datalogging Settings > Select Srec/Lrec. SELECT LOG TYPE: CURRENTLY: SET TO: SREC LREC ? TOGGLE VALUE RANGE View Logged Data Model 5030i SHARP Instruction Manual DIAGS ALARM The View Logged Data screen is used to select the starting point to view the logged data by the number of records or by date and time. Note that both types of records cannot be viewed at the same time, only the selected record type. ● 3-26 AVG In the Main Menu, choose Instrument Controls > Datalogging Settings > View Logged Data. Thermo Fisher Scientific Operation Volumetric Conditions SELECT START POINT BY: SET TO: # OF RECS ©ª CHANGE RANGE Number of Records AVG ACCEPT DIAGS ALARM The Number of Records screen is used to select the number of records to view, ending with the most recent. It also shows the total number of records that have been logged for the selected record type. SET # BACK FROM CURRENT: 0000000 TOTAL LRECS: 20 §¨ MOVE CURSOR ©ª CHANGE VALUE SAVE RANGE AVG DIAGS ALARM The Record Display screen (read only) displays the selected records. time date 10:01 01/20/09 10:02 01/20/09 10:03 01/20/09 10:04 01/20/09 ©ª PGUP/DN §¨ RANGE Date and Time AVG flags 8105151 8105151 8105151 8105151 PAN L/R DIAGS ALARM The Date and Time screen is used to set a start date and time for which to view logged data. For example, if “20 Jan 2009 10:00” is entered, then the first logged data record that is displayed is the first record after this time. If set to one minute logging, this would be at “20 Jan 2009 10:01”. DATE AND TIME: 20 JAN 2009 10:00 ©ª CHG DAYS ¨ SET CURSOR TO MONTHS ACCEPT AS SHOWN RANGE Thermo Fisher Scientific AVG DIAGS ALARM Model 5030i SHARP Instruction Manual 3-27 Operation Volumetric Conditions The Record Display screen (read only) displays the selected records. time date 10:01 01/20/09 10:02 01/20/09 10:03 01/20/09 10:04 01/20/09 ©ª PGUP/DN §¨ RANGE Erase Log AVG flags 8105151 8105151 8105151 8105151 PAN L/R DIAGS ALARM The Erase Log screen is used to erase all saved data for the selected record type only (not both srecs and lrecs). ● In the Main Menu, choose Instrument Controls > Datalogging Settings > Erase Log. ● ERASE LREC LOG FILE DATA? ● ERASE ● ERASE LREC LOG FILE DATA? ERASE ARE YOU SURE YOU WANT TO?x PRESS ¨ TO CONFIRM ERASURE ● RANGE Select Content AVG ● Model 5030i SHARP Instruction Manual RANGE AVG DIAGS ALARM The Select Content submenu displays a list of 32 record fields to use to configure the data to be logged. When a field is selected, a submenu list appears of the items to choose from to assign to those fields. Item types are Concentrations, Other Measurements, and Analog Inputs (if the I/O expansion board is installed). These record fields comprise a temporary list of items for the selected record type that must be committed via the datalogging menu before the changes will apply. Note that committing any changes to this list will erase all currently logged data for the selected record type only, as the format of the stored data is changed. ● 3-28 DIAGS ALARM In the Main Menu, choose Instrument Controls > Datalogging Settings > Select Content. Thermo Fisher Scientific Operation Volumetric Conditions LREC FIELDS: >FIELD 1 FIELD 2 FIELD 3 FIELD 4 FIELD 5 RANGE Choose Field Data AVG SHARP AVG SHARP FLOW VOL AMB RH BARO PRESS ª DIAGS ALARM The Choose Field Data submenu displays a list of the types of data that can be logged for the current field. Choices are Concentrations, Other Measurements, and Analog Inputs (if the I/O expansion board is installed). ● In the Main Menu, choose Instrument Controls > Datalogging Settings > Select Content > Field 1–32. DATA IN SREC FIELD 1: >CONCENTRATIONS OTHER MEASUREMENTS ANALOG INPUTS RANGE Concentrations AVG DIAGS ALARM The Concentrations screen allows the user to assign one of the concentrations to the selected record field. The currently selected item is shown by “<--” after it. Note that at this point, pressing indicates that these are proposed changes as opposed to implemented changes. To change the selected record format and erase record log file data, see “Commit Content” below. The display shows the current heater for the mode selected (PM). ● In the Main Menu, choose Instrument Controls > Datalogging Settings > Select Content > select Field > Concentrations. CONCENTRATIONS: >NONE PM AVG PM NEPH SHARP RANGE AVG <-- DIAGS ALARM AVG SHARP AVG NEPH Thermo Fisher Scientific Model 5030i SHARP Instruction Manual 3-29 Operation Volumetric Conditions Other Measurements The Other Measurements screen allows the user to assign one of the other available measurement types to the selected record field. The currently selected item is shown by “<--” after it. Items displayed are determined by the options installed. For Common Flags and Detector A Flags, see Figure 3–5 and Figure 3–6 for data descriptions. Note that at this point, pressing indicates that these are proposed changes as opposed to implemented changes. To change the selected record format and erase record log file data, see “Commit Content” below. ● In the Main Menu, choose Instrument Controls > Datalogging Settings > Select Content > select Field > Other Measurements. OTHER MEASUREMENTS: >NONE BARO PRES VACUUM FLOW PRES AMB RH RANGE AVG ª DIAGS ALARM SAMP RH AMB TEMP BRD TEMP FLOW TEMP FLOW VOL BETA BETA RAW ALPHA RAW MASS BETA ZERO EXT ALARMS NEPH TEMP NEPH RH NEPH IRED NEPH REF BETA REF COMMON FLAGS DET FLAGS MASS COMP 3-30 Model 5030i SHARP Instruction Manual Thermo Fisher Scientific Operation Volumetric Conditions Figure 3–5. Common Flags Figure 3–6. Detector A Flags Analog Inputs Thermo Fisher Scientific The Analog Inputs screen allows the user to select the parameter (none or analog inputs 1–8) to the selected record field. The selected item is shown Model 5030i SHARP Instruction Manual 3-31 Operation Volumetric Conditions by “<--” after it. Note that at this point, pressing indicates that these are proposed changes as opposed to implemented changes. To change the selected record format and erase record log file data, see “Commit Content” below. ● In the Main Menu, choose Instrument Controls > Datalogging Settings > Select Content > select Field > Analog Inputs. ANALOG INPUTS: >NONE ANALOG IN 1 ANALOG IN 2 ANALOG IN 3 ANALOG IN 4 RANGE Commit Content AVG ª DIAGS ALARM The Commit Content screen is used to save any changes that have been made to any of the record fields for the selected record type. Saving changes will erase record log file data for that record type. If no changes have been made “NO CHANGES TO RECORD LIST!” will appear. For more information about selecting the content of logged data fields, see “Select Content” above. ● In the Main Menu, choose Instrument Controls > Datalogging Settings > Commit Content. ● CHANGE LREC DATA AND ERASE LREC LOG FILE DATA? ● COMMIT ● CHANGE LREC DATA AND ERASE LREC LOG FILE DATA? COMMIT ARE YOU SURE YOU WANT TO?x PRESS ¨ TO CONFIRM ERASURE ● RANGE Reset to Default Content AVG ● Model 5030i SHARP Instruction Manual RANGE AVG DIAGS ALARM The Reset to Default Content screen is used to reset all of the datalogging record field items to default values for the selected record type. For more information about selecting the content of logged data fields, see “Select Content” above. ● 3-32 DIAGS ALARM In the Main Menu, choose Instrument Controls > Datalogging Settings > Reset to Default Content. Thermo Fisher Scientific Operation Volumetric Conditions RESET LREC ●DATA AND ERASE LREC LOG FILE DATA? ● RESET ● RESET LREC DATA AND ERASE LREC LOG FILE DATA? RESET ARE YOU SURE YOU WANT TO?x PRESS ¨ TO CONFIRM RESETxx ● RANGE Configure Datalogging AVG DIAGS ALARM RANGE AVG DIAGS ALARM The Configure Datalogging menu deals with datalogging configuration for the currently selected record type. ● In the Main Menu, choose Instrument Controls > Datalogging Settings > Configure Datalogging. DATALOGGING SETTINGS: >LOGGING PERIOD MIN 60 MEMORY ALLOCATION % 50 DATA TREATMENT AVG FLAG STATUS DATA ON RANGE Logging Period Min AVG DIAGS ALARM The Logging Period Min screen is used to select the logging period in minutes for the selected record format (srec or lrec). List of choices include: off, 1, 5, 15, 30, and 60 minutes (default). ● In the Main Menu, choose Instrument Controls > Datalogging Settings > Configure Datalogging > Logging Period Min. SET PERIOD FOR SREC: CURRENTLY: 5 MIN SET TO: OFF ? ©ª CHANGE VALUE RANGE Memory Allocation Percent Thermo Fisher Scientific AVG SAVE DIAGS ALARM The Memory Allocation Percent screen is used to select the percentage of total memory that may be used by the selected record type (lrecs or srecs). Percentages between 0 and 100% are available in increments of 10. Changing this value results in log erasure for both types of records, and changing the percent allocated to one record type will automatically change the other. Model 5030i SHARP Instruction Manual 3-33 Operation Volumetric Conditions ● In the Main Menu, choose Instrument Controls > Datalogging Settings > Configure Datalogging > Memory Allocation %. ● SET PERCENT LRECS: CURRENTLY:● SET TO: 50% 30% ? ● ©ª CHANGE VALUE ● RANGE Data Treatment AVG ● SAVE DIAGS ALARM SET PERCENT LRECS: CURRENTLY: 50% SET TO: 30% ? THIS WILL ERASE ALL LOGS!x PRESS ¨ TO CONFIRM CHANGE RANGE AVG DIAGS ALARM The Data Treatment screen is used to select the data type for the selected record type: whether the data should be averaged over the interval, the minimum or maximum measured during the interval, or the current value (last value measured). Data treatment doesn’t apply to all data, just to the concentration measurement. All other data points log the current value at the end of the interval. Note This feature is found in all iSeries instruments, but it is recommended that the data type be set to ONLY the current value (cur), as the datalogging averaging is done in addition to the normal concentration averaging. ▲ ● In the Main Menu, choose Instrument Controls > Datalogging Settings > Configure Datalogging > Data Treatment. SET LREC DATA TYPE: CURRENTLY: AVG SET TO: CUR ©ª CHANGE VALUE RANGE Flag Status Data Model 5030i SHARP Instruction Manual SAVE DIAGS ALARM The Flag Status Data screen is used to set the flag status data to either ON or OFF for the selected record type. ● 3-34 AVG ? In the Main Menu, choose Instrument Controls > Datalogging Settings > Configure Datalogging > Flag Status Data. Thermo Fisher Scientific Operation Volumetric Conditions SET LREC FLAG STATUS DATA: CURRENTLY: OFF SET TO: ON ? ©ª CHANGE VALUE RANGE Communication Settings AVG SAVE DIAGS ALARM The Communication Settings menu is used for communications control and configuration. ● In the Main Menu, choose Instrument Controls > Communication Settings. COMMUNICATION SETTINGS: >SERIAL SETTINGS INSTRUMENT ID GESYTEC SERIAL NO COMMUNICATION PROTOCOL STREAMING DATA CONFIG RANGE AVG ª DIAGS ALARM TCP/IP SETTINGS Serial Settings The Serial Setting submenu is used for serial communications control and configuration. ● In the Main Menu, choose Instrument Controls > Communication Settings > Serial Settings. SERIAL SETTINGS: >BAUD RATE DATA BITS PARITY STOP BITS RS-232/485 SEL RANGE Baud Rate DIAGS ALARM The Baud Rate screen is used to set the RS-232/RS-485 interface baud rate. Baud rates of 1200, 2400, 4800, 9600, 19200, 38400, 57600, and 115200 are available. The analyzer’s default baud rate is set to 9600 to provide backwards compatibility with the older C-series analyzers. ● Thermo Fisher Scientific AVG 9600 8 NONE 1 RS-232 In the Main Menu, choose Instrument Controls > Communication Settings > Serial Settings > Baud Rate. Model 5030i SHARP Instruction Manual 3-35 Operation Volumetric Conditions BAUD RATE: CURRENTLY: SET TO: 9600 19200 ? ©ª CHANGE VALUE SAVE VALUE RANGE Data Bits AVG DIAGS ALARM The Data Bits screen is used to set the number of serial data bits to either 7 or 8 (default). ● In the Main Menu, choose Instrument Controls > Communication Settings > Serial Settings > Data Bits. DATA BITS: CURRENTLY: SET TO: 8 7 ? ©ª CHANGE VALUE SAVE VALUE RANGE Parity AVG DIAGS ALARM The Parity screen is used to select the parity bit for the serial port to None (default), Even, or Odd. ● In the Main Menu, choose Instrument Controls > Communication Settings > Serial Settings > Parity. PARITY: CURRENTLY: SET TO: NONE ODD ? ©ª CHANGE VALUE SAVE VALUE RANGE Stop Bits Model 5030i SHARP Instruction Manual DIAGS ALARM The Stop Bits screen is used to set the number of stop bits for the serial port to 1 (default) or 2. ● 3-36 AVG In the Main Menu, choose Instrument Controls > Communication Settings > Serial Settings > Stop Bits. Thermo Fisher Scientific Operation Volumetric Conditions STOP BITS: CURRENTLY: SET TO: 1 2 ? ©ª CHANGE VALUE SAVE VALUE RANGE RS-232/RS-485 Selection AVG DIAGS ALARM The RS-232/RS-485 Selection screen allows the user to choose between the RS-232 or RS-485 specification for serial communication. Equipment Damage Disconnect the serial cable before changing the RS232 and RS-485 selection to prevent damage to any equipment currently connected to the analyzer. ▲ ● In the Main Menu, choose Instrument Controls > Communication Settings > Serial Settings > RS-232/485 Selection. ● RS-232/RS-485 SELECT: XXXXXX** WARNING **XXXXXXX ● DISCONNECT THE SERIALX X CABLES BEFORE CHANGING X ● THE SELECTION!XXXXXX TO CONTINUE ● RANGE Instrument ID AVG ● RANGE AVG DIAGS ALARM The Instrument ID screen allows the operator to edit the instrument ID number. The ID is used to identify the instrument when using the C-Link or MODBUS protocols to control the instrument or collect data. It may be necessary to edit the ID number if two or more instruments of the same model are connected to one computer. Valid instrument ID numbers are from 0 to 127. The Model 5030i has a default instrument ID of 14. For more information about the instrument ID, see Appendix B “C-Link Protocol” or Appendix C “MODBUS Protocol”. ● Thermo Fisher Scientific DIAGS ALARM RS-232/RS-485 SELECT: CURRENTLY: RS-232 SET TO: RS-485 ? MAKE SURE THAT THE CABLEXX IS OFF: PRESS ¨ TO CONFIRM TOGGLE VALUE In the Main Menu, choose Instrument Controls > Communication Settings > Instrument ID. Model 5030i SHARP Instruction Manual 3-37 Operation Volumetric Conditions INSTRUMENT ID: CURRENTLY: SET TO: 14 16 ? ©ª CHANGE VALUE SAVE VALUE RANGE Gesytec Serial Nunber AVG DIAGS ALARM The Gesytec Serial Number screen is used to set the serial number for the Gesytec protocol. The Gesytec serial number defaults to zero. For more information about the serial number, see Appendix D, “Gesytec (BH) Protocol”. ● In the Main Menu, choose Instrument Controls > Communication Settings > Gesytec Serial No. GESYTEC SERIAL NO: CURRENTLY: SET TO: 0 1 ? ©ª CHANGE VALUE SAVE VALUE RANGE Communication Protocol AVG DIAGS ALARM The Communication Protocol screen is used to change the protocol for serial communications. Possible choices include: C-Link, MODBUS, Gesytec, and Streaming Data. ● In the Main Menu, choose Instrument Controls > Communication Settings > Communication Protocol. COMMUNICATION PROTOCOL: CURRENTLY: CLINK SET TO: STREAMING ? ©ª CHANGE VALUE SAVE VALUE RANGE AVG DIAGS ALARM Streaming Data Configuration The Streaming Data Configuration menu is used to allow for configuration of the 8 streaming data output items, streaming interval, current data format, and current timestamp setting. The Choose Stream Data submenu displays a list of the analog output signal group choices to choose from. 3-38 Model 5030i SHARP Instruction Manual Thermo Fisher Scientific Operation Volumetric Conditions Choices are Concentrations, Other Measurements, and Analog Inputs (if the I/O expansion board option is installed). ● In the Main Menu, choose Instrument Controls > Communication Settings > Streaming Data Config. STREAMING DATA CONFIG >INTERVAL 10 SEC ADD LABELS NO PREPEND TIMESTAMP YES ADD FLAGS YES ITEM 1 PM ª RANGE Streaming Data Interval AVG DIAGS ALARM The Streaming Data Interval screen is used to adjust how frequently a new record will be generated. The following interval times are available: 1, 2, 5, 10, 20, 30, 60, 90, 120, 180, 240, and 300 seconds. ● In the Main Menu, choose Instrument Controls > Communication Settings > Streaming Data Config > Interval. STREAMING DATA INTERVAL: CURRENTLY: 10 SEC SET TO: 20 SEC ? ©ª CHANGE VALUE SAVE VALUE RANGE AVG DIAGS ALARM Note Add Labels, Prepend Timestamp, and Add Flags are toggle items that change between yes or no when selected. ▲ Choose Stream Data The Choose Stream Data screen displays a list of the types of data that can be sent via streaming data. Choices are Concentrations, Other Measurements, and Analog Inputs (if the I/O expansion board is installed). ● Thermo Fisher Scientific In the Main Menu, choose Instrument Controls > Communication Settings > Streaming Data Config > Item 1–8. Model 5030i SHARP Instruction Manual 3-39 Operation Volumetric Conditions CHOOSE STREAM DATA: >CONCENTRATIONS OTHER MEASUREMENTS ANALOG INPUTS RANGE Concentrations AVG DIAGS ALARM The Concentrations screen allows the user to assign one of the concentrations to the selected streaming data item. The currently selected item is shown by “<--” after it. Once an item is selected, pressing will save the selected streaming data item. ● In the Main Menu, choose Instrument Controls > Communication Settings > Streaming Data Config > select Item > Concentrations. CONCENTRATIONS: >NONE PM AVG PM NEPH SHARP RANGE AVG <-- DIAGS ALARM AVG SHARP AVG NEPH Other Measurements The Other Measurements screen allows the user to assign one of the other available measurement types to the selected streaming data item. The currently selected item is shown by “<--” after it. Once an item is selected, pressing will save the selected streaming data item. For Common Flags and Detector A Flags, see Figure 3–5 and Figure 3–6 for data descriptions. ● 3-40 Model 5030i SHARP Instruction Manual In the Main Menu, choose Instrument Controls > Communication Settings > Streaming Data Config > select Item > Other Measurements. Thermo Fisher Scientific Operation Volumetric Conditions OTHER MEASUREMENTS: >NONE BARO PRES VACUUM FLOW PRES AMB RH RANGE AVG ª DIAGS ALARM SAMP RH AMB TEMP BRD TEMP FLOW TEMP FLOW VOL BETA BETA RAW ALPHA RAW MASS BETA ZERO EXT ALARMS NEPH TEMP NEPH RH NEPH IRED NEPH REF BETA REF COMMON FLAGS DET FLAGS MASS COMP Analog Inputs The Analog Inputs screen allows the user to assign an analog input signal (none or analog inputs 1–8) to the selected streaming data item. The currently selected item is shown by “<--” after it. Once an item is selected, pressing will save the selected streaming data item. ● In the Main Menu, choose Instrument Controls > Communication Settings > Streaming Data Config > select Item > Analog Inputs. ANALOG INPUTS: >NONE ANALOG IN 1 ANALOG IN 2 ANALOG IN 3 ANALOG IN 4 RANGE TCP/IP Settings AVG ª DIAGS ALARM The TCP/IP Settings menu is used for defining parameters that are required for Ethernet communications. Note The instrument power must be cycled after any of these parameters have been changed for the change to take effect. ▲ Thermo Fisher Scientific Model 5030i SHARP Instruction Manual 3-41 Operation Volumetric Conditions ● In the Main Menu, choose Instrument Controls > Communication Settings > TCP/IP Settings. TCP/IP SETTINGS: >USE DHCP OFF IP ADDR 10.209.40.149 NETMASK 255.255.252.0 GATEWAY 10.209.42.1 HOST NAME ISERIESª RANGE AVG NTP SVR Use DHCP DIAGS ALARM 10.209.43.237 The Use DHCP screen is used to specify whether to use Dynamic Host Configuration Protocol (DHCP) or not. When DHCP is enabled, the network dynamically provides an IP address for the instrument. ● In the Main Menu, choose Instrument Controls > Communication Settings > TCP/IP Settings > Use DHCP. DHCP: CURRENTLY: SET TO: OFF ON ? TOGGLE VALUE CYCLE POWER TO CHANGE DHCP RANGE IP Address AVG DIAGS ALARM The IP Address screen is used to edit the IP address. The IP address can only be changed when DHCP is off. If DHCP is on, the instrument will respond with “NOT SETTABLE IF DHCP IS ON”. For more information on DHCP, see “Use DHCP” above. ● In the Main Menu, choose Instrument Controls > Communication Settings > TCP/IP Settings > IP Addr. IP ADDRESS: CURRENT: 10.209.40.149 SET TO: 10.209.40.149 1 §¨ MOVE CURSOR ©ª CHANGE VALUE SAVE VALUE RANGE 3-42 Model 5030i SHARP Instruction Manual AVG DIAGS ALARM Thermo Fisher Scientific Operation Volumetric Conditions Netmask The Netmask screen is used to edit the netmask. The netmask is used to determine the subnet on which the instrument can directly communicate to other devices. The netmask can only be changed when DHCP is off. If DHCP is on, the instrument will respond with “NOT SETTABLE IF DHCP IS ON”. For more information on DHCP, see “Use DHCP” above. ● In the Main Menu, choose Instrument Controls > Communication Settings > TCP/IP Settings > Netmask. NETMASK: CURRENT: 255.255.252.0 SET TO: 255.255.252.0 0 §¨ MOVE CURSOR ©ª CHANGE VALUE SAVE VALUE RANGE Default Gateway AVG DIAGS ALARM The Default Gateway screen is used to edit the gateway address. The default gateway can only be changed when DHCP is off. If DHCP is on, the instrument will respond with “NOT SETTABLE IF DHCP IS ON”. For more information on DHCP, see “Use DHCP” above. Any traffic to addresses that are not on the local subnet will be routed through this address. ● In the Main Menu, choose Instrument Controls > Communication Settings > TCP/IP Settings > Gateway. DEFAULT GATEWAY: CURRENT: 10.209.42.1 SET TO: 10.209.42.1 1 §¨ MOVE CURSOR ©ª CHANGE VALUE SAVE VALUE RANGE Host Name DIAGS ALARM The Host Name screen is used to edit the host name. When DHCP is enabled, this name is reported to the DHCP server. ● Thermo Fisher Scientific AVG In the Main Menu, choose Instrument Controls > Communication Settings > TCP/IP Settings > Host Name. Model 5030i SHARP Instruction Manual 3-43 Operation Volumetric Conditions HOST NAME: CURRENT: ISERIES ISERIES SSSSS ? ABCDEFGHIJKLMN BKSP OPQRSTUVWXYZ PAGE 0123456789 ./- SAVE RANGE Network Time Protocol Server AVG DIAGS ALARM The Network Time Protocol (NTP) Server screen is used to edit the IP address of the NTP server. An NTP server may be used to periodically synchronize the instrument’s real-time clock with a standard. More information about the NTP servers and a list of public servers may be found at http://www.ntp.org. ● In the Main Menu, choose Instrument Controls > Communication Settings > TCP/IP Settings > NTP Svr. NTP SERVER IP ADDRESS: CURRENT: 10.209.43.237 SET TO: 10.209.43.237 1 §¨ MOVE CURSOR ©ª CHANGE VALUE SAVE VALUE RANGE I/O Configuration AVG DIAGS ALARM The I/O Configuration menu deals with configuration of the analyzer’s I/O system. The analog input configuration is displayed only if the I/O expansion board option is installed. ● In the Main Menu, choose Instrument Controls > I/O Configuration. I/O CONFIGURATION: >OUTPUT RELAY SETTINGS DIGITAL INPUT SETTINGS ANALOG OUTPUT CONFIG ANALOG INPUT CONFIG RANGE Output Relay Settings 3-44 Model 5030i SHARP Instruction Manual AVG DIAGS ALARM The Output Relay Settings menu displays a list of the 10 digital output relays available, and allows the user to select the logic state and instrument parameter for the relay selected. Thermo Fisher Scientific Operation Volumetric Conditions Note The digital outputs may take up to one second after the assigned state occurs to show up on the outputs. ▲ ● In the Main Menu, choose Instrument Controls > I/O Configuration > Output Relay Settings. OUTPUT RELAY SETTINGS: >1 NOP CONC ALARM 2 NOP LOCAL/REMOTE 3 NOP UNITS 4 NOP GEN ALARM 5 NOP NONE ª RANGE Logic State AVG DIAGS ALARM The Logic State menu item is used to change the selected I/O relay to either normally open or normally closed. The default state is open, which indicates that a relay connected between the digital output pin and ground is normally open and closes to trigger the digital output action. ● Press to toggle and set the logic state to normally open or normally closed. OUTPUT RELAY SETUP: >LOGIC STATE INSTRUMENT STATE RANGE Instrument State AVG OPEN DIAGS ALARM The Instrument State submenu allows the user to select the instrument state that is assigned to the selected relay output. A submenu lists signal types of either alarms or non-alarm to choose from. ● In the Main Menu, choose Instrument Controls > I/O Configuration > Output Relay Settings > select Relay > Instrument State. CHOOSE SIGNAL TYPE: >ALARMS NON-ALARM RANGE Thermo Fisher Scientific AVG DIAGS ALARM Model 5030i SHARP Instruction Manual 3-45 Operation Volumetric Conditions Alarms The Alarms screen allows the user to select an alarm status for the selected relay output. The currently selected item is shown by “<--” after it. The I/O board status alarm is only present if the I/O expansion board is installed. ● In the Main Menu, choose Instrument Controls > I/O Configuration > Output Relay Settings > select Relay > Instrument State > Alarms. ALARM STATUS ITEMS: >NONE GEN ALARM CONC ALARM INST ALARMS DET ALARMS RANGE AVG <-ª DIAGS ALARM NEPH ALARMS RH/TEMP ALARMS PRES/VAC ALARMS FLOW ALARMS Non-Alarm The Non-Alarm screen allows the user to select a non-alarm status for the selected relay output. The currently selected item is shown by “<--” after it. ● In the Main Menu, choose Instrument Controls > I/O Configuration > Output Relay Settings > select Relay > Instrument State > NonAlarm. NON ALARM STATUS ITEMS: >NONE LOCAL/REMOTE SERVICE UNITS RANGE Digital Input Settings AVG DIAGS ALARM The Digital Input Settings menu displays a list of the 16 digital inputs available, and allows the user to select the logic state and instrument parameter for the relay selected. Note The digital inputs must be asserted for at least one second for the action to be activated. ▲ 3-46 Model 5030i SHARP Instruction Manual Thermo Fisher Scientific Operation Volumetric Conditions Not all of the I/O available in the instrument are brought out on the supplied terminal board. If more I/O is desired, an alternative means of connection is required. (See optional “Terminal Block and Cable Kits”.) ▲ ● In the Main Menu, choose Instrument Controls > I/O Configuration > Digital Input Settings. DIGITAL INPUT SETTINGS: >1 NOP AOUTS TO FS 2 NOP AOUTS TO ZERO 3 NOP PUMP CNTRL 4 NOP PRES CNTRL 5 NOP NONE ª RANGE Logic State AVG DIAGS ALARM The Logic State menu item is used to change the selected I/O relay to either normally open or normally closed. The default state is open, which indicates that a relay connected between the digital input pin and ground is normally open and closes to trigger the digital input action. ● Press to toggle and set the logic state to normally open or normally closed. DIGITAL INPUT SETUP: >LOGIC STATE OPEN INSTRUMENT ACTION RANGE Instrument Action DIAGS ALARM The Instrument Action submenu allows the user to choose the instrument action that is assigned to the selected digital input. ● Thermo Fisher Scientific AVG In the Main Menu, choose Instrument Controls > I/O Configuration > Digital Input Settings > select Relay > Instrument Action. Model 5030i SHARP Instruction Manual 3-47 Operation Volumetric Conditions CHOOSE ACTION: >NONE AOUTS TO ZERO AOUTS TO FS FT COUNT FT CNTRL RANGE AVG <-ª DIAGS ALARM PUMP CNTRL TEMP CNTRL PRES CNTRL HT CNTRL A RH/TEMP CNTRL ALARM 1 ALARM 2 ALARM 3 Analog Output Configuration The Analog Output Configuration menu displays a list of the analog (Select Channel) output channels available for configuration. Channel choices include all voltage channels, all current channels, individual voltage channels 1–6, and individual current channels 1–6 (if the I/O expansion board option is installed). ● In the Main Menu, choose Instrument Controls > I/O Configuration > Analog Output Config. OUTPUT CHANNELS: >ALLOW OVER/UNDER RANGE ALL VOLTAGE CHANNELS ALL CURRENT CHANNELS VOLTAGE CHANNEL 1 VOLTAGE CHANNEL 2 RANGE Allow Over/Under Range Model 5030i SHARP Instruction Manual DIAGS ALARM The Allow Over/Under Range screen is used to select whether or not the analog outputs are allowed to exceed the maximum selected value of 100 mV, 1 V, 5 V, 10 V, or 20 mA or the minimum selected value of 0 V, 0 mA, or 4 mA. By default, this parameter is set to on and 5% over and under range is allowed for all analog output channels. ● 3-48 AVG ª In the Main Menu, choose Instrument Controls > I/O Configuration > Analog Output Config > Allow Over/Under Range. Thermo Fisher Scientific Operation Volumetric Conditions ALLOW OVER/UNDER RANGE: CURRENTLY: ON SET TO: OFF ? TOGGLE VALUE RANGE Analog Output Configuration (Select Action) AVG DIAGS ALARM The Analog Output Configuration menu displays a list of the analog output configuration choices, from which the user selects the parameter to adjust for the selected output channel. Configuration choices include selecting range, setting minimum/maximum values, and choosing the signal to output. ● In the Main Menu, choose Instrument Controls > I/O Configuration > Analog Output Config > All Voltage Channels, All Current Channels, Voltage Channel 1–6 or Current Channel 1–6. ANALOG OUTPUT CONFIG: >SELECT RANGE SET MINIMUM VALUE SET MAXIMUM VALUE CHOOSE SIGNAL TO OUTPUT RANGE Select Range AVG DIAGS ALARM The Select Range screen is used to select the hardware range for the selected analog output channel. Possible ranges for the voltage outputs are: 0-100 mV, 0-1, 0-5, and 0-10 V. Possible ranges for the current outputs are: 0-20 mA and 4-20 mA. ● In the Main Menu, choose Instrument Controls > I/O Configuration > Analog Output Config > select Channel > Select Range. SELECT OUTPUT RANGE: SELECTED OUTPUT: V ALL CURRENTLY: 0-10V SET TO: 0-100mV ? ©ª CHANGE VALUE RANGE Minimum and Maximum Value Thermo Fisher Scientific AVG SAVE DIAGS ALARM The Minimum and Maximum Value screens are used to edit the zero (0) and full-scale (100) values, respectively, in percentages for the selected Model 5030i SHARP Instruction Manual 3-49 Operation Volumetric Conditions analog output channel. See Table 3–4 for a list of choices. The minimum and maximum output value screens function the same way. The following example shows the set minimum value screen. ● In the Main Menu, choose Instrument Controls > IO Configuration > Analog Output Config > select Channel > Set Minimum or Maximum Value. MINIMUM OUTPUT PERCENT: SELECTED OUTPUT: V ALL CURRENTLY: N/A % SET TO: 0000.5 % ? ©ª CHANGE VALUE RANGE AVG SAVE DIAGS ALARM Table 3–4. Analog Output Zero to Full-Scale 3-50 Model 5030i SHARP Instruction Manual Output Zero (0)% Value Full-Scale 100% Value PM Zero (0) Range Setting AVG PM Zero (0) Range Setting Neph Zero (0) Range Setting SHARP Zero (0) Range Setting AVG SHARP Zero (0) Range Setting AVG Neph Zero (0) Range Setting Barometer Pressure User-set alarm min value User-set alarm max value Vacuum User-set alarm min value User-set alarm max value Flow Pressure User-set alarm min value User-set alarm max value Ambient RH User-set alarm min value User-set alarm max value Sample RH User-set alarm min value User-set alarm max value Ambient Temp User-set alarm min value User-set alarm max value Board Temp User-set alarm min value User-set alarm max value Flow Temp User-set alarm min value User-set alarm max value Flow Vol User-set alarm min value User-set alarm max value Beta User-set alarm min value User-set alarm max value Beta Raw User-set alarm min value User-set alarm max value Alpha Raw User-set alarm min value User-set alarm max value Mass -200 5,000 Beta Zero 0 65,000 Thermo Fisher Scientific Operation Volumetric Conditions Choose Signal to Output Output Zero (0)% Value Full-Scale 100% Value External Alarms 0 7,000 Neph Temp User-set alarm min value User-set alarm max value Neph RH User-set alarm min value User-set alarm max value Neph IRED User-set alarm min value User-set alarm max value Neph Ref 350 2000 Beta Ref 0 65,000 Mass Comp 0 100 The Choose Signal to Output screen displays a list of the analog output signal choices. Choices are grouped into three categories: Concentrations, Other Measurements, and Analog Inputs (if the I/O expansion board option is installed). This allows the user to select the output signal that will be assigned to each analog channel. The Concentrations screen is shown below. See Table 3–5 for a list of items for each signal group choice. ● In the Main Menu, choose Instrument Controls > I/O Configuration > Analog Output Config > select Channel > Choose Signal to Output. CHOOSE SIGNAL TYPE: >CONCENTRATIONS OTHER MEASUREMENTS ANALOG INPUTS RANGE AVG DIAGS ALARM CHOOSE SIGNAL SELECTED OUTPUT: CURRENTLY: PM SET TO: NONE ©ª CHANGE VALUE RANGE AVG CONC V1 ? SAVE DIAGS ALARM Table 3–5. Signal Type Group Choices Thermo Fisher Scientific Concentrations Other Measurements Analog Inputs None None None PM Barometer Pressure Analog Input 1 (if the I/O expansion Model 5030i SHARP Instruction Manual 3-51 Operation Volumetric Conditions Concentrations Other Measurements Analog Inputs board is installed) AVG PM Vacuum Analog Input 2 (if the I/O expansion board is installed) Neph Flow Pressure Analog Input 3 (if the I/O expansion board is installed) SHARP Ambient RH Analog Input 4 (if the I/O expansion board is installed) AVG SHARP Sample RH Analog Input 5 (if the I/O expansion board is installed) AVG Neph Ambient Temp Analog Input 6 (if the I/O expansion board is installed) Board Temp Analog Input 7 (if the I/O expansion board is installed) Flow Temp Analog Input 8 (if the I/O expansion board is installed) Flow Vol Beta Beta Raw Alpha Raw Mass Beta Zero External Alarms Neph Temp Neph RH Neph IRED Neph Ref Beta Ref Common Flags Det Flags Mass Comp Analog Input Configuration The Analog Input Configuration menu displays a list of the 8 analog input channels available for configuration. This screen is only displayed if the I/O expansion board option is installed. Configuration includes entering the Descriptor, Units, Decimal Places, choice of 1–10 points in the table, and corresponding number of points selected. 3-52 Model 5030i SHARP Instruction Manual Thermo Fisher Scientific Operation Volumetric Conditions ● In the Main Menu, choose Instrument Controls > I/O Configuration > Analog Input Config. ANALOG INPUT CONFIG: >CHANNEL 1 CHANNEL 2 CHANNEL 3 CHANNEL 4 CHANNEL 5 RANGE AVG IN1 IN2 IN3 IN4 IN5ª DIAGS ALARM ANALOG INPUT 01 CONFIG: >DESCRIPTOR IN1 UNITS V DECIMAL PLACES 2 TABLE POINTS 2 POINT 1 ª RANGE AVG DIAGS ALARM POINT 2 Descriptor The Descriptor screen allows the user to enter the descriptor, or name, for the selected analog input channel. The descriptor is used in datalogging and streaming data to report what data is being sent out. The descriptor may be from 1 to 3 characters in length, and defaults to IN1 to IN8 (user input channel number). ● In the Main Menu, choose Instrument Controls > I/O Configuration > Analog Input Config > select Channel > Descriptor. ANALOG INPUT DESCRIPTOR: CURRENTLY: IN1 IN1 ABCDEFGHIJKLMN BKSP OPQRSTUVWXYZ PAGE 0123456789 ./- SAVE RANGE Units DIAGS ALARM The Units screen allows the user to enter the units for the selected analog input channel. The units are displayed on the diagnostic screen and in datalogging and streaming data. The units may be from 1 to 3 characters in length, and defaults to V (volts). ● Thermo Fisher Scientific AVG In the Main Menu, choose Instrument Controls > I/O Configuration > Analog Input Config > select Channel > Units. Model 5030i SHARP Instruction Manual 3-53 Operation Volumetric Conditions ANALOG INPUT UNITS: CURRENTLY: V VN1 ABCDEFGHIJKLMN OPQRSTUVWXYZ 0123456789 ./RANGE Decimal Places AVG BKSP PAGE SAVE DIAGS ALARM The Decimal Places screen allows the user to select how many digits are displayed to the right of the decimal point, from 0 to 6, with a default of 2. ● In the Main Menu, choose Instrument Controls > I/O Configuration > Analog Input Config > select Channel > Decimal Places. DECIMAL PLACES: CURRENTLY: SET TO: 2 3 ? ©ª INC/DEC SAVE VALUE RANGE Number of Table Points AVG DIAGS ALARM The Number of Table Points screen allows the user to select how many points are used in the analog input conversion table for the selected channel. The instrument uses linear interpolation between the points in this table to determine what the reading value is based on the analog input voltage. Each point in the table consists of an analog input voltage value (0–10.5 V) and a corresponding reading value. Only two points are necessary for linear inputs, however a larger number of points may be used to approximate non-linear inputs. The points range from 2 to 10, with a default of 2. ● In the Main Menu, choose Instrument Controls > I/O Configuration > Analog Input Config > select Channel > Table Points. NUMBER OF TABLE POINTS: CURRENTLY: 2 SET TO: 10 ? ©ª INC/DEC SAVE VALUE RANGE 3-54 Model 5030i SHARP Instruction Manual AVG DIAGS ALARM Thermo Fisher Scientific Operation Volumetric Conditions Table Points The Table Point submenu allows the user to set up an individual table point. ● In the Main Menu, choose Instrument Controls > I/O Configuration > Analog Input Config > select Channel > Point 1–10. TABLE POINT 01 CONFIG: >VOLTS 0.00 USER VALUE 0.00 RANGE Volts AVG DIAGS ALARM The Volts screen allows the user to set the input voltage for the selected table point in the conversion table, from 0.00 to 10.50. The default table is a two-point table with point 1: 0.00 V = 000.0 U and point 2: 10.00 V = 10.0 U, where U is the previously entered unit of measure. ● In the Main Menu, choose Instrument Controls > I/O Configuration > Analog Input Config > select Channel > select Point > Volts. TABLE POINT 01 VOLTS: CURRENTLY: 0.00 SET TO: 00.00 §¨ MOVE CURSOR ©ª CHANGE VALUE SAVE RANGE User Value DIAGS ALARM The User Value screen allows the user to set the output value for the corresponding input voltage for the selected table point in the conversion table, from -9999999 to 99999999. The default table is a two-point table with point 1: 0.00 V = 000.0 U and point 2: 10.00 V = 10.0 U, where U is the previously entered unit of measure. ● Thermo Fisher Scientific AVG In the Main Menu, choose Instrument Controls > I/O Configuration > Analog Input Config > select Channel > select Point > User Value. Model 5030i SHARP Instruction Manual 3-55 Operation Volumetric Conditions TABLE POINT 01 USER VAL: CURRENTLY: 0.00 SET TO: 00000.00 §¨ MOVE CURSOR ©ª CHANGE VALUE SAVE RANGE Screen Contrast AVG DIAGS ALARM The Screen Contrast screen is used to change the contrast of the display. Intensities between 0 and 100% in increments of 5 are available. Changing the screen contrast may be necessary if the instrument is operated at extreme temperatures. Note The optimal contrast will change with changes in temperature. ▲ Note The optimal contrast will change from one LCD to another. If the LCD is replaced, the contrast may need to be reset. ▲ Note If the display contrast is not optimal, but the content on the screen is visible, select Instrument Controls > Screen Contrast and adjust the screen contrast. If the content on the screen is not visible, use the “set contrast 10” C-Link command to set the screen contrast to mid-range, then optimize the contrast. See “contrast levels” in Appendix B, “C-Link Protocol Commands” for more information on this command. ▲ ● In the Main Menu, choose Instrument Controls > Screen Contrast. SCREEN CONTRAST: CURRENTLY: SET TO: 50 % 55 % ? ©ª CHANGE VALUE SAVE VALUE RANGE Service Mode 3-56 Model 5030i SHARP Instruction Manual AVG DIAGS ALARM The Service Mode screen is used to turn the service mode on or off. Turning service mode “ON” locks out any remote actions and allows access to parameters and functions that are useful when making adjustments or diagnosing the Model 5030i. The service (wrench) icon on the status bar is shown when service mode is on. For more information about the service mode, see “Service Menu” later in this chapter. Thermo Fisher Scientific Operation Volumetric Conditions Note The service mode should be turned off when finished, as it prevents remote operation. ▲ ● In the Main Menu, choose Instrument Controls > Service Mode. SERVICE MODE: CURRENTLY: SET TO: OFF ON ? TOGGLE VALUE RANGE Date/Time AVG The Date/Time screen allows the user to view and change the system date and time (24-hour format). The internal clock is powered by its own battery when instrument power is off. ● In the Main Menu, choose Instrument Controls > Date/Time. ● DATE AND TIME: 19 MAR 2005 12:34:56 PRESS TO● EDIT ● ● RANGE Timezone DIAGS ALARM AVG DIAGS ALARM DATE AND TIME: 19 MAR 2005 12:34:56 ? SETTING: DAYS ¨ SET MONTHS ©ª CHANGE VALUE SAVE VALUE RANGE AVG DIAGS ALARM The Timezone screen is used to set the timezone for the Network Time Protocol (NTP) server. This should be set to the timezone that the instrument is located in. If the exact timezone is not shown in the list, it may be entered via the C-LINK “tz” command (see Appendix B). The selections are: UTC (GMT), EST (GMT+5), CST (GMT+6), MST (GMT+7), PST (GMT+8), YST (GMT+9), HST (GMT+10), NST (GMT+11), DLW (GMT+12), CET (GMT-1), EET (GMT-2), BST (GMT-3), DLT (GMT-4), ECH (GMT-5), FOX (GMT-6), GLF (GMT7), CCT (GMT-8), JST (GMT-9), GST (GMT-10), LMA (GMT-11), DLE (GMT-12), EDT (GMT+5/4), CDT (GMT+6/5), MDT (GMT+7/6), and PDT (GMT+8/7). Note The current timezone may say NULL before the timezone is set for the first time, or if the timezone was cleared with a C-Link command. ▲ Thermo Fisher Scientific Model 5030i SHARP Instruction Manual 3-57 Operation Diagnostics Menu ● In the Main Menu, choose Instrument Controls > Timezone. TIMEZONE FOR TIMESERVER: CURRENTLY: UTC (GMT) SET TO: EST (GMT+5) ? ©ª CHANGE VALUE SAVE VALUE RANGE Diagnostics Menu AVG DIAGS ALARM The Diagnostics menu provides access to diagnostic information and functions. This menu is useful when troubleshooting the instrument. The analog input readings and analog input voltages are only displayed if the I/O expansion board option is installed. ● In the Main Menu, choose Diagnostics. DIAGNOSTICS: >PROGRAM VERSIONS VOLTAGES RH/TEMPERATURE PRESSURE/VACUUM FLOW RANGE AVG ª DIAGS ALARM DETECTOR STATUS NEPHELOMETER STATUS CRn ANALOG INPUT READINGS ANALOG INPUT VOLTAGES DIGITAL INPUTS RELAY STATES TEST ANALOG OUTPUTS INSTRUMENT CONFIGURATION CONTACT INFORMATION Program Versions The Program Versions screen (read only) shows the version numbers of the programs installed. Prior to contacting the factory with any questions regarding the instrument, please note the product model name and the program version numbers. ● 3-58 Model 5030i SHARP Instruction Manual In the Main Menu, choose Diagnostics > Program Versions. Thermo Fisher Scientific Operation Diagnostics Menu PROGRAM VERSIONS: PRODUCT: MODEL 5030i VERSION: 00.00.32.073 FIRMWARE: 10.22.95 RANGE Voltages AVG DIAGS ALARM The Voltages menu displays the current diagnostic voltage readings. This screen enables the power supply to be quickly read for low or fluctuating voltages without having to use a voltage meter. The I/O board item is only displayed if the I/O expansion board option is installed. ● In the Main Menu, choose Diagnostics > Voltages. VOLTAGES: >MOTHERBOARD INTERFACE BOARD I/O BOARD DETECTOR BOARD RANGE Motherboard Voltages AVG DIAGS ALARM The Motherboard screen (read only) is used to display the voltage readings on the motherboard. ● In the Main Menu, choose Diagnostics > Voltages > Motherboard. MOTHERBOARD VOLTAGES: 3.3 SUPPLY 3.3 5.0 SUPPLY 5.0 15.0 SUPPLY 15.0 24.0 SUPPLY 24.1 -3.3 SUPPLY -3.3 RANGE Interface Board Voltages DIAGS ALARM The Interface Board screen (read only) is used to display the voltage readings on the measurement interface board. ● Thermo Fisher Scientific AVG V V V V V In the Main Menu, choose Diagnostics > Voltages > Interface Board. Model 5030i SHARP Instruction Manual 3-59 Operation Diagnostics Menu INTERFACE BOARD VOLTAGES: 3.3 SUPPLY 3.3 V 5.0 SUPPLY 5.0 V 15.0 SUPPLY 15.0 V 24.0 SUPPLY 24.0 V -15.0 SUPPLY -15.0 V RANGE I/O Board Voltages AVG DIAGS ALARM The I/O Board screen (read only) is used to display the voltage readings on the I/O expansion board. This menu is only displayed if the I/O expansion board option is installed. ● In the Main Menu, choose Diagnostics > Voltages > I/O Board. I/O BOARD VOLTAGES: 3.3 SUPPLY 3.3 5.0 SUPPLY 5.0 24.0 SUPPLY 24.0 -3.3 SUPPLY -3.3 RANGE Detector Board Voltages AVG DIAGS ALARM The Detector Board screen (read only) is used to display the voltage readings on the measurement interface board. ● In the Main Menu, choose Diagnostics > Voltages > Detector Board. DETECTOR BOARD: 5.0 SUPPLY RANGE Nephelometer Board Voltages Model 5030i SHARP Instruction Manual AVG 5.0 V DIAGS ALARM The Nehpelometer Board screen (read only) is used to display the voltage readings on the nephelometer board. ● 3-60 V V V V In the Main Menu, choose Diagnostics > Voltages > Nephelometer Board. Thermo Fisher Scientific Operation Diagnostics Menu NEPH BOARD VOLTAGES: 3.3 SUPPLY 3.3 3.3 SUPPLY 3.3 5.0 SUPPLY 5.0 7.5 SUPPLY 7.5 -5.0 SUPPLY -5.0 RANGE AVG DIAGS ALARM -7.5 SUPPLY RH/Temperature -7.5 V The RH/Temperature screen (read only) displays the current relative humidity and temperature readings. The board temperature is the air temperature measured by a sensor located on the measurement interface board. ● In the Main Menu, choose Diagnostics > RH/Temperature. RH/TEMPERATURES: >AMBIENT RH SAMPLE RH AMBIENT TEMP FLOW TEMP BOARD TEMP RANGE Pressure/Vacuum V V V V V AVG 40.0 36.4 22.9 23.9 24.9 % % o C o C o Cª DIAGS ALARM The Pressure/Vacuum screen (read only) displays the current pressure readings. The pressure is measured by a pressure transducer. The vacuum is the amount of vacuum under the filter tape. The flow pressure is the pressure differential across the orifice. ● In the Main Menu, choose Diagnostics > Pressure/Vacuum. PRESSURE/VACUUM: BAROMETRIC 760.1 mmHg VACUUM 60.5 mmHg FLOW 21.5 mmHg RANGE Flow DIAGS ALARM The Flow screen (read only) displays the current sample flow reading. The flow is measured by the internal pressure board sensors. ● Thermo Fisher Scientific AVG In the Main Menu, choose Diagnostics > Flow. Model 5030i SHARP Instruction Manual 3-61 Operation Diagnostics Menu FLOW: RANGE Detector Status 16.67 LPM AVG DIAGS ALARM The Detector Status screen (read only) displays the current sample mass reading, alpha counts, and beta counts. Note A mass value will only be calculated when the flowrate is within acceptable limits. However, when in Service Mode, a mass value will be calculated if the pump is turned OFF. ▲ ● In the Main Menu, choose Diagnostics > Detector Status. DETECTOR STATUS: MASS ALPHA 2 BETA 13577 BETA CORR 13577 BETA ZERO 6500 RANGE Nephelometer Status AVG 0 ug 1/sec 1/sec 1/sec 1/sec DIAGS ALARM The Nephelometer Status screen (read only) displays the current nephelometer reading. ● In the Main Menu, choose Diagnostics > Nephelometer Status. NEPHELOMETER STATUS: NEPH TEMP 31.0 oC NEPH RH 36.6 % LED CURRENT 69.8 mA REF DETECTOR 867 mV RANGE CRn Model 5030i SHARP Instruction Manual DIAGS ALARM The CRn screen (read only) displays the current CRn reading. ● 3-62 AVG In the Main Menu, choose Diagnostics > CRn. Thermo Fisher Scientific Operation Diagnostics Menu CRn RANGE Analog Input Readings 0.00 Bq/m3 AVG DIAGS ALARM The Analog Input Readings screen (read only) displays the 8 user-scaled analog readings (if the I/O expansion board option is installed). ● In the Main Menu, choose Diagnostics > Analog Input Readings. ANALOG INPUT READINGS: >PM 1.2 mg/m3 FLOW 16.67 LPM SAMPLE RH 42 % MASS 279 ug IO5 0.0 Vª RANGE Analog Input Voltages AVG DIAGS ALARM The Analog Input Voltages screen (read only) displays the 8 raw analog voltage readings (if the I/O expansion board option is installed). ● In the Main Menu, choose Diagnostics > Analog Input Voltages. ANALOG INPUT VOLTAGES: >ANALOG IN 1 6.24 ANALOG IN 2 4.28 ANALOG IN 3 0.00 ANALOG IN 4 0.00 ANALOG IN 5 0.00 RANGE Digital Inputs DIAGS ALARM The Digital Inputs screen (read only) displays the state of the 16 digital inputs. Pull-ups are provided on all of the inputs, so if nothing they will read (1), if an input is brought to ground, it will read (0). ● Thermo Fisher Scientific AVG V V V V Vª In the Main Menu, choose Diagnostics > Digital Inputs. Model 5030i SHARP Instruction Manual 3-63 Operation Diagnostics Menu DIGITAL INPUTS: >INPUT 1 INPUT 2 INPUT 3 INPUT 4 INPUT 5 RANGE Relay States AVG DIAGS ALARM The Relay States screen displays the state of the 10 digital outputs and allows toggling of the state to either on (1) or off (0). The relays are restored to their original states upon exiting this screen. ● In the Main Menu, choose Diagnostics > Relay States. ● Press to toggle and set the relay state to open or closed for the selected digital output. RELAY STATE: >OUTPUT 1 OUTPUT 2 OUTPUT 3 OUTPUT 4 OUTPUT 5 RANGE Test Analog Outputs 1 1 1 1 1ª AVG 0 0 0 1 1ª DIAGS ALARM The Test Analog Outputs menu is used to set each of the analog output channels to zero or full-scale. Channel choices include all analog outputs, 6 voltage channels, and 6 current channels (if the I/O expansion board option is installed). ● In the Main Menu, choose Diagnostics > Test Analog Outputs. TEST ANALOG OUTPUTS: >ALL VOLTAGE CHANNEL 1 VOLTAGE CHANNEL 2 VOLTAGE CHANNEL 3 VOLTAGE CHANNEL 4 RANGE Set Analog Outputs 3-64 Model 5030i SHARP Instruction Manual AVG DIAGS ALARM The Set Analog Outputs screen contains three choices: Set to full-scale, set to zero, or reset to normal. Full-scale sets the analog outputs to the fullscale voltage, zero sets the analog outputs to 0 volts, and reset returns the output to normal operation. The analog outputs are returned to normal Thermo Fisher Scientific Operation Diagnostics Menu operation upon exiting this screen. The following example shows the screen when all analog outputs are set to “normal” operating mode. ● In the Main Menu, choose Diagnostics > Test Analog Outputs > ALL, Voltage Channel 1–6, or Current Channel 1–6. SET ANALOG OUTPUTS: SETTING: ALL OUTPUT SET TO: NORMAL © SET TO FULL SCALE ª SET TO ZERO § RESET TO NORMAL RANGE Instrument Configuration AVG DIAGS ALARM The Instrument Configuration screen displays information on the hardware configuration of the instrument. Note If the analyzer is in service mode, pressing selected item between yes and no. ▲ ● will toggle the In the Main Menu, choose Diagnostics > Instrument Configuration. INSTRUMENT CONFIGURATION: >I/O EXPANSION BOARD YES DETECTOR SHARP §¨ CHANGE VALUE RANGE Contact Information AVG SAVE DIAGS ALARM The Contact Information screen displays the customer service information. ● In the Main Menu, choose Diagnostics > Contact Information. CONTACT INFORMATION: CALL CENTER: 508-520-0430 http://WWW.THERMO.COM/AQI RANGE Thermo Fisher Scientific AVG DIAGS ALARM Model 5030i SHARP Instruction Manual 3-65 Operation Alarms Menu Alarms Menu The alarms menu allows the user to view a set of alarms for different boards and displays a list of items that are monitored by the analyzer. The number of alarms detected is displayed to indicate how many alarms have occurred. If no alarms are detected, the number zero is displayed. If the item being monitored goes outside the lower or upper limit, the status of that item will go from “OK” to either “LOW” or “HIGH”, respectively. If the alarm is not a level alarm, the status will go from “OK” to “FAIL”. The number of alarms detected is displayed to indicate how many alarms have occurred. If no alarms are detected, the number zero is displayed. Items displayed are determined by the options installed. To see the actual reading of an item and its minimum and maximum limits, move the cursor to the item and press . If the readings go beyond either the minimum or maximum limit, an alarm is activated and the alarm (bell) icon appears in the status bar on the Run screen and in the Main Menu. If any alarms are active, the alarm (bell) icon is displayed on the right side of the status bar. ● In the Main Menu, choose Alarms. ALARMS: ALARMS DETECTED >INSTRUMENT ALARMS DETECTOR ALARMS NEPH ALARMS RH/TEMPERATURE ALARMS RANGE AVG 0 0 0 0 0ª DIAGS ALARM PRESSURE/VACUUM ALARMS FLOW ALARMS 0 CONC ALARMS 0 Instrument Alarms The Instrument Alarms submenu allows the user to view a set of alarms for different boards. The filter tape change, heater power, and bench items (motherboard, interface board and I/O expansion board) are read only. The motherboard status, interface board status, and I/O expansion board status (if installed) indicate that the power supplies are working and connections are successful. There are no setting screens for these alarms. ● 3-66 Model 5030i SHARP Instruction Manual In the Main Menu, choose Alarms > Instrument Alarms. Thermo Fisher Scientific Operation Alarms Menu INSTRUMENT ALARMS: >FILTER TAPE COUNTER FILTER TAPE CHANGE BENCH HEATER POWER MOTHERBOARD STATUS RANGE AVG OK OK OK OK OKª DIAGS ALARM INTERFACE STATUS I/O EXP STATUS Filter Tape Counter The Filter Tape Counter screen displays the current filter tape counter value and sets the maximum alarm limit. If the filter tape counter reading goes beyond the maximum limit, an alarm is activated and the alarm (bell) icon appears in the status bar on the Run screen and in the Main Menu. ● In the Main Menu, choose Alarms > Instrument Alarms > Filter Tape Counter. FILTER TAPE COUNTER: ACTUAL >MAX RANGE Max Filter Tape Counter OK OK AVG 0 650 DIAGS ALARM The Maximum Filter Tape Counter screen is used to change the maximum filter tape counter alarm limit (480 = 90% usage, 10% remaining). ● In the Main Menu, choose Alarms > Instrument Alarms > Filter Tape Counter > Max. FILTER TAPE COUNTER: ACTUAL MAX: 650 SET MAX TO: xxxx 480 ? ©ª INC/DEC SAVE VALUE RANGE Detector Alarms DIAGS ALARM The Detector Alarms submenu allows the user to view a set of alarms for detector boards. Board status indicates that the power supplies are working and connections are successful. There are no setting screens for this alarm. ● Thermo Fisher Scientific AVG In the Main Menu, choose Alarms > Detector Alarms. Model 5030i SHARP Instruction Manual 3-67 Operation Alarms Menu DETECTOR ALARMS: BOARD STATUS >ALPHA BETA RANGE Min and Max Alpha Alarms AVG In the Main Menu, choose Alarms > Detector Alarms > Alpha. ALPHA COUNT: ACTUAL MIN MAX RANGE AVG RANGE Model 5030i SHARP Instruction Manual DIAGS ALARM In the Main Menu, choose Alarms > Detector Alarms > Beta. BETA COUNT: ACTUAL MIN MAX 3-68 0 0 100 The Beta Alarms screen allows the user to view the minimum and maximum alarm parameters. Acceptable alarm limits range from 5000 to 20000. If the beta count reading goes beyond the maximum limit, an alarm is activated and the alarm (bell) icon appears in the status bar on the Run screen and in the Main Menu. ● Nephelometer Alarms DIAGS ALARM The Alpha Alarms screen allows the user to view the minimum and maximum alarm parameters. Acceptable alarm limits range from 0 to 100. If the alpha count reading goes beyond the maximum limit, an alarm is activated and the alarm (bell) icon appears in the status bar on the Run screen and in the Main Menu. ● Min and Max Beta Alarms OK OK OK AVG 0 5000 20000 DIAGS ALARM The Nephelometer Alarms submenu allows the user to view and set the nephelometer alarm parameters. Board status indicates that the power supplies are working and connections are successful. The nephelometer Thermo Fisher Scientific Operation Alarms Menu temperature, nephelometer RH, LED current, and reference detector voltage all have adjustable alarms pre-set in the factory. ● In the Main Menu, choose Alarms > Neph Alarms. NEPHELOMETER ALARMS: BOARD STATUS NEPH SAMPLE NEPH CAL >NEPH TEMP NEPH RH RANGE AVG OK OK OK OK OKª DIAGS ALARM LED CURRENT REF DET VOLT Nephelometer Temperature OK OK The Nephelometer Temperature screen displays the current nephelometer temperature value and sets the minimum and maximum alarm limits. Acceptable alarm limits range from 0 to 60 °C. If the nephelometer temperature reading goes beyond the minimum or maximum limit, an alarm is activated and the alarm (bell) icon appears in the status bar on the Run screen and in the Main Menu. ● In the Main Menu, choose Alarms > Neph Alarms > Neph Temp. NEPHELOMETER TEMP: ACTUAL 25.0 >MIN 0.0 MAX 60.0 RANGE Min and Max Nephelometer Temperature Limits C C o C o DIAGS ALARM The Minimum Nephelometer Temperature alarm limit screen is used to change the minimum nephelometer temperature alarm limit. The minimum and maximum nephelometer temperature screens function the same way. ● Thermo Fisher Scientific AVG o In the Main Menu, choose Alarms > Neph Alarms > Neph Temp > Min or Max. Model 5030i SHARP Instruction Manual 3-69 Operation Alarms Menu NEPHELOMETER TEMP: ACTUAL MIN: 0.0 SET MIN TO: 5.0 o o C C? ©ª INC/DEC SAVE VALUE RANGE Nephelometer RH AVG DIAGS ALARM The Nephelometer RH screen displays the current nephelometer relative humidity value and sets the minimum and maximum alarm limits. Acceptable alarm limits range from 5 to 95%. If the nephelometer RH reading goes beyond the minimum or maximum limit, an alarm is activated and the alarm (bell) icon appears in the status bar on the Run screen and in the Main Menu. ● In the Main Menu, choose Alarms > Neph Alarms > Neph RH. NEPHELOMETER RH: ACTUAL >MIN MAX RANGE Min and Max Nephelometer RH Limits AVG 0.0 5.0 95.0 % % % DIAGS ALARM The Minimum Nephelometer RH alarm limit screen is used to change the minimum nephelometer RH alarm limit. The minimum and maximum nephelometer RH screens function the same way. ● In the Main Menu, choose Alarms > Neph Alarms > Neph RH > Min or Max. NEPHELOMETER RH: ACTUAL MIN: SET MIN TO: 5.0 % 5.5 %? ©ª INC/DEC SAVE VALUE RANGE LED Current 3-70 Model 5030i SHARP Instruction Manual AVG DIAGS ALARM The LED Current screen displays the current nephelometer source current value and sets the minimum and maximum alarm limits. Acceptable alarm limits range from 50 to 70 mA. If the LED current reading goes beyond Thermo Fisher Scientific Operation Alarms Menu the minimum or maximum limit, an alarm is activated and the alarm (bell) icon appears in the status bar on the Run screen and in the Main Menu. ● In the Main Menu, choose Alarms > Neph Alarms > LED Current. LED SOURCE CURRENT: ACTUAL 65.0 mA >MIN 50.0 mA MAX 70.0 mA RANGE Min and Max LED Source Current Limits AVG DIAGS ALARM The Minimum LED Source Current alarm limit screen is used to change the minimum LED source current alarm limit. The minimum and maximum LED Source Current screens function the same way. ● In the Main Menu, choose Alarms > Neph Alarms > LED Current > Min or Max. LED SOURCE CURRENT: ACTUAL MIN: 50.0 mA SET MIN TO: 50.1 mA? ©ª INC/DEC SAVE VALUE RANGE Reference Detector Voltage AVG DIAGS ALARM The Reference Detector Voltage screen displays the current nephelometer reference detector voltage value and the minimum and maximum alarm limits. Acceptable alarm limits range 350 to 2000 mV. If the reference detector voltage reading goes beyond the minimum or maximum limit, an alarm is activated and the alarm (bell) icon appears in the status bar on the Run screen and in the Main Menu. There is no “set” mode for this value. ● In the Main Menu, choose Alarms > Neph Alarms > Ref Det Volt. REF DETECTOR VOLTAGE: ACTUAL 780 mV MIN 350 mV MAX 2000 mV RANGE Thermo Fisher Scientific AVG DIAGS ALARM Model 5030i SHARP Instruction Manual 3-71 Operation Alarms Menu RH/Temperature Alarms The RH/Temperature Alarms submenu allows the user to view and set the relative humidity or temperature alarm parameters. ● In the Main Menu, choose Alarms > RH/Temperature Alarms. RH/TEMPERATURE ALARMS: >AMBIENT RH OK SAMPLE RH OK AMBIENT TEMP OK FLOW TEMP OK BOARD TEMP OKª RANGE Ambient RH AVG The Ambient RH screen displays the current ambient relative humidity value and sets the minimum and maximum alarm limits. Acceptable alarm limits range from 5 to 95%. If the ambient RH reading goes beyond the minimum or maximum limit, an alarm is activated and the alarm (bell) icon appears in the status bar on the Run screen and in the Main Menu. ● In the Main Menu, choose Alarms > RH/Termperature Alarms > Ambient RH. AMBIENT RH: ACTUAL >MIN MAX RANGE Min and Max Ambient RH Limits Model 5030i SHARP Instruction Manual AVG 27.4 5.0 95.0 % % % DIAGS ALARM The Minimum Ambient RH alarm limit screen is used to change the minimum ambient RH alarm limit. The minimum and maximum ambient RH screens function the same way. ● 3-72 DIAGS ALARM In the Main Menu, choose Alarms > RH/Temperature Alarms > Ambient RH > Min or Max. Thermo Fisher Scientific Operation Alarms Menu RELATIVE HUMIDITY: ACTUAL MIN: SET MIN TO: 5.0 % 5.5 %? ©ª INC/DEC SAVE VALUE RANGE Sample RH AVG The Sample RH screen displays the current sample relative humidity value and sets the minimum and maximum alarm limits. Acceptable alarm limits range from 5 to 95%. If the sample RH reading goes beyond the minimum or maximum limit, an alarm is activated and the alarm (bell) icon appears in the status bar on the Run screen and in the Main Menu. ● In the Main Menu, choose Alarms > RH/Termperature Alarms > Sample RH. SAMPLE RH: ACTUAL >MIN MAX RANGE Min and Max Sample RH Limits DIAGS ALARM AVG 0.0 5.0 95.0 % % % DIAGS ALARM The Minimum Sample RH alarm limit screen is used to change the minimum ambient RH alarm limit. The minimum and maximum sample RH screens function the same way. ● In the Main Menu, choose Alarms > RH/Temperature Alarms > Sample RH > Min or Max. SAMPLE RH: ACTUAL MIN: SET MIN TO: 5.0 % 35 %? ©ª INC/DEC SAVE VALUE RANGE Ambient Temperature Thermo Fisher Scientific AVG DIAGS ALARM The Ambient Temperature screen displays the current ambient temperature value and sets the minimum and maximum alarm limits. Acceptable alarm limits range from -30 °C to 60 °C. If the ambient temperature reading goes beyond the minimum or maximum limit, an alarm is activated and the Model 5030i SHARP Instruction Manual 3-73 Operation Alarms Menu alarm (bell) icon appears in the status bar on the Run screen and in the Main Menu. ● In the Main Menu, choose Alarms > RH/Termperature Alarms > Ambient Temp. AMBIENT TEMP: ACTUAL >MIN MAX RANGE Min and Max Ambient Temperature Limits AVG -30.0 -30.0 60.0 o C C o C o DIAGS ALARM The Minimum Ambient Temperature alarm limit screen is used to change the minimum ambient temperature alarm limit. The minimum and maximum ambient temperature screens function the same way. ● In the Main Menu, choose Alarms > RH/Temperature Alarms > Ambient Temp > Min or Max. AMBIENT TEMPERATURE: ACTUAL MIN: -30.0 SET MIN TO: -20.0 o o C C? ©ª INC/DEC SAVE VALUE RANGE Flow Temperature AVG The Flow Temperature screen displays the current ambient temperature value and sets the minimum and maximum alarm limits. Acceptable alarm limits range from 5 to 60 °C. If the flow temperature reading goes beyond the minimum or maximum limit, an alarm is activated and the alarm (bell) icon appears in the status bar on the Run screen and in the Main Menu. ● In the Main Menu, choose Alarms > RH/Termperature Alarms > Flow Temp. FLOW TEMP: ACTUAL >MIN MAX RANGE 3-74 Model 5030i SHARP Instruction Manual DIAGS ALARM AVG 24.4 0.0 60.0 o C C o C o DIAGS ALARM Thermo Fisher Scientific Operation Alarms Menu Min and Max Flow Temperature Limits The Minimum Flow Temperature alarm limit screen is used to change the minimum flow temperature alarm limit. The minimum and maximum flow temperature screens function the same way. ● In the Main Menu, choose Alarms > RH/Temperature Alarms > Flow Temp > Min or Max. FLOW TEMPERATURE: ACTUAL MIN: SET MIN TO: 0.0 5.5 o o C C? ©ª INC/DEC SAVE VALUE RANGE Board Temperature AVG The Board Temperature screen displays the current board temperature value and sets the minimum and maximum alarm limits. Acceptable alarm limits range from 5 to 60 °C. If the board temperature reading goes beyond the minimum or maximum limit, an alarm is activated and the alarm (bell) icon appears in the status bar on the Run screen and in the Main Menu. ● In the Main Menu, choose Alarms > RH/Termperature Alarms > Board Temp. BOARD TEMP: ACTUAL >MIN MAX RANGE Min and Max Board Temperature Limits AVG 26.1 0.0 60.0 o C C o C o DIAGS ALARM The Minimum Board Temperature alarm limit screen is used to change the minimum board temperature alarm limit. The minimum and maximum board temperature screens function the same way. ● Thermo Fisher Scientific DIAGS ALARM In the Main Menu, choose Alarms > RH/Temperature Alarms > Board Temp > Min or Max. Model 5030i SHARP Instruction Manual 3-75 Operation Alarms Menu BOARD TEMPERATURE: ACTUAL MIN: 5.0 SET MIN TO: 0.0 o o C C? ©ª INC/DEC SAVE VALUE RANGE Pressure/Vacuum Alarms AVG DIAGS ALARM The Pressure/Vacuum Alarms submenu allows the user to view and set the pressure alarm parameters. ● In the Main Menu, choose Alarms > Pressure/Vacuum Alarms. PRESSURE/VACUUM ALARMS: >BARO PRES OK VACUUM OK FLOW OK RANGE Barometric Pressure AVG DIAGS ALARM The Barometric Pressure screen displays the current pressure reading and sets the minimum and maximum alarm limits. Acceptable alarm limits range from 400 to 800 mmHg. If the barometric pressure reading goes beyond the minimum or maximum limit, an alarm is activated and the alarm (bell) icon appears in the status bar on the Run screen and in the Main Menu. ● In the Main Menu, choose Alarms > Pressure/Vacuum Alarms > Baro Pres. BAROMETRIC PRESSURE: ACTUAL 764.0 mmHg >MIN 400.0 mmHg MAX 800.0 mmHg RANGE Min and Max Barometric Pressure Limits Model 5030i SHARP Instruction Manual DIAGS ALARM The Minimum Barometric Pressure alarm limit screen is used to change the minimum barometric pressure alarm limit. The minimum and maximum barometric pressure screens function the same way. ● 3-76 AVG In the Main Menu, choose Alarms > Pressure/Vacuum Alarms > Baro Pres > Min or Max. Thermo Fisher Scientific Operation Alarms Menu BAROMETRIC PRESSURE: ACTUAL MIN: 400.0 mmHg SET MIN TO: 400.1 mmHg? ©ª INC/DEC SAVE VALUE RANGE Vacuum AVG The Vacuum screen displays the current vacuum reading and sets the minimum and maximum alarm limits. Acceptable alarm limits range from -5 mmHg to 250 mmHg. If the vacuum reading goes beyond the minimum or maximum limit, an alarm is activated and the alarm (bell) icon appears in the status bar on the Run screen and in the Main Menu. ● In the Main Menu, choose Alarms > Pressure/Vacuum Alarms > Vacuum. VACUUM: ACTUAL >MIN MAX RANGE Min and Max Vacuum Limits DIAGS ALARM 60.8 mmHg -5.0 mmHg 250.0 mmHg AVG DIAGS ALARM The Minimum Vacuum alarm limit screen is used to change the minimum vacuum alarm limit. The minimum and maximum vacuum screens function the same way. Note The maximum vacuum value should not be changes, as this is also used as a protective feature for the instrument. ▲ ● In the Main Menu, choose Alarms > Pressure/Vacuum Alarms > Vacuum > Min or Max. VACUUM: ACTUAL MIN: SET MIN TO: -5.0 mmHg -4.9 mmHg? ©ª INC/DEC SAVE VALUE RANGE Thermo Fisher Scientific AVG DIAGS ALARM Model 5030i SHARP Instruction Manual 3-77 Operation Alarms Menu Flow The Flow screen displays the current flow reading and sets the minimum and maximum alarm limits. Acceptable alarm limits range from -5 mmHg to 40 mmHg. If the flow reading goes beyond the minimum or maximum limit, an alarm is activated and the alarm (bell) icon appears in the status bar on the Run screen and in the Main Menu. ● In the Main Menu, choose Alarms > Pressure/Vacuum Alarms > Flow. FLOW: ACTUAL >MIN MAX RANGE Min and Max Flow Limits 23.1 mmHg -5.0 mmHg 40.0 mmHg AVG DIAGS ALARM The Minimum Flow alarm limit screen is used to change the minimum flow alarm limit. The minimum and maximum flow screens function the same way. ● In the Main Menu, choose Alarms > Pressure/Vacuum Alarms > Flow > Min or Max. FLOW PRESSURE: ACTUAL MIN: SET MIN TO: -5.0 mmHg -4.9 mmHg? ©ª INC/DEC SAVE VALUE RANGE Flow Alarms Model 5030i SHARP Instruction Manual DIAGS ALARM The Flow Alarms submenu allows the user to view and set the flow alarm parameters. ● 3-78 AVG In the Main Menu, choose Alarms > Flow Alarms. Thermo Fisher Scientific Operation Alarms Menu FLOW ALARMS: >FLOW RANGE Flow AVG DIAGS ALARM The Flow screen displays the current flow and sets the minimum and maximum alarm limits. Acceptable alarm limits range from 16.00 to 17.34 LPM. If the flow reading goes beyond the minimum or maximum limit, an alarm is activated and the alarm (bell) icon appears in the status bar on the Run screen and in the Main Menu. ● In the Main Menu, choose Alarms > Flow Alarms > Flow. FLOW: ACTUAL >MIN MAX RANGE Min and Max Flow Limits OK 0.00 LPM 16.17 LPM 17.17 LPM AVG DIAGS ALARM The Minimum Flow alarm limit screen is used to change the minimum flow alarm limit. The minimum and maximum flow screens function the same way. ● In the Main Menu, choose Alarms > Flow Alarms > Flow > Min or Max. FLOW: ACTUAL MIN: SET MIN TO: 16.00 LPM 16.17 LPM? ©ª INC/DEC SAVE VALUE RANGE Concentration Alarms DIAGS ALARM The Concentration Alarms submenu allows the user to view and set the 24hour average concentration and the instant concentration for PM, SHARP, and nephelometer alarm parameters. ● Thermo Fisher Scientific AVG In the Main Menu, choose Alarms > Conc Alarms. Model 5030i SHARP Instruction Manual 3-79 Operation Alarms Menu CONC ALARMS: >AVG PM AVG SHARP AVG NEPH INST PM INST SHARP RANGE AVG OK OK OK OK OK DIAGS ALARM INST NEPH Average PM OK The Average PM screen displays the current average PM concentration and sets the minimum and maximum alarm limits. Acceptable alarm limits range from 0 to 10000 μg/m3 or 0 to 10 mg/m3. If the average PM concentration goes beyond either the minimum or maximum limit, an alarm is activated and the alarm (bell) icon appears in the status bar on the Run screen and in the Main Menu. ● In the Main Menu, choose Alarms > Conc Alarms > Avg PM. AVERAGE PM CONC: ACTUAL >MIN MAX RANGE Min and Max Average PM Concentration Limits AVG 0.0 0.0 10000 DIAGS ALARM The Minimum Average PM Concentration alarm limit screen is used to change the minimum average PM concentration alarm limit. The minimum and maximum average PM concentration screens function the same way. ● In the Main Menu, choose Alarms > Conc Alarms > Avg PM > Min or Max. AVERAGE PM CONC: ACT MIN: 0.0 SET MIN: xxxxx100 ? §¨ MOVE CURSOR ©ª CHANGE VALUE SAVE RANGE 3-80 Model 5030i SHARP Instruction Manual AVG DIAGS ALARM Thermo Fisher Scientific Operation Alarms Menu Average SHARP The Average SHARP screen displays the current average SHARP concentration and sets the minimum and maximum alarm limits. Acceptable alarm limits range from 0 to 10000 μg/m3 or 0 to 10 mg/m3. If the average SHARP concentration goes beyond either the minimum or maximum limit, an alarm is activated and the alarm (bell) icon appears in the status bar on the Run screen and in the Main Menu. ● In the Main Menu, choose Alarms > Conc Alarms > Avg SHARP. AVERAGE SHARP CONC: ACTUAL 0.0 >MIN 0.0 MAX 10000 RANGE Min and Max Average SHARP Concentration Limits AVG DIAGS ALARM The Minimum Average SHARP Concentration alarm limit screen is used to change the minimum average SHARP concentration alarm limit. The minimum and maximum average SHARP concentration screens function the same way. ● In the Main Menu, choose Alarms > Conc Alarms > Avg SHARP > Min or Max. AVERAGE SHARP CONC: ACT MIN: 0.0 SET MIN: xxxxx100 ? §¨ MOVE CURSOR ©ª CHANGE VALUE SAVE RANGE Average Nephelometer DIAGS ALARM The Average Nephelometer screen displays the current average Nephelometer concentration and sets the minimum and maximum alarm limits. Acceptable alarm limits range from 0 to 10000 μg/m3 or 0 to 10 mg/m3. If the average nephelometer concentration goes beyond either the minimum or maximum limit, an alarm is activated and the alarm (bell) icon appears in the status bar on the Run screen and in the Main Menu. ● Thermo Fisher Scientific AVG In the Main Menu, choose Alarms > Conc Alarms > Avg Neph. Model 5030i SHARP Instruction Manual 3-81 Operation Alarms Menu AVERAGE NEPH CONC: ACTUAL >MIN MAX RANGE Min and Max Average Nephelometer Concentration Limits AVG 0.0 0.0 10000 DIAGS ALARM The Minimum Average Nephelometer Concentration alarm limit screen is used to change the minimum average nephelometer concentration alarm limit. The minimum and maximum average nephelometer concentration screens function the same way. ● In the Main Menu, choose Alarms > Conc Alarms > Avg Neph > Min or Max. AVERAGE NEPH CONC: ACT MIN: 0.0 SET MIN: xxxxx100 ? §¨ MOVE CURSOR ©ª CHANGE VALUE SAVE RANGE Instant PM AVG DIAGS ALARM The Instant PM screen displays the current instant PM concentration and sets the minimum and maximum alarm limits. Acceptable alarm limits range from -10 to 10000 μg/m3 or -.01 to 10 mg/m3. If the instant PM concentration goes beyond either the minimum or maximum limit, an alarm is activated and the alarm (bell) icon appears in the status bar on the Run screen and in the Main Menu. ● In the Main Menu, choose Alarms > Conc Alarms > Inst PM. INSTANT PM CONC: ACTUAL >MIN MAX RANGE Min and Max Instant PM Concentration Limits 3-82 Model 5030i SHARP Instruction Manual AVG 0.0 -10.0 10000 DIAGS ALARM The Minimum Instant PM Concentration alarm limit screen is used to change the minimum instant PM concentration alarm limit. The Thermo Fisher Scientific Operation Alarms Menu minimum and maximum instant PM concentration screens function the same way. ● In the Main Menu, choose Alarms > Conc Alarms > Inst PM > Min or Max. INSTANT SHARP CONC: ACT MIN: 0.0 SET MIN: xxxxx-10 ? §¨ MOVE CURSOR ©ª CHANGE VALUE SAVE RANGE Instant SHARP AVG DIAGS ALARM The Instant SHARP screen displays the current instant SHARP concentration and sets the minimum and maximum alarm limits. Acceptable alarm limits range from -10 to 10000 μg/m3 or -.01 to 10 mg/m3. If the instant SHARP concentration goes beyond either the minimum or maximum limit, an alarm is activated and the alarm (bell) icon appears in the status bar on the Run screen and in the Main Menu. ● In the Main Menu, choose Alarms > Conc Alarms > Inst SHARP. INSTANT SHARP CONC: ACTUAL 0.0 >MIN -10.0 MAX 10000 RANGE Min and Max Instant SHARP Concentration Limits DIAGS ALARM The Minimum Instant SHARP Concentration alarm limit screen is used to change the minimum instant SHARP concentration alarm limit. The minimum and maximum instant SHARP concentration screens function the same way. ● Thermo Fisher Scientific AVG In the Main Menu, choose Alarms > Conc Alarms > Inst SHARP > Min or Max. Model 5030i SHARP Instruction Manual 3-83 Operation Alarms Menu INSTANT SHARP CONC: ACT MIN: 0.0 SET MIN: xxxxx-10 ? §¨ MOVE CURSOR ©ª CHANGE VALUE SAVE RANGE Instant Nephelometer AVG DIAGS ALARM The Instant Nephelometer screen displays the current instant nephelometer concentration and sets the minimum and maximum alarm limits. Acceptable alarm limits range from -10 to 10000 μg/m3 or -.01 to 10 mg/m3. If the instant nephelometer concentration goes beyond either the minimum or maximum limit, an alarm is activated and the alarm (bell) icon appears in the status bar on the Run screen and in the Main Menu. ● In the Main Menu, choose Alarms > Conc Alarms > Inst Neph. INSTANT NEPH CONC: ACTUAL >MIN MAX RANGE Min and Max Instant Nephelometer Concentration Limits AVG 0.0 -10.0 10000 DIAGS ALARM The Minimum Instant Nephelometer Concentration alarm limit screen is used to change the minimum instant nephelometer concentration alarm limit. The minimum and maximum instant nephelometer concentration screens function the same way. ● In the Main Menu, choose Alarms > Conc Alarms > Inst Neph > Min or Max. INSTANT NEPH CONC: ACT MIN: 0.0 SET MIN: xxxxx-10 ? §¨ MOVE CURSOR ©ª CHANGE VALUE SAVE RANGE 3-84 Model 5030i SHARP Instruction Manual AVG DIAGS ALARM Thermo Fisher Scientific Operation Service Menu Service Menu The Service menu appears only when the instrument is in the service mode. When the service mode is active, the service (wrench) icon is displayed on the right side of the status bar. To put the instrument into the service mode: ● In the Main Menu, choose Instrument Controls > Service Mode. Advanced diagnostic functions are included in the service mode. Meaningful data should not be collected when the instrument is in the service mode. ● In the Main Menu, choose Service. SERVICE: >RH/TEMP CALIBRATION PRES/VACUUM CALIBRATION FLOW CALIBRATION MASS CALIBRATION DETECTOR CALIBRATION ª RANGE AVG DIAGS ALARM NEPH CALIBRATION ANALOG OUT CALIBRATION ANALOG INPUT CALIBRATION DISPLAY PIXEL TEST RESTORE USER DEFAULTS RESTORE FACTORY DEFAULTS RH/Temperature Calibration The RH/Temperature Calibration submenu allows the user to view and set the relative humidity and temperature sensor calibration. The RH/temperature calibration submenu is visible only when the instrument is in service mode. For more information on the service mode, see “Service Mode” earlier in this chapter. Note This adjustment should only be performed by an instrument service technician. ▲ ● Thermo Fisher Scientific In the Main Menu, choose Service > RH/Temp Calibration. Model 5030i SHARP Instruction Manual 3-85 Operation Service Menu RH/TEMP CALIBRATION: >AMBIENT TEMP 4.2 FLOW TEMP 0.8 AMBIENT RH 0.0 RANGE Ambient Temperature AVG o o C C % DIAGS ALARM The Ambient Temperature screen allows the user to view and calibrate ambient temperature. Adjust the zero offset until the ambient temperature agrees with your treaceable standard. ● In the Main Menu, choose Service > RH/Temp Calibration > Ambient Temp. CALIBRATE AMBIENT TEMP: TEMPERATURE: 29.9 oC OFFSET: 4.2 oC ©ª INC/DEC SAVE VALUE RANGE Flow Temperature AVG DIAGS ALARM The Flow Temperature screen allows the user to view and calibrate flow temperature. Be sure to have the cover removed and equilibrated to room temperature. ● In the Main Menu, choose Service > RH/Temp Calibration > Flow Temp. CALIBRATE FLOW TEMP: TEMPERATURE: 28.0 OFFSET: 0.8 o o C C ©ª INC/DEC SAVE VALUE RANGE Ambient Relative Humidity Model 5030i SHARP Instruction Manual DIAGS ALARM The Ambient Relative Humidity screen allows the user to view and calibrate relative humidity. Adjust the zero offset until the RH agrees with your treaceable standard. ● 3-86 AVG In the Main Menu, choose Service > RH/Temp Calibration > Ambient RH. Thermo Fisher Scientific Operation Service Menu CALIBRATE AMBIENT RH: REL HUMIDITY: 40.0 % OFFSET: 0.0 % ©ª INC/DEC SAVE VALUE RANGE Pressure/Vacuum Calibration AVG DIAGS ALARM The Pressure/Vacuum Calibration submenu allows the user to view and calibrate the pressure sensor and vacuum flow sensor. The pressure/vacuum calibration submenu is visible only when the instrument is in service mode. For more information on the service mode, see “Service Mode” earlier in this chapter. Note This adjustment should only be performed by an instrument service technician. ▲ ● In the Main Menu, choose Service > Pres/Vacuum Calibration. PRES/VACUUM CALIBRATION: >BARO PRES VAC/FLOW RANGE Barometer Pressure Calibration AVG DIAGS ALARM The Barometer Pressure Calibration submenu is used to calibrate the barometer pressure offset, span or reset default values. ● In the Main Menu, choose Service > Pres/Vacuum Calibration > Baro Pres. BARO PRES CALIBRATION: >OFFSET 0.0 SPAN 1.0000 SET DEFAULTS RANGE Thermo Fisher Scientific AVG DIAGS ALARM Model 5030i SHARP Instruction Manual 3-87 Operation Service Menu Calibrate Barometer Pressure Offset The Calibrate Barometer Pressure Offset screen allows the user to calibrate the pressure sensor at offset pressure. Note The operator should use an independent barometer to measure the ambient pressure and enter the value on this screen before calibrating. ▲ ● In the Main Menu, choose Service > Pres/Vacuum Calibration > Baro Pres Calibration > Offset. CAL BARO PRES OFFSET: PRESSURE: 760 mmHg OFFSET: 747 mmHg? §¨ MOVE CURSOR ©ª CHANGE VALUE SAVE RANGE Calibrate Barometer Pressure Span AVG DIAGS ALARM The Calibrate Barometer Pressure Span screen allows the user to view and pressure sensor calibration span point. Note The operator should use an independent barometer to measure the ambient pressure and enter the value on this screen before calibrating. ▲ ● In the Main Menu, choose Service > Pres/Vacuum Calibration > Baro Pres Calibration > Span. CAL BARO PRESSURE SPAN: PRESSURE: 760 mmHg SET TO: 747 mmHg? §¨ MOVE CURSOR ©ª CHANGE VALUE SAVE RANGE Restore Default Calibration Model 5030i SHARP Instruction Manual DIAGS ALARM The Restore Default Calibration screen allows the user to reset the default values. ● 3-88 AVG In the Main Menu, choose Service > Pres/Vacuum Calibration > Baro Pres Calibration > Set Defaults. Thermo Fisher Scientific Operation Service Menu ● RESTORE DEFAULT CAL: ● RESTORE DEFAULT CAL: RESTORE ● RESTORE ARE YOU SURE YOU WANT TO?x PRESS ¨ TO CONFIRM RESTORE ● RANGE Vacuum/Flow Calibration AVG DIAGS ALARM RANGE AVG DIAGS ALARM The Vacuum/Flow Calibration submenu is used to calibrate the vacuum/flow offset, vacuum/flow span, or reset default values. ● In the Main Menu, choose Service > Pres/Vacuum Calibration > Vac/Flow. VAC PRES CALIBRATION: >VAC/FLOW OFFSET VAC PRES SPAN 1.0000 FLOW PRES SPAN 1.0000 SET DEFAULTS RANGE Calibrate Vacuum/Flow Offset AVG DIAGS ALARM The Calibrate Vacuum/Flow Offset screen calibrates the vacuum/flow sensor offset value. ● In the Main Menu, choose Service > Pres/Vacuum Calibration > Vac/Flow > Vac/Flow Offset. CAL VACUUM/FLOW OFFSET: VAC OFFSET: 0.0 FLOW OFFSET: 0.0 TO CALIBRATE ZERO BY CHANGING FILTER RANGE Calibrate Vacuum Pressure Span AVG DIAGS ALARM The Calibrate Vacuum Pressure Span screen allows the user to view and set the flow sensor calibration span point. Note The operator should use an independent manometer capable of measuring approximately 100 mmHg of vacuum. Measure the vacuum Thermo Fisher Scientific Model 5030i SHARP Instruction Manual 3-89 Operation Service Menu under the filter tape from the positive ΔP port on the rear panel of the instrument and enter the value on this screen before calibrating. ▲ ● In the Main Menu, choose Service > Pres/Vacuum Calibration > Vac/Flow > Vac Pres Span. CAL VAC PRESSURE SPAN: VACUUM: 58.7 mmHg SET TO: 60.0 mmHg? §¨ MOVE CURSOR ©ª CHANGE VALUE SAVE RANGE Calibrate Flow Pressure Span AVG DIAGS ALARM The Flow Pressure Span screen allows the user to view and set the flow sensor calibration span point. Note The operator should use an independent manometer, capable of 30 mmHg ΔP, to measure the differential pressure across the orifice using the positive and negative ΔP ports on the rear panel, and enter the value on this screen before calibrating. ▲ ● In the Main Menu, choose Service > Pres/Vacuum Calibration > Vac/Flow > Flow Pres Span. CAL FLOW PRESSURE SPAN: FLOW: 21.0 mmHg SET TO: 20.0 mmHg? §¨ MOVE CURSOR ©ª CHANGE VALUE SAVE RANGE Restore Default Calibration AVG DIAGS ALARM The Restore Default Calibration screen allows the user to reset the default values. Note Be sure to close the toggle switch after calibration is complete. ▲ ● 3-90 Model 5030i SHARP Instruction Manual In the Main Menu, choose Service > Pres/Vacuum Calibration > Vac/Flow > Set Defaults. Thermo Fisher Scientific Operation Service Menu ● RESTORE DEFAULT CAL: ● RESTORE DEFAULT CAL: RESTORE ● RESTORE ARE YOU SURE YOU WANT TO?x PRESS ¨ TO CONFIRM RESTORE ● RANGE Flow Calibration AVG DIAGS ALARM RANGE AVG DIAGS ALARM The Flow Calibration submenu is used to view and set the flow calibration flow point. The flow calibration screen is visible only when the instrument is in service mode. For more information on the service mode, see “Service Mode” earlier in the chapter. Note This adjustment should only be performed by an instrument service technician. ▲ ● In the Main Menu, choose Service > Flow Calibration. FLOW CALIBRATION: >AUTO MANUAL RANGE Auto Flow Calibration AVG DIAGS ALARM The Auto Flow Calibration screen allows the user to view and set the correct flow rate. The span value is automatically calculated. ● In the Main Menu, choose Service > Flow Calibration > Auto. FLOW AUTO CALIBRATION: FLOW: 16.67 LPM SET TO: 17.25 LPM? §¨ MOVE CURSOR ©ª CHANGE VALUE SAVE RANGE Thermo Fisher Scientific AVG DIAGS ALARM Model 5030i SHARP Instruction Manual 3-91 Operation Service Menu Manual Flow Calibration The Manual Flow Calibration screen allows the user to view and incrementally set the flow sensor calibration span factor. ● In the Main Menu, choose Service > Flow Calibration > Manual. FLOW MANUAL CALIBRATION: FLOW: 16.67 SPAN: 0.750 ? ©ª INC/DEC SAVE VALUE RANGE Mass Calibration AVG DIAGS ALARM The Mass Calibration submenu is used to view and set the mass calibration point. The mass calibration screen is visible only when the instrument is in service mode. For more information on the service mode, see “Service Mode” earlier in the chapter. Note This adjustment should only be performed by an instrument service technician. ▲ ● In the Main Menu, choose Service > Mass Calibration. MASS CALIBRATION: >THERMAL COEFFICIENT VACUUM COEFFICIENT BARO COEFFICIENT MASS COEFFICIENT ALPHA EFF COEFFICIENT RANGE Thermal Mass Coefficient Model 5030i SHARP Instruction Manual DIAGS ALARM The Thermal Mass Coefficient screen allows the user to view and set the thermal coefficient using manual calibration mode. (Factory set.) ● 3-92 AVG In the Main Menu, choose Service > Mass Calibration > Thermal Coefficient. Thermo Fisher Scientific Operation Service Menu THERMAL MASS COEFFICIENT: CURRENTLY: 0.000000 SET TO: 0023.000 ? §¨ MOVE CURSOR ©ª CHANGE VALUE SAVE RANGE Vacuum Mass Coefficient AVG DIAGS ALARM The Vacuum Mass coefficient screen allows the user to view and set the vacuum coefficient using manual calibration mode. (Factory set.) ● In the Main Menu, choose Service > Mass Calibration > Vacuum Coefficient. VACUUM MASS COEFFICIENT: CURRENTLY: 0.000000 SET TO: 0002.000 ? §¨ MOVE CURSOR ©ª CHANGE VALUE SAVE RANGE Barometer Mass Coefficient AVG DIAGS ALARM The Barometer Mass Coefficient screen allows the user to view and set the barometer coefficient using manual calibration mode. (Factory set.) ● In the Main Menu, choose Service > Mass Calibration > Baro Coefficient. BARO. MASS COEFFICIENT: CURRENTLY: 0.000000 SET TO: 0.000540 ? §¨ MOVE CURSOR ©ª CHANGE VALUE SAVE RANGE Mass Coefficient DIAGS ALARM The Mass Coefficient submenu allows the user to view and set the mass coefficient using manual or auto mode. (Factory set.) ● Thermo Fisher Scientific AVG In the Main Menu, choose Service > Mass Calibration > Mass Coefficient. Model 5030i SHARP Instruction Manual 3-93 Operation Service Menu MASS COEFFICIENT: >AUTO MANUAL RANGE Auto Mass Coefficient AVG DIAGS ALARM The Auto Mass Coefficient screen allows the user to conduct a mass foil calibration. a series of screens will walk you through the Note After pressing mass foil calibration procedure. For details, see “Auto Mass Coefficient” on page 4-9. ▲ ● In the Main Menu, choose Service > Mass Calibration > Mass > Auto. MASS COEF: FOIL VALUE: 7000.0 1442 μg 3 TO SAVE FOIL VALUE AND OPEN BENCH RANGE Manual Mass Coefficient AVG DIAGS ALARM The Manual Mass Coefficient screen allows the user to adjust the mass coefficient used in beta attenuation. ● In the Main Menu, choose Service > Mass Calibration > Mass > Manual. MASS COEFFICIENT: CURRENTLY: SET TO: 7000 6992 ? §¨ MOVE CURSOR ©ª CHANGE VALUE SAVE RANGE Alpha Efficiency Coefficient 3-94 Model 5030i SHARP Instruction Manual AVG DIAGS ALARM The Alpha Efficiency Coefficient screen allows the user to view and set the alpha efficiency value. Thermo Fisher Scientific Operation Service Menu Note This value is set in the factory and should not be adjusted. ▲ ● In the Main Menu, choose Service > Mass Calibration > Alpha Eff Coefficient. ALPHA EFFICIENCY COEF: CURRENTLY: 0.120000 SET TO: 0.120001 ? §¨ MOVE CURSOR ©ª CHANGE VALUE SAVE RANGE Detector Calibration AVG DIAGS ALARM The Detector Calibration submenu is used to view and set the detector calibration. The detector calibration screen is visible only when the instrument is in service mode. For more information on the service mode, see “Service Mode” earlier in the chapter. Note This adjustment should only be performed by an instrument service technician on a defined service interval and at least once per year, or if the detector is replaced. ▲ ● In the Main Menu, choose Service > Detector Calibration. DETECTOR CALIBRATION: >AUTO MANUAL RANGE Auto Detector Calibration DIAGS ALARM The Auto Detector Calibration screen allows the user to conduct a detector optimization routine that will establish the optimal plateau for detector performance. This process takes approximately 30 minutes and will set a high voltage and thresholds for alpha and beta reference counts. ● Thermo Fisher Scientific AVG In the Main Menu, choose Service > Detector Calibration > Auto. Model 5030i SHARP Instruction Manual 3-95 Operation Service Menu DETECTOR AUTO CAL: HIGH VOLT: 1500 V BETA CNT : 14649 1/sec PRESS TO START AUTO CAL RANGE Manual Detector Calibration AVG DIAGS ALARM The Mass Coefficient submenu allows the user to perform a mass foil calibration using a zero (null) and span foil set. ● In the Main Menu, choose Service > Detector Calibration > Manual. DETECTOR MANUAL CAL: >BETA/REF/ALPHA COUNTS HIGH VOLTAGE BETA REF THRESHOLD ALPHA THRESHOLD RANGE Beta/Ref/Alpha Counts AVG The Beta/Ref/Alpha Counts screen allows the user to view the real-time alpha and beta counts. ● In the Main Menu, choose Service > Detector Calibration > Manual > Beta/Ref/Alpha Counts. COUNTS: alpha beta beta corr beta ref RANGE High Voltage Model 5030i SHARP Instruction Manual AVG 0 10212 10145 5200 1/sec 1/sec 1/sec 1/sec DIAGS ALARM The High Voltage screen allows the user to view and set the high voltage value. ● 3-96 DIAGS ALARM In the Main Menu, choose Service > Detector Calibration > Manual > High Voltage. Thermo Fisher Scientific Operation Service Menu HIGH VOLTAGE: CURRENTLY: SET TO: 1500 V 1501 V? ©ª INC/DEC SAVE VALUE RANGE Beta Ref Threshold AVG DIAGS ALARM The Beta Ref Threshold screen allows the user to view and set the detector operating voltage manually. ● In the Main Menu, choose Service > Detector Calibration > Manual > Beta Ref Threshold. REF BETA THRESHOLD: CURRENTLY: SET TO: 500 501 ? ©ª INC/DEC SAVE VALUE RANGE Alpha Threshold AVG DIAGS ALARM The Alpha Threshold screen allows the user to view and set the alpha threshold manually. ● In the Main Menu, choose Service > Detector Calibration > Manual > Alpha Threshold. ALPHA THRESHOLD: CURRENTLY: SET TO: 1500 1501 ? ©ª INC/DEC SAVE VALUE RANGE Nephelometer Calibration AVG DIAGS ALARM The Nephelometer Calibration submenu is used to view and set the nephelometer calibration. The nephelometer calibration screen is visible only when the instrument is in service mode. For more information on the service mode, see “Service Mode” earlier in the chapter. Note This adjustment should only be performed by an instrument service technician. ▲ Thermo Fisher Scientific Model 5030i SHARP Instruction Manual 3-97 Operation Service Menu ● In the Main Menu, choose Service > Nephelometer Calibration. NEPHELOMETER CALIBRATION: >NEPH RH 4.0 % NEPH TEMP 2.6 oC NEPH SRC LEVEL 35 % RANGE Nephelometer RH AVG DIAGS ALARM The Nephelometer RH screen allows the user to view and calibrate the nephelometer relative humidity. ● In the Main Menu, choose Service > Neph Calibration > Neph RH. CALIBRATE NEPH RH: NEPH RH: 50.0 % OFFSET: 3.5 % ©ª INC/DEC SAVE VALUE RANGE Nephelometer Temperature AVG DIAGS ALARM The Nephelometer Temperature screen allows the user to view and calibrate the nephelometer temperature sensor calibration. ● In the Main Menu, choose Service > Neph Calibration > Neph Temp. CALIBRATE NEPH TEMP: NEPH TEMP: 25.0 OFFSET: 2.2 o o C C ©ª INC/DEC SAVE VALUE RANGE Nephelometer Source Level Model 5030i SHARP Instruction Manual DIAGS ALARM The Nephelometer Source Level screen allows the user to view and calibrate the source level. ● 3-98 AVG In the Main Menu, choose Service > Neph Calibration > Neph Src Level. Thermo Fisher Scientific Operation Service Menu SOURCE LEVEL SET: IRED: SRC LEVEL: 70 mA 32 % ©ª INC/DEC SAVE VALUE RANGE Analog Output Calibration AVG DIAGS ALARM The Analog Output Calibration menu provides access to the 6 voltage channels and 6 current channels for calibration. Current channels are visible only if the I/O expansion board is installed. The analog output calibration menu is visible only when the instrument is in service mode. For more information on the service mode, see “Service Mode” earlier in this chapter. Note This adjustment should only be performed by an instrument service technician. ▲ ● In the Main Menu, choose Service > Analog Out Calibration. ANALOG OUTPUT CAL: >VOLTAGE CHANNEL 1 VOLTAGE CHANNEL 2 VOLTAGE CHANNEL 3 VOLTAGE CHANNEL 4 VOLTAGE CHANNEL 5 RANGE AVG ª DIAGS ALARM ANALOG OUTPUT CAL: >CALIBRATE ZERO CALIBRATE FULL SCALE RANGE Analog Output Calibrate Zero DIAGS ALARM The Analog Output Calibrate Zero screen allows the user to calibrate the zero state of the selected analog output. The operator must connect a volt meter to the output and adjust the output until it reads 0.0 V on the meter for a voltage channel, or either 0 or 4 mA for a current channel (depending on the selected range). See the “set output to:” field on the display. ● Thermo Fisher Scientific AVG In the Main Menu, choose Service > Analog Out Cal > select Channel > Calibrate Zero. Model 5030i SHARP Instruction Manual 3-99 Operation Service Menu ANALOG OUTPUT CAL: ZERO CONNECT METER TO OUTPUT! SELECTED OUTPUT: V1 SET TO: 100 SAVE VALUE ©ª INC/DEC SET OUTPUT TO: 0.0 V RANGE Analog Output Calibrate Full-Scale AVG DIAGS ALARM The Analog Output Calibrate Full-Scale screen allows the user to calibrate the full-scale state of the selected analog output. The operator must connect a volt meter to the output and adjust the output until the meter reads the value shown in the “set output to:” field, in either V or mA, depending on the selected output channel. ● In the Main Menu, choose Service > Analog Out Cal > select Channel > Calibrate Full Scale. ANALOG OUTPUT CAL: SPAN CONNECT METER TO OUTPUT! SELECTED OUTPUT: V1 SET TO: 3397 SAVE VALUE ©ª INC/DEC SET OUTPUT TO: 10 V RANGE Analog Input Calibration AVG DIAGS ALARM The Analog Input Calibration menu is used to calibrate the 8 analog input channels at both zero and full-scale. The analog input calibration menu is visible only when the I/O expansion board is installed and when the instrument is in service mode. For more information on the service mode, see “Service Mode” earlier in this chapter. Note This adjustment should only be performed by an instrument service technician. ▲ ● 3-100 Model 5030i SHARP Instruction Manual In the Main Menu, choose Service > Analog Input Calibration. Thermo Fisher Scientific Operation Service Menu ANALOG >INPUT INPUT INPUT INPUT INPUT RANGE INPUT CAL: CHANNEL 1 CHANNEL 2 CHANNEL 3 CHANNEL 4 CHANNEL 5 AVG ª DIAGS ALARM ANALOG INPUT CAL: >CALIBRATE ZERO CALIBRATE FULL SCALE RANGE Analog Input Calibrate Zero AVG DIAGS ALARM The Analog Input Calibrate Zero screen allows the user to calibrate the zero state of the selected analog input. ● In the Main Menu, choose Service > Analog Input Cal > select Channel > Calibrate Zero. ANALOG INPUT CAL: ZERO DISCONNECT SELECTED INPUT! SELECTED INPUT: INPUT 1 CURRENTLY: 0.04 V CALIBRATE INPUT TO ZERO RANGE Analog Input Calibrate Full-Scale AVG DIAGS ALARM The Analog Input Calibrate Full-Scale screen allows the user to calibrate the full-scale state of the selected analog input. ● In the Main Menu, choose Service > Analog Input Cal > select Channel > Calibrate Full Scale. (Hook up a voltage source of 10 V to the analog input channel.) ANALOG INPUT CAL: SPAN PROVIDE VOLTAGE TO INPUT! SELECTED INPUT: INPUT 1 CURRENTLY: 9.84 V SET TO: 10.00 V CALIBRATE TO VALUE RANGE Thermo Fisher Scientific AVG DIAGS ALARM Model 5030i SHARP Instruction Manual 3-101 Operation Service Menu Display Pixel Test The Display Pixel Test screen is used to test the LCD display, by toggling between all pixels on and all pixels off to ensure that they are functioning properly. The display pixel test screen is visible only when the instrument is in service mode. For more information on the service mode, see “Service Mode” earlier in this chapter. ● In the Main Menu, choose Service > Display Pixel Test. DISPLAY PIXEL TEST: DURING TEST PRESS OR ¨x TO EXIT, TO TOGGLEXXXXX BEGIN TEST GO BACK TO MENU RANGE Restore User Defaults AVG The Restore User Defaults screen is used to reset the user calibration and configuration values to factory defaults. The restore user defaults screen is visible only when the instrument is in service mode. For more information on the service mode, see “Service Mode” earlier in this chapter. ● In the Main Menu, choose Service > Restore User Defaults. ● DEFAULTS: RESTORE USER ● RESTORE ● RANGE DIAGS ALARM ● AVG DIAGS ALARM RESTORE USER DEFAULTS: RESTORE ARE YOU SURE YOU WANT TO?x PRESS ¨ TO CONFIRM RESTORE RANGE AVG DIAGS ALARM ● Restore Factory Defaults The Restore User Defaults screen is used to reset the user calibration and configuration values to factory defaults. The restore user defaults screen is visible only when the instrument is in service mode. For more information on the service mode, see “Service Mode” earlier in this chapter. ● 3-102 Model 5030i SHARP Instruction Manual In the Main Menu, choose Service > Restore User Defaults. Thermo Fisher Scientific Operation Password Menu ● RESTORE FACTORY DEFAULTS: ● RESTORE ● RANGE ● AVG DIAGS ALARM RESTORE FACTORY DEFAULTS: RESTORE ARE YOU SURE YOU WANT TO?x PRESS ¨ TO CONFIRM RESTORE RANGE AVG DIAGS ALARM ● Password Menu The Password menu allows the user to configure password protection. If the instrument is “locked”, none of the settings may be changed via the front panel user interface, but they can still be changed via remote operation. When the front panel is locked, the user can still navigate the menu and view data, instrument parameters, and settings, but nothing can be changed. The password (lock) icon on the right side of the status bar indicates that the password lock is active. The items visible under the Password menu are determined by the instrument’s password status. ● In the Main Menu, choose Password. PASSWORD MENU: >SET PASSWORD LOCK INSTRUMENT CHANGE PASSWORD REMOVE PASSWORD UNLOCK INSTRUMENT RANGE Set Password AVG DIAGS ALARM The Set Password screen is used to set the password that is used to unlock the front panel, and is shown if the instrument is unlocked and the password is not set. ● In the Main Menu, choose Password > Set Password ENTER NEW PASSWORD: RANGXXXXXE ABCDEFGHIJKLMN OPQRSTUVWXYZ 0123456789 ./RANGE Thermo Fisher Scientific AVG BKSP PAGE SAVE DIAGS ALARM Model 5030i SHARP Instruction Manual 3-103 Operation Password Menu Lock Instrument The Lock Instrument screen is used to lock the instrument’s front panel so users cannot change any settings from the front panel. The lock instrument screen is shown if the instrument is unlocked and the password is set. ● In the Main Menu, choose Password > Lock Instrument LOCK FRONT PANEL: XXXPRESSING ENTER WILLXXXX PREVENT USER FROM CHANGING XCONFIG FROM FRONT PANELXX LOCK AND RETURN TO RUN RANGE Lock/Unlock and Local/Remote Operation AVG DIAGS ALARM If the instrument is locked via the front panel using Password > Lock Instrument, the instrument reports being in Remote mode. In this mode, the front panel is “locked”, where data can be viewed, settings can be viewed but not changed using the front panel interface, and the remote “Set” commands are active. If the instrument keyboard is unlocked via the front panel using Password > Unlock Instrument, the instrument reports being in Local mode, the front panel interface is unlocked, and settings can be changed from the front panel. Refer to “C-Link Protocol Commands” appendix for detailed information about “mode”, “allow mode”, and “power up mode” commands. Change Password The Change Password screen is used to change the password used to unlock the instrument’s front panel. The change password screen is shown if the instrument is unlocked. ● In the Main Menu, choose Password > Change Password ENTER NEW PASSWORD: RANGXXXXXE ABCDEFGHIJKLMN OPQRSTUVWXYZ 0123456789 ./RANGE 3-104 Model 5030i SHARP Instruction Manual AVG BKSP PAGE SAVE DIAGS ALARM Thermo Fisher Scientific Operation Password Menu Remove Password The Remove Password screen is used to erase the current password and disable password protection. The remove password screen is shown if the instrument is unlocked and the password is set. ● In the Main Menu, choose Password > Remove Password REMOVE PASSWORD: XXXPRESSING ENTER WILLXXXX XREMOVE CURRENT PASSWORDXX XXXAND DISABLE LOCKINGXXXX REMOVE PASSWORD RANGE Unlock Instrument AVG DIAGS ALARM The Unlock Instrument screen is used to enter the password to unlock the front panel. The unlock instrument screen is shown if the instrument is locked. ● In the Main Menu, choose Password > Unlock Instrument ENTER THE PASSWORD: RANGXXXXXE ABCDEFGHIJKLMN OPQRSTUVWXYZ 0123456789 ./RANGE Thermo Fisher Scientific AVG BKSP PAGE SAVE DIAGS ALARM Model 5030i SHARP Instruction Manual 3-105 Chapter 4 Calibration The Model 5030i is an instrument that can make accurate mass concentration measurements of PM10, PM2.5 and PM1.0. However, with all electronic instruments, the accuracy of the measurements depends on proper calibration. In general terms, calibration, also called standardization, is the process that establishes the relationship between sensor output signals and the parameter the operator is attempting to measure. The 5030i instrument uses sensors that measure temperature, humidity, pressure, and radiation. This chapter describes the procedures for performing the necessary sensor calibrations. This chapter is also a follow-up to the Acceptance Testing outlined in the “Installation” chapter and a continuation of the menu display descriptions in the “Operation” chapter. Frequency of Calibration Each instrument is calibrated and tested for accuracy at the factory. The mass calibration is conducted with a set of NIST-traceable mass calibration foils. The radiation detector is calibrated against certified check sources for beta and alpha emissions. The temperature, relative humidity, pressure and flow rate are all calibrated against NIST traceable standards. It is recommended that the instrument be calibrated once per year and encounter quality checks on a periodic basis in accordance with the users specific quality assurance project plan. For example, volumetric flow checks on a two-week basis are common in some air monitoring agencies and with full-scale quarterly audits for flow and mass. The Quality Assurance Handbook for Air Pollution Measurement Systems, published by the U.S. EPA, Research Triangle Park, NC 27711, can be consulted for detailed quality assurance guidelines. Equipment Required Optional mass transfer standards are available from Thermo Fisher Scientific for performing an annual mass calibration. However, additional specialized equipment is needed to calibrate the Model 5030i for temperature, relative humidity, barometric pressure, and volumetric flow. The following equipment should be used: ● Thermo Fisher Scientific A thermistor or thermocouple thermometer capable of measuring ambient temperatures in a range of –20 to 50 °C, readable to the Model 5030i SHARP Instruction Manual 4-1 Calibration Pre-Calibration nearest 0.1 °C. This thermometer should be referenced to within an accuracy of ±0.5 °C to NIST-traceable precision thermometers. Multiple thermometers may be used to cover the temperature range as long as each thermometer meets the accuracy and readability specifications described above. Pre-Calibration Calibration Procedure 4-2 Model 5030i SHARP Instruction Manual ● A barometer capable of measuring barometric pressure over a range of 600 to 800 mmHg (80 to 106 kilo Pascals [kPa]) and readable to the nearest 1 mmHg. At least once a year, this barometer should be calibrated to within ±5 mmHg of a NIST-traceable barometer of known accuracy. ● Flow-rate Transfer Standard (FTS) measurement equipment capable of calibrating, or verifying, the volumetric flow rate measurement with an accuracy of ±2 percent. This flow rate standard must be a separate, stand-alone device. It must have its own certification and be traceable to a NIST primary standard for volume or flow rate. Dry-piston meters and bubble flow meters should only be used under controlled laboratory conditions. Ambient field measurements should use a NISTtraceable low pressure drop orifice/venturi flow meter (such as, BGI Delta-Cal) or a Streamline Pro™ Model SX Kit (2-25 L/min). ● A relative humidity (RH) standard capable of measuring in the range of 35-75% RH, readable to the nearest 0.5% RH and accurate to within 2% RH. Prior to calibration, be sure the Model 5030i is operating properly. The Model 5030i’s internal diagnostics makes this a quick and simple process. Turn on the instrument and allow it to stabilize for one hour prior to calibrating. If you are receiving this instrument for the first time, the optional acceptance testing in the “Installation” chapter should also be reviewed. If the internal flow temperature sensor requires calibration, the dynamic heating system should be turned OFF, the cover should be removed, and the instrument should sample room temperature air at least one hour prior to calibrating. The order of calibration described below is preferred for optimal performance of the 5030i and comes from many years of experience working with and developing ambient particulate monitoring instrumentation. The Calibration submenus allow the user to view and calibrate the instrument. All calibration submenus are visible only when the instrument is in service mode. For more information on the service mode, see “Service Mode” earlier in Chapter 3. Thermo Fisher Scientific Calibration Calibration Procedure RH/Temperature Calibration All screens that appear in this chapter have been referenced in the previous chapter. Ambient Temperature Using a NIST-traceable thermometer as a reference collocated next to the ambient RH/temperature sensor assembly, measure and compare three individual readings between both the reference and the 5030i response. Taking an average of both sets of readings, calculate the average difference between the two readings and record that as your offset. This offset (ZERO) should now be entered in the screen below: CALIBRATE AMBIENT TEMP: TEMPERATURE: 29.9 oC ZERO: 4.2 oC ©ª INC/DEC SAVE VALUE RANGE AVG DIAGS ALARM Be sure to save the entry and compare the values once more. If it appears that the temperature has shifted into the wrong direction, change the sign of your offset value. Ambient Relative Humidity Using a NIST-traceable hygrometer as a reference collocated next to the ambient RH/temperature sensor assembly, measure and compare three individual readings between both the reference and the 5030i response. Taking an average of both sets of readings, calculate the average difference between the two readings and record that as your offset. This offset (ZERO) should now be entered in the screen below: CALIBRATE AMBIENT RH: REL HUMIDITY: 40.0 % ZERO: 0.0 % ©ª INC/DEC SAVE VALUE RANGE AVG DIAGS ALARM Be sure to save the entry and compare the values once more. If it appears that the temperature has shifted into the wrong direction, change the sign of your offset value. Thermo Fisher Scientific Model 5030i SHARP Instruction Manual 4-3 Calibration Calibration Procedure Flow Temperature Assuming the instrument cover has been removed, the heater has been turned off and removed from the instrument and the instrument has been sampling room temperature air for 1-hour, this calibration can now proceed. Using a NIST-traceable thermometer as a reference collocated next to the small sample tube inlet on top of the instrument, measure and compare three individual readings between both the reference and the 5030i response. Taking an average of both sets of readings, calculate the average difference between the two readings and record that as your offset. This offset (ZERO) should now be entered in the screen below: CALIBRATE FLOW TEMP: TEMPERATURE: 28.0 ZERO: 0.8 o o C C ©ª INC/DEC SAVE VALUE RANGE AVG DIAGS ALARM Be sure to save the entry and compare the values once more. If it appears that the temperature has shifted into the wrong direction, change the sign of your offset value. Pressure/Vacuum Calibration There are three pressure sensors that can be calibrated, however, the primary sensor to be calibrated is the barometric pressure sensor. Both the vacuum sensor and pressure flow sensors are re-zeroed automatically with every filter tape change. Barometer Pressure Calibration Using a NIST-traceable barometer, measure the barometric pressure (and convert as necessary) in units of millimetres of mercury (mmHg). Use the SPAN feature from the barometric calibration submenu. BARO PRES CALIBRATION: >SPAN 1.0000 SET DEFAULTS RANGE 4-4 Model 5030i SHARP Instruction Manual AVG DIAGS ALARM Thermo Fisher Scientific Calibration Calibration Procedure CAL BARO PRESSURE SPAN: PRESSURE: 760 mmHg SET TO: 747 mmHg? §¨ MOVE CURSOR ©ª CHANGE VALUE SAVE RANGE AVG DIAGS ALARM Be sure to save the entry and compare the values once more. Repeat as necessary to within 2 mmHg. Calibrate Vacuum/Flow Zero The Calibrate Vacuum/Flow Zero screen calibrates the vacuum/flow sensor at zero value. This is done automatically with every filter tape change. However, if for any reason this needs to be done, proceed to the following screen below to execute a zeroing filter tape change. CAL VACUUM/FLOW ZERO: VAC ZERO: 0.0 FLOW ZERO: 0.0 TO CALIBRATE ZERO BY CHANGING FILTER RANGE Calibrate Vacuum Pressure Span AVG DIAGS ALARM The Calibrate Vacuum Pressure Span screen allows the user to view and set the vacuum sensor calibration span point. To calibrate the vacuum sensor, zero a digital manometer (capable of measuring up to 100 mmHg) and attach to the +ΔPA port on the rear panel. Then push the toggle switch on the right inward to open (see Figure 4–1). The manometer reading can now be used to calibrate the vacuum sensor. Thermo Fisher Scientific Model 5030i SHARP Instruction Manual 4-5 Calibration Calibration Procedure Figure 4–1. Differential Pressure and Vacuum Calibration Ports ● In the Main Menu, choose Service > Pres/Vacuum Calibration > Vac/Flow > Vac Pres Span. CAL VAC PRESSURE SPAN: VACUUM: 58.7 mmHg SET TO: 60.0 mmHg? §¨ MOVE CURSOR ©ª CHANGE VALUE SAVE RANGE Calibrate Flow Pressure Span AVG DIAGS ALARM The Flow Pressure Span screen allows the user to view and set the flow sensor calibration span point. To calibrate the flow pressure sensor span point, the instrument must be pulling an active flow through the filter tape. By use of a manometer, connect the respective +/- ports of your NIST-traceable manometer to the respective rear panel +/- ports. (Please be certain to zero any digital manometers prior to connecting!) Open the ports by pressing the toggle switches inward. Calculate an average reading from the reference manometer in units of mmHg. Enter this span value into the screen below: 4-6 Model 5030i SHARP Instruction Manual Thermo Fisher Scientific Calibration Calibration Procedure ● In the Main Menu, choose Service > Pres/Vacuum Calibration > Vac/Flow > Flow Pres Span. CAL FLOW PRESSURE SPAN: FLOW: 21.0 mmHg SET TO: 20.0 mmHg? §¨ MOVE CURSOR ©ª CHANGE VALUE SAVE RANGE AVG DIAGS ALARM Be sure to save the entry and compare the values once more. Repeat as necessary to within 2 mmHg. Flow Calibration The preferred method of flow rate calibration is the Auto Flow Calibration. Auto Flow Calibration Place a NIST-traceable volumetric flow meter on top of the instrument after complete installation (reassembled heater tube, sample tubes, and inlets). Allow approximately 1-minute for the flow to stabilize. Once stable, measure and average three individual readings from the reference. This average observed flow rate from your reference meter should now be entered in the screen below: FLOW AUTO CALIBRATION: FLOW: 16.67 LPM SET TO: 17.25 LPM? §¨ MOVE CURSOR ©ª CHANGE VALUE SAVE RANGE AVG DIAGS ALARM Be sure to save the entry and compare the values once more. Repeat as necessary to within +/- 2 %. Perform the “Leak Test” procedure on page 5-6 to verify no leaks. Mass Calibration Thermo Fisher Scientific The Model 5030i SHARP is calibrated for mass in the factory using a series of null and span foils. The mass transfer standard foil sets are available from Thermo Fisher Scientific, and should be used as part of a QA Program for performing a QC check on the mass measurements. This mass foil calibration procedure can be used for QC checks, auditing, and calibration. Model 5030i SHARP Instruction Manual 4-7 Calibration Calibration Procedure The Mass Calibration submenu is used to view and set the mass calibration point. The mass calibration screen is visible only when the instrument is in service mode. For more information on the service mode, see “Service Mode” earlier in the chapter. Note This adjustment should only be performed by an instrument service technician. ▲ ● In the Main Menu, choose Service > Mass Calibration>Mass Coefficient. MASS CALIBRATION: THERMAL COEFFICIENT VACUUM COEFFICIENT BARO COEFFICIENT >MASS COEFFICIENT ALPHA EFF COEFFICIENT RANGE AVG DIAGS ALARM It is recommended to perform an annual Mass Coefficient on the Model 5030i Beta Monitor. ● The foil sets must be kept in a clean container. Do not touch the foil window with your fingers. ● The foils must not be wiped, otherwise a loss or gain of mass can occur thereby biasing the mass calibration. ● Foils sets can be returned to Thermo Fisher Scientific for recalibration as necessary. ● Separate foil sets are recommended for periodic QC checks, auditing, and calibration. ● Should the user suspect the foil window(s) has been damaged, scratched, or coated, these foil sets should be returned to Thermo Fisher Scientific for re-calibration. The null foil has the same approximate mass as a clean filter spot and the span foil is a calibrated mass increase above the null foil. Therefore, the foils come in a set and must not be mixed with other sets since a bias in mass calibration will occur. Since the beta attenuation method is linear with mass increase, the Model 5030i need not be calibrated in the exact range of beta attenuation per filter spot. What is important, is calibrating the corresponding beta count reduction with an increase of calibrated mass. 4-8 Model 5030i SHARP Instruction Manual Thermo Fisher Scientific Calibration Calibration Procedure Note To achieve the most accurate mass calibration, the flow temperature should be as stable as possible and therefore the instrument should have the heating system turned off, and the instrument should be allowed to equilibrate to shelter or ambient temperature. If the Model 5030i Beta is mounted within an ambient shelter, then the most stable time of day to perform a mass calibration would be either early morning or late afternoon. ▲ Mass Coefficient The preferred method of mass coefficient calibration is the Auto Mode. ● In the Main Menu, choose Service > Mass Calibration > Mass Coefficient. MASS COEFFICIENT: >AUTO MANUAL RANGE Auto Mass Coefficient AVG DIAGS ALARM The Auto Mass Coefficient screen allows the user to conduct a mass calibration of the measurement head and will walk you through the process. Use the following procedure to conduct a mass calibration: 1. In the Main Menu, choose Service > Mass Calibration > Mass > Auto. 2. Enter the SPAN foil value (e.g., 1,328 μg) using the keypad and press to save the foil value and to open the bench. The beta attenuation chamber should now open. MASS COEF: FOIL VALUE: 7000.0 1328 μg 3 TO SAVE FOIL VALUE AND OPEN BENCH RANGE Thermo Fisher Scientific AVG DIAGS ALARM Model 5030i SHARP Instruction Manual 4-9 Calibration Calibration Procedure 3. Cut/break the filter tape and remove from the bench. Then insert the Foil Holder from the calibration kit and press while maintaining a slight sideward pressure on the filter holder. MASS COEF: FOIL VALUE: 7000.0 1328 μg 3 REMOVE TAPE, INSERT FOIL HOLDER, TO CLOSE BENCH RANGE AVG DIAGS ALARM 4. Insert the Null/Zero foil with the label side up and press to proceed with the foil calibration, or press to stop the foil. MASS COEF: ● FOIL VALUE: ● 7000.0 1328 µg MASS COEF: FOIL VALUE: Beta Avg 3 ● INSERT NULL FOIL TO START ZERO CAL AVG 3 PLEASE WAIT ● RANGE 7000.0 1328 µg 12016 1/sec DIAGS ALARM RANGE AVG 265 sec DIAGS ALARM The auto zero procedure of mass will begin and last approximately 270 seconds. When the zero is complete, the beta attenuation measurement will remain closed and an average Beta count rate is displayed. MASS COEF: FOIL VALUE: Beta Avg 7000.0 1328 μg 12022 1/sec 3 REMOVE NULL FOIL TO CONTINUE RANGE AVG DIAGS ALARM 5. Remove the zero/null foil and insert with the Span foil (e.g., 1328 ug) and press to begin the span calibration, or press to stop the foil. 4-10 Model 5030i SHARP Instruction Manual Thermo Fisher Scientific Calibration Calibration Procedure MASS COEF: ● FOIL VALUE: ● Beta Avg 7000.0 1328 µg 12022 1/sec 3 ● INSERT SPAN FOIL TO START MASS CAL AVG 7000.0 1328 µg 9884 1/sec 3 PLEASE WAIT ● RANGE MASS COEF: FOIL VALUE: Beta Avg DIAGS ALARM RANGE AVG 245 sec DIAGS ALARM The span foil calibration procedure is now active and after another 270 seconds the calibration procedure should end, whereby a new Mass Coef value is shown and the percent difference is shown from the last foil calibration to the current calibration. This percent difference can also be used to directly audit the mass coefficient value since a percent difference in a mass coefficient is the same percent mass difference overall. MASS COEF: 6878.7 FOIL VALUE: 1328 μg Beta Avg 9911 1/SEC difference -1.7 % REMOVE SPAN FOIL TO CONTINUE 3 RANGE AVG DIAGS ALARM 6. After the span calibration, the screen will ask you to press to to keep the old Mass accept the new calibration. Otherwise press Coef value. Remove the span foil and press . The bench will now open. Remove the filter holder, replace the filter tape and press to confirm the calibration routine has now been competed. MASS COEF: 6878.7 FOIL VALUE: 1328 μg Beta Avg 9911 1/sec difference -1.7 % REMOVE HOLDE, INSERT TAPE, TO CLOSE BENCH 3 RANGE Thermo Fisher Scientific AVG DIAGS ALARM Model 5030i SHARP Instruction Manual 4-11 Calibration Calibration Procedure MASS COEF: 6878.7 FOIL VALUE: 1328 μg Beta Avg 9911 1/sec difference -1.7 % TO ACCEPT NEW VALUES § TO DECLINE 3 RANGE Detector Calibration AVG DIAGS ALARM The Detector Calibration submenu is used to view and set the detector calibration. The detector calibration screen is visible only when the instrument is in service mode. For more information on the service mode, see “Service Mode” earlier in the chapter. Note This adjustment should only be performed by an instrument service technician. ▲ ● In the Main Menu, choose Service > Detector Calibration. DETECTOR CALIBRATION: >AUTO MANUAL RANGE Auto Detector Calibration AVG DIAGS ALARM The Auto Detector Calibration screen allows the user to optimize the detector performance. This should be done at least once per year and as often as once per quarter. ● In the Main Menu, choose Service > Detector Calibration > Auto. DETECTOR AUTO CAL: HIGH VOLT: 1500 V BETA CNT : 14649 1/sec PRESS TO START AUTO CAL RANGE AVG DIAGS ALARM This procedure will take approximately 30 minutes until completed. Thereafter, a high voltage (HV), beta reference threshold and alpha threshold will be assigned a new valve. 4-12 Model 5030i SHARP Instruction Manual Thermo Fisher Scientific Calibration Calibration Procedure Nephelometer Calibration The Nephelometer Calibration submenu is used to view and set the nephelometer calibration. The nephelometer calibration screen is visible only when the instrument is in service mode. For more information on the service mode, see “Service Mode” earlier in the chapter. Note This adjustment should only be performed by an instrument service technician. ▲ ● In the Main Menu, choose Service > Nephelometer Calibration. NEPHELOMETER CALIBRATION: >NEPH RH 0.0 % NEPH TEMP 0.0 oC NEPH SRC LEVEL 0 % RANGE Nephelometer RH AVG DIAGS ALARM The Nephelometer RH screen allows the user to view and calibrate the nephelometer relative humidity. Note Calibration of the nephelometer RH must be done with the heater in the “OFF” position. ▲ ● In the Main Menu, choose Service > Neph Calibration > Neph RH. CALIBRATE NEPH RH: NEPH RH: 0.0 % OFFSET: 0.0 % ©ª INC/DEC SAVE VALUE RANGE Nephelometer Temperature AVG DIAGS ALARM The Nephelometer Temperature screen allows the user to view and calibrate the nephelometer temperature sensor calibration. Note Calibration of the nephelometer temperature must be done with the heater in the “OFF” position. ▲ Thermo Fisher Scientific Model 5030i SHARP Instruction Manual 4-13 Calibration Calibration Procedure ● In the Main Menu, choose Service > Neph Calibration > Neph Temp. CALIBRATE NEPH TEMP: NEPH TEMP: 0.0 OFFSET: 0.0 o o C C ©ª INC/DEC SAVE VALUE RANGE Nephelometer Source Level AVG DIAGS ALARM The Nephelometer Source Level screen allows the user to view and calibrate the source level. This should be within 60-70 mA. If it is outside of this range, please adjust the % SRC Level until the IRED reads 65 mA ● In the Main Menu, choose Service > Neph Calibration > Neph Src Level. SOURCE LEVEL SET: IRED: SRC LEVEL: 65 mA 32 % ©ª INC/DEC SAVE VALUE RANGE 4-14 Model 5030i SHARP Instruction Manual AVG DIAGS ALARM Thermo Fisher Scientific Chapter 5 Preventive Maintenance This chapter describes the periodic maintenance procedures that should be performed on the instrument to ensure proper operation. Since usage and environmental conditions vary greatly, you should inspect the components frequently until an appropriate maintenance schedule is determined. This chapter includes the following preventive maintenance information: Safety Precautions ● “Safety Precautions” on page 5-1 ● “Replacement Parts” on page 5-2 ● “Cleaning the Outside Case” on page 5-2 ● “Cleaning the Inlets” on page 5-2 ● “Fan Filter Inspection and Cleaning” on page 5-5 ● “Pump Rebuilding” on page 5-6 ● “Leak Test” on page 5-6 ● “Filter Tape Replacement” on page 5-7 ● “Greasing the Cam” on page 5-8 ● “External Pump Exhaust Filter” on page 5-8 ● “Cleaning the SHARP Optics Assembly” on page 5-10 Read the safety precautions before beginning any procedures in this chapter. WARNING If the equipment is operated in a manner not specified by the manufacturer, the protection provided by the equipment may be impaired. ▲ Equipment Damage Some internal components can be damaged by small amounts of static electricity. A properly grounded antistatic wrist strap must be worn while handling any internal component. For more information about appropriate safety precautions, see the “Servicing” chapter. ▲ Thermo Fisher Scientific Model 5030i SHARP Instruction Manual 5-1 Preventive Maintenance Replacement Parts Replacement Parts See the “Servicing” chapter for a list of replacement parts and the associated replacement procedures. WARNING If the equipment is operated in a manner not specified by the manufacturer, the protection provided by the equipment may be impaired. ▲ Cleaning the Outside Case Clean the outside case using a damp cloth being careful not to damage the labels on the case. Equipment Damage Do not use solvents or other cleaning products to clean the outside case. ▲ Cleaning the Inlets The inlet assemblies can include a TSP inlet, a U.S. EPA compatible PM10 inlet, or a Digital PM10 or PM2.5 inlet. Cleaning schedules and routine maintenance of assembly components should be in accordance with a good quality assurance plan. In general, it is recommended that the inlet assemblies be cleaned on a quarterly interval with mild soap solution, a thorough rinsing, and dried with a lint free cloth. If any impaction surfaces require impactor grease, it should be applied prior to reassembly. Furthermore, a general inspection, and replacement as necessary, of O-rings should be done. Equipment Damage Some internal components can be damaged by small amounts of static electricity. A properly grounded antistatic wrist strap must be worn while handling any internal component. For more information about appropriate safety precautions, see the “Servicing” chapter. ▲ U.S. EPA PM10 Inlet 5-2 Model 5030i SHARP Instruction Manual The water collector bottle located on the PM10 inlet should be inspected at least every five sampling days (Figure 5–1). Remove any accumulated water, clean the interior of the bottle, inspect the seals, and replace the bottle in the holder. Thermo Fisher Scientific Preventive Maintenance Cleaning the Inlets Figure 5–1. U.S. EPA PM10 Inlet Once a month the sampler inlet should be dismantled and cleaned. Mark each assembly point of the sampler inlet with a pen or pencil to provide reference marks during reassembly. Disassemble the sample inlet unit according to Figure 5–1. If the assembly screws are frozen, apply penetrating oil or commercial lubricant to make removal easier. Clean all interior surfaces and the bug screen with a general purpose cleaner or compressed air, paying particular attention to small openings and cracks. Cotton swabs and/or a small brush are helpful. Completely dry all components. Also monthly, check the O-rings for distortion, cracks, fraying, or other problems and replace as necessary. Apply small amounts of grease to the rings before assembling the unit. Reassemble the unit in accordance with the previously scribed match marks. Particular care should be taken to ensure that all O-rings seals are properly seated and that all screws are uniformly tightened. European PM10/PM2.5 Inlet Thermo Fisher Scientific The same schedule should be used for the European PM10 Inlet (e.g. Leckel), at approximately a 1-2 month interval. The components of the inlet should be inspected and cleaned as necessary. Figure 5–2 provided below provides an image and design drawing of the inlet, with references to parts. Model 5030i SHARP Instruction Manual 5-3 Preventive Maintenance Cleaning the Inlets Nozzle (8) Baffle Plate Safety Snap-Locks Tube (d = 16/14) Figure 5–2. European PM10 Inlet PM10 size selective inlet (1 m³/h) for 5030i Beta: Cyclone Maintenance 5-4 Model 5030i SHARP Instruction Manual ● Same construction as the EN reference inlet, but with 1 m³/h ● With special surface protection using an aluminium EMATAL surface ● With special water separator and easy exchangeable impactor baffle plate ● Standard tube connection: d = 16 mm for connecting a continuous monitor ● Easy converting to PM2.5 using the PM2.5 nozzle plate (8 nozzles) ● Easy converting to PM1 using the PM1 nozzle plate (8 nozzles) If a Sharp-Cut Cyclone (SCC) or a BGI Very Sharp-Cut Cyclone is being used for PM2.5 sampling (Figure 5–3), once every 2-3 weeks the dust pot should be unscrewed, emptied, and cleaned with a lint-free cloth. Once every three months, the entire SCC assembly should be inspected and cleaned, O-rings checked for distortion, cracks, fraying, or other problems. Replace O-rings as necessary. Thermo Fisher Scientific Preventive Maintenance Fan Filter Inspection and Cleaning Figure 5–3. PM2.5 Sharp-Cut-Cyclone Heater and Sample Tube On at least an annual basis (more frequently in heavily polluted environments) the sample tube that attaches to the inlet and to the Model 5030i Beta module should be removed and cleaned. The use of a bottle brush and string will allow you to remove any deposits within the sample tube. This same procedure also applies to the heater tube. Weather Proofing The “Installation” chapter covers detailed installation instructions. After proper installation, it is recommended to check the weather-proof installation at all interfaces exposed to ambient conditions. Ensure that the condition of the roof flange and silicone caulking will prevent any precipitation from entering the shelter and possibly damaging the instrument’s electronics. Fan Filter Inspection and Cleaning Use the following procedure to inspect and clean the fan filter (Figure 5– 4). 1. Remove the fan guard from the fan and remove the filter. 2. Flush the filter with warm water and let dry (a clean, oil-free purge will help the drying process) or blow the filter clean with compressed air. 3. Re-install the filter and fan guard. Thermo Fisher Scientific Model 5030i SHARP Instruction Manual 5-5 Preventive Maintenance Pump Rebuilding Equipment Damage Some internal components can be damaged by small amounts of static electricity. A properly grounded antistatic wrist strap must be worn while handling any internal component. For more information about appropriate safety precautions, see the “Servicing” chapter. ▲ Mounting Screws (4) Filter Fan Guard Figure 5–4. Inspecting and Cleaning the Fan Pump Rebuilding Leak Test Rebuild the sample pump once every 12–18 months, or as necessary depending on the environment is is used in. The pump repair kit contains instructions for rebuilding the pump. See the “Servicing” chapter for a list of replacement parts. Perform the “Leak Test” procedure that follows. This leak test procedure uses a volumetric flow meter and a custom leak check adapter. Use the following procedure to verify no leaks. 1. Place a reference volumetric flow meter (e.g., BGI Delta Cal) onto the inlet adapter and calibrate the 5030i SHARP so that the reference flow meter and the 5030i SHARP Monitor read the same flow rate. 2. Install the custom leak check adapter onto the inlet adapter and then place the reference flow meter onto the leak check adapter. 5-6 Model 5030i SHARP Instruction Manual Thermo Fisher Scientific Preventive Maintenance Filter Tape Replacement 3. Record the reference volumetric flow meter reading and the instant flow reading. If the difference between both readings is less than 0.42 L/min (±2.5%), the leak check passes. Filter Tape Replacement Use the following procedure to replace the filter tape in case of breaks or if the tape runs out. Equipment Damage Some internal components can be damaged by small amounts of static electricity. A properly grounded antistatic wrist strap must be worn while handling any internal component. For more information about appropriate safety precautions, see the “Servicing” chapter. ▲ 1. Remove left side panel. 2. From the main menu choose Instrument Controls > Filter Tape Control > Manual > Bench(s). Press . 3. Loosen both reel nuts on tape spindler. Remove used filter tape and empty tape spool from tape spindles. 4. Insert new filter tape on left tape spindle and tighten reel nut. 5. Insert new blank pick up spool on right tape spindle. 6. Route tape according to Figure 5–5. 7. Attach end of tape to blank tape spool on right tape spindle with 2-inch of tape. 8. Turn blank tape spool until there is two complete wrappings of tape. 9. Tighten right reel nut. From Filter Tape Control > Manual > choose Tape and press to MOVE tape. 10. From the main menu choose Alarms > Instrument Alarms to verify that there are no filter tape alarms. 11. Replace left side cover. Thermo Fisher Scientific Model 5030i SHARP Instruction Manual 5-7 Preventive Maintenance Greasing the Cam Figure 5–5. Replacing the Filter Tape Greasing the Cam Use the following procedure to grease the cam. Equipment Required: Dow Corning Molykote G-N 1. Apply metal assembly paste around the parameter of the cam. External Pump Exhaust Filter It is recommended to replace the external pump exhaust filter every six months. On an annual basis, remove top plate of optics and vacuum out optic chamber per the following procedure or send it for service and recalibration. Equipment Damage Some internal components can be damaged by small amounts of static electricity. A properly grounded antistatic wrist strap must be worn while handling any internal component. For more information about appropriate safety precautions, see the “Servicing” chapter. ▲ 5-8 Model 5030i SHARP Instruction Manual Thermo Fisher Scientific Preventive Maintenance External Pump Exhaust Filter 1. Turn the Heater OFF: From the Main Menu, choose Instrument Controls > Set Heater > Control. Use until the value reads OFF, and press . 2. Disconnect RH/temperature connector. 3. From the SHARP MIB Board J1, remove the five socket-heads from the top end cap and lift off. 4. Remove sealing gasket (note: may be stuck to bottomside of top-end plate). 5. Carefully vacuum out optic chamber. 6. Re-assemble in reverse order—note careful placement of the sealing gasket. HEPA Filter Figure 5–6. Replacing the External Pump Exhaust Filter Thermo Fisher Scientific Model 5030i SHARP Instruction Manual 5-9 Preventive Maintenance Cleaning the SHARP Optics Assembly Cleaning the SHARP Optics Assembly Use the following procedure to inspect and clean the SHARPoptics assembly. On an annual basis the SHARP optics assembly should be removed and cleaned. Equipment Required: Philips screwdriver Adjustable wrench Hex wrench Equipment Damage Some internal components can be damaged by small amounts of static electricity. A properly grounded antistatic wrist strap must be worn while handling any internal component. For more information about appropriate safety precautions, see the “Servicing” chapter. ▲ 1. Turn the instrument OFF, unplug the power cord, and remove the SHARP optics assembly. Refer to “Removing the SHARP Optics Assembly” on page 7-11. 2. Remove the two philips screws and remove the SHARP optics cover. Refer to “Removing the SHARP Optics Cover” on page 7-44. 3. Disonnect the RH/Temp connector from the SHARP interface board. 4. Remove the eight socket head screws from the upper end plate. 5. Gently remove the end plate. Carefully remove the sealing gasket. 6. Carefully vacuum out the optics chamber using caution not to scrap the interior of the optics chamber. 7. Re-assemble following the previous steps. Take extra caution in realigning the sealing gasket to avoid air leaks. 5-10 Model 5030i SHARP Instruction Manual Thermo Fisher Scientific Chapter 6 Troubleshooting This instrument has been designed to achieve a high level of reliability. In the event of problems or failure, the troubleshooting guidelines, board-level connection diagrams, connector pin descriptions, and testing procedures presented in this chapter should be helpful in isolating and identifying problems. The Technical Support Department at Thermo Fisher Scientific can also be consulted in the event of problems. See “Service Locations” on page 625 for contact information. In any correspondence with the factory, please note both the serial number and program number of the instrument. This chapter provides the following troubleshooting and service support information: ● “Safety Precautions” on page 6-1 ● “Troubleshooting Guides” on page 6-1 ● “Board-Level Connection Diagrams” on page 6-8 ● “Connector Pin Descriptions” on page 6-10 ● “Service Locations” on page 6-25 Safety Precautions Read the safety precautions in the Preface and “Servicing” chapter before performing any actions listed in this chapter. Troubleshooting Guides The troubleshooting guides presented in this chapter are designed to help isolate and identify instrument problems. Table 6–1 provides general troubleshooting information and indicates the checks that you should perform if you experience an instrument problem. Table 6–2 lists all the alarm messages you may see on the graphics display and provides recommendations about how to resolve the alarm condition. Thermo Fisher Scientific Model 5030i SHARP Instruction Manual 6-1 Troubleshooting Troubleshooting Guides Table 6–1. Troubleshooting - General Guide Malfunction Possible Cause Action No power Main fuses are blown are missing Check voltages from power supply. Digital electronics defective Check that all boards and connectors are seated properly. Replace with spare boards to isolate the problem. Reel nuts not tight Tighten reel nuts. No more filter tape Replace with new filter tape. Filter not properly adhered or broken Adhere filter tape to take-up reel and wind over itself once. Filter tape transport drive motor defective Replace motor. Optical tape counter defective Replace optical tape transport sensor. Valves closed Verify ΔP valves on rear panel are in the closed position. Loose plumbing Verify all plumbing connections. Pressure board defective Replace pressure printed circuit board. Recorder noise Replace or repair recorder and/or leads. Sample concentration varying Run Model 5030i on a zero filter – if quiet, there is no malfunction. Foreign material in optical bench Clean optical bench. Digital electronics defective Replace board with a spare board. System leak Find and repair leak. Pressure or temperture out of calibration Re-calibrate pressure or temperature. Digital electronics defective Replace one board at a time with a spare board to isolate the defective board. Flow Verify ΔP valves on rear panel are in the closed position. Re-calibrate. Wrong contrast setting Adjust contrast setting. No automatic filter change Pressure sensor(s) board do not hold calibration Highly variable concentration Instrument does not calibrate properly Display is off 6-2 Model 5030i SHARP Instruction Manual Thermo Fisher Scientific Troubleshooting Troubleshooting Guides Malfunction Possible Cause Action LCD cable loose Check connection and cable integrity. LCD defective Replace display. The change of parameters is not possible Keyboard not enabled Enable keyboard through menu. No mass value ADC defect Change the main circuit board. Mains are broken Check and repair. No high voltage value Check HV. Detector defect Change detector. Mechanical defect Check filter transport motor and mechanics. Make sure tape is adhered to take-up reel and intact. If pump is not running Check pump power supply and wires. If the filter change parameter reaches the FC-value for the second time, then, the monitor stops Adjust filter change parameters. Wrong contrast Adjust contrast. LCD defect Change LCD. Connection cables from the main board are broken Replace display ribbon cable. Air flow parameters wrong Check air flow rate parameters. No connection with plug (25) “pump” Put in the plug (pump regulation input). Pump do not work properly Clean inside parts of pump change. Very high pollution or blocking in the air passage Clean air passage. Check ΔP calibration valve are in closed position Close valves. External cable not connected Check cable connection. Internal cable not connected. Check cable connection. Disconnected Source/Ref cable Check cable connection. No automatic filter change LCD out of function or dark Air flow rate disturbance or air flow is too low Neph Board Failures Low Source Current Thermo Fisher Scientific Model 5030i SHARP Instruction Manual 6-3 Troubleshooting Troubleshooting Guides Malfunction Possible Cause Action No SHARP Concentration Disconnected Scat Det cable Check cable connection. No Zero Air Flow Rear solenoid valve normally closed Check rear panel connection— replace valve. Clogged in-line filter or internal filter Replace filter. Pump unplugged Plug in pump. Internal solenoid valve normally closed Check cable connection—replace valve. Check zero in bulkhead-tubing connection Kinked tube—insert tube. Check pump exhaust connection Insert tube in “Y” fitting or pump. Check internal “T” fitting for plug or tubing not connected Insert blocking port plug connect tubing. Low or high source current Check source current level Adjust to 62–67 mA Ref Det Voltage Check min and max values/LED current 65mA 6-4 Model 5030i SHARP Instruction Manual Neph Cal Bad Zero Re-zero Neph Temp High/Low Check min and max values/ Re-calibrate Neph RH Low/High Check min and max values/ Re-calibrate Led Current High/Low Check min and max values/Verify 65mA ± 5mA Thermo Fisher Scientific Troubleshooting Troubleshooting Guides Table 6–2. Troubleshooting - Alarm Messages Alarm Message Possible Cause Action Instrument Alarms – Filter Tape Counter Loose reel nuts Tighten reel nuts. Broken tape Replace tape. Loose photo interrupt cable Verify connections. Loose reel nuts Tighten reel nuts. Broken tape Replace tape. Tape motor nut turning Verify connection to measurement interface board. Replace tape motor. Cam working not functioning Verify connector to measurement interface board. Replace motor. Motor turning, cam not Verify setscrews on cam coupling. Instrument Alarms – Motherboard Status Internal cables not connected properly Check that all internal cables are connected properly. Re-cycle AC power to instrument. If still alarming, change board. Instrument Alarms – Interface Status Board defective Replace board. Detector Re-calibrate detector. Settings Verify alarm settings are between 0 minimum and 100 maximum. Disconnected cable Verify cable connections. Defective detector Replace detector-Beta counts trending towards zero. Settings Verify alarm settings are between 5000 minimum and 20000 maximum. Nephelometer Alarms – Board Status Disconnected cable Verify cable harness is connected to the base. WARNING If disconnected, turn off AC power to the base before reconnecting. Nephelometer Alarms – Neph Sample Bad zero Re-zero. Instrument Alarms – Filter Tape Change Instrument Alarms – Bench Instrument Alarms – I/O Exp Status Detector Alarms – Alpha Detector Alarms – Beta Thermo Fisher Scientific Model 5030i SHARP Instruction Manual 6-5 Troubleshooting Troubleshooting Guides Alarm Message Possible Cause Action Settings Verify settings. Bad zero Re-zero. No flow Verify values. Nephelometer Alarms – Neph Temp Disconnected cable Verify cable connections. Nephelometer Alarms – Neph RH Error in calibrating Re-calibrate. Defective sensor Replace board. Current settings too low Set LED current to 65 m Disconnected cable from base Verify cable connection. Disconnected cable from SHARP optics board Verify cable connection. Current settings too low Set LED current to 65 mA. Disconnected cable from base Verify cable connection. Disconnected cable from SHARP optics board Verify cable connection. Disconnect cable (external) on rear panel Verify cable connection. Disconnect cable (internal) Verify cable connection. RH/Temperature Alarms – Sample RH Disconnected heater Verify cable connection. RH/Temperature Alarms – Ambient Temp Disconnect cable (external) on rear panel Verify cable connection. Disconnect cable (internal) Verify cable connection. Disconnected cable Verify connection to measurement interface board. Sensor defective Replace sensor. Disconnected cable Verify connection to measurement interface board. Sensor defective Replace sensor. Nephelometer Alarms – Neph Cal Nephelometer Alarms – LED Current Nephelometer Alarms – Ref Det Volt RH/Temperature Alarms – Ambient RH RH/Temperature Alarms – Flow Temp RH/Temperature Alarms – Board Temp 6-6 Model 5030i SHARP Instruction Manual Thermo Fisher Scientific Troubleshooting Troubleshooting Guides Alarm Message Possible Cause Action Pressure/Vacuum Alarms – Barometer Pressure Disconnected cable Verify cable connections. Replace board. Pressure/Vacuum Alarms – Vacuum Disconnected plumbing Verify plumbing connections. Disconnected cable Verify cable connection. Sensor defective Replace pressure board. Disconnected plumbing Verify plumbing connections Disconnected cable Verify cable connection. Sensor defective Replace pressure board. ΔP valve open Verify valve is in close position. Low flow Check that pump is connected. Verify that both ΔP valves are in the closed position. No flow Verify proportional valve plumbing. Verify connection to measurement interface board. Conc negative Check heater and Beta counts. Conc alarm setting Verify conc alarm settings. Conc negative Re-zero Conc alarm setting Verify conc alarm settings. Pressure/Vacuum Alarms – Flow Flow Alarms – Flow Conc Alarms – PM Conc Alarms – AVG SHARP Thermo Fisher Scientific Model 5030i SHARP Instruction Manual 6-7 Troubleshooting Board-Level Connection Diagrams Board-Level Connection Diagrams Figure 6–1 and Figure 6–2 are board-level connection diagrams for the common electronics and measurement system. These illustrations can be used along with the connector pin descriptions in Table 6–3 through Table 6–7 to troubleshoot board-level faults. I/OEXPANSION BOARD EXPANSION I/O 25 Pin J1 TOMEASUREMENT SYSTEM DIGITAL OUTPUT BOARD J2 DIGITAL OUTPUTS 37 Pin 11 Pin 8 Pin J14 J3 RS232/RS485 RS232/RS485 10-BASE-T 9 Pin J18 9 Pin P1:B 8 Pin EXPANSIONRS485 J2 P1:A 14 Pin FRONT J1 PANEL J4 3 Pin BOARD 34 Pin J3 J2 8 Pin LCD DISPLAY KEYPANEL J15 15 Pin MOTHER BOARD J4 8 Pin SPARE DATA ANALOGOUTPUTS /DIGITAL INPUTS 37 Pin J5 J1 J10 J17 DATA 3 Pin 3 Pin 2 Pin POWER_GOOD 2 Pin PJ1 PJ3 PJ2 3 Pin 3 Pin 3 Pin REARPANEL AC INPUT AC AC 3 Cond 24VDC POWER SUPPLY 24VDC 2 Pin AC FRONT PANEL POWERSW 3 Pin TRANSFORMER (90VAC or 240VAC Options) Figure 6–1. Board-Level Connection Diagram - Common Electronics 6-8 Model 5030i SHARP Instruction Manual Thermo Fisher Scientific Troubleshooting Board-Level Connection Diagrams Figure 6–2. Board-Level Connection Diagram - Measurement System Thermo Fisher Scientific Model 5030i SHARP Instruction Manual 6-9 Troubleshooting Connector Pin Descriptions Figure 6–3. Board-Level Connection Diagram - SHARP Connector Pin Descriptions The connector pin descriptions in Table 6–3 through Table 6–7 can be used along with the board-level connection diagrams to troubleshoot board-level faults. “Motherboard Connector Pin Descriptions” on page 6-10 “Measurement Interface Board Connector Pin Descriptions” on page 6-15 “Front Panel Board Connector Pin Diagram” on page 6-20 “I/O Expansion Board (Optional) Connector Pin Descriptions” on page 621 “Digital Output Board Connector Pin Descriptions” on page 6-23 “SHARP Measurement Interface Board Pin Connections” on page 6-24 Table 6–3. Motherboard Connector Pin Descriptions Connector Label Reference Designator Pin Signal Description INTF DATA J1 1 Ground 2 +RS485 to Interface Board 3 -RS485 to Interface Board 1 Ethernet Output (+) 2 Ethernet Output (-) 3 Ethernet Input (+) 4 NC 5 NC 10-BASE-T 6-10 Model 5030i SHARP Instruction Manual J2 Thermo Fisher Scientific Troubleshooting Connector Pin Descriptions Connector Label EXPANSION BD INTERFACE 24V I/O Thermo Fisher Scientific Reference Designator J3 J4 J5 Pin Signal Description 6 Ethernet Input (-) 7 NC 8 NC 1 +5V 2 +24V 3 +24V 4 Ground 5 Ground 6 Ground 7 +RS485 to Expansion Board 8 -RS485 to Expansion Board 1 +24V 2 Ground 1 Power Fail Relay N.C. Contact 2 Digital Ground 3 TTL Input 1 4 TTL Input 2 5 Digital Ground 6 TTL Input 5 7 TTL Input 7 8 TTL Input 8 9 TTL Input 10 10 Ground 11 TTL Input 13 12 TTL Input 15 13 Digital Ground 14 Analog Voltage 1 15 Analog Voltage 3 16 Analog Ground 17 Analog Voltage 5 18 Analog Ground 19 Analog Ground 20 Power Fail Relay COM 21 Power Fail Relay N.O. Contact Model 5030i SHARP Instruction Manual 6-11 Troubleshooting Connector Pin Descriptions Connector Label VOLTAGE TEST Reference Designator J6 Pin Signal Description 22 Digital Ground 23 TTL Input 3 24 TTL Input 4 25 TTL Input 6 26 Digital Ground 27 TTL Input 9 28 TTL Input 11 29 TTL Input 12 30 TTL Input 14 31 TTL Input 16 32 Digital Ground 33 Analog Voltage 2 34 Analog Voltage 4 35 Analog Ground 36 Analog Voltage 6 37 Analog Ground 1 +5V 2 +3.3V +15V -15V SER EN 24V IN RESET PROC DIGITAL I/O 6-12 Model 5030i SHARP Instruction Manual J7 J10 J12 J14 1 Serial Enable Jumper 2 +3.3V 1 +24V 2 Ground 1 Reset-Proc 2 Ground 1 +5V 2 +24V 3 +24V 4 Ground 5 Ground 6 Ground 7 SPI Reset 8 SPI Input Thermo Fisher Scientific Troubleshooting Connector Pin Descriptions Connector Label EXT. RS485 24 MONITOR FRONT PANEL BD Thermo Fisher Scientific Reference Designator J15 J17 J18 Pin Signal Description 9 SPI Output 10 SPI Board Select 11 SPI Clock 1 -RS485 to Rear Panel 2 -RS485 to Rear Panel 3 +5V 4 +5V 5 +5V 6 Ground 7 Ground 8 Ground 9 NC 10 NC 11 +24 12 +24 13 +24 14 +24 15 +24 1 24V Power Monitor 2 Ground 1 Ground 2 Ground 3 LCLK – LCD Signal 4 Ground 5 Ground 6 LLP – LCD Signal 7 LFLM – LCD Signal 8 LD4 – LCD Signal 9 LD0 – LCD Signal 10 LD5 – LCD Signal 11 LD1 – LCD Signal 12 LD6 – LCD Signal 13 LD2 – LCD Signal Model 5030i SHARP Instruction Manual 6-13 Troubleshooting Connector Pin Descriptions Connector Label RS232/RS485:A RS232/RS485:B 6-14 Model 5030i SHARP Instruction Manual Reference Designator P1:A P1:B Pin Signal Description 14 LD7 – LCD Signal 15 LD3 – LCD Signal 16 LCD Bias Voltagel 17 +5V 18 Ground 19 Ground 20 LCD_ONOFF – LCD Signal 21 Keypad Row 2 Input 22 Keypad Row 1 Input 23 Keypad Row 4 Input 24 Keypad Row 3 Input 25 Keypad Col 2 Select 26 Keypad Col 1 Select 27 Keypad Col 4 Select 28 Keypad Col 3 Select 29 Ground 30 Ground 31 Ground 32 Ground 33 +24V 34 +24V 1 NC 2 Serial Port 1 RX (-RS485 IN) 3 Serial Port 1 TX (-RS485 OUT) 4 NC 5 Ground 6 NC 7 Serial Port 1 RTS (+RS485 OUT) 8 Serial Port 1 CTS (+RS485 IN) 9 NC 1 NC 2 Serial Port 2 RX (-RS485 IN) 3 Serial Port 2 TX (-RS485 OUT) 4 NC Thermo Fisher Scientific Troubleshooting Connector Pin Descriptions Connector Label AC IN AC 24VPWR AC INTF BD Reference Designator PJ1 PJ2 PJ3 Pin Signal Description 5 Ground 6 NC 7 Serial Port 2 RTS (+RS485 OUT) 8 Serial Port 2 CTS (+RS485 IN) 9 NC 1 AC-HOT 2 AC-NEUT 3 AC-Ground 1 AC-HOT 2 AC-NEUT 3 AC-Ground 1 AC-HOT 2 AC-NEUT 3 AC-Ground Table 6–4. Measurement Interface Board Connector Pin Descriptions Connector Label Reference Designator Pin Signal Description PUMP J1 1 AC+ 2 Pump_AC- 3 AC-Ground 4 NC 1 AC+ 2 Heater2_AC- 3 AC-Ground 1 AC+ 2 Heater1_AC- 3 AC-Ground 1 Input 2 Ground 1 AC+ 2 AC- 1 AC+ HEATER 2 HEATER 1 WDT DISABLE AUX PWR 120V PURGE 2 Thermo Fisher Scientific J2 J3 J4 J5 J6 Model 5030i SHARP Instruction Manual 6-15 Troubleshooting Connector Pin Descriptions Connector Label PURGE 1 PUMP 1 JTAG INTF FLOW TEMP 2 AUX HT 1 AUX HT 2 TT MOTOR PUMP 2 FLOW TEMP 1 SHARP 1 6-16 Model 5030i SHARP Instruction Manual Reference Designator J7 J8 J9 J10 J11 J12 J13 J14 J15 J17 Pin Signal Description 2 Purge2_AC- 1 AC+ 2 Purge1_AC- 1 +24V 2 Pump1_On/Off 1 TD0 2 NC 3 TD1 4 NC 5 TMS 6 NC 7 TCK 8 NC 9 Ground 10 NC 11 NC 12 NC 13 NC 14 NC 1 Flow2A_RTD 2 Flow2B_RTD 3 Ground 1 AC+ 2 AuxHT_1_AC- 1 AC+ 2 AuxHT_2_AC- 1 AC+ 2 TT Motor_AC- 1 +24V 2 Pump2_On/Off 1 Flow1A_RTD 2 Flow1B_RTD 3 Ground 1 +24V Thermo Fisher Scientific Troubleshooting Connector Pin Descriptions Connector Label PURGE 2 DC PUMP FLOW 1 SHARP 2 FAN PURGE 1 DC PUMP FLOW 2 PURGE 3 DC VD1 VD2 BOARD TEMP SPARE FLOW PURGE 4 DC PRESS BD Thermo Fisher Scientific Reference Designator J18 J19 J20 J21 J22 J23 J25 J26 J27 J28 J29 J30 J31 Pin Signal Description 2 +RS485 3 -RS485 4 Ground 1 +24V 2 Purge2_DC 1 +24V 2 Aout_Pump1_Flow 3 Ground 1 +24V 2 +RS485 3 -RS485 4 Ground 1 +24V 2 Fan_Power 1 +24V 2 Purge1_DC 1 +24V 2 Aout_Pump2_Flow 3 Ground 1 +24V 2 Spare1_Sol 1 AIN_VD-1 2 Ground 1 AIN_VD-2 2 Ground 1 Board_Therm 2 Ground 1 +24V 2 Aout_Spare_Flow 3 Ground 1 +24V 2 Spare2_Sol 1 -15V Model 5030i SHARP Instruction Manual 6-17 Troubleshooting Connector Pin Descriptions Connector Label PRESS TEMP CNTR WHEEL BETA 1 BETA 2 LOAD MOTOR SP PHOTO 6-18 Model 5030i SHARP Instruction Manual Reference Designator J32 J33 J34 J35 J36 J37 Pin Signal Description 2 AIN_30PSIA 3 AIN_FLOW_1 4 AIN_VAC_2 5 AIN_FLOW_2 6 AIN_VAC_1 7 +5V 8 +15V 9 Ground 1 Press_RTD 2 Press_RTD 3 Ground 1 +5V 2 Ground 3 Ground 4 Ground 5 VOA3 6 +5V 7 NC 8 NC 1 Ground 2 +RS485 3 -RS485 4 Ground 5 +5V 6 Ground 1 Ground 2 +RS485 3 -RS485 4 Ground 5 +5V 6 Ground 1 +24V 2 Load_Motor_On 1 +5V Thermo Fisher Scientific Troubleshooting Connector Pin Descriptions Connector Label CAM WHEEL HWELL 1 SAMPLE 2 TEMP SAMPLE 1 TEMP TEST RTD AC IN 24V IN DATA Thermo Fisher Scientific Reference Designator J38 J39 J40 J41 J42 J43 J44 J45 Pin Signal Description 2 Ground 3 Ground 4 +5V 5 VO_SP 1 +5V 2 Ground 3 Ground 4 NC 5 Dig_Slit 6 +5V 7 NC 1 AIN_RTDP 2 +5V 3 AIN_RHP_Hum 4 Ground 1 Sample2A_RTD 2 Sample2B_RTD 3 Ground 1 Sample1A_RTD 2 Sample1B_RTD 3 Ground 1 SpareA_RTD 2 SpareB_RTD 3 Ground 1 AC+ 2 AC- 3 AC-Ground 1 +24V 2 Ground 1 Ground 2 +RS485 3 -RS485 Model 5030i SHARP Instruction Manual 6-19 Troubleshooting Connector Pin Descriptions Table 6–5. Front Panel Board Connector Pin Diagram 6-20 Model 5030i SHARP Instruction Manual Connector Label Reference Designator Pin Signal Description MOTHERBOARD J1 1 Ground 2 Ground 3 LCLK – LCD Signal 4 Ground 5 Ground 6 LLP – LCD Signal 7 LFLM – LCD Signal 8 LD4 – LCD Signal 9 LD0 – LCD Signal 10 LD5 – LCD Signal 11 LD1 – LCD Signal 12 LD6 – LCD Signal 13 LD2 – LCD Signal 14 LD7 – LCD Signal 15 LD3 – LCD Signal 16 LCD Bias Voltagel 17 +5V 18 Ground 19 Ground 20 LCD_ONOFF – LCD Signal 21 Keypad Row 2 Input 22 Keypad Row 1 Input 23 Keypad Row 4 Input 24 Keypad Row 3 Input 25 Keypad Col 2 Select 26 Keypad Col 1 Select 27 Keypad Col 4 Select 28 Keypad Col 3 Select 29 Ground 30 Ground 31 Ground 32 Ground 33 +24V Thermo Fisher Scientific Troubleshooting Connector Pin Descriptions Connector Label LCD DATA KEYBOARD LCD BACKLIGHT Reference Designator J2 J3 J4 Pin Signal Description 34 +24V 1 LD0_5V – LCD Signal 2 LD1_5V – LCD Signal 3 LD2_5V – LCD Signal 4 LD3_5V – LCD Signal 5 LCD_ONOFF_5V – LCD Signal 6 LFLM_5V – LCD Signal 7 NC 8 LLP_5V – LCD Signal 9 LCLK_5V – LCD Signal 10 +5V 11 Ground 12 -25V 13 LCD Bias Voltage 14 Ground 1 Keypad Row 1 Input 2 Keypad Row 2 Input 3 Keypad Row 3 Input 4 Keypad Row 4 Input 5 Keypad Col 1 Select 6 Keypad Col 2 Select 7 Keypad Col 3 Select 8 Keypad Col 4 Select 1 +5V Supply 2 NC 3 Ground Table 6–6. I/O Expansion Board (Optional) Connector Pin Descriptions Thermo Fisher Scientific Connector Label Reference Designator Pin Signal Description EXPANSION I/O J1 1 Analog Voltage Input 1 2 Analog Voltage Input 2 3 Analog Voltage Input 3 Model 5030i SHARP Instruction Manual 6-21 Troubleshooting Connector Pin Descriptions Connector Label MOTHER BD 6-22 Model 5030i SHARP Instruction Manual Reference Designator J2 Pin Signal Description 4 Ground 5 Analog Voltage Input 4 6 Analog Voltage Input 5 7 Analog Voltage Input 6 8 Ground 9 Analog Voltage Input 7 10 Analog Voltage Input 8 11 Ground 12 NC 13 Current Output Return 14 Ground 15 Current Output 1 16 Current Output Return 17 Current Output 2 18 Current Output Return 19 Current Output 3 20 Current Output Return 21 Current Output 4 22 Current Output Return 23 Current Output 5 24 Current Output Return 25 Current Output 6 1 +5V 2 +24V 3 +24V 4 Ground 5 Ground 6 Ground 7 +RS485 to Motherboard 8 -RS485 to Motherboard Thermo Fisher Scientific Troubleshooting Connector Pin Descriptions Table 6–7. Digital Output Board Connector Pin Descriptions Connector Label Reference Designator Pin Signal Description MOTHER BD J1 1 +5V 2 +24V 3 +24V 4 Ground 5 Ground 6 Ground 7 SPI Reset 8 SPI Input 9 SPI Output 10 SPI Board Select 11 SPI Clock 1 Relay 1 Contact a 2 Relay 2 Contact a 3 Relay 3 Contact a 4 Relay 4 Contact a 5 Relay 5 Contact a 6 Relay 6 Contact a 7 Relay 7 Contact a 8 Relay 8 Contact a 9 Relay 9 Contact a 10 Relay 10 Contact a 11 NC 12 Solenoid Drive Output 1 13 Solenoid Drive Output 2 14 Solenoid Drive Output 3 15 Solenoid Drive Output 4 16 Solenoid Drive Output 5 17 Solenoid Drive Output 6 18 Solenoid Drive Output 7 19 Solenoid Drive Output 8 20 Relay 1 Contact b DIGITAL OUTPUTS Thermo Fisher Scientific J2 Model 5030i SHARP Instruction Manual 6-23 Troubleshooting Connector Pin Descriptions Connector Label Reference Designator Pin Signal Description 21 Relay 2 Contact b 22 Relay 3 Contact b 23 Relay 4 Contact b 24 Relay 5 Contact b 25 Relay 6 Contact b 26 Relay 7 Contact b 27 Relay 8 Contact b 28 Relay 9 Contact b 29 Relay 10 Contact b 30 +24V 31 +24V 32 +24V 33 +24V 34 +24V 35 +24V 36 +24V 37 +24V Table 6–8. SHARP Measurement Interface Board Pin Connections Connector Label Reference Designator Pin Signal Description TEMP/RH J1 1 GNDA 2 +5V 3 Temp 4 RH 1 ADC1 2 IRED 3 PHD-A 4 PHD-K 5 NC 1 GNDA 2 Det-Out 3 -5V DET SRC DETECTOR 6-24 Model 5030i SHARP Instruction Manual J2 J3 Thermo Fisher Scientific Troubleshooting Service Locations Connector Label DATA RS485 VALVE DRIVE 1 VALVE DRIVE 2 24V IN Service Locations Reference Designator J4 J7 J8 J9 Pin Signal Description 4 +5V 1 Ground 2 +RS485 3 -RS485 1 +24V DC 2 Drive 1 1 +24V DC 2 Drive 2 1 +24V DC 2 Ground For additional assistance, service is available from exclusive distributors worldwide. Contact one of the phone numbers below for product support and technical information or visit us on the web at www.thermo.com/aqi. 1-866-282-0430 Toll Free 1-508-520-0430 International Thermo Fisher Scientific Model 5030i SHARP Instruction Manual 6-25 Chapter 7 Servicing This chapter explains how to replace the Model 5030i subassemblies. It assumes that a subassembly has been identified as defective and needs to be replaced (or is an “expendable” item, not covered under warranty. Expendable items are indicated with an asterisk (*) in the “Model 5030i Replacement Parts” table. For fault location information, refer to the “Preventive Maintenance” chapter and the “Troubleshooting” chapter in this manual. The service mode section in the “Operation” chapter also includes parameters and functions that are useful when making adjustments or diagnosing problems. For additional service assistance, see “Service Locations” at the end of this chapter. This chapter includes the following parts information and component replacement procedures: Thermo Fisher Scientific ● “Safety Precautions” on page 7-3 ● “Firmware Updates” on page 7-4 ● “Accessing the Service Mode” on page 7-4 ● “Replacement Parts List” on page 7-5 ● “Cable List” on page 7-6 ● “External Device Connection Components” on page 7-8 ● “Removing the Measurement Case Assembly and Lowering the Partition Panel” on page 7-12 ● “Fuse Replacement” on page 7-14 ● “Fan/Filter Replacement” on page 7-14 ● “Detector Amplifier Assembly Replacement” on page 7-15 ● “Detector Amplifier Board Calibration” on page 7-17 ● “External Pump Replacement” on page 7-17 ● “Pressure Board Replacement” on page 7-18 Model 5030i SHARP Instruction Manual 7-1 Servicing Service Locations 7-2 Model 5030i SHARP Instruction Manual ● “Pressure Board Calibration” on page 7-20 ● “Analog Output Testing” on page 7-21 ● “Analog Output Calibration” on page 7-24 ● “Analog Input Calibration” on page 7-25 ● “Themistor Replacement” on page 7-26 ● “I/O Expansion Board (Optional) Replacement” on page 7-27 ● “Digital Output Board Replacement” on page 7-29 ● “Motherboard Replacement” on page 7-30 ● “Measurement Interface Board Replacement” on page 7-31 ● “Photo Interrupt Board Replacement” on page 7-32 ● “Proportional Valve Replacement” on page 7-33 ● “Detector Assembly Replacement” on page 7-34 ● “Flow RTD Replacement” on page 7-36 ● “Transformer Replacement” on page 7-37 ● “Radius Tube Replacement” on page 7-38 ● “Ambient RH/Temperature Replacement” on page 7-39 ● “Front Panel Board Replacement” on page 7-41 ● “LCD Module Replacement” on page 7-42 ● “Removing the SHARP Optics Cover” on page 7-44 ● “External Solenoid Valve Replacement” on page 7-45 ● “SHARP RH/Temp Sensor Replacement” on page 7-46 ● “SHARP Interface Board Replacement” on page 7-47 ● “Delrin Nut Replacement” on page 7-49 ● “Internal SHARP Cable Assembly Replacement” on page 7-51 ● “Case Cable Replacement” on page 7-52 ● “External Zeroing Filter” on page 7-53 ● “Service Locations” on page 7-54 Thermo Fisher Scientific Servicing Safety Precautions Safety Precautions Read the safety precautions before beginning any procedures in this chapter. WARNING The service procedures in this manual are restricted to qualified service representatives. ▲ If the equipment is operated in a manner not specified by the manufacturer, the protection provided by the equipment may be impaired. ▲ The detector assembly should be replaced by a qualified technician knowledgeable in dealing with radiation precautions. By removing the detector assembly, the C-14 radioactive source is partially exposed. Safety glassed must be worn during this replacement procedure. The amount of C-14 meets the U.S. NRC regulations as an exempt amount of radioactive source <100 μCi. ▲ The detector pre-amp assembly has a power backup built in. “DO NOT OPEN” caution handeling. Backup power will dissipate after 8 hours. ▲ CAUTION The detector window is very fragile. Handle with great care and do not wipe or touch the window. Furthermore, do not touch the solder cable connection (electrode) with your bare fingers. The oils from your skin can damage the detector. ▲ Safety glasses must be worn while replacing the detector assembly. ▲ If the LCD panel breaks, do not let the liquid crystal contact your skin or clothes. If the liquid crystal contacts your skin or clothes, wash it off immediately using soap and water. ▲ Equipment Damage Some internal components can be damaged by small amounts of static electricity. A properly grounded antistatic wrist strap must be worn while handling any internal component (Figure 7–1). If an antistatic wrist strap is not available, be sure to touch the instrument chassis before touching any internal components. When the instrument is unplugged, the chassis is not at earth ground. ▲ Do not remove the LCD panel or frame from the LCD module. ▲ Thermo Fisher Scientific Model 5030i SHARP Instruction Manual 7-3 Servicing Firmware Updates The LCD polarizing plate is very fragile, handle it carefully. ▲ Do not wipe the LCD polarizing plate with a dry cloth, as it may easily scratch the plate. ▲ Do not use alcohol, acetone, MEK or other Ketone based or aromatic solvents to clean the LCD module, but rather use a soft cloth moistened with a naphtha cleaning solvent. ▲ Do not place the LCD module near organic solvents or corrosive gases. ▲ Do not shake or jolt the LCD module. ▲ Figure 7–1. Properly Grounded Antistatic Wrist Strap Firmware Updates Accessing the Service Mode The firmware can be updated by the user in the field via the serial port or over the Ethernet. This includes both the main processor firmware and the firmware in all low-level processors. Refer to the iPort manual for the firmware update procedure. If the Service menu is not displayed on the Main Menu, use the following procedure to display it. 1. From the Main Menu, choose Instrument Controls > Service Mode. The Service Mode screen appears. 2. Press to toggle the Service Mode to ON. 3. Press > to return to the Main Menu. 4. Return to the procedure. 7-4 Model 5030i SHARP Instruction Manual Thermo Fisher Scientific Servicing Replacement Parts List Replacement Parts List Thermo Fisher Scientific Table 7-1 lists the replacement parts for the Model 5030i major subassemblies. Refer to Figure 7-2 to identify the component location. Table 7–1. Model 5030i Replacement Parts Part Number Description 100480-00 Front Panel Pushbutton Board 110570-00 Processor Board (new iPort and *.cramfs required) 100533-00 Motherboard 100539-00 Digital Output Board 100542-00 I/O Expansion Board (optional) 102340-00 Front Panel Connector Board 102496-00 Front Panel Display 106926-00 Transformer, Step-Down, 220-240 VAC (optional) 104290-00 Measurement Interface Board 105869-00 Detector Assembly (LND4335) 105938-00 Photo Interrupt Board Assembly 106611-00 Rear Flow RTD Assembly 106536-00 RH Temperature Assembly 106535-00 Heater Tube Assembly, Three Feet 106037-00 Load Motor Assembly 106032-00 Tape Motor Assembly 106470-00 Proportional Valve Assembly 106946-00 Pressure Board Assembly (w/tubing assembly) 425454008 Detector Amp Assembly 106923-00 Pressure Valves 106540-00 Extension tubes w/fitting 101055-00 AC Receptacle Assembly 101681-00 Power Supply Assembly, 24 VDC (with base plate and screws) 101688-00 Ambient Temperature Thermistor (with connector) 100907-00 Fan, 24 VDC 8630 Filter Guard Assembly (with foam)* 109612-00 Fuse, 250 VAC, 10.0 Amp, SlowBlow (for 110 VAC and 115 VAC models)* 109613-00 Fuse, 250 VAC, 5.0 Amp, SlowBlow (for 220-240 VAC models)* Model 5030i SHARP Instruction Manual 7-5 Servicing Replacement Parts List Part Number Description 10-001403 External Pump Assembly 59-008630 Pump Rebuild Kit 24-000483 Pump Tubing, External 3/8-inch 106994-00 Tubing, Internal 3/8-inch* 104401-00 Tape Guides 106443-00 Filter Tape 108183-00 Tape Hardware Kit 112298-00 Replacement O-ring Kit* 106531-00 Cover Assembly 106988-00 Handles (front, cover) FH125C14 Calibration Kit (Cal Foils) 10-000447 Modified Shoe for Tripod 106445-00 Metal Assembly Paste 107000-00 Fitting, 5/8 Union w/Nylon Ferrules 107001-00 Tubing, 5/8 Stainless Steel 109583-00 Roof Flange Assembly 57-002758 Large Bypass Filter Assembly* 110504-00 SHARP Radius Tube Adapter Final Assembly 108154-00 SHARP Connector Bracket Assembly 109408-00 Tubing Assembly, Zero-In 3/8-inch* 108151-00 SHARP Assembly 110489-00 Final SHARP Cover Assembly w/Insulation 109489-00 Inlet Dust Cover 110084-00 Delrin Nut 104961-00 Gasket Extrusion Chamber 104955-00 RH/Temp Board Gasket 110481-00 SHARP 3-way Ext Solenoid Valve Final Assembly 110086-00 Heater Adapter CE Kit 110082-00 Custom Gasket for Inlet *Expendable item, not covered by warranty 7-6 Model 5030i SHARP Instruction Manual Thermo Fisher Scientific Servicing Cable List Cable List Table 7–2 lists the Model 5030i cables. See the “Troubleshooting” chapter for associated connection diagrams and board connector pin descriptions. Table 7–2. Model 5030i Cables Thermo Fisher Scientific Part Number Description 101349-00 AC Power Cable (115 VAC, US) 8926 AC Power Cable (220 VAC, EU) 101036-00 DC Power Supply 24 V Output 101037-00 115 VAC Supply to Measurement Interface Board 101048-00 RS-485/Data 101038-00 AC Power Switch to Motherboard 101364-00 DC Power Supply Status Monitor 101054-00 Motherboard to Front Panel Board 101035-00 DC Power Supply AC Input 101055-00 Main AC from Receptacle Assembly 101377-00 AC to Power Switch 101267-00 Fan Power Assembly 106028-00 RH Temperature Connector Assembly 106030-00 Heater Cable to Heater Assembly 106029-00 Pump Cable to Pump Plug Assembly 106844-00 Rear Solenoid Cable Assembly 106027-00 Pressure to Interrupt Board Cable Assembly 105952-00 Cam Photo Interrupt Cable Assembly 106189-00 Counter Wheel Photo Interrupt Cable Assembly 106400-00 External RH Temperature Cable Assembly 108156-00 SHARP to Measurement Interface Board Cable Assembly 108170-00 SHARP Case Cable Assembly Model 5030i SHARP Instruction Manual 7-7 Servicing External Device Connection Components External Device Connection Components 7-8 Model 5030i SHARP Instruction Manual Table 7–3 lists the standard and optional cables and components used for connecting external devices such as PCs and dataloggers to an iSeries instrument. Table 7–3. External Device Connection Components Part Number Description 102562-00 Terminal Block and Cable Kit (DB25) (optional) 102556-00 Terminal Block and Cable Kit (DB37) (optional) 102645-00 Cable, DB37M to Open End Cable, Six Feet (optional) 102646-00 Cable, DB37F to Open End, Six Feet (optional) 102659-00 Cable, DB25M to Open End, Six Feet (optional) 6279 Cable, RS-232, Six Feet (optional) 102888-00 Terminal Board PCB Assembly, DB37F (standard) 102891-00 Terminal Board PCB Assembly, DB37M (standard) 103084-00 Terminal Board PCB Assembly, DB25M (included with optional I/O Expansion Board) 105968-00 SHARP PCB Assembly 104100-00 RH/Temperature PCB Assembly Thermo Fisher Scientific Servicing External Device Connection Components Primary Measurement Head Assy Detector Amp Spindle Tape Wheel Assy Tape Radius Guide Bottom Radius Guide Filter Tape Supply Reel SHARP Connection Bracket Assy Inlet External Solenoid Counter Wheel Photo Interrupt Board Assy Tube Mounting Block Assy Cam Final Assy Cam Photo Interrupt Board SHARP Connection Bracket Assy Pressure Board Proportional Valve w/fitting Assy I/O Expansion Board (Opt) Digital Output Board Front Panel Front Panel Board Power Supply Motor w/ Photo Measurement Interface Interrupt Coupler Assy Board Optional Transformer Motherboard Figure 7–2. Model 5030i Component Layout Thermo Fisher Scientific Model 5030i SHARP Instruction Manual 7-9 Servicing External Device Connection Components Reference Detector Board SHARP Board Assy SHARP SHARPBoard BoardBracket BracketAssy Assy Source Board Scatter Detector Board Optical Bench RH Board Optical Bench Inlet Figure 7–3. SHARP Optics Component Layout 7-10 Model 5030i SHARP Instruction Manual Thermo Fisher Scientific Servicing Removing the SHARP Optics Assembly Removing the SHARP Optics Assembly The SHARP optics assembly can be removed from the measurement case assembly. Refer to the following steps when a procedure requires lowering the partition panel (Figure 7–4). Captive Screws (2) Electrical Connector Figure 7–4. Removing the SHARP Optics Assembly Equipment Required: Philips screwdriver Equipment Damage Some internal components can be damaged by small amounts of static electricity. A properly grounded antistatic wrist strap must be worn while handling any internal component. ▲ 1. Turn the instrument OFF and unplug the power cord. 2. If the instrument is mounted in a rack, remove it from the rack. 3. Disconnect the electrical connector. 4. Unfasten the two captive hardware screws. Thermo Fisher Scientific Model 5030i SHARP Instruction Manual 7-11 Servicing Removing the Measurement Case Assembly and Lowering the Partition Panel 5. Pull the cover in an upward direction. 6. Replace the SHARP optics assembly by following the previous steps in reverse. Removing the Measurement Case Assembly and Lowering the Partition Panel REMOVE SCREWS Pass Through Connectors Loosen Captive Screw The measurement case assembly can be removed and the partition panel can be lowered to improve access to connectors and components. Refer to the following steps when a procedure requires lowering the partition panel (Figure 7–5). Remove SHARP Optics Cover Assembly SLIDE CASE ASSEMBLY OUT Partition Panel Remove Screws Remove Screw LOWER PANEL Remove Hidden Screw Figure 7–5. Removing the Measurement Case Assembly and Lowering the Partition Panel Equipment Required: Philips screwdriver 7-12 Model 5030i SHARP Instruction Manual Thermo Fisher Scientific Servicing Removing the Measurement Case Assembly and Lowering the Partition Panel Equipment Damage Some internal components can be damaged by small amounts of static electricity. A properly grounded antistatic wrist strap must be worn while handling any internal component. ▲ 1. Turn the instrument OFF and unplug the power cord. 2. If the instrument is mounted in a rack, remove it from the rack. 3. Remove the SHARP optics cover assembly, then proceed to the next step below. Refer to “Removing the SHARP Optics Assembly” described previously, 4. Disconnect the plumbing connections at the rear of the measurement case assembly. 5. Disconnect the connectors that pass through the center of the partition panel. 6. Remove two screws from the left side rear of the case (viewed from the front). 7. Remove one screw from the bottom rear of the case. 8. Remove one screw from the top front of the partition panel. 9. While holding the case securely, loosen the captive screw at the rear of the measurement case assembly, and pull the measurement case assembly from the rear of the case. 10. Remove the screw at the top rear of the partition panel that secures the top of the panel to the measurement case assembly, and lower the panel, being careful not to put excessive tension on the cables. 11. Replace the measurement case assembly by following the previous steps in reverse. Thermo Fisher Scientific Model 5030i SHARP Instruction Manual 7-13 Servicing Fuse Replacement Fuse Replacement Use the following procedure to replace the fuse. Equipment Required: Replacement fuses (refer to the “Replacement Parts List” in this chapter). 1. Turn the instrument OFF and unplug the power cord. 2. Remove the fuse drawer, located on the AC power connector. 3. If either fuse is blown, replace both fuses. 4. Insert fuse drawer and re-connect power cord. Fan/Filter Replacement Use the following procedure to replace the fan and the fan filter (Figure 7– 6). Equipment Required: Fan Fan filter Philips screwdriver Cable cutter (for tie-wrap removal) Equipment Damage Some internal components can be damaged by small amounts of static electricity. A properly grounded antistatic wrist strap must be worn while handling any internal component. ▲ 1. Turn the instrument OFF, unplug the power cord, and remove the cover. 2. Remove the fan guard and filter from the fan by unsnapping it. 3. If the fan is not being replaced, install the new filter, and snap it back into place, and skip the remaining steps. 4. Disconnect the fan power cable from the fan. Do not lose the four nuts. 7-14 Model 5030i SHARP Instruction Manual Thermo Fisher Scientific Servicing Detector Amplifier Assembly Replacement 5. Remove the four fan mounting screws and remove the fan. 6. Install a new fan following the previous steps in reverse. Mounting Screws (4) Filter Fan Guard Keps Nuts (4) Figure 7–6. Replacing the Fan Detector Amplifier Assembly Replacement Use the following procedure to replace the detector/preamplifier assembly (Figure 7–7). Equipment Required: Detector amplifier assembly Philips screwdriver Adjustable wrench WARNING The detector pre-amp assembly has a power backup built in. “DO NOT OPEN” caution handeling. Backup power will dissipate after 8 hours. ▲ Equipment Damage Some internal components can be damaged by small amounts of static electricity. A properly grounded antistatic wrist strap must be worn while handling any internal component. ▲ 1. Turn the instrument OFF and unplug the power cord. Thermo Fisher Scientific Model 5030i SHARP Instruction Manual 7-15 Servicing Detector Amplifier Assembly Replacement 2. Remove the SHARP optics cover assembly and the measurement case assembly, as described earlier. 3. Disconnect the cable from the detector amplifier assembly connector on the measurement interface board and disconnect the SHV connector from the detector amplifier. 4. Remove the one screw holding the detector amplifier mounting bracket and slide out the detector amplifier assembly. Unhook SHV connector Unfasten screw and slide detector amplifier out Slide Out Unhook connector from Interface Board Figure 7–7. Replacing the Detector Amplifier Assembly 5. Install the new detector amplifier assembly by following the previous steps in reverse. 6. Calibrate the detector amplifier board. Refer to the “Detector Amplifier Board Calibration” procedure that follows. 7-16 Model 5030i SHARP Instruction Manual Thermo Fisher Scientific Servicing Detector Amplifier Board Calibration Note If Service Mode is not displayed, refer to “Accessing the Service Mode” on page 7-4, then return to the beginning of this step. ▲ 7. Calibrate the instrument. Refer to the “Calibration” chapter in this manual. Detector Amplifier Board Calibration Calibrate the detector amplifier after replacing the detector amplifier board. Note This adjustment should only be performed by an instrument service technician. ▲ 1. Let the instrument sample zero air for about 90 minutes. 2. From the Main Menu, choose Service > Detector Calibration > Auto. The Auto Detector Calibration screen appears. Note If Service Mode is not displayed, refer to “Accessing the Service Mode” on page 7-4, then return to the beginning of this step. ▲ 3. At the Detector Calibration screen, press detector calibration. External Pump Replacement to start the auto Use the following procedure to replace the pump (Figure 7–8). Equipment Required: Pump Adjustable wrench Equipment Damage Some internal components can be damaged by small amounts of static electricity. A properly grounded antistatic wrist strap must be worn while handling any internal component. ▲ 1. Turn the instrument OFF, unplug the power cord, and remove the cover. 2. Disconnect the pump power cable from the rear panel. 3. Remove both lines from the pump. Thermo Fisher Scientific Model 5030i SHARP Instruction Manual 7-17 Servicing Pressure Board Replacement 4. Install the new pump by following the previous steps in reverse. 5. Perform a leak test as described in the “Preventive Maintenance” chapter. Connect SHARP Valve Port 1 PUMP Connect to Rear Panel Elec Pump Connect to Rear Panel “VACUUM” Figure 7–8. Replacing the Pump Pressure Board Replacement Use the following procedure to replace the pressure board (Figure 7–9). Equipment Required: Pressure board Philips screwdriver, #2 Equipment Damage Some internal components can be damaged by small amounts of static electricity. A properly grounded antistatic wrist strap must be worn while handling any internal component. ▲ 1. Turn the instrument OFF, unplug the power cord, and remove the cover. 2. Disconnect plumbing from the pressure board assembly (Figure 7–10). Note the plumbing connections to facilitate reconnection. 7-18 Model 5030i SHARP Instruction Manual Thermo Fisher Scientific Servicing Pressure Board Replacement 3. Disconnect the pressure board from the floor plate on the measurement interface board. 4. Remove the four pressure board assembly retaining screws and remove the pressure board assembly (Figure 7–9). Unhook Pressure Cable from Interface Board “Press” Board Remove Plumbing Remove Screws (4) Figure 7–9. Replacing the Pressure Board Assembly 5. To install the pressure board assembly, follow the previous steps in reverse. Thermo Fisher Scientific Model 5030i SHARP Instruction Manual 7-19 Servicing Pressure Board Calibration Figure 7–10. Replacing the Pressure Board Assembly Plumbing Connection 6. Calibrate the pressure sensor. Refer to the “Pressure Board Calibration” procedure that follows. 7. After calibration, perform a leak test as described in the “Preventive Maintenance” chapter. Pressure Board Calibration Use the following procedure to calibrate the pressure board assembly. Equipment Required: Manometer 1. From the Main Menu, choose Service > Pres/Vacuum Calibration > Baro Pres. Adjust the barometer pressure span by entering the actual barometric pressure value. Note If Service Mode is not displayed, refer to “Accessing the Service Mode” on page 7-4 , then return to the beginning of this step. ▲ 2. Return to the Pres/Vacuum Calibration, choose Vac/Flow > Flow Pres Span. Calibrate the flow pressure span according to the following: a. Place digital manometer on bench. 7-20 Model 5030i SHARP Instruction Manual Thermo Fisher Scientific Servicing Analog Output Testing b. Turn on manometer and allow to self calibrate. Do not move manometer while self-calibrating. c. After zeroing the digital manometer, connect the “+” side of the manometer to the Delta-P Δ+ port on the rear panel. d. Connect the “–” side of the manometer to the Delta-P Δ– port on the rear panel. e. Open both Delta-P Δ+ and Δ– toggle valves to open flow through the manometer. f. Cal Flow Pres Span by entering the actual value read by the manometer. g. Press to save value. h. Turn off the manometer; this meter does not have an automatic turn off feature. 3. Return to the Pres/Vacuum Calibration, choose Vac/Flow > Vac Pres Span. Calibrate the vacuum pressure span according to the following: a. Use an acceptable vacuum manometer. If using a blue Druck manometer, place blue manometer on bench. b. Turn on manometer and let manometer self calibrate. Do not move manometer while self-calibrating. c. Connect the “+” side of the manometer to the Delta-P Δ+ port on the rear panel. d. Open Delta-P Δ+ toggle vales to open flow through the manometer. e. Cal Vac Pressure Span by entering the actual value from the reference manometer. f. Press Analog Output Testing to save value. The analog outputs should be tested if the concentration value on the front panel display disagrees with the analog outputs. To check the analog outputs, connect a meter to an analog output channel (voltage or current) and compare the meter reading with the output value set on the Test Analog Outputs screen. Equipment Required: Multimeter Use the following procedure to test the analog outputs. Thermo Fisher Scientific Model 5030i SHARP Instruction Manual 7-21 Servicing Analog Output Testing 1. Connect a meter to the channel to be tested. Figure 7–11 shows the analog output pins and Table 7–4 identifies the associated channels. 2. From the Main Menu, choose Diagnostics > Test Analog Outputs. The Test Analog Outputs screen appears. 3. Press to scroll to the desired channel corresponding to the rear panel terminal pins where the meter is connected, and press . The Set Analog Outputs screen appears. 4. Press to set the output to zero. The Output Set To line displays Zero. 5. Check that the meter is displaying the zero value. If the meter reading differs by more than one percent of the full-scale output, the analog outputs should be adjusted. Refer to the “Analog Output Calibration” procedure that follows. 6. Press to set the output to full-scale. The Output Set To line displays Full-Scale. 7. Check that the meter is displaying a full-scale value. If the meter reading differs by more than one percent of the full-scale output, the analog outputs should be adjusted. Refer to the “Analog Output Calibration” procedure that follows. 8. Press 7-22 Model 5030i SHARP Instruction Manual to reset the analog outputs to normal. Thermo Fisher Scientific Servicing Analog Output Testing Current Outputs Analog Voltage Inputs Analog Voltage Outputs Figure 7–11. Rear Panel Analog Input and Output Pins Table 7–4. Analog Output Channels and Rear Panel Pin Connections Voltage Channel Pin Current Channel Pin 1 14 1 15 2 33 2 17 3 15 3 19 4 34 4 21 5 17 5 23 6 36 6 25 Ground 16, 18, 19, 35, 37 Current Output Return 13, 16, 18, 20, 22, 24 Table 7–5. Analog Input Channels and Rear Panel Pin Connections Thermo Fisher Scientific Input Channel Pin 1 1 2 2 3 3 Model 5030i SHARP Instruction Manual 7-23 Servicing Analog Output Calibration Analog Output Calibration Input Channel Pin 4 5 5 6 6 7 7 9 8 10 Ground 4, 8, 11, 14 Use the following procedure to calibrate the analog outputs if a meter reading in the “Analog Output Testing” procedure differed by more than one percent or after replacing the optional I/O expansion board. Equipment Required: Multimeter 1. Connect a meter to the channel to be adjusted and set to voltage or current as appropriate. Figure 7–11 shows the analog output pins and Table 7–4 identifies the associated channels. 2. From the Main Menu, choose Service > Analog Out Cal. The Analog Output Cal screen appears. Note If Service Mode is not displayed, refer to “Accessing the Service Mode” on page 7-4 , then return to the beginning of this step. ▲ to scroll to the desired 3. At the Analog Output Cal menu, press voltage channel or current channel corresponding to the rear panel terminal pin where the meter is connected, then press . 4. With the cursor at Calibrate Zero, press . The Analog Output Cal line displays Zero. Note When calibrating the analog output, always calibrate zero first and then calibrate full-scale. ▲ until the meter reads the value shown in the Set 5. Use Output To line (0.0 V, or 0.0 or 4.0 mA), then press to save the value. 7-24 Model 5030i SHARP Instruction Manual Thermo Fisher Scientific Servicing Analog Input Calibration 6. Press 7. Press to return to the previous screen. to select Calibrate Full-Scale. 8. Use until the meter reads the value shown in the Set to save the value. Output To line, then press Analog Input Calibration Calibrating the Input Channels to Zero Volts Use the following procedures to calibrate the analog inputs after replacing the optional I/O expansion board. These procedures include selecting analog input channels, calibrating them to zero volts, and then calibrating them to full-scale using a known voltage source. Use the following procedure to calibrate the input channels to zero volts. 1. From the Main Menu, choose Service > Analog Input Cal. The Analog Input Cal screen appears. Note If Service Mode is not displayed, refer to “Accessing the Service Mode” on page 7-4, then return to the beginning of this step. ▲ to scroll to a channel, and 2. At the Analog Input Cal screen, press press . 3. With the cursor at Calibrate Zero, press . The screen displays the input voltage for the selected channel. 4. Make sure that nothing is connected to the channel input pins and press to calibrate the input voltage on the selected channel to zero volts. The screen displays 0.00 V as the voltage setting. 5. Press > to return to the Analog Input Cal screen and repeat Steps 2 through 4 to calibrate other input channels to zero as necessary. 6. Continue with the “Calibrating the Input Channels to Full-Scale” procedure that follows. Thermo Fisher Scientific Model 5030i SHARP Instruction Manual 7-25 Servicing Themistor Replacement Calibrating the Input Channels to Full-Scale Use the following procedure to calibrate the input channels to full-scale by applying a known voltage to the channels. Equipment Required: DC voltage source (greater than 0 volts and less than 10 volts) 1. Connect the known DC voltage source to the input channel (1-8) to be calibrated. Figure 7–11 shows the analog input pins and Table 7–5 identifies the associated channels. 2. From the Main Menu, choose Service > Analog Input Cal. The Analog Input Cal screen displays input channels 1-8. 3. At the Analog Input Cal screen, press selected in Step 1, and press . 4. Press to scroll to the channel to scroll to Calibrate Full-scale, and press . The screen displays the input voltage for the selected channel. 5. Use and to enter the source voltage, and press to calibrate the input voltage for the selected channel connected to the source voltage. > to return to the input channels display and repeat 6. Press Steps 3-5 to calibrate other input channels to the source voltage as necessary. Themistor Replacement Use the following procedure to replace the optional ambient temperature thermistor (Figure 7–12). Equipment Required: Thermistor assembly Equipment Damage Some internal components can be damaged by small amounts of static electricity. A properly grounded antistatic wrist strap must be worn while handling any internal component. ▲ 7-26 Model 5030i SHARP Instruction Manual Thermo Fisher Scientific Servicing I/O Expansion Board (Optional) Replacement 1. Turn the instrument OFF, unplug the power cord, and remove the cover. 2. Squeeze the thermistor latch and pull the thermistor assembly from the AMB TEMP connector on the measurement interface board. 3. Snap the new thermistor into the AMB TEMP connector. Thermistor Figure 7–12. Replacing the Thermistor I/O Expansion Board (Optional) Replacement Use the following procedure to replace the optional I/O expansion board (Figure 7–13). Equipment Required: I/O expansion board Nut driver, 3/16-inch Equipment Damage Some internal components can be damaged by small amounts of static electricity. A properly grounded antistatic wrist strap must be worn while handling any internal component. ▲ 1. Turn the instrument OFF, unplug the power cord, and remove the cover. Thermo Fisher Scientific Model 5030i SHARP Instruction Manual 7-27 Servicing I/O Expansion Board (Optional) Replacement 2. Unplug the I/O expansion board cable from the EXPANSION BD connector on the motherboard. 3. Remove the two standoffs holding the I/O expansion board connector to the rear panel (Figure 7–14). 4. Pop the board off of the mounting studs and remove the board. 5. To install the I/O expansion board, follow the previous steps in reverse. 6. Calibrate the analog current outputs and analog voltage inputs as defined earlier in this chapter. Motherboard Support Bracket Mounting Studs Motherboard Digital Output Board I/O Expansion Board (Opt) Figure 7–13. Replacing the I/O Expansion Board (Optional) 7-28 Model 5030i SHARP Instruction Manual Thermo Fisher Scientific Servicing Digital Output Board Replacement I/O Expansion Board Motherboard Digital Output Board Figure 7–14. Rear Panel Board Connectors Digital Output Board Replacement Use the following procedure to replace the digital output board (Figure 7– 13). Equipment Required: Digital output board Nut driver, 3/16-inch Equipment Damage Some internal components can be damaged by small amounts of static electricity. A properly grounded antistatic wrist strap must be worn while handling any internal component. ▲ 1. Turn the instrument OFF, unplug the power cord, and remove the cover. 2. Remove the I/O expansion board (optional), if used. See the “I/O Expansion Board (Optional) Replacement” procedure in this chapter. 3. Disconnect the digital output board ribbon cable from the motherboard. 4. Using the nut driver, remove the two standoffs securing the board to the rear panel (Figure 7–14). Thermo Fisher Scientific Model 5030i SHARP Instruction Manual 7-29 Servicing Motherboard Replacement 5. Pop the digital output board off of the mounting studs and remove the board. 6. To install the digital output board, follow the previous steps in reverse. Motherboard Replacement Use the following procedure to replace the motherboard (Figure 7–13). Equipment Required: Motherboard Philips screwdriver Nut driver, 3/16-inch Equipment Damage Some internal components can be damaged by small amounts of static electricity. A properly grounded antistatic wrist strap must be worn while handling any internal component. ▲ 1. Turn the instrument OFF, unplug the power cord, and remove the cover. 2. Remove the I/O expansion board (optional), if used. See the “I/O Expansion Board (Optional) Replacement” procedure in this chapter. 3. Remove the digital output board. See the “Digital Output Board Replacement” procedure in this chapter. 4. Unplug all connectors from the motherboard. Note connector locations to facilitate re-connection. 5. Using the nut driver, remove the six standoffs securing the board to the rear panel (Figure 7–14). 6. Pop the motherboard off of the support bracket, and remove the motherboard. 7. To install the motherboard, follow the previous steps in reverse. 8. Calibrate the analog voltage outputs as defined earlier in this chapter (all ranges). 7-30 Model 5030i SHARP Instruction Manual Thermo Fisher Scientific Servicing Measurement Interface Board Replacement Measurement Interface Board Replacement Use the following procedure to replace the measurement interface board (Figure 7–15). Equipment Required: Measurement interface board Philips screwdriver Equipment Damage Some internal components can be damaged by small amounts of static electricity. A properly grounded antistatic wrist strap must be worn while handling any internal component. ▲ 1. Lower the partition panel, then proceed to the next step below. Refer to “Removing the Measurement Case Assembly and Lowering the Partition Panel” in this chapter. 2. Unplug all connectors from the measurement interface board. Note the locations of the connectors to facilitate re-connection. 3. Unscrew the two screws at the top of the measurement interface board. Pop the measurement interface board off from the two bottom mounting studs and remove the board. 4. To install the measurement interface board, follow the previous steps in reverse. 5. Re-install the measurement case assembly. 6. Calibrate the instrument. Refer to the “Calibration” chapter in this manual. Thermo Fisher Scientific Model 5030i SHARP Instruction Manual 7-31 Servicing Photo Interrupt Board Replacement Mounting Studs (2) Mounting Screws (2) Measurement Interface Board Figure 7–15. Replacing the Measurement Interface Board Photo Interrupt Board Replacement Use the following procedure to replace the photo interrupt board (Figure 7–16). Equipment Required: Photo interrupt board Hex driver, 3/32-inch Philips head screwdriver, #1 Equipment Damage Some internal components can be damaged by small amounts of static electricity. A properly grounded antistatic wrist strap must be worn while handling any internal component. ▲ 1. Turn the instrument OFF, unplug the power cord, and remove the cover. 2. Disconnect cable. 3. Remove mounting screws. 7-32 Model 5030i SHARP Instruction Manual Thermo Fisher Scientific Servicing Proportional Valve Replacement 4. Remove board. 5. Re-install the photo interrupt board by following the previous steps in reverse. Unfasten screws (2) Unhook Cable Figure 7–16. Replacing the Photo Interrupt Board Proportional Valve Replacement Use the following procedure to replace the proportional valve (Figure 7– 17). Equipment Required: Proportional valve assembly Hex driver, 3/32-inch Equipment Damage Some internal components can be damaged by small amounts of static electricity. A properly grounded antistatic wrist strap must be worn while handling any internal component. ▲ 1. Turn the instrument OFF, unplug the power cord, and remove the cover. 2. Refer to “Removing the Measurement Case Assembly and Lowering the Partition Panel” in this chapter to lower the partition panel, then proceed to the next step below. 3. Disconnect connector from the measurement interface board. Thermo Fisher Scientific Model 5030i SHARP Instruction Manual 7-33 Servicing Detector Assembly Replacement 4. Disconnect plumbing. 5. Remove four mounting screws and remove proportional valve assembly. 6. Replace the proportional valve assembly by following the previous steps in reverse. 7. Perform a leak test as described in the “Preventive Maintenance” chapter. Unhook Tubing from Measurement Head Unfasten Screws (4) Unhook Tubing from Rear Panel Unhook Connector from Measurement Interface Board “Beta 1” Figure 7–17. Replacing the Proportional Valve Detector Assembly Replacement Use the following procedure to replace the detector assembly (Figure 7– 18). Equipment Required: Detector assembly Hex driver, 4 mm Safety glasses 7-34 Model 5030i SHARP Instruction Manual Thermo Fisher Scientific Servicing Detector Assembly Replacement WARNING The detector assembly should be replaced by a qualified technician knowledgeable in dealing with radiation precautions. By removing the detector assembly, the C-14 radioactive source is partially exposed. Safety glassed must be worn during this replacement procedure. The amount of C-14 meets the USNRC regulations as an exempt amount of radioactive source <100 μCi. ▲ The service procedures in this manual are restricted to qualified representatives. ▲ If the equipment is operated in a manner not specified by the manufacturer, the protection provided by the equipment may be impaired. ▲ CAUTION The detector window is very fragile. Handle with great care and do not wipe or touch the window. Furthermore, do not touch the solder cable connection (electrode) with your bare fingers. The oils from your skin can damage the detector. ▲ Safety glasses must be worn while replacing the detector assembly. ▲ Equipment Damage Some internal components can be damaged by small amounts of static electricity. A properly grounded antistatic wrist strap must be worn while handling any internal component. ▲ 1. Turn the instrument OFF, unplug the power cord, and remove the cover. 2. Disconnect the SHV connector from the detector amplifier assembly and slide throught the wall plate. 3. Loosen both detector mounting screws and slowly lift the detector assembly. 4. Install the new detector assembly by following the previous steps in reverse, while taking special care not to puncture the mylar. 5. Calibrate the detector assembly. Refer to the “Detector Calibration” procedure on page 4-12. Thermo Fisher Scientific Model 5030i SHARP Instruction Manual 7-35 Servicing Flow RTD Replacement Unhook SHV Connector Unfasten Screws (2) Figure 7–18. Replacing the Detector Assembly Flow RTD Replacement Use the following procedure to replace the flow resistive temperature diction (RTD) (see Figure 7–19). Equipment Required: Sample flow RTD Adjustable wrench Equipment Damage Some internal components can be damaged by small amounts of static electricity. A properly grounded antistatic wrist strap must be worn while handling any internal component. ▲ 1. Turn the instrument OFF, unplug the power cord, and remove the cover. 2. Refer to “Removing the Measurement Case Assembly and Lowering the Partition Panel” in this chapter to lower the partition panel, then proceed to the next step below. 3. Loosen the kynar fittings using the wrench and slide out sample flow RTD. 7-36 Model 5030i SHARP Instruction Manual Thermo Fisher Scientific Servicing Transformer Replacement 4. Unplug the RTD connector from the measurement interface board “flowtemp1”. 5. Carefully install the new RTD by following the previous steps in reverse. Match the marked black line on the RTD to be flush with the fitting. Note The black line is the pre-measured depth for the RTD. ▲ 6. Calibrate the instrument. Refer to the “Calibration” chapter in this manual. Udjustable Wrench Unplug RTD Connector Figure 7–19. Replacing the RTD Transformer Replacement Use the following procedure to replace the transformer (Figure 7–20). Equipment Required: Transformer assembly Philips screwdriver, #2 Equipment Damage Some internal components can be damaged by small amounts of static electricity. A properly grounded antistatic wrist strap must be worn while handling any internal component. ▲ Thermo Fisher Scientific Model 5030i SHARP Instruction Manual 7-37 Servicing Radius Tube Replacement 1. Turn the instrument OFF, unplug the power cord, and remove the cover. 2. Disconnect cables from the measurement interface board and motherboard. 3. Unscrew the four mounting screws and lift out the transformer assembly. 4. Install the new transformer by following the previous steps in reverse. Unhook Short Cable from Transformer from Common Electronic Board “AC INT BD” Unfasten Screws (4) Unhook Long Cable from Transformer to back of Measurement Interface Board Figure 7–20. Replacing the Transformer Radius Tube Replacement Use the following procedure to replace the radius tube (Figure 7–21). Equipment Required: Radius tube assembly Hex driver, 9/16-inch Hex driver, 7/64-inch Equipment Damage Some internal components can be damaged by small amounts of static electricity. A properly grounded antistatic wrist strap must be worn while handling any internal component. ▲ 7-38 Model 5030i SHARP Instruction Manual Thermo Fisher Scientific Servicing Ambient RH/Temperature Replacement 1. Turn the instrument OFF, unplug the power cord, and remove the cover. 2. Loosen the two screws of the radius mounting block using a 9/16-inch hex driver. 3. Remove radius tube SHARP adapter. 4. Loosen the two mounting screws on the measurement head assembly. Remove tube by slightly turning side-to-side, while pulling. 5. Verify the sealing o-ring is in position before sliding the new radius tube assembly into the measurement head. 6. Install the new radius tube assembly by following the previous steps in reverse. Radius Tube Adapter Unfasten Screws (2) Insulation Pull Out Tube Unfasten Screws (2) Figure 7–21. Replacing the Radius Tube Ambient RH/Temperature Replacement Use the following procedure to replace the ambient RH/temperature assembly (Figure 7–22). Equipment Required: Ambient RH/temperature assembly Adjustable wrench Pliers Thermo Fisher Scientific Model 5030i SHARP Instruction Manual 7-39 Servicing Ambient RH/Temperature Replacement Equipment Damage Some internal components can be damaged by small amounts of static electricity. A properly grounded antistatic wrist strap must be worn while handling any internal component. ▲ 1. Turn the instrument OFF, unplug the power cord, and remove the cover. 2. Remove the cable from the bottom of the radiation shield assembly that houses the ambient RH/temperature assembly. 3. Remove the two mounting nuts on the mounting clamp of the radiation shield assembly. Remove the radiation shield assembly. 4. Turn over the radiation shield assembly and remove the three thumb screws. 5. Remove the three spacers and mounting bracket. 6. Slide out the ambient RH/temperature assembly. 7. Slide in the new ambient RH/temperature assembly by following the previous steps in reverse. 8. Calibrate the instrument. Refer to the “Calibration” chapter in this manual. 7-40 Model 5030i SHARP Instruction Manual Thermo Fisher Scientific Servicing Front Panel Board Replacement Remove RH/Temperature Assembly Unfasten Thumb Screws (3) Remove Cable Figure 7–22. Replacing the Ambient RH/Temperature Assembly Front Panel Board Replacement Use the following procedure to replace the front panel board (Figure 7– 23). Equipment Required: Front panel board Equipment Damage Some internal components can be damaged by small amounts of static electricity. A properly grounded antistatic wrist strap must be worn while handling any internal component. ▲ 1. Turn the instrument OFF, unplug the power cord, and remove the cover. 2. Remove the three ribbon cables and the two-wire connector from the front panel board. 3. Pop the board off of the two top mounting studs and remove the board by lifting it up and off the slotted bottom support. 4. Replace the front panel board by following the previous steps in reverse. Thermo Fisher Scientific Model 5030i SHARP Instruction Manual 7-41 Servicing LCD Module Replacement LCD Module LCD Module Screws (2) Retaining Screw Front Panel Board Mounting Studs (2) Ribbon Cables (3) Two-Wire Connector Bottom Support Figure 7–23. Replacing the Front Panel Board and the LCD Module LCD Module Replacement Use the following procedure to replace the LCD module (Figure 7–23). Equipment Required: LCD module Philips screwdriver CAUTION If the LCD panel breaks, do not let the liquid crystal contact your skin or clothes. If the liquid crystal contacts your skin or clothes, wash it off immediately using soap and water. ▲ Equipment Damage Some internal components can be damaged by small amounts of static electricity. A properly grounded antistatic wrist strap must be worn while handling any internal component. ▲ Do not remove the LCD panel or frame from the LCD module. ▲ The LCD polarizing plate is very fragile, handle it carefully. ▲ 7-42 Model 5030i SHARP Instruction Manual Thermo Fisher Scientific Servicing LCD Module Replacement Do not wipe the LCD polarizing plate with a dry cloth, as it may easily scratch the plate. ▲ Do not use alcohol, acetone, MEK or other Ketone based or aromatic solvents to clean the LCD module, but rather use a soft cloth moistened with a naphtha cleaning solvent. ▲ Do not place the LCD module near organic solvents or corrosive gases. ▲ Do not shake or jolt the LCD module. ▲ 1. Turn the instrument OFF, unplug the power cord, and remove the cover. 2. Disconnect the ribbon cable and the two-wire connector from the front panel board. 3. Remove the four screws at the corners of the LCD module. 4. Slide the LCD module out towards the center of the instrument. 5. Replace the LCD module by following the previous steps in reverse. Note The optimal contrast will change from one LCD screen to another. After replacing the LCD screen, the contrast may need to be reset. If the content on the screen is visible, select Instrument Controls > Screen Contrast and adjust the screen contrast. If the content on the screen is not visible, use the “set contrast 10” C-Link command to set screen constrast to mid range, then optimize the contrast. See the “C-Link Protocol Commands” appendix for more information on this command. ▲ Thermo Fisher Scientific Model 5030i SHARP Instruction Manual 7-43 Servicing Removing the SHARP Optics Cover Removing the SHARP Optics Cover The SHARP optics cover can be removed from the SHARP optics. Refer to the following steps when a procedure requires access to the SHARP optics assembly (Figure 7–24). Remove Screw Remove Screw Figure 7–24. Removing the SHARP Optics Cover Equipment Required: Philips screwdriver Equipment Damage Some internal components can be damaged by small amounts of static electricity. A properly grounded antistatic wrist strap must be worn while handling any internal component. ▲ 1. Turn the instrument OFF and unplug the power cord. 2. If the instrument is mounted on a rack, remove it from the rack. 3. Unfasten the two screws. 4. Lift cover in an upward direction. 5. Replace the SHARP optics cover by following the previous steps in reverse. 7-44 Model 5030i SHARP Instruction Manual Thermo Fisher Scientific Servicing External Solenoid Valve Replacement External Solenoid Valve Replacement Use the following procedure to replace the external solenoid valve (Figure 7–25). Equipment Required: External solenoid valve Equipment Damage Some internal components can be damaged by small amounts of static electricity. A properly grounded antistatic wrist strap must be worn while handling any internal component. ▲ 1. Turn the instrument OFF, unplug the power cord. 2. Disonnect all vacuum tubing from the solenoid. 3. Disconnect the solenoid electrical connector from the rear panel connector. 4. Unfasten the two captive hardware screws from the rear panel. 5. Replace the solenoid valve by following the previous steps in reverse. To Outdoor Roof Flange Captive Hardware (2) To Pump Exhaust Connector Figure 7–25. Replacing the External Solenoid Valve Thermo Fisher Scientific Model 5030i SHARP Instruction Manual 7-45 Servicing SHARP RH/Temp Sensor Replacement SHARP RH/Temp Sensor Replacement Use the following procedure to replace the SHARP RH/Temp sensor (Figure 7–26). Equipment Damage Some internal components can be damaged by small amounts of static electricity. A properly grounded antistatic wrist strap must be worn while handling any internal component. ▲ 1. Turn the instrument OFF, unplug the power cord, and remove the nephelometer from the base instrument. 2. Remove the two side cover screws, and remove cover. 3. Disconnect the RH/Temp connector from the SHARP MIB board “TEMP/RH”. 4. Remove the two socket-head screws from the RH/Temp board assembly from the upper optic chamber endplate. 5. Remove the RH/Temp gasket from the old RH/Temp board assembly and add it to the new RH/Temp board assembly. 6. Slide in the new RH/Temp assembly by following the previous steps. 7. Calibrate the RH/Temp sensor. Refer to the “Calibration” chapter in this manual. 7-46 Model 5030i SHARP Instruction Manual Thermo Fisher Scientific Servicing SHARP Interface Board Replacement TEMP/RH Socket-head Screws (2) Figure 7–26. Disconnecting the RH/Temp Connector SHARP Interface Board Replacement Use the following procedure to replace the SHARP interface board (Figure 7–27 and Figure 7–28). Equipment Required: SHARP interface board Philips screwdriver, #2 Equipment Damage Some internal components can be damaged by small amounts of static electricity. A properly grounded antistatic wrist strap must be worn while handling any internal component. ▲ 1. Document the Nephelometer Coefficient: From the Main Menu, choose Calibration Factors > Neph Coef. Record the nephelometer coefficient value. 2. Document the Nephelometer Calibration: From the Main Menu, choose Service > Neph Calibration. Record the nephelometer RH value, the nephelometer temperature value, and the nephelometer source level value. 3. Turn the instrument OFF, unplug the power cord, and remove the SHARP otpics cover. Thermo Fisher Scientific Model 5030i SHARP Instruction Manual 7-47 Servicing SHARP Interface Board Replacement 4. Unplug all connectors from the SHARP interface board. Note the locations of the connectors to facilitate re-connection. 5. Loosen the two screws from the bottom of the rear board panel and remove. 6. Unfasten the two screws at the top of the SHARP interface board. Slide the SHARP interface board up from the two bottom mounting studs and remove the board. 7. To install the SHARP interface board, follow the previous steps in reverse. 8. Restore the nephelometer coefficient value previously documented. 9. Restore the nephelometer RH value, the nephelometer temperature value, and the nephelometer source level value previously documented. 10. Calibrate the instrument. Refer to the “Calibration” chapter in this manual. Detector 3-Pin Data Ref Det/Source RH Temp 2-Pin Male (not used) 2-Pin Female (not used) Figure 7–27. SHARP Interface Board Connections 7-48 Model 5030i SHARP Instruction Manual Thermo Fisher Scientific Servicing Delrin Nut Replacement Loosen screws Loosen screws Figure 7–28. Replacing the SHARP Optics Board Delrin Nut Replacement Use the following procedure to replace the Delrin nut (Figure 7–29). Equipment Required: Delrin nut Philips screwdriver Set of standard hex drives Adjustable wrench Equipment Damage Some internal components can be damaged by small amounts of static electricity. A properly grounded antistatic wrist strap must be worn while handling any internal component. ▲ 1. Turn the Pump Flow OFF: From the Main Menu, choose Instrument Controls > Set Flow/Pump > Pump. Press to toggle and set the pump flow to OFF. Thermo Fisher Scientific Model 5030i SHARP Instruction Manual 7-49 Servicing Delrin Nut Replacement 2. Turn the Heater OFF: From the Main Menu, choose Instrument Controls > Set Heater > Control. Use until the value reads OFF, and press . 3. Loosen the two hex screws from the collar of the heater adapter cover. 4. Loosen the two captive screws of the heater adaptor cover and slide up. 5. Loosen the bottom 5/8-inch union nut and remove the tube adapter. 6. Slide off the heater tube adapter down. 7. Slide off ferrite bead upward off the heater tube adapter. 8. Slide off delrin nut upward off the heater tube adapter. 9. Replace the delrin nut by following the previous steps in reverse. Union Nut Hex Screws (2) Captive Screws (2) Heater Tube Adapter Ferrite Bead Delrin Nut Figure 7–29. Replacing the Delrin Nut 7-50 Model 5030i SHARP Instruction Manual Thermo Fisher Scientific Servicing Internal SHARP Cable Assembly Replacement Internal SHARP Cable Assembly Replacement Use the following procedure to replace the case cable (Figure 7–30). Equipment Required: Internal SHARP Cable Assembly Philips screwdriver Equipment Damage Some internal components can be damaged by small amounts of static electricity. A properly grounded antistatic wrist strap must be worn while handling any internal component. ▲ 1. Turn the instrument OFF and unplug the power cord. 2. If the instrument is mounted in a rack, remove it from the rack. 3. Refer to “Removing the Measurement Case Assembly and Lowering the Partition Panel” in this chapter to lower the partition panel, then proceed to the next step below. 4. Disconnect the electrical connector labeled “SHARP 1”. 5. Unfasten the four screws. 6. Pull connect up and out and install electrical connector by following the previous steps in reverse. Thermo Fisher Scientific Model 5030i SHARP Instruction Manual 7-51 Servicing Case Cable Replacement “SHARP 1” 2 Pin (Not Used) Screws (4) Figure 7–30. Replacing the Internal SHARP Cable Assembly Case Cable Replacement Use the following procedure to replace the case cable (Figure 7–31). Equipment Required: Case Cable Philips screwdriver Adjustable wrench Equipment Damage Some internal components can be damaged by small amounts of static electricity. A properly grounded antistatic wrist strap must be worn while handling any internal component. ▲ 1. Turn the instrument OFF, unplug the power cord, remove the electrical connector, loosen the two captive screws on the SHARP optics base plate, and remove the SHARP assembly from the base unit. 2. Remove the two SHARP cover screws and remove the cover. 3. Remove the hex nut from the cable clamp. 7-52 Model 5030i SHARP Instruction Manual Thermo Fisher Scientific Servicing External Zeroing Filter 4. Replace the case cable assembly by following the previous steps in reverse. Unplug Hex Nut Cover Screw Cover Screw Figure 7–31. Replacing the Case Cable External Zeroing Filter Use the following procedure to replace the external zeroing filter (Figure 7– 32). Equipment Required: Adjustable wrench Equipment Damage Some internal components can be damaged by small amounts of static electricity. A properly grounded antistatic wrist strap must be worn while handling any internal component. ▲ 1. Note the orientation of the arrow on the filter assembly. See Figure 2–7 for orientation. 2. Compress the collar of the quick connect fitting and remove the tubing from fittings. 3. Install filter assembly by following the previous steps in reverse. Thermo Fisher Scientific Model 5030i SHARP Instruction Manual 7-53 Servicing Service Locations Push in to release Push in to release Figure 7–32. Replacing the External Zeroing Filter Service Locations For additional assistance, service is available from exclusive distributors worldwide. Contact one of the phone numbers below for product support and technical information or visit us on the web at www.thermo.com/aqi. 1-866-282-0430 Toll Free 1-508-520-0430 International 7-54 Model 5030i SHARP Instruction Manual Thermo Fisher Scientific Chapter 8 System Description This chapter describes the function and location of the system components, provides an overview of the firmware structure, and includes a description of the system electronics and input/output connections and functions as follows: Hardware Thermo Fisher Scientific ● “Hardware” on page 8-1 ● “Firmware” on page 8-5 ● “Electronics” on page 8-6 ● “I/O Components” on page 8-9 Model 5030i hardware (Figure 8-1) includes: ● Nehpelometer assembly ● Primary measurement head ● Detector amplifier ● Cam photo interrupt board assembly ● Counter wheel interrupt board assembly ● Proportional valve ● Cam motor ● Tape motor ● Pressure board ● External solenoid ● Pump intake T-fitting Model 5030i SHARP Instruction Manual 8-1 System Description Hardware Primary Measurement Head Assy Detector Amp Spindle Tape Wheel Assy Tape Radius Guide Bottom Radius Guide Filter Tape Supply Reel SHARP Connection Bracket Assy Inlet External Solenoid Counter Wheel Photo Interrupt Board Assy Tube Mounting Block Assy Cam Final Assy Cam Photo Interrupt Board SHARP Connection Bracket Assy Pressure Board Proportional Valve w/fitting Assy I/O Expansion Board (Opt) Digital Output Board Front Panel Front Panel Board Power Supply Motor w/ Photo Measurement Interface Interrupt Coupler Assy Board Optional Transformer Motherboard Figure 8–1. Model 5030i Hardware Components 8-2 Model 5030i SHARP Instruction Manual Thermo Fisher Scientific System Description Hardware Reference Detector Board SHARP Board Assy SHARP SHARPBoard BoardBracket BracketAssy Assy Source Board Scatter Detector Board Optical Bench RH Board Optical Bench Inlet Figure 8–2. SHARP Optics Component Thermo Fisher Scientific Model 5030i SHARP Instruction Manual 8-3 System Description Hardware Nephelometer Assembly The nephelometer assembly uses an 880 nanometer incident light source and hybrid silicon photodetector to measure the intensity of scattered light in the presence of aerosol. This assembly houses a nephelometer, temperature sensor, relative humidity sensor, and PCB interface. Primary Measurement Head The primary measurement head uses a beta source and proportional alpha/beta detector to measure the attenuation of beta particles by sampled aerosol across a glass fiber filter and to discriminate against any naturally occurring beta interferences from the daughter nuclides of alpha decay products. Detector Amplifier This cylindrical tube houses a printed circuit board, provides power to the proportional detector and amplifies the beta and alpha counts prior to being sent to the 5030i measurement interface board. Cam Photo Interrupt Board This small printed circuit board includes a photo-interrupter to detect the closed position of the measurement head. This is connected to a motor assembly used to open and close the measurement head. Counter Wheel Interrupt Board Assembly 8-4 This small printed circuit board is mounted onto a chopper wheel that measures the amount of filter tape advanced during a filter tape change. Proportional Valve The proportional valve is a proportional solenoid valve that is used as a means of flow control. In response to the measured flow across a subsonic orifice, the proportional valve will either partially open or close to make a flow adjustment in real-time. Cam Motor This motor is used to drive the cam to rotate. By rotating the cam, the measurement head lever arm is raised and lowered for opening and closing the measurement head during a filter tape change. Tape Motor After the measurement head is opened, this motor is used to advance the filter tape a fixed amount prior to initiating another beta attenuation event on a fixed sample spot. Model 5030i SHARP Instruction Manual Thermo Fisher Scientific System Description Firmware Pressure Board External Solenoid Pump Intake TFitting Firmware Instrument Control This PCB assembly is mounted on the floor plate and has three pressure sensors attached. The pressure board is used to measure the barometric pressure, differential pressure across the orifice and vacuum under the filter tap. All tubing attached to the pressure board is numbered in case of the need to swap out this board. The external solenoid is used to permit the pump to either exhaust normally, or to deliver filtered air to the instrument during the nephelometer zero. The pump intake T-fitting provides excess air specifically for periods of nephelometer zeroing. The processor firmware tasks are organized into four areas: ● Instrument control ● Monitoring signals ● Measurement calculations ● Output communication Low-level embedded processors are used to control the various functions on the boards, such as analog and digital I/O. These processors are controlled over a serial interface with a single high-level processor that also controls the front-panel user interface. The low-level processors all run a common piece of firmware that is bundled with the high-level firmware and loaded on power-up if a different version is detected. Each board has a specific address that is used to identify to the firmware what functions are supported on that board. This address is also used for the communications between the low-level processors and the high-level processor. Every tenth of a second, the frequency counters, analog I/O, and digital I/O are read and written to by the low-level processors. The counters are accumulated over the past second and the analog inputs are averaged over that second. The high-level processor polls the low-level processors once per second to exchange the measurement and control data. Thermo Fisher Scientific Model 5030i SHARP Instruction Manual 8-5 System Description Electronics Monitoring Signals Signals are gathered from the low-level processors once per second, and then processed by the high-level processor to produce the final measurement values. The one-second accumulated counts are accumulated and reported for the user-specified averaging time. If this averaging time is greater than ten seconds, the measurement is still reported every 10 seconds. The one-second average of the other analog inputs are reported directly (no additional signal conditioning is performed by the high-level processor). Output Communication The front panel display, serial and Ethernet data ports, and analog outputs are the means of communicating the results of the above calculations. The front panel display presents the concentrations simultaneously. The display is updated every 1-10 seconds, depending on the averaging time. The analog output ranges are user selectable via firmware. The analog outputs are defaulted based on the measurement range. Negative concentrations can be represented as long as they are within -5% of fullscale. The zero and span values may be set by the user to any desired value. Electronics All electronics operate from a universal switching supply, which is capable of auto-sensing the input voltage and working over the all specified ranges. External pumps and heaters all operate on 110 VAC. An optional transformer is required if operating on the 210-250 range. An on/off switch controls all power to the analyzer and is accessible on the front panel. Motherboard 8-6 Model 5030i SHARP Instruction Manual The motherboard contains the main processor, power supplies, and a subprocessor, and serves as the communication hub for the instrument. The motherboard receives operator inputs from the front panel function keys and/or over I/O connections on the rear panel. The motherboard sends commands to the other boards to control the functions of the instrument and to collect measurement and diagnostic information. The motherboard outputs instrument status and measurement data to the graphics display and to the rear-panel I/O. The motherboard also contains I/O circuitry and the associated connector to monitor external digital status lines and to output analog voltages that represent the measurement data. Connectors located on the motherboard include: Thermo Fisher Scientific System Description Electronics External connectors include: ● External Accessory ● RS-232/485 Communications (two connectors) ● Ethernet Communications ● I/O connector with Power Fail Relay, 16 Digital Inputs, and 6 Analog Voltage Outputs. Internal connectors include: Nephelometer Interface Board Nephelometer interface board connectors Measurement Interface Board Thermo Fisher Scientific ● Function Key Panel and Display ● Measurement Interface Board ● I/O Expansion Board ● Digital Output Board ● AC Distribution The nephelometer interface board serves as the circuitry for the nephelometer measurement, an internal valve control, and on board processing of zero and particle concentration by photometry. Connectors located on the nephelometer interface board include: ● RS485 ● 24 VDC Supply ● LED Source Current ● Reference Detector ● Scattering Detector ● T/RH Sensor The measurement interface board serves as a central connection area for all measurement electronics in the instrument. It contains power supplies and interface circuitry for sensors and control devices in the measurement system. It sends status data to the motherboard and receives control signals from the motherboard. Model 5030i SHARP Instruction Manual 8-7 System Description Electronics Measurement Interface Board Connectors 8-8 Connectors located on the measurement interface board include: ● Data communication with the motherboard ● 24 V and 120 VAC power supply inputs ● Fan and solenoid outputs ● 120 VAC output and thermistor input from the sample heater ● Flow and pressure sensor inputs ● Proportional valve output ● Optical pickup input ● Pre-amp board ● Ambient temperature/RTD and RH ● Flow RTDs Flow Sensor System The flow sensor system consists of a subsonic orifice inside the primary measurement head, a differential pressure and vacuum sensors, and a flow temperature RTD. The flow system output is produced by measuring the pressure difference across a precision orifice. This unit is used for measuring the flow of sample gas in the measurement system. Pressure Sensor Assembly The pressure sensor assembly consists of a board containing three pressure transducers with tube connections. The pressure transducer output is produced by measuring the pressure difference between the sample gas pressure and ambient air pressure. Detector Amplifier Assembly The detector amplifier assembly amplifies the signal from the proportional detector that receives beta particle emissions from the C-14 source through the sample and filter tape. The output of the detector amplifier is fed to the measurement interface board. A coaxial cable from the detector amplifier supplies power and grounding to the detector. Digital Output Board The digital output board connects to the motherboard and provides solenoid driver outputs and relay contact outputs to a connector located on the rear panel of the instrument. Ten relay contacts, normally open (with power off), are provided, which are electrically isolated from each other. Eight solenoid driver outputs (open collector) are provided along with a corresponding +24 VDC supply pin on the connector. Model 5030i SHARP Instruction Manual Thermo Fisher Scientific System Description I/O Components I/O Expansion Board (Optional) Front Panel Connector Board I/O Components The I/O expansion board connects to the motherboard and adds the capability to input external analog voltage signals and to output analog currents via a connector located on the rear panel of the instrument. It contains local power supplies, a DC/DC isolator supply, a sub-processor and analog circuits. Eight analog voltage inputs are provided with an input voltage range of 0V to10 VDC. Six current outputs are provided with a normal operating range of 0 to 20 mA. The front panel connector board interfaces between the motherboard and the function key panel and graphics display. It serves as a central location to tie the three connectors required for the function key panel, the graphics display control lines, and the graphics display backlight to a single ribbon cable extending back to the motherboard. This board also includes signal buffers for the graphics display control signals and a high voltage power supply for the graphics display backlight. External I/O is driven from a generic bus that is capable of controlling the following devices: ● Analog output (voltage and current) ● Analog input (voltage) ● Digital output (TTL levels) ● Digital input (TTL levels) Note The instrument has spare solenoid valve drivers and I/O support for future expansion. ▲ Analog Voltage Outputs The instrument provides six analog voltage outputs. Each may be firmware configured for any one of the following ranges, while maintaining a minimum resolution of 12 bits: ● 0-100 mV ● 0-1 V ● 0-5 V ● 0-10 V The user can calibrate each analog output zero and span point through the firmware. At least 5% of full-scale over and under range are also supported, but may be overridden in the firmware, if required. Thermo Fisher Scientific Model 5030i SHARP Instruction Manual 8-9 System Description I/O Components The analog outputs may be assigned to any measurement or diagnostic channel with a user-defined range in the units of the selected parameter. The voltage outputs are independent of the current outputs. Analog Current Outputs (Optional) The optional I/O expansion board includes six isolated current outputs. These are firmware configured for any one of the following ranges, while maintaining a minimum resolution of 11 bits: ● 0-20 mA ● 4-20 mA The user can calibrate each analog output zero and span point through the firmware. At least 5% of full-scale over and under range are also supported, but may be overridden in the firmware, if required. The analog outputs may be assigned to any measurement or diagnostic channel with a user-defined range in the units of the selected parameter. The current outputs are independent of the voltage outputs. The current outputs are isolated from the instrument power and ground, but they share a common return line (Isolated GND). Analog Voltage Inputs (Optional) The optional I/O expansion board includes eight analog voltage inputs. These inputs are used to gather measurement data from third-party devices such as meteorological equipment. The user may assign a label, unit, and a conversion table (2 to 10 points). Each point in the conversion table consists of an analog input voltage value (0-10.5 V) and a corresponding user-defined reading value. Only two points are necessary for linear inputs, however, a larger number of points may be used to approximate non-linear inputs. All voltage inputs have a resolution of 12 bits over the range of 0 to 10 volts. Digital Relay Outputs The instrument includes one power fail relay on the motherboard and ten digital output relays on the digital output board. These are reed relays rated for at least 500 mA @ 200 VDC. The power fail relay is Form C (both normally opened and normally closed contacts). All other relays are Form A (normally opened contacts) and are used to provide alarm status and mode information from the analyzer, as well as remote control to other devices, such as for controlling valves during calibration. The user may select what information is sent out from each relay and whether the active state is opened or closed. 8-10 Model 5030i SHARP Instruction Manual Thermo Fisher Scientific System Description I/O Components Digital Inputs Sixteen digital inputs are available, which may be programmed to signal instrument modes and special conditions including: ● Filter tape change ● Turn pump off ● Turn pump on ● Analog outputs to zero ● Analog outputs to full-scale The actual use of these inputs will vary based on analyzer configuration. The digital inputs are TTL level compatible and are pulled up within the analyzer. The active state can be user defined in firmware. Serial Ports Two serial ports allow daisy chaining so that multiple analyzers may be linked using one PC serial port. The standard bi-directional serial interface can be configured for either RS232 or RS-485. The serial baud rate is user selectable in the firmware for standard speeds from 1200 to 115200 baud. The user can also set the data bits, parity, and stop bits. The following protocols are supported: ● C-Link ● MODBUS Slave ● Gesytec (Bayern-Hessen) ● Streaming Data ● ESM The Streaming Data protocol transmits user-selected measurement data via the serial port in real-time for capture by a serial printer, datalogger, or PC. RS-232 Connection A null modem (crossed) cable is required when connecting the analyzer to an IBM-compatible PC. However, a straight cable (one to one) may be required when connecting the analyzer to other remote devices. As a general rule, when the connector of the host remote device is female, a straight cable is required and when the connector is male, a null modem cable is required. Data Format: 1200, 2400, 4800, 9600, 19200, 38400, 57600, or 115200 BAUD Thermo Fisher Scientific Model 5030i SHARP Instruction Manual 8-11 System Description I/O Components 7 or 8 data bits 1 or 2 stop bits No, odd, or even parity All responses are terminated with a carriage return (hex 0D) Refer to Table 8–1 for the DB9 connector pin configuration. Table 8–1. RS-232 DB9 Connector Pin Configuration RS-485 Connection DB9 Pin Function 2 RX 3 TX 7 RTS 8 CTS 5 Ground The instrument uses a four wire RS-485 configuration with automatic flow control (SD). Refer to Table 8–2 for the DB9 connector pin configuration. Table 8–2. RS-485 DB9 Connector Pin Configuration Ethernet Connection DB9 Pin Function 2 + receive 8 - receive 7 + transmit 3 - transmit 5 ground An RJ45 connector is used for the 10Mbs Ethernet connection supporting TCP/IP communications via standard IPV4 addressing. The IP address may be configured for static addressing or dynamic addressing (set using a DHCP server). Any serial port protocols may be accessed over Ethernet in addition to the serial port. Up to three simultaneous connections are allowed per protocol. External Accessory Connector 8-12 Model 5030i SHARP Instruction Manual The external accessory connector is not used in the Model 5030i analyzer. This port is used in other models to communicate with smart external devices that may be mounted hundreds of feet from the analyzer using an RS-485 electrical interface. Thermo Fisher Scientific Chapter 9 Optional Equipment The Model 5030i is available with the following options: ● “Inlet Assemblies” on page 9-1 ● “Sampling Tube Extensions” on page 9-1 ● “I/O Expansion Board Assembly” on page 9-1 ● “25 Pin Terminal Board Assembly” on page 9-1 ● “Terminal Block and Cable Kits” on page 9-2 ● “Cables” on page 9-2 ● “Mounting Options” on page 9-3 ● “Roof Flange Assembly” on page 9-8 Inlet Assemblies The Model 5030i can be used for different applications. Using different inlet configurations (PM10, PM2.5, PM1 Inlets), several particle size fractions can be monitored. The main application is the measurement of PM10 and PM2.5 for ambient air quality monitoring and health effect studies. Sampling Tube Extensions Often the most compatible way to install the Model 5030i at air quality monitoring sites is to collocate the inlet at the same height as other similaruse inlets. The “Installation” chapter discusses specific siting criteria. In addition to using the optional inlets, extending the sample downtube length is necessary using a rigid sample tube. I/O Expansion Board Assembly 25 Pin Terminal Board Assembly Thermo Fisher Scientific The I/O expansion board provides six analog current output channels (020 mA or 4-20 mA) and eight analog voltage inputs (0-10 V). The DB25 connector on the rear panel provides the interface for these inputs and outputs. The 25-pin terminal board assembly is included with the optional I/O expansion board. Refer to “Terminal Board PCB Assemblies” in the “Installation” chapter for information on attaching the cable to the Model 5030i SHARP Instruction Manual 9-1 Optional Equipment Terminal Block and Cable Kits connector board. For associated part numbers, refer to the “Servicing” chapter. Terminal Block and Cable Kits The optional terminal block and cable kits provide a convenient way to connect devices to the instrument. These kits break out the signals on the rear panel connector to individual numbered terminals. Two types of terminal block and cable kits are available. One kit is for the DB37 connectors and can be used for either the analog output connector or the relay output connector. The other kit is for the DB25 connector and can be used for the optional I/O expansion board. For associated part numbers, refer to “External Device Connection Components” on page 7-8. Each kit consists of: ● one six-foot cable ● one terminal block ● one snap track Note Supporting all of the connections on units with the optional I/O expansion board requires: Cables ● two DB37 kits ● one DB25 kit Table 9–1 identifies the optional individual cables that are available for the instrument and Table 9–2 provides the cable color codes. For associated part numbers, refer to “External Device Connection Components” on page 7-8. Note Table 9–2 provides the color coding for both 25-pin cables and 37pin cables. Color codes for pins 1–25 are for 25-pin cables; color codes for pins 1–37 are for 37-pin cables. ▲ Table 9–1. Cable Options 9-2 Model 5030i SHARP Instruction Manual Description Cable Length DB37M to open end Six feet DB37F to open end Six feet DB25M to open end Six feet RS-232 Six feet Thermo Fisher Scientific Optional Equipment Mounting Options Table 9–2. Color Codes for 25-Pin and 37-Pin Cables Mounting Options Pin Color Pin Color 1 BLACK 20 RED/BLACK 2 BROWN 21 ORANGE/BLACK 3 RED 22 YELLOW/BLACK 4 ORANGE 23 GREEN/BLACK 5 YELLOW 24 GRAY/BLACK 6 GREEN 25 PINK/BLACK 7 BLUE End color codes for 25-pin cables continue for 37-pin cables. 8 VIOLET 26 PINK/GREEN 9 GRAY 27 PINK/RED 19 WHITE 28 PINK/VIOLET 11 PINK 29 LIGHT BLUE 12 LIGHT GREEN 30 LIGHT BLUE/BROWN 13 BLACK/WHITE 31 LIGHT BLUE/RED 14 BROWN/WHITE 32 LIGHT BLUE/VIOLET 15 RED/WHITE 33 LIGHT BLUE/BLACK 16 ORANGE/WHITE 34 GRAY/GREEN 17 GREEN/WHITE 35 GRAY/RED 18 BLUE/WHITE 36 GRAY/VIOLET 19 VIOLET/WHITE 37 LIGHT GREEN/BLACK The analyzer can be installed in the configuration described in Table 9–3 and shown in Figure 9–1 through Figure 9–4. Table 9–3. Mounting Options Thermo Fisher Scientific Mounting Type Description Bench Positioned on bench, includes mounting feet and front panel sidetrim handles. EIA rack (top position) Mounted in an EIA-style rack, includes mounting slides and front panel EIA-rack mounting handles. Retrofit rack (top position) Mounted in an EIA-style rack, includes mounting slides and front panel EIA-rack mounting handles. This configuration is intended for direct replacement of a C-series instrument in an existing rack. The rail mounting location is lower on the case and the front mounting screw slots have non-standard EIA locations. Model 5030i SHARP Instruction Manual 9-3 Optional Equipment Mounting Options Figure 9–1. Bench Mounting 9-4 Model 5030i SHARP Instruction Manual Thermo Fisher Scientific Optional Equipment Mounting Options Figure 9–2. EIA Rack Mounting Thermo Fisher Scientific Model 5030i SHARP Instruction Manual 9-5 Optional Equipment Mounting Options Figure 9–3. Retrofit Rack Mounting 9-6 Model 5030i SHARP Instruction Manual Thermo Fisher Scientific Optional Equipment Mounting Options Figure 9–4. Rack Mount Option Assembly Thermo Fisher Scientific Model 5030i SHARP Instruction Manual 9-7 Optional Equipment Roof Flange Assembly Roof Flange Assembly An optional roof flange assembly can be used with flat roof applications, as shown in Figure 9–5. This roof flange assembly uses 3” PVC tubing, fittings and roof flange with gasketing. The installer must assure a water tight installation when using a flange of this design. A 2-1/2” circular hole should be drilled through the roofline of the the enclosure, or building, if it has a flat roof. The roof surface should be clean and swept of all debris. The flange should be centered over the hole that has been drilled. A generous bead of RTV or silicone sealent should be applied to the circumfernce of the ponts shown in Figure 9–5. Figure 9–5. Roof Flange Assembly 9-8 Model 5030i SHARP Instruction Manual Thermo Fisher Scientific Optional Equipment Roof Flange Assembly The flange design also has four holes that can be used to secure the flange to the roof surface by the use of carriage bolts, washers and nuts. The length of the carriage bolts depends on the thickness of the roofline. Figure 9–6 shows a picture of the roof flange that is used with this assembly. Figure 9–6. Securing the Roof Flange Thermo Fisher Scientific Model 5030i SHARP Instruction Manual 9-9 Chapter 10 Model 5014i to 5030i Upgrade Procedures This chapter describes the 5014i to 5030i upgrade procedures. For details, see the following topics: Instrument Preparation ● “Instrument Preparation” on page 10-1 ● “SHARP Connection Bracket Assembly Installation” on page 10-2 ● “Radius Tube Adapter Installation” on page 10-5 ● “SHARP External Valve Installation” on page 10-7 ● “SHARP Optics Assembly Installation” on page 10-9 ● “Upgrade of the Heater Tube Assembly” on page 10-10 ● “Model Label Change” on page 10-11 ● “Power On Instrument” on page 10-11 Use the following procedure to prepare the instrument. 1. If upgrading at an installed site, take the appropriate measures to secure the sample downtube and remove the instrument heater assembly and set aside. 2. From Instrument Panel, select Main Menu, select Instrument Controls and then Service Mode. Toggle to “Service Mode On”. 3. From Instrument Panel, select Filter Tape, and then Manual, and select the BENCH to open. 4. From Instrument Panel, select Diagnostics, Instrument Configuration, and change the DETECTOR configuration from BETA to SHARP. 5. Turn instrument power off with the measurement head in the open position. Thermo Fisher Scientific Model 5030i SHARP Instruction Manual 10-1 Model 5014i to 5030i Upgrade Procedures SHARP Connection Bracket Assembly Installation 6. Unplug instrument from AC power source. INSTRUMENT CONFIGURATION: >I/O EXPANSION BOARD YES DETECTOR BETA DETECTOR B NONE §¨ CHANGE VALUE RANGE SHARP Connection Bracket Assembly Installation AVG SAVE DIAGS ALARM Use the following procedure for SHARP connection bracket assembly installation. 1. Locate the Connection Bracket (Figure 10–1) and remove two screws and set aside. 4-pin SHARP Connector 2-pin connector not used Figure 10–1. SHARP Optics Connection Bracket 2. Remove both sides of the Cover. Remove the tape pick up spool (Figure 10–2) by removing the thumb screw, washer, filter tape, spacers, o-rings and rear filter support guide plate. 10-2 Model 5030i SHARP Instruction Manual Thermo Fisher Scientific Model 5014i to 5030i Upgrade Procedures SHARP Connection Bracket Assembly Installation STEPS See Note 5 1 2 3 4 5 = = = = = UNFASTEN THUMB NUT SLIDE TAPE PICKUP SPOOL OFF SLIDE TAPE ASSEMBLY OUT TO GAIN ACCESS TO SCREW AREA (4) FASTEN 2X SCREWS TO CONNECTION BRACKET THRU WALL PLATE MAKE SURE CONNECTOR ORIENTATION CLOSER TO THIS EDGE 4 3 1 2 Figure 10–2. Tape Pick-up Spool Removal 3. Remove the two Philips screws from the connection bracket and align the bracket onto the wall plate, as shown above in Step 4, and insert the two screws through the wall plate and tighten. 4. Reinstall the tape pickup spool in the reverse order of removal in Step 2 by sliding all the spacers, O-rings and rear support guide plate into its original assembly order. 5. Install the filter tape following the filter tape path shown in Figure 10– 3. Use adhesive tape to adhere the filter tape to the take up spool and wind the tape over itself at least once. Thermo Fisher Scientific Model 5030i SHARP Instruction Manual 10-3 Model 5014i to 5030i Upgrade Procedures SHARP Connection Bracket Assembly Installation Figure 10–3. Filter Tape Installation Pathway 6. Complete the installation of the SHARP Optics Connection Bracket by connecting the 4-pin connector to the “SHARP 1” connector on the measurement interface board as shown below in Figure 10–4. Note It should not be necessary to remove the electronics from the instrument case to achieve this connection and the spare 2-pin connector is not used. ▲ 10-4 Model 5030i SHARP Instruction Manual Thermo Fisher Scientific Model 5014i to 5030i Upgrade Procedures Radius Tube Adapter Installation CONNECT TO SHARP 1 2-PIN IS NOT USED Figure 10–4. Connecting Connection Bracket Wiring to Measurement Interface Board Radius Tube Adapter Installation Use the following procedure for radius tube adapter installation. 1. Loosen the Radius Tube Mounting bracket screws. 2. Slide back bracket downwards. 3. Slowly remove the existing Radius Face Seal by pulling straight up with a twisting action. 4. Slowly insert the Radius Tube Adapter onto the Radius Tube and push down with a slight twist until it is seated. 5. Tighten the radius tube mounting bracket screws as shown in Figure 10–5. Thermo Fisher Scientific Model 5030i SHARP Instruction Manual 10-5 Model 5014i to 5030i Upgrade Procedures Radius Tube Adapter Installation 1 = UNFASTEN 2 SCREWS & REMOVE BRACKET 2 = SLIDE BACK BRACKET DOWNWARDS 3 = WITH TWISTING MOTION REMOVE THE EXISTING THREADED FACE SEAL AND USE SAME MOTION TO INSTALL RADIUS TUBE ADAPTER 3 2 1 Figure 10–5. Radius Tube Adapter Install 6. Reassemble the two covers of the instrument in reverse order and check alignment of radius tube adapter through the hole in the cover as shown in Figure 10–6. Be sure to remove the old dust cover cap and the large plastic hole cover. Figure 10–6. Radius Tube Adapter Alignment Check 10-6 Model 5030i SHARP Instruction Manual Thermo Fisher Scientific Model 5014i to 5030i Upgrade Procedures SHARP External Valve Installation SHARP External Valve Installation Use the following procedure for SHARP external valve installation. 1. Attach the SHARP External Valve Assembly (which includes the to the Rear Panel using the captive hardware on bracket and attach the 3-pin connector to the rear panel labeled valve (Figure 10–7). Port 1 Port 2 Figure 10–7. Rear Valve Assembly Installation 2. Follow the following plumbing procedure in accordance with Figure 10–8 below. a. Attach the 3/8” vacuum tubing between pump intake and the vacuum port on rear panel and include the push-to-connect “T” fitting with the 0.040” thru-hole on the T-side in this line. b. From the valve assembly that is now attached to the rear panel, connect the threaded fitting to the pump exhaust. Thermo Fisher Scientific Model 5030i SHARP Instruction Manual 10-7 Model 5014i to 5030i Upgrade Procedures SHARP External Valve Installation c. Connect the 3/8” tubing with inline HEPA filter to the available port (Port #1) on the external valve assembly using the available push connect fitting. Note This step can also be delayed until after the zero air delivery tube and T-fitting are installed at the sample intake. ▲ d. At the sample inlet, attach the stainless steel T-fitting to the sample downtube and tighten the swagelok fitting with Teflon ferrules— do not overtighten these ferrules. e. Snake the green vacuum tubing downwards towards the rear valve assembly and attach to Port #1 of the valve. If this is a field installation, proper water sealants should be used to avoid any leakage into the instrument. Figure 10–8. Plumbing Diagram 10-8 Model 5030i SHARP Instruction Manual Thermo Fisher Scientific Model 5014i to 5030i Upgrade Procedures SHARP Optics Assembly Installation SHARP Optics Assembly Installation Use the following procedure for SHARP external valve installation. 1. Remove the SHARP Optics Assembly port protection caps and plugs. 2. Align the radius tube adapter with the open port on the bottom of the optics assembly as per Figure 10–9 and gently push down and then screw down the two tabs using the captive hardware. Figure 10–9. Optics Installation 3. Connect the cable assembly from the rear panel of the Optical assembly and secure it to the optics connector that was installed in Step 3 of this procedure and as shown in Figure 10–10. Figure 10–10. Connecting the Optics to the Optics Connector Thermo Fisher Scientific Model 5030i SHARP Instruction Manual 10-9 Model 5014i to 5030i Upgrade Procedures Upgrade of the Heater Tube Assembly Upgrade of the Heater Tube Assembly Use the following procedure for upgrade of the heater tube assembly. 1. The heater assembly needs to be revised for the 5030i SHARP to include a ferrite bead and a small faraday cage. The four steps shown below in Figure 10–11 and Figure 10–12 should be used to modify the heater assembly. Note The sample downtube should be slightly loose at the roof line to allow vertical play while working on this assembly. If the tubing height has changed and needs to be cut back, please cut and clean the tubing before attaching to the optical assembly. ▲ Collar 1 2 3 4 1) Remove existing stainless knurled nut from heater assembly 2) Install black plastic knurled nut on top of optical assembly and tighten firmly; and slide ferrite bead around short stainless tube. 3) Slide black housing over both ferrite bead and black plastic nut and attach the two captive screws to the top of the optical assembly. 4) Tighten both hex screws to close collar. 5) Connect the heater tube assembly to the top of the stainless tube and tighten the Teflon ferrule swage fitting.. Figure 10–11. Upgrading 5030i Heater Assembly 10-10 Model 5030i SHARP Instruction Manual Thermo Fisher Scientific Model 5014i to 5030i Upgrade Procedures Model Label Change Figure 10–12. Connecting Heater to Optics Assembly Cover Model Label Change Use the following procedure for model label change. 1. Remove the 5014i label and replace with the new 5030i SHARP Label on the front panel Front Panel in accordance with Figure 10–13 below. Figure 10–13. Front Panel Label Replacement Power On Instrument Thermo Fisher Scientific Upgrade is complete. Model 5030i SHARP Instruction Manual 10-11 Appendix A Warranty Warranty Seller warrants that the Products will operate or perform substantially in conformance with Seller's published specifications and be free from defects in material and workmanship, when subjected to normal, proper and intended usage by properly trained personnel, for the period of time set forth in the product documentation, published specifications or package inserts. If a period of time is not specified in Seller’s product documentation, published specifications or package inserts, the warranty period shall be one (1) year from the date of shipment to Buyer for equipment and ninety (90) days for all other products (the "Warranty Period"). Seller agrees during the Warranty Period, to repair or replace, at Seller's option, defective Products so as to cause the same to operate in substantial conformance with said published specifications; provided that (a) Buyer shall promptly notify Seller in writing upon the discovery of any defect, which notice shall include the product model and serial number (if applicable) and details of the warranty claim; (b) after Seller’s review, Seller will provide Buyer with service data and/or a Return Material Authorization (“RMA”), which may include biohazard decontamination procedures and other product-specific handling instructions; and (c) then, if applicable, Buyer may return the defective Products to Seller with all costs prepaid by Buyer. Replacement parts may be new or refurbished, at the election of Seller. All replaced parts shall become the property of Seller. Shipment to Buyer of repaired or replacement Products shall be made in accordance with the Delivery provisions of the Seller’s Terms and Conditions of Sale. Consumables, including but not limited to lamps, fuses, batteries, bulbs and other such expendable items, are expressly excluded from the warranty under this warranty. Notwithstanding the foregoing, Products supplied by Seller that are obtained by Seller from an original manufacturer or third party supplier are not warranted by Seller, but Seller agrees to assign to Buyer any warranty rights in such Product that Seller may have from the original manufacturer or third party supplier, to the extent such assignment is allowed by such original manufacturer or third party supplier. In no event shall Seller have any obligation to make repairs, replacements or corrections required, in whole or in part, as the result of (i) normal wear and tear, (ii) accident, disaster or event of force majeure, (iii) misuse, fault or negligence of or by Buyer, (iv) use of the Products in a manner for which Thermo Fisher Scientific Model 5030i SHARP Instruction Manual A-1 Warranty Warranty they were not designed, (v) causes external to the Products such as, but not limited to, power failure or electrical power surges, (vi) improper storage and handling of the Products or (vii) use of the Products in combination with equipment or software not supplied by Seller. If Seller determines that Products for which Buyer has requested warranty services are not covered by the warranty hereunder, Buyer shall pay or reimburse Seller for all costs of investigating and responding to such request at Seller's then prevailing time and materials rates. If Seller provides repair services or replacement parts that are not covered by the warranty provided in this warranty, Buyer shall pay Seller therefor at Seller's then prevailing time and materials rates. ANY INSTALLATION, MAINTENANCE, REPAIR, SERVICE, RELOCATION OR ALTERATION TO OR OF, OR OTHER TAMPERING WITH, THE PRODUCTS PERFORMED BY ANY PERSON OR ENTITY OTHER THAN SELLER WITHOUT SELLER'S PRIOR WRITTEN APPROVAL, OR ANY USE OF REPLACEMENT PARTS NOT SUPPLIED BY SELLER, SHALL IMMEDIATELY VOID AND CANCEL ALL WARRANTIES WITH RESPECT TO THE AFFECTED PRODUCTS. THE OBLIGATIONS CREATED BY THIS WARRANTY STATEMENT TO REPAIR OR REPLACE A DEFECTIVE PRODUCT SHALL BE THE SOLE REMEDY OF BUYER IN THE EVENT OF A DEFECTIVE PRODUCT. EXCEPT AS EXPRESSLY PROVIDED IN THIS WARRANTY STATEMENT, SELLER DISCLAIMS ALL OTHER WARRANTIES, WHETHER EXPRESS OR IMPLIED, ORAL OR WRITTEN, WITH RESPECT TO THE PRODUCTS, INCLUDING WITHOUT LIMITATION ALL IMPLIED WARRANTIES OF MERCHANTABILITY OR FITNESS FOR ANY PARTICULAR PURPOSE. SELLER DOES NOT WARRANT THAT THE PRODUCTS ARE ERROR-FREE OR WILL ACCOMPLISH ANY PARTICULAR RESULT. A-2 Model 5030i SHARP Instruction Manual Thermo Fisher Scientific Appendix B C-Link Protocol Commands This appendix provides a description of the C-Link protocol commands that can be used to remotely control a Model 5030i analyzer using a host device such as a PC or a datalogger. C-Link protocol may be used over RS232, RS-485, or Ethernet. C-Link functions can be accessed over Ethernet using TCP port 9880. Streaming data is sent out the serial port or the Ethernet port on a userdefined periodic basis. Streaming data over Ethernet is only generated when a connection is made on TCP port 9881. Up to three simultaneous connections per protocol may be made over Ethernet. For details, see the following topics: Instrument Identification Number Thermo Fisher Scientific ● “Instrument Identification Number” on page B-1 ● “Commands” on page B-2 ● “Measurements” on page B-11 ● “Alarms” on page B-14 ● “Diagnostics” on page B-23 ● “Datalogging” on page B-27 ● “Calibration” on page B-34 ● “Keys/Display” on page B-44 ● “Measurement Configuration” on page B-45 ● “Hardware Configuration” on page B-51 ● “Communications Configuration” on page B-54 ● “I/O Configuration” on page B-61 ● “Record Layout Definition” on page B-66 Each command sent to the analyzer over the serial port must begin with the American Standard Code for Information Interchange (ASCII) symbol or byte value equivalent to the instrument’s identification number plus 128. Model 5030i SHARP Instruction Manual B-1 C-Link Protocol Commands Commands For example, if the instrument ID is set to 25, then each command must begin with the ACSII character code 153 decimal. The analyzer ignores any command that does not begin with its instrument identification number. If the instrument ID is set to 0, then this byte is not required. For more information on changing Instrument ID, see Chapter 3, “Operation”. Commands The analyzer must be in the remote mode and service mode not active in order to change instrument parameters remotely. However, the command “set mode remote” can be sent to the analyzer to put it in the remote mode. Report commands (commands that don’t begin with “set”) can be issued either in the remote or local mode, regardless of the service mode setting. For information on changing modes, see Chapter 3, “Operation”. The commands are not case sensitive. Each command must begin with the proper instrument identification number (ASCII) character. The command in the following example begins with the ASCII character code 153 decimal, which directs the command to the Model 5030i, and is terminated by a carriage return “CR” (ASCII character code 13 decimal). <ASCII 153> T I M E <CR> Many of the commands have two forms. One form reads parameter from the instrument’s memory, and the other writes, or updates, a parameter. The syntax for a write command adds the word “set” in front of the command and provides an argument. Command responses are generally echoed with a data element appended. Note If the Service Mode is active, C-Link “set” commands are not allowed. This is to prevent parameters from being changed remotely while the unit is being serviced locally. ▲ If an incorrect command is sent, an error message is generated. The list of error responses is shown in Table B–1. The following example sends the incorrect command “set unit mg/m3” instead of the correct command “set conc unit mg/m3.” Send: Receive: B-2 Model 5030i SHARP Instruction Manual set unit mg/m3 set unit mg/m3 bad cmd Thermo Fisher Scientific C-Link Protocol Commands Commands Table B–1. Error Response Messages Command Response Description bad cmd Command is not recognized too high Supplied value is higher than the upper limit too low Supplied value is lower than the lower limit invalid string Supplied string invalid (typically because a letter was detected when the value should be numeric) data not valid Supplied value is not acceptable for entered command can’t, wrong settings Command not allowed for current measurement mode can’t, mode is service Command not allowed while instrument is in service mode feature not enabled I/O expansion board is not detected flags no alarm active No measurement alarms are active The “save” and “set save params” commands (duplicated for backward compatibility) store parameters in FLASH memory. It is important that this command be sent each time instrument parameters are changed. If changes are not saved, they will be lost in the event of a power failure. Commands List Table B–2 lists the 5030i C-Link protocol commands. The interface will respond to the command strings outlined below. Table B–2. C-Link Protocol Commands Thermo Fisher Scientific Command Description Page 1 Simulates pressing soft key 1 pushbutton B-44 2 Simulates pressing soft key 2 pushbutton B-44 3 Simulates pressing soft key 3 pushbutton B-44 4 Simulates pressing soft key 4 pushbutton B-44 addr dns Reports/sets domain name server address for Ethernet port B-54 addr gw Reports/sets default gateway address for Ethernet port B-54 addr ip Reports/sets IP address for Ethernet port B-54 addr nm Reports/sets netmask address for Ethernet port B-55 addr ntp Reports/sets IP address for network time protocol server B-55 alarm alpha count max Reports alpha count alarm maximum value B-14 alarm alpha count min Reports alpha count alarm minimum value B-14 alarm amb rh max Reports/sets ambient relative humidity alarm maximum value B-14 Model 5030i SHARP Instruction Manual B-3 C-Link Protocol Commands Commands B-4 Model 5030i SHARP Instruction Manual Command Description Page alarm amb rh min Reports/sets ambient relative humidity alarm minimum value B-14 alarm amb temp max Reports/sets ambient temperature alarm maximum value B-15 alarm amb temp min Reports/sets ambient temperature alarm minimum value B-15 alarm baro pres max Reports/sets barometric pressure alarm maximum value B-15 alarm baro pres min Reports/sets barometric pressure alarm minimum value B-15 alarm bench status Reports the bench status B-15 alarm beta count max Reports beta count alarm maximum value B-15 alarm beta count min Reports beta count alarm minimum value B-15 alarm board temp max Reports/sets board temperature alarm maximum value B-16 alarm board temp min Reports/sets board temperature alarm minimum value B-16 alarm conc avg neph max Reports/sets average nephelometer concentration alarm maximum value B-16 alarm conc avg neph min Reports/sets average nephelometer concentration alarm minimum value B-16 alarm conc avg pm max Reports/sets average PM concentration alarm maximum value B-17 alarm conc avg pm min Reports/sets average PM concentration alarm minimum value B-17 alarm conc avg sharp max Reports/sets average SHARP concentration alarm maximum value B-17 alarm conc avg sharp min Reports/sets average SHARP concentration alarm minimum value B-17 alarm conc inst neph max Reports/sets instant nephelometer concentration alarm maximum value B-17 alarm conc inst neph min Reports/sets instant nephelometer concentration alarm minimum value B-17 alarm conc inst pm max Reports/sets instant PM concentration alarm maximum value B-18 alarm conc inst pm min Reports/sets instant PM concentration alarm minimum value B-18 alarm conc inst sharp max Reports/sets instant sharp concentration alarm maximum value B-18 alarm conc inst sharp min Reports/sets instant sharp concentration alarm minimum value B-18 Thermo Fisher Scientific C-Link Protocol Commands Commands Thermo Fisher Scientific Command Description Page alarm filter tape status Reports the filter tape status B-19 alarm flow max Reports/sets flow alarm maximum value B-19 alarm flow min Reports/sets flow alarm minimum value B-19 alarm flow pres max Reports/sets flow pressure alarm maximum value B-19 alarm flow pres min Reports/sets flow pressure alarm minimum value B-19 alarm flow temp max Reports/sets flow temperature alarm maximum value B-20 alarm flow temp min Reports/sets flow temperature alarm minimum value B-20 alarm ib status Reports the interface board status B-20 alarm io status Reports the I/O expansion board status B-20 alarm mb status Reports the motherboard status B-20 alarm nb status Reports the status of the nephelometer interface board B-20 alarm ncal status Reports the status of the last nephelometer auto-zero calibration B-21 alarm neph led cur max Reports/sets current nephelometer LED alarm maximum value B-21 alarm neph led cur min Reports/sets current nephelometer LED alarm minimum value B-21 alarm neph rh max Reports/sets nephelometer relative humidity alarm maximum value B-21 alarm neph rh min Reports/sets nephelometer relative humidity alarm minimum value B-21 alarm neph temp max Reports/sets nephelometer temperature alarm maximum value B-22 alarm neph temp min Reports/sets nephelometer temperature alarm minimum value B-22 alarm sample rh max Reports/sets sample relative humidity alarm maximum value B-22 alarm sample rh min Reports/sets sample relative humidity alarm minimum value B-22 alarm status det Reports the detector status B-22 alarm tape counter max Reports/sets tape counter alarm maximum value B-23 alarm vac pres max Reports/sets vacuum pressure alarm maximum value B-23 alarm vac pres min Reports/sets vacuum pressure alarm minimum value B-23 allow mode cmd Reports/sets the current “set” allow mode command B-55 Model 5030i SHARP Instruction Manual B-5 C-Link Protocol Commands Commands B-6 Model 5030i SHARP Instruction Manual Command Description Page alpha eff Reports/sets the current value of alpha efficiency for the detector B-34 alpha th Reports/sets the current value of alpha threshold for the detector B-34 amb rh Reports the ambient relative humidity B-23 amb rh offset Reports/sets the current ambient relative humidity offset B-35 amb temp Reports the current ambient temperature B-23 amb temp offset Reports/sets the current ambient temperature offset B-35 analog iout range Reports/sets analog current output range per channel B-61 analog vin Retrieves analog voltage input data per channel B-61 analog vout range Reports/sets analog voltage output range per channel B-61 avg24 time Reports/sets 24-hour averaging time to start averaging the concentration B-11 baro mass coef Reports/sets the current barometric mass coefficient B-35 baro pres Reports the current barometric pressure B-24 baro span Reports/sets the current barometric pressure span B-36 baud Reports/sets current baud rate B-56 beta th Reports/sets the current reference beta threshold for the detector B-36 bkg pm Reports/sets current PM background B-36 bkg sharp Reports/sets current SHARP background B-37 board temp Reports the current board temperature B-24 cal baro pres span Automatically calculates the span coefficient B-37 cal flow pres span Automatically sets the flow pressure span B-37 cal flow span Automatically sets the flow span B-37 cal vac flow offset Automatically triggers the filter change and sets the vacuum and flow offset B-38 cal vac pres span Automatically sets the vacuum pressure span B-38 clr lrecs Clears away only lrecs that have been saved B-27 clr records Clears away all logging records that have been saved B-27 clr srecs Clears away only srecs that have been saved B-27 coef pm Reports/sets current PM coefficient B-39 coef sharp Reports/sets current SHARP coefficient B-38 conc unit Reports/sets current concentration units B-45 contrast Reports/sets current screen contrast B-51 Thermo Fisher Scientific C-Link Protocol Commands Commands Thermo Fisher Scientific Command Description Page copy lrec to sp Sets/copies current lrec selection into the scratch pad B-28 copy sp to lrec Sets/copies current selections in scratch pad into lrec list B-27 copy sp to srec Sets/copies current selections in scratch pad into srec list B-27 copy sp to stream Sets/copies current selections in scratch pad into stream list B-27 copy srec to sp Sets/copies current srec selection into the scratch pad B-28 copy stream to sp Sets/copies current streaming data selection into the scratch pad B-28 crn Reports the current radon concentration B-24 custom Reports/sets defined custom range concentration B-46 data treatment lrec Reports/sets data treatment for concentration values in lrecs B-28 data treatment srec Reports/sets data treatment for concentration values in srecs B-28 date Reports/sets current date B-52 default params Sets parameters to default values B-52 det Reports/sets the status of the detector board B-53 det status Reports the current mass for the detector B-24 dhcp Reports/sets state of use of Dynamic Host Configuration Protocol (DHCP) B-57 diag volt det Reports diagnostic voltage levels on the detector board B-24 diag volt iob Reports diagnostic voltage levels on the I/O expansion board B-24 diag volt mb Reports diagnostic voltage levels on the motherboard B-24 diag volt mib Reports diagnostic voltage levels on the measurement interface board B-25 diag volt neph Reports diagnostic voltage levels on the nephelometer interface board B-25 dig in Reports status of the digital inputs B-62 din Reports/sets digital input channel and active state B-62 do (down) Simulates pressing down pushbutton B-44 dout Reports/sets digital output channel and active state B-63 dtoa Reports outputs of the digital to analog converters per channel B-63 en (enter) Simulates pressing enter pushbutton B-44 er Returns a brief description of the main operating conditions in the format specified in the commands B-28 erec Returns a snapshot of the main operating conditions (measurements and status) in the specified format B-28 erec format Reports/sets erec format B-30 Model 5030i SHARP Instruction Manual B-7 C-Link Protocol Commands Commands B-8 Model 5030i SHARP Instruction Manual Command Description Page erec layout Reports current layout of erec data B-31 filter period Reports/sets the number of hours to be added to filter next time for the filter tape change B-46 filter time Reports/sets the next date and time of the filter tape change B-47 flags Reports current active measurement status flags in HEX B-12 flow Reports the current sample flow B-25 flow pres Reports the current flow pressure B-25 flow pres span Reports/sets the flow pressure span B-39 flow pres offset Reports the flow pressure offset B-39 flow span Reports/sets the current flow span B-39 flow target Reports/sets the current flow B-47 flow temp Reports the current flow temperature B-25 flow temp offset Reports/sets offset for flow temperature B-39 format Reports/sets current reply termination format B-57 he (help) Simulates pressing help pushbutton B-44 high volt Reports/sets the current high voltage for the detector B-40 host name Reports/sets host name string B-58 ht control Reports/sets the current status of the heater B-47 instr name Reports instrument name B-58 instrument id Reports/sets instrument id B-58 int time Reports/sets mass and concentration integration time B-48 io bd Reports/sets the presense of the I/O expansion board B-25 isc (iscreen) Retrieves framebuffer data used for the display B-44 layout ack Reports/disables stale layout/layout changed indicator (‘*’) B-59 le (left) Simulates pressing left pushbutton B-44 list din Lists current selection for digital inputs B-64 list dout Lists current selection for digital outputs B-64 list lrec Lists current selection lrec logging data B-29 list sp Lists current selection in the scratchpad list B-29 list srec Lists current selection srec logging data B-29 list stream Lists current selection streaming data output B-29 list var aout Reports list of analog output, index numbers, and variables B-64 list var din Reports list of digital input, index numbers, and variables B-64 list var dout Reports list of digital output, index numbers, and variables B-64 Thermo Fisher Scientific C-Link Protocol Commands Commands Thermo Fisher Scientific Command Description Page list var log Reports a list of datalogging index numbers and variables B-64 lr Reports the last lrec stored B-29 lrec Reports maximum number of lrecs B-29 lrec format Reports/sets output format for lrecs (ASCII or binary) B-30 lrec layout Reports current layout of lrec data B-31 lrec mem size Reports maximum number of lrecs that can be stored B-31 lrec per Reports/sets lrec logging period B-31 malloc lrec Reports/sets memory allocation for lrecs B-32 malloc srec Reports/sets memory allocation for srecs B-32 mass Reports the presence of mass B-26 mass coef Reports/sets the current mass coefficient B-40 mass limit Reports/sets the current filter mass limit B-48 me (menu) Simulates pressing menu pushbutton B-44 neph Reports the 1-minute running average nephelometer concentration B-12 neph 24avg Reports the last calculated 24-hour average nephelometer concentration B-12 neph bkg Reports the current nephelometer background B-26 neph cal bkg Sets the nephelometer into an auto-zero calibration routine B-41 neph coef Reports/sets the nephelometer span coefficient B-41 neph led current Reports the nephelometer LED current B-13 neph mode Reports the current operating mode of the nephelometer B-26 neph prev bkg Reports the previous nephelometer background B-26 neph raw Reports the raw, unaveraged, nephelometer concentration B-13 neph ref det Reports the nephelometer reference detector voltage B-13 neph reset bkg Resets measured background to zero B-41 neph restore bkg Restores background to the previous background values B-42 neph rh Reports the nephelometer relative humidity B-13 neph rh offset Reports/sets the nephelometer relative humidity sensor offset B-42 neph src level Reports the nephelometer source level B-42 neph temp Reports the nephelometer temperature sensor B-13 neph temp offset Reports/sets the nephelometer temperature sensor offset B-42 neph thermal coef Reports/sets the nephelometer thermal coefficient B-43 no of lrec Reports number of lrecs stored in memory B-32 Model 5030i SHARP Instruction Manual B-9 C-Link Protocol Commands Commands B-10 Model 5030i SHARP Instruction Manual Command Description Page no or srec Reports number of srecs stored in memory B-32 pm Reports the measured PM concentration B-13 pm 24avg Reports the 24-hour average PM concentration B-13 power up mode Reports/sets the power up mode as local or remote B-59 pres comp Reports/sets pressure compensation to actual or standard B-48 pres std Reports/sets the standard pressure B-49 program no Reports analyzer program number B-60 pump Reports/sets pump on or off B-53 push Simulates pressing a key on the front panel B-44 range Reports/sets current PM range B-49 relay Sets relay logic status for the designated relay(s) B-65 relay stat Reports relay logic status for all relay(s) B-65 reset tape counter Resets the tape count to zero B-26 rh th Reports/sets the current relative humidity threshold for the detector B-50 ri (right) Simulates pressing right pushbutton B-44 ru (run) Simulates pressing run pushbutton B-44 sample rh Reports the sample relative humidity B-26 save Stores parameters in FLASH B-53 save params Stores parameters in FLASH B-53 sc (screen) C-series legacy command that reports a generic response (Use iscreen instead) B-45 sharp Reports the 1-minute running average SHARP monitor concentration B-14 sharp24avg Reads the last calculated 24-hour average SHARP monitor concentration B-14 sp field Reports/sets item number and name in scratch pad list B-33 sr Reports the last srec stored B-29 srec Reports maximum number of srecs B-29 srec format Reports/sets output format for srecs (ASCII or binary) B-30 srec layout Reports current layout of srec data B-31 srec mem size Reports maximum number of srecs that can be stored B-31 srec per Reports/sets srec logging period B-31 stream per Reports/sets current time interval for streaming data B-33 stream time Reports/sets a time stamp to streaming data or not B-34 Thermo Fisher Scientific C-Link Protocol Commands Measurements Measurements Command Description Page tape counter Reports the number of counts corresponding to the filter tape movement B-27 tape to ncal ratio Reports/sets the ratio of filter tape changes per nephelometer auto-zero B-43 temp comp Reports/sets temperature compensation to actual or standard B-50 temp std Reports/sets the standard temperature B-50 temp th Reports/sets the temperature threshold for the detector B-51 thermal mass coef Reports/sets the current thermal mass coefficient B-40 time Reports/sets current time (24-hour format) B-53 tz Reports/sets the timezone string for the NTP server B-60 up Simulates pressing up pushbutton B-44 vac mass coef Reports/sets the current vacuum mass coefficient B-41 vac pres Reports the current vacuum pressure B-27 vac pres span Reports/sets the vacuum pressure span B-43 vac pres offset Reports the vacuum pressure offset B-44 vf pres cal def Sets vacuum and flow pressure calibration defaults B-44 avg24 time This command reports the 24-hour averaging time in hours and minutes. The following example shows that the averaging time is set to 18:30. Send: Receive: avg24 time avg24 time 18:30 set avg24 time hh:mm hh = hours (01 to 23) mm = minutes (01 to 59) This command sets the 24-hour averaging time to start averaging the concentration from hh:mm until next 24 hours. It is then set to next 24 hours automatically. The following example sets the 24-hour averaging time to 17:50. Send: Receive: Thermo Fisher Scientific set avg24 time 17:50 set avg24 time 17:50 ok Model 5030i SHARP Instruction Manual B-11 C-Link Protocol Commands Measurements flags This reports 8 hexadecimal digits (or flags) that represent the status of the mode, pressure and temperature compensation status, concentration units, concentration modes and alarms. To decode the flags, each hexadecimal digit is converted to binary as shown in the Figure B–1. It is the binary digits that define the status of each parameter. Send: Receive: flags flags 00000000 Figure B–1. Flags Field neph This command reports the 1-minute running average nephelometer concentration. The following example reports the 1-minute running average value. Send: Receive: neph neph 1.405E+01 μg/m3 neph 24avg This command reports the last calculated 24-hour average nephelometer concentration (which defaults to 9,999 μg/m3 if 24 hours has not passed). B-12 Model 5030i SHARP Instruction Manual Thermo Fisher Scientific C-Link Protocol Commands Measurements Send: Receive: neph 24avg neph 24avg 9.999E+03 μg/m3 neph led current This command reports the nephelometer LED current. The following example shows that the LED current is 65.7 mA. Send: Receive: neph led current neph led current 65.7 mA neph raw This command reports the raw, unaveraged, nephelometer concentration. The following example reports the raw, unaveraged concentration value. Send: Receive: neph raw neph raw 1.331E+01 μg/m3 neph ref det This command reports the nephelometer reference detector voltage. The following example reports that the reference detector voltage is 1096 mV. Send: Receive: neph ref det neph ref det 1096 mV neph rh This command reports the nephelometer relative humidity. The following example reports that the relative humidity is 27.2%. Send: Receive: neph rh neph rh 27.2 % neph temp This command reports the nephelometer temperature sensor. The following example reports that the temperature sensor is 27.2 °C. Send: Receive: neph temp neph temp 27.2 degC pm This command reports the measured PM concentration. The following example reports that the PM concentration is 14.1 mg/m3. Send: Receive: pm pm 1.410E+01 mg/m3 pm 24avg This command reports the 24 hour averaging PM concentration. The following example reports the 24 hour PM concentration value. Thermo Fisher Scientific Model 5030i SHARP Instruction Manual B-13 C-Link Protocol Commands Alarms Send: Receive: pm 24avg pm 24avg 10.000E+00 ug/m3 sharp This command reports the 1-minute running average SHARP concentration. The following example reports the 1-minute running average value. Send: Receive: sharp sharp 1.187E+01 μg/m3 sharp 24avg This command reports the last calculated 24-hour average SHARP concentration (which defaults to 9,999 μg/m3 if 24 hours has not passed). Send: Receive: Alarms sharp 24avg sharp 24avg 9.999E+03 μg/m3 alarm alpha count min alarm alpha count max These commands report the current alpha count alarm minimum and maximum value settings. The following example reports that the alpha count alarm minimum value is 200. Send: Receive: alarm alpha count min alarm alpha count min 200 alarm amb rh min alarm amb rh max These commands report the current ambient relative humidity alarm minimum and maximum value settings. The following example reports the ambient relative humidity alarm minimum value is 35.0%. Send: Receive: alarm amb rh min alarm amb rh min 35.0 % set alarm amb rh min value set alarm amb rh max value These commands set the ambient relative humidity alarm minimum and maximum values to value, where value is a floating-point number representing ambient relative humidity alarm limits in percent. The following example sets the ambient relative humidity alarm maximum value to 55%. Send: Receive: B-14 Model 5030i SHARP Instruction Manual set alarm amb rh max 55 set alarm amb rh max 55 ok Thermo Fisher Scientific C-Link Protocol Commands Alarms alarm amb temp min alarm amb temp max These commands report the current ambient temperature alarm minimum and maximum value settings. The following example reports that the ambient temperature alarm minimum value is 4.0 °C. Send: Receive: alarm amb temp min alarm amb temp min 4.0 degC set alarm amb temp min value set alarm amb temp max value These commands set the ambient temperature alarm minimum and maximum values to value, where value is a floating-point number representing ambient temperature alarm limits in °C. The following example sets the ambient temperature alarm maximum value to 38 °C. Send: Receive: set alarm amb temp max 38 set alarm amb temp max 38 ok alarm baro pres min alarm baro pres max These commands report the current barometric pressure alarm minimum and maximum value settings. The following example reports that the barometric pressure alarm minimum value is 500.0 mmHg. Send: Receive: alarm baro pres min alarm baro pres min 500.0 mmHg set alarm baro pres min value set alarm baro pres max value These commands set the barometric pressure alarm minimum and maximum values to value, where value is a floating-point number representing barometric pressure alarm limits in millimeters of mercury. The following example sets the barometric pressure alarm maximum value to 800.0 mmHg. Send: Receive: set alarm baro pres max 800 set alarm baro pres max 800 ok alarm bench status This command reports the current status of the bench as FAIL or OK. The following example reports that the bench status is OK. Send: Receive: alarm bench status alarm bench status ok alarm beta count min alarm beta count max Thermo Fisher Scientific Model 5030i SHARP Instruction Manual B-15 C-Link Protocol Commands Alarms These commands report the current beta count alarm minimum and maximum value settings. The following example reports that the beta count alarm minimum value is 5000. Send: Receive: alarm beta count min alarm beta count min 5000 alarm board temp min alarm board temp max These commands report the current board temperature alarm minimum and maximum value settings. The following example reports that the board temperature alarm minimum value is 0 °C. Send: Receive: alarm board temp min alarm board temp min 0.0 degC set alarm board temp min value set alarm board temp max value These commands set the board temperature alarm minimum and maximum values to value, where value is a floating-point number representing board temperature alarm limits in °C. The following example sets the board temperature alarm maximum value to 38 °C. Send: Receive: set alarm board temp max 38 set alarm board temp max 38 ok alarm conc avg neph min alarm conc avg neph max These commands report the current 24-hour average nephelometer concentration alarm minimum and maximum values setting. The following example reports that the average nephelometer concentration minimum is 0 μg/m3. Send: Receive: alarm conc avg neph min alarm conc avg neph min 0.000E+00 μg/m3 set alarm conc avg neph min value set alarm conc avg neph max value These commands set the 24-hour average nephelometer concentration alarm minimum and maximum values to value, where value is a floatingpoint representation of the concentration alarm limits. Values must be in the units that are currently set for use. The following example sets the average nephelometer concentration alarm maximum value to 10000 μg/m3. Send: Receive: B-16 Model 5030i SHARP Instruction Manual set alarm conc avg neph max 10000 set alarm conc avg neph max 10000 ok Thermo Fisher Scientific C-Link Protocol Commands Alarms alarm conc avg pm min alarm conc avg pm max These commands report the current 24-hour average PM concentration alarm minimum and maximum values setting. The following example reports that the average PM concentration minimum is 100 μg/m3. Send: Receive: alarm conc avg pm min alarm conc avg pm min 1.000E+02 μg/m3 set alarm conc avg pm min value set alarm conc avg pm max value These commands set the 24-hour average PM concentration alarm minimum and maximum values to value, where value is a floating-point representation of the concentration alarm limits. Values must be in the units that are currently set for use. The following example sets the average PM concentration alarm maximum value to 10000 mg/m3. Send: Receive: set alarm conc avg pm max 10000 set alarm conc avg pm max 10000 ok alarm conc avg sharp min alarm conc avg sharp max These commands report the current 24-hour average SHARP concentration alarm minimum and maximum values setting. The following example reports that the average SHARP concentration minimum is 0.0 μg/m3. Send: Receive: alarm conc avg sharp min alarm conc avg sharp min 0.000E+00 μg/m3 set alarm conc avg sharp min value set alarm conc avg sharp max value These commands set the 24-hour average SHARP concentration alarm minimum and maximum values to value, where value is a floating-point representation of the concentration alarm limits. Values must be in the units that are currently set for use. The following example sets the average SHARP concentration alarm maximum value to 10,000 μg/m3. Send: Receive: set alarm conc avg sharp max 10000 set alarm conc avg sharp max 10000 ok alarm conc inst neph min alarm conc inst neph max These commands report the current 24-hour instant nephelometer concentration alarm minimum and maximum values setting. The following example reports that the instant nephelometer concentration minimum is 0 μg/m3. Thermo Fisher Scientific Model 5030i SHARP Instruction Manual B-17 C-Link Protocol Commands Alarms Send: Receive: alarm conc inst neph min alarm conc inst neph min 0.000E+00 μg/m3 set alarm conc inst neph min value set alarm conc inst neph max value These commands set the 24-hour instant nephelometer concentration alarm minimum and maximum values to value, where value is a floatingpoint representation of the concentration alarm limits. Values must be in the units that are currently set for use. The following example sets the instant nephelometer concentration alarm maximum value to 10000 μg/m3. Send: Receive: set alarm conc inst neph max 10000 set alarm conc inst neph max 10000 ok alarm conc inst pm min alarm conc inst pm max These commands report the current 24-hour instant PM concentration alarm minimum and maximum values setting. The following example reports that the instant PM concentration minimum is 100 μg/m3. Send: Receive: alarm conc inst pm min alarm conc inst pm min 1.000E+02 μg/m3 set alarm conc inst pm min value set alarm conc inst pm max value These commands set the 24-hour instant PM concentration alarm minimum and maximum values to value, where value is a floating-point representation of the concentration alarm limits. Values must be in the units that are currently set for use. The following example sets the instant PM concentration alarm maximum value to 10000 μg/m3. Send: Receive: set alarm conc inst pm max 10000 set alarm conc inst pm max 10000 ok alarm conc inst sharp min alarm conc inst sharp max These commands report the current 24-hour instant SHARP concentration alarm minimum and maximum values setting. The following example reports that the instant SHARP concentration minimum is 0 μg/m3. Send: Receive: alarm conc inst sharp min alarm conc inst sharp min 0.000E+00 μg/m3 set alarm conc inst sharp min value set alarm conc inst sharp max value These commands set the 24-hour instant SHARP concentration alarm minimum and maximum values to value, where value is a floating-point B-18 Model 5030i SHARP Instruction Manual Thermo Fisher Scientific C-Link Protocol Commands Alarms representation of the concentration alarm limits. Values must be in the units that are currently set for use. The following example sets the instant SHARP concentration alarm maximum value to 10000 μg/m3. Send: Receive: set alarm conc inst sharp max 10000 set alarm conc inst sharp max 10000 ok alarm filter tape status This command reports the status of the filter tape as FAIL or OK. The following example reports that the filter tape status is OK. Send: Receive: alarm filter tape status alarm filter tape status ok alarm flow min alarm flow max These commands report the current flow alarm minimum and maximum value settings. The following example reports that the flow alarm minimum value is 16.0 LPM. Send: Receive: alarm flow min alarm flow min 16.00 LPM set alarm flow min value set alarm flow max value These commands set the flow alarm minimum and maximum values to value, where value is a floating-point number representing flow alarm limits in liters per minute/liters per hour. The following example sets the flow alarm maximum value to 17.34 LPM. Send: Receive: set alarm flow max 17.34 set alarm flow max 17.34 ok alarm flow pres min alarm flow pres max These commands report the current flow pressure alarm minimum and maximum value settings. The following example reports that the flow pressure alarm minimum value is -10.0 mmHg. Send: Receive: alarm flow pres min alarm flow pres min -10.0 mmHg set alarm flow pres min value set alarm flow pres max value These commands set the flow pressure alarm minimum and maximum values to value, where value is a floating-point number representing flow pressure alarm limits in millimeters of mercury. The following example sets the flow pressure alarm maximum value to 50.0 mmHg. Thermo Fisher Scientific Model 5030i SHARP Instruction Manual B-19 C-Link Protocol Commands Alarms Send: Receive: set alarm flow pres max 50 set alarm flow pres max 50 ok alarm flow temp min alarm flow temp max This command reports the current flow temperature alarm maximum value setting. The following example reports that the flow temperature alarm maximum value is 20.0 °C. Send: Receive: alarm flow temp max alarm flow temp max 20.0 degC set alarm flow temp min value set alarm flow temp max value This command sets the flow temperature alarm maximum value to value, where value is a floating-point number representing flow temperature alarm limits in °C. The following example sets the flow temperature alarm maximum value to 70 °C. Send: Receive: set alarm flow temp max 70 set alarm flow temp max 70 ok alarm ib status This command reports the status of the interface board as FAIL or OK. The following example reports that the interface board status is OK. Send: Receive: alarm ib status alarm ib status ok alarm io status This command reports the status of the I/O expansion board as FAIL or OK. The following example reports that the I/O expansion board status is OK. Send: Receive: alarm io status alarm io status ok alarm mb status This command reports the status of the motherboard as FAIL or OK. The following example reports that the motherboard status is OK. Send: Receive: alarm mb status alarm mb status ok alarm nb status This command reports the status of the nephelometer interface board as FAIL or OK. The following example reports that the nephelometer interface board status is OK. B-20 Model 5030i SHARP Instruction Manual Thermo Fisher Scientific C-Link Protocol Commands Alarms Send: Receive: alarm nb status alarm nb status ok alarm ncal status This command reports the status of the last nephelometer auto-zero calibration. The following example reports that the ncal is functional. Send: Receive: alarm ncal status alarm ncal status ok alarm neph led cur min alarm neph led cur max These commands report the current nephelometer LED alarm minimum and maximum value settings. The following example reports that the nephelometer LED alarm minimum value is 50 mA. Send: Receive: alarm neph led cur min alarm neph led cur min 50.0 mA set alarm neph led cur min value set alarm neph led cur max value These commands set the nephelometer LED alarm minimum and maximum values to value, where value is a floating-point number representing nephelometer LED alarm limits in mA. The following example sets the nephelometer LED alarm maximum value to 75.0 mA. Send: Receive: set alarm neph led cur min 75 set alarm neph led cur min 75 ok alarm neph rh min alarm neph rh max These commands report the current nephelometer relative humidity alarm minimum and maximum value settings. The following example reports that the nephelometer relative humidity alarm minimum value is 5.0%. Send: Receive: alarm neph rh min alarm neph rh min 5.0 % set alarm neph rh min value set alarm neph rh max value These commands set the nephelometer relative humidity alarm minimum and maximum values to value, where value is a floating-point number representing nephelometer relative humidity alarm limits in percent. The following example sets the nephelometer relative humidity alarm maximum value to 95%. Send: Receive: Thermo Fisher Scientific set alarm neph rh min 95 set alarm neph rh min 95 ok Model 5030i SHARP Instruction Manual B-21 C-Link Protocol Commands Alarms alarm neph temp min alarm neph temp max This command reports the current nephelometer temperature alarm maximum value setting. The following example reports that the nephelometer temperature alarm maximum value is 5.0 °C. Send: Receive: alarm neph temp max alarm neph temp max 5.0 degC set alarm neph temp min value set alarm neph temp max value This command sets the nephelometer temperature alarm maximum value to value, where value is a floating-point number representing nephelometer temperature alarm limits in °C. The following example sets the nephelometer temperature alarm maximum value to 40.0 °C. Send: Receive: set alarm neph temp max 40 set alarm neph temp max 40 ok alarm sample rh min alarm sample rh max These commands report the current sample relative humidity alarm minimum and maximum value settings. The following example reports that the sample relative humidity alarm minimum value is 5%. Send: Receive: alarm sample rh min alarm sample rh min 5.0 % set alarm sample rh min value set alarm sample rh max value These commands set the sample relative humidity alarm minimum and maximum values to value, where value is a floating-point number representing sample relative humidity alarm limits in percent. The following example sets the sample relative humidity alarm maximum value to 40%. Send: Receive: set alarm sample rh min 40 set alarm sample rh min 40 ok alarm status det This command reports the board status of the detector as FAIL or OK. The following example reports that the detector board status is OK. Send: Receive: B-22 Model 5030i SHARP Instruction Manual alarm status det alarm status det ok Thermo Fisher Scientific C-Link Protocol Commands Diagnostics alarm tape counter max This command reports the current filter tape count alarm maximum value setting. The following example reports that the filter tape count alarm maximum value is 480. Send: Receive: alarm tape counter max alarm tape counter max 480 set alarm tape counter max value This command sets the filter tape count alarm maximum value, where value is an integer number representing filter tape alarm limits. The following example sets the filter tape count alarm maximum value to 490. Send: Receive: set alarm tape counter max 490 set alarm tape counter max 490 ok alarm vac pres min alarm vac pres max These commands report the current vacuum pressure alarm minimum and maximum value settings. The following example reports that the vacuum pressure alarm minimum value is -20.0 mmHg. Send: Receive: alarm vac pres min alarm vac pres min -20.0 mmHg set alarm vac pres min value set alarm vac pres max value These commands set the vacuum pressure alarm minimum and maximum values to value, where value is a floating-point number representing vacuum pressure alarm limits in millimeters of mercury. The following example sets the vacuum pressure alarm maximum value to 250.0 mmHg. Send: Receive: Diagnostics set alarm vac pres max 250 set alarm vac pres max 250 ok amb rh This command reports the ambient RH, in percent. The following example reports that the ambient RH is 30%. Send: Receive: amb rh amb rh 30.0 % amb temp This command reports the current ambient temperature, in degrees C. The following example reports that the ambient temperature is 15 °C. Send: Receive: Thermo Fisher Scientific amb temp amb temp 15.0 degC Model 5030i SHARP Instruction Manual B-23 C-Link Protocol Commands Diagnostics baro pres This command reports the current barometric pressure, in mmHg. The following example reports that the barometric pressure is 722 mmHg. Send: Receive: baro pres baro pres 722.0 mmHg board temp This command reports the current board temperature, in degrees C. The following example reports that the board temperature is 15 °C. Send: Receive: board temp board temp 15.0 degC crn This command reports the current radon concentration for the detector. The following example reports that the radon concentration is 1.2 Bq/m3. Send: Receive: crn crn 1.20 Bq/m3 det status This command reports the current mass for the detector. The sequence is: α, β, βC, βREF. Each value is separated by a space. Send: Receive: det status det status 1 9657 9600 4623 diag volt det This command reports the diagnostic voltage measurements on the detector board. The voltage is positive 5. Send: Receive: diag volt det diag volt det 4.9 diag volt iob This command reports the diagnostic voltage measurements on the I/O expansion board. The sequence of voltages is: Positive 24, positive 5, positive 3.3, and negative 3.3. Each voltage value is separated by a space. Send: Receive: diag volt iob diag volt iob 24.10 4.90 3.20 -3.20 diag volt mb This command reports the diagnostic voltage measurements on the motherboard. The sequence of voltages is: Positive 24, positive 15, positive 5, positive 3.3, and negative 3.3. Each voltage value is separated by a space. B-24 Model 5030i SHARP Instruction Manual Thermo Fisher Scientific C-Link Protocol Commands Diagnostics Send: Receive: diag volt mb diag volt mb 24.10 14.90 4.90 3.20 -3.20 diag volt mib This command reports the diagnostic voltage measurements on the measurement interface board. The sequence of voltages is: Positive 24, positive 15, negative 15, positive 5, and positive 3.3. Each voltage value is separated by a space. Send: Receive: diag volt mib diag volt mib 24.98 14.80 -14.90 4.96 3.20 diag volt neph This command reports the current voltage readings of the nephelometer interface board. The following example reports the nephelometer interface board values. Send: Receive: diag volt neph diag volt mib 3.3 3.3 5.0 7.2 -5.0 -7 flow This command reports the current sample flow. The following example reports that the sample flow is 16.69 LPM. Send: Receive: sample flow sample flow 16.69 LPM flow pres This command reports the current flow pressure for the detector, in mmHg. The following example reports that the flow pressure is 24.1 mmHg. Send: Receive: flow pres flow pres 24.1 mmHg flow temp This command reports the current flow temperature for the detector, in degrees C. The following example reports that the flow temperature is 22.3 °C. Send: Receive: flow temp flow temp 22.3 deg io bd This command reports the presence of the I/O expansion board (yes/no). The following example reports the I/O expansion board is present (yes). Thermo Fisher Scientific Model 5030i SHARP Instruction Manual B-25 C-Link Protocol Commands Diagnostics Send: Receive: io bd io bd yes mass This command reports the presence of mass. The following example reports that the mass is 0.1 mg/m3. Send: Receive: mass mass 0.100E+00 neph bkg This command reports the current nephelometer background values stored on the nephelometer interface board. The following example reports the nephelometer auto-ranging background values. Send: Receive: neph bkg neph bkg1 0.00272 0.00272 0.01099 0.04351 0.17430 0.65535 neph mode This command reports the current operating mode of the nephelometer. The following example shows that the nephelometer is in sample mode. Send: Receive: neph mode neph mode sample neph prev bkg This command reports the previous nephelometer background values stored on the nephelometer interface board. The following example reports the previous nephelometer auto-ranging background values. Send: Receive: neph prev bkg neph prev bkg 0.00272 0.00272 0.01094 0.04357 0.17422 0.65535 set reset tape counter This command resets the tape count to zero. Send: Receive: set reset tape counter set reset tape counter ok sample rh This command reports the sample RH, in percent. The following example reports that the sample RH is 20%. Send: Receive: B-26 Model 5030i SHARP Instruction Manual sample rh sample rh 20.0 % Thermo Fisher Scientific C-Link Protocol Commands Datalogging tape counter This command reports the number counts which corresponds to the filter tape movement. The following example reports that the tape count is 250. Send: Receive: tape counter tape counter 250 vac pres This command reports the current vacuum pressure for the detector, in mmHg. The following example reports that the vacuum pressure is 100 mmHg. Send: Receive: Datalogging vac pres vac pres 100.0 mmHg clr records This command will clear all lrecs and srecs that have been saved. Send: Receive: clr records clr records ok set clr lrecs set clr srecs These commands will clear only the lrecs or only the srecs that have been saved. The following example clears srecs. Send: Receive: set clr srecs set clr srecs ok set copy sp to lrec set copy sp to srec set copy sp to stream These commands copy the current selections in scratch pad (sp) into the lrec, srec, or streaming data list. The scratch pad is a temporary memory area which is used to set up lists of selections for lrec, srec, or streaming data items. The user can copy any of these lists to the scratch pad, modify individual elements in the list, then save the scratch pad back to the original list. For more information on how to edit the scratch pad, see the “sp field” command. The following example copies the current list in scratch pad into the lrecs list. Send: Receive: Thermo Fisher Scientific set copy sp to lrec set copy sp to lrec ok Model 5030i SHARP Instruction Manual B-27 C-Link Protocol Commands Datalogging set copy lrec to sp set copy srec to sp set copy stream to sp These commands copy the current contents of the lrec, srec, or streaming data list into the scratch pad (sp). These commands are useful in easy modification of current lrec, srec, or streaming data lists. The scratch pad is a temporary memory area which is used to set up lists of selections for lrec, srec, or streaming data items. The user can copy any of these lists to the scratch pad, modify individual elements in the list, then save the scratch pad back to the original list. For more information on how to edit the scratch pad, see the “sp field” command. The following example copies the current list of lrecs into the scratch pad. Send: Receive: set copy lrec to sp set copy lrec to sp ok data treatment lrec data treatment srec These commands report the current selection of data treatment for concentrations in the lrecs or srecs. The following example reports the data treatment for concentrations in lrec as minimum. Send: Receive: data treatment lrec data treatment lrec min set data treatment lrec string set data treatment srec string string = | cur | avg | min | max | These commands set the data treatment to current, average, minimum, or maximum for the concentration values recorded in the lrecs or srecs. The following example sets the data treatment for concentrations in lrec as minimum. Send: Receive: set data treatment lrec min set data treatment lrec min ok erec erxy x=|0|1| : Reply termination format (see “set format format” command) y = | 0 | 1 | 2 | : Output format (see “set erec format format” command) These commands return a snapshot of the main operating conditions (measurements and status) at the time the command is issued. The following example shows a typical response. B-28 Model 5030i SHARP Instruction Manual Thermo Fisher Scientific C-Link Protocol Commands Datalogging The format is defined within the command (in the case of erxy) by the current settings of the "format" and "erec format" commands (in the case of erec). For details on erec formatting, see the “Record Layout Definition” section at the end of this appendix. For details on how to decode the flag fields within these records, see the "flags" command. Send: Receive: erec erec 07:53 05-04-09 flags 110000 PM 0.000 1 24Hr Avg PM 0.000 1 Coef A 1.000 Bkg A 0.000 Range A 10000.000 Flow A 0.000 6 5 3 1 1 1 0 Temp Threshold A 30.000 Temp Threshold A 35.000 list lrec list srec list stream list sp These commands report the list of current selections for lrec logging data, srec logging data, streaming data output, or the scratch pad (sp) list. The scratch pad is a temporary memory area which is used to set up lists of selections for lrec, srec, or streaming data items. The user can copy any of these lists to the scratch pad, modify individual elements in the list, then save the scratch pad back to the original list. Refer to the “sp field” command for information on how to edit the scratch pad. The following example shows the list for streaming data output. Send: Receive: list stream list stream field index variable X x time lrec srec lrec rec num srec rec num lrxy rec num srxy rec num lrec aa:bb oo-pp-qq yy srec aa:bb oo-pp-qq yy rec = The starting record index number (1=most recent) num = The number of records to return (1 to 10) x=|0|1| : Reply termination format (see “set format format” command) y = | 0 | 1 | 2 | : Output format (see “set lrec/srec format format” command) aa = hours (01 to 23) Thermo Fisher Scientific Model 5030i SHARP Instruction Manual B-29 C-Link Protocol Commands Datalogging bb = minutes (01 to 59) oo = month (01 to 12) pp = day (01 to 31) qq = year These commands output lrec or srec logged data. The output format is determined by the “set lrec format”, and “set srec format” commands. The logging time is determined by the “set lrec per” and “set srec per” commands. In the following example, assume there are 740 lrecs currently stored in memory. When the command “lrec 100 5” is sent, the instrument counts back 100 records from the last record collected (record 740), and then returns 5 records: 640, 641, 642, 643, and 644. For details on how to decode the flag fields within these records, see the “flags” command. Send: Receive: lrec 5 lrec 100 5 08:28 05-04-09 flags 00110000 pm 0.000 baro 0.000 vac 260.000 pflow -52.000 ambrh 0.000 srh 0.000 ambtemp 32.000 stemp -41.000 fvol 0.000 cflg 00001F86 aflg 0000FC0C 08:29 05-04-09 flags 00110000 pm 0.000 baro 0.000 vac 260.000 pflow -52.000 ambrh 0.000 srh 0.000 ambtemp 32.000 stemp -41.000 fvol 0.000 cflg 00001F86 aflg 0000FC0C 08:30 05-04-09 flags 00110000 pm 0.000 baro 0.000 vac 260.000 pflow -52.000 ambrh 0.000 srh 0.000 ambtemp 32.000 stemp -41.000 fvol 0.000 cflg 00001F86 aflg 0000FC0C 08:31 05-04-09 flags 00110000 pm 0.000 baro 0.000 vac 260.000 pflow -52.000 ambrh 0.000 srh 0.000 ambtemp 32.000 stemp -41.000 fvol 0.000 cflg 00001F86 aflg 0000FC0C 08:32 05-04-09 flags 00110000 pm 0.000 baro 0.000 vac 260.000 pflow -52.000 ambrh 0.000 srh 0.000 ambtemp 32.000 stemp -41.000 fvol 0.000 cflg 00001F86 aflg 0000FC0C - - - - - lrec format srec format erec format These commands report the output format for lrecs and srecs, and erec data in various formats such as ASCII without text, ASCII with text, or binary. The following example shows the output format for lrecs is ASCII with text, according to Table B–3. Send: Receive: B-30 Model 5030i SHARP Instruction Manual lrec format lrec format 1 Thermo Fisher Scientific C-Link Protocol Commands Datalogging set lrec format format set srec format format set erec format format These commands set the output format for lrecs and srecs, and erec data, according to Table B–3. The following example sets the lrec output format to ASCII with text. Send: Receive: set lrec format 1 set lrec format 1 ok Table B–3. Record Output Formats Format Output Format 0 ASCII no text 1 ASCII with text 2 Binary data lrec layout srec layout erec layout These commands report the layout (string indicating the data formats) for data that is sent out in response to the lrec, srec, erec, and related commands. For details on how to interpret the strings, see “Record Layout Definition” later in this appendix. Send: Receive: lrec layout lrec layout %s %s %lx %f %f %f %f %f %f %f %f %f %lx %lx t D L fffffffff A A flags pm baro vac pflow ambrh srh ambtemp stemp fvol dflg aflg lrec mem size srec mem size These commands report the number of lrecs and srecs that can be stored with the current settings and the number of blocks reserved for lrecs and srecs. The following example shows that 1075 blocks were reserved for lrecs and the maximum number of lrecs that can be stored in memory is 241979. Memory allocation can be changed using the “malloc” command. Send: Receive: lrec mem size lrec mem size 241979 recs, 1075 blocks lrec per srec per Thermo Fisher Scientific Model 5030i SHARP Instruction Manual B-31 C-Link Protocol Commands Datalogging These commands report the lrecs and srecs logging period. The following example shows that the srec logging period is 5 minutes. Send: Receive: srec per srec per 5 min set lrec per value set srec per value value = | 1 | 5 | 15 | 30 | 60 | These commands set the lrecs and srecs logging period to value in minutes. The following example sets the lrec logging period to 15 minutes. Send: Receive: set lrec per 15 set lrec per 15 ok malloc lrec malloc srec These commands report the currently set memory allocation for lrecs and srecs in percent of total memory. Send: Receive: malloc lrec malloc lrec 10 % set malloc lrec value set malloc srec value value = 0 to 100 These commands set the percent of memory space allocated for lrecs and sreco to value, where value is a floating-point number representing percent. The following example sets the memory allocation for lrecs to 10%. Note Issuing these commands will clear all the logged data in memory. All the existing records should be retrieved using appropriate commands, if required. ▲ Send: Receive: set malloc lrec 10 set malloc lrec 10 ok no of lrec no of srec These commands report the number of lrec and srecs stored memory. The following example shows that 50 lrecs have been stored in the memory. Send: Receive: B-32 Model 5030i SHARP Instruction Manual no of lrec no of lrec 50 recs Thermo Fisher Scientific C-Link Protocol Commands Datalogging sp field number This command reports the variable number and name stored at the index in the scratch pad list. The scratch pad is a temporary memory area which is used to set up lists of selections for lrec, srec, or streaming data items. The user can copy any of these lists to the scratch pad, modify individual elements in the list, then save the scratch pad back to the original list. The following example shows that field 1 in the scratch pad is set to index number 3, which is for the variable PM concentration pressure. Send: Receive: sp field 1 sp field 1 3 PM set sp field number value number = 1-32 for lrec and srec lists, 1-8 for streaming data lists This command sets the scratch pad field number (item number in scratch pad list) to value, where value is the index number of a variable in the analog output variable list. Available variables and their corresponding index numbers may be obtained using the command “list var aout”. The “set sp field” command is used to create a list of variables which can then be transferred into the lrec, srec, or streaming data lists, using the “set copy sp to lrec”, “set copy sp to srec”, or “set copy sp to stream” commands. Send: Receive: set sp field 1 34 set sp field 1 34 ok stream per This command reports the current time interval in seconds for streaming data. The following example reports the streaming period is set to 10 seconds. Send: Receive: stream per stream per 10 sec set stream per number value number value = | 1 | 2 | 5 | 10 | 20 | 30 | 60 | 90 |120 | 180 | 240 | 300 | This command sets the time interval between two consecutive streaming data strings to number value in seconds. The following example sets the number value to 10 seconds. Send: Receive: Thermo Fisher Scientific set stream per 10 set stream per 10 ok Model 5030i SHARP Instruction Manual B-33 C-Link Protocol Commands Calibration stream time This command reports if the streaming data string will have a time stamp attached to it or not, according to Table B–4. The following example reports that the streaming data shall not include a time stamp. Send: Receive: stream time stream time 0 set stream time value This command enables value, where value is to attach or disable time stamp to streaming data string, according to Table B–4. The following example attaches a time stamp to streaming data. Send: Receive: set stream time 1 set stream time 1 ok Table B–4. Stream Time Values Calibration Value Stream Time 0 Disables time stamp to streaming data string 1 Attaches time stamp to streaming data string alpha eff This command reports the current value of alpha efficiency for the detector. The following example reports that the alpha efficiency is 0.12. Send: Receive: alpha eff alpha eff 0.120 set alpha eff value This command sets the alpha efficiency for the detector to value, where value is a floating-point number representing the alpha efficiency for the detector. The following example sets the alpha efficiency to.0.15. Send: Receive: set alpha eff 0.15 set alpha eff 0.15 ok alpha th This command reports the current value of alpha threshold for the detector. The following example reports that the alpha threshold is 1220. Send: Receive: B-34 Model 5030i SHARP Instruction Manual alpha th alpha th 1220 Thermo Fisher Scientific C-Link Protocol Commands Calibration set alpha th value This command sets the alpha threshold for the detector to value, where value is a floating-point number representing the alpha threshold for the detector. The following example sets the alpha threshold to 1250. Send: Receive: set alpha th 1250 set alpha th 1250 ok amb rh offset This command reports the current ambient RH offset, in percent. The following example reports that the ambient RH offset is 0.6%. Send: Receive: amb rh offset amb rh offset 0.6 % set amb rh offset value This command sets the ambient RH offset to value, where value is a floating-point number representing ambient RH offset in percent. The following example sets the ambient RH offset to 7%. Send: Receive: set amb rh offset 7 set amb rh offset 7 ok amb temp offset This command reports the current ambient temperature offset, in degrees C. The following example reports that the ambient temperature offset is 5 °C. Send: Receive: amb temp offset amb temp offset 5.0 degC set amb temp offset value This command sets the ambient temperature offset to value, where value is a floating-point number representing ambient temperature offset in degrees C. The following example sets the ambient temperature offset to 3 °C. Send: Receive: set amb temp offset 3 set amb temp offset 3 ok baro mass coef This command reports the current barometric mass coefficient. The following example reports that the barometric mass coefficient is 0.000540. Send: Receive: Thermo Fisher Scientific baro mass coef baro mass coef 0.000540 Model 5030i SHARP Instruction Manual B-35 C-Link Protocol Commands Calibration set baro mass coef value This command sets the barometric mass coefficient to user-defined values to value, where value is a floating-point representation of the coefficient. The following example sets the barometric mass coefficient to 0.000630. Send: Receive: set baro mass coef 0.000630 set baro mass coef 0.000630 ok baro span This command reports the current barometric pressure span recorded at the time of calibration. The following example reports that the barometric span is 1.0. Send: Receive: baro span baro span 1.0000 set baro span value This command requires to manually specifying the span value for the barometric pressure span, where value is a floating-point representation of barometric pressure span. The following example successfully sets the barometric span to 1.023. Send: Receive: set baro span 1.023 set baro span 1.023 ok beta th This command reports the current reference beta threshold for the detector. The following example reports that the beta threshold is 440. Send: Receive: beta th beta th 440 set beta th value This command sets the reference beta threshold for the detector to value, where value is a floating-point representation of the beta threshold. The following example sets the beta threshold to 500. Send: Receive: set beta th 500 set beta th 500 ok bkg pm This command reports the current PM backgrounds. The following example reports that the PM background is 4 μg/m3. Send: Receive: B-36 Model 5030i SHARP Instruction Manual bkg pm bkg pm 4.000E+00 μg/m3 Thermo Fisher Scientific C-Link Protocol Commands Calibration set bkg pm value This command is used to set PM backgrounds to user-defined values to value, where value is a floating-point representation of the background in current selected units. The following example sets the PM background to 5.2 μg/m3. Send: Receive: set bkg pm 5.2 set bkg pm 5.2 ok bkg sharp This command reports the current SHARP backgrounds. The following example reports that the SHARP background is 4 μg/m3. Send: Receive: bkg sharp bkg sharp 4.000E+00 μg/m3 set bkg sharp value This command is used to set SHARP backgrounds to user-defined values to value, where value is a floating-point representation of the background in current selected units. The following example sets the SHARP background to 5.2 μg/m3. Send: Receive: set bkg sharp 5.2 set bkg sharp 5.2 ok set cal baro pres span This command automatically calculates the span coefficient based on the entered target pressure value. The following example sets the calibration pressure to 720.5 mmHg. Send: Receive: set cal baro pres span 720.5 set cal baro pres span 720.5 ok set cal flow pres span value This command automatically sets the flow pressure span based on the flow pressure entered at the time of calibration. The following example successfully sets the new value for flow span based on the flow pressure to 50.5 mmHg. Send: Receive: set cal flow pres span 50.5 set cal flow pres span 50.5 ok set cal flow span value This command automatically sets the new value for flow span based on the corrected flow entered. The following example sets the new value for flow span based on the corrected flow to 17.2 LPM. Thermo Fisher Scientific Model 5030i SHARP Instruction Manual B-37 C-Link Protocol Commands Calibration Send: Receive: set cal flow span 17.2 set cal flow span 17.2 ok set cal vac pres span value This command automatically sets the vacuum span based on the vacuum pressure entered at the time of calibration. The following example successfully sets the new value for vacuum span based on the vacuum pressure to 120.5 mmHg. Send: Receive: set cal vac pres span 120.5 set cal vac pres span 120.5 ok set cal vac flow offset This command automatically triggers the filter change and sets the new value for vacuum and flow offset. The following example successfully sets the vacuum and flow offset. Send: Receive: set cal vac flow offset set cal vac flow offset ok coef pm This command reports PM coefficient. The following example reports that the PM coefficient is 1.200. Send: Receive: coef pm coef pm 1.200 set coef pm value This command sets the PM coefficient to user-defined values to value, where value is a floating-point representation of the coefficient. The following example sets the PM coefficient to 1.200. Send: Receive: set coef pm 1.200 set coef pm 1.200 ok coef sharp This command reports SHARP coefficient. The following example reports that the SHARP coefficient is 1.05. Send: Receive: coef sharp coef sharp 1.050 set coef sharp value This command sets the SHARP coefficient to user-defined values to value, where value is a floating-point representation of the coefficient. The following example sets the SHARP coefficient to 1.04. Send: Receive: B-38 Model 5030i SHARP Instruction Manual set coef sharp 1.04 set coef sharp 1.04 ok Thermo Fisher Scientific C-Link Protocol Commands Calibration flow pres span This command reports the flow pressure span recorded at the time of calibration. The following example reports that the flow span is 1.2. Send: Receive: flow pres span flow pres span 1.200 set flow pres span value This command sets the flow pressure span to value, where value is a floating-point representation of the pressure span specified at the time of calibration. The following example successfully sets the new value for flow pressure to 1.5. Send: Receive: set flow pres span 1.5 set flow pres span 1.5 ok flow pres offset This command reports the flow pressure offset for the detector at the time of calibration. The following example reports that the flow pressure offset is 3.0. Send: Receive: flow pres offset flow pres offset 3.0 flow span This command reports the current flow span at the time of calibration. The following example reports that the flow at calibration is 1.00. Send: Receive: flow span flow span 1.000 set flow span value This command sets the current flow span to the value, where value is a floating-point representation of the flow span specified at the time of calibration. The following example sets the flow span to 1.5. Send: Receive: set flow span 1.5 set flow span 1.5 ok flow temp offset This command reports offset for flow temperature, in degrees C. The following example reports that the flow temperature offset is 5 °C. Send: Receive: Thermo Fisher Scientific flow temp offset flow temp offset 5.0 degC Model 5030i SHARP Instruction Manual B-39 C-Link Protocol Commands Calibration set flow temp offset value This command sets the offset value for flow temperature, where value is a floating-point number representing flow temperature offset in degrees C. The following example sets the flow temperature offset to 7 °C. Send: Receive: set flow temp offset 7 set flow temp offset 7 ok high volt This command reports the current high voltage for the detector. The following example reports that the high voltage is 1400 V. Send: Receive: high volt high volt 1400 set high volt value This command sets the high voltage for the detector to value, where value is a floating-point representation of the high voltage. The following example sets the high voltage to 1445 V. Send: Receive: set high volt 1445 set high volt 1445 ok mass coef This command reports the current mass coefficient. The following example reports that the mass coefficient is 7100. Send: Receive: mass coef mass coef 7100.0 set mass coef value This command sets the mass coefficient to user-defined values to value, where value is a floating-point representation of the coefficient. The following example sets the mass coefficient to 7000. Send: Receive: set mass coef 7000 set mass coef 7000 ok thermal mass coef This command reports the current thermal mass coefficient. The following example reports that the thermal mass coefficient is 19.000000. Send: Receive: thermal mass coef thermal mass coef 19.000000 set thermal mass coef value This command sets the thermal mass coefficient to user-defined values to value, where value is a floating-point representation of the coefficient. The following example sets the thermal mass coefficient to 20.5. B-40 Model 5030i SHARP Instruction Manual Thermo Fisher Scientific C-Link Protocol Commands Calibration Send: Receive: set thermal mass coef 20.5 set thermal mass coef 20.5 ok vac mass coef This command reports the current vacuum mass coefficient. The following example reports that the vacuum mass coefficient is 2.0. Send: Receive: vac mass coef vac mass coef 2.000000 set vac mass coef value This command sets the vacuum mass coefficient to user-defined values to value, where value is a floating-point representation of the coefficient. The following example sets the vacuum mass coefficient to 3.1. Send: Receive: set vac mass coef 3.1 set vac mass coef 3.1 ok neph cal bkg This command sets the nephelometer into an auto-zero calibration routine. The following example set this command. Send: Receive: set neph cal bkg set neph cal bkg ok neph coef This command reports the nephelometer span coefficient set at the factory. The following example reports that the nephelometer span coefficient is 388.000. Send: Receive: neph coef neph coef 388.000 set neph coef value This command sets the nephelometer span coefficient to user-defined values to value, where value is a floating-point representation of the coefficient. The following example sets the nephelometer span coefficient to 250.00 Send: Receive: set neph coef 250 set neph coef 250 ok neph reset bkg This command will reset all measured background values to zero. The following example sets this command. Send: Receive: Thermo Fisher Scientific set neph reset bkg set neph reset bkg ok Model 5030i SHARP Instruction Manual B-41 C-Link Protocol Commands Calibration neph restore bkg This command will restore the background values to the previous background values. The following example sets this command. Send: Receive: set neph restore bkg set neph restore bkg ok neph rh offset This command reports the nephelometer relative humidity sensor offset set at the factory. The following example reports that the nephelometer relative humidity sensor offset is 7.3%. Send: Receive: neph rh offset neph rh offset 7.3 % set neph rh offset value This command sets the nephelometer relative humidity sensor offset to user-defined values to value, where value is a floating-point representation of the offset. The following example sets the nephelometer relative humidity sensor offset to 3%. Send: Receive: set neph rh offset 3 set neph rh offset 3 ok neph src level This command reports the nephelometer source level set at the factory. The following example reports that the nephelometer source level is 44%. Send: Receive: neph src level neph src level 44 % set neph src level value This command sets the nephelometer source level to user-defined values to value, where value is a floating-point representation of the level. The following example sets the nephelometer source level to 50%. Send: Receive: set neph src level 50 set neph src level 50 ok neph temp offset This command reports the nephelometer temperature offset set at the factory. The following example reports that the nephelometer temperature offset is 2.6 °C. Send: Receive: B-42 Model 5030i SHARP Instruction Manual neph temp offset neph temp offset 2.6 degC Thermo Fisher Scientific C-Link Protocol Commands Calibration set neph temp offset value This command sets the nephelometer temperature offset to user-defined values to value, where value is a floating-point representation of the offset. The following example sets the nephelometer temperature offset to 2.5 °C. Send: Receive: set neph temp offset 2.5 set neph temp offset 2.5 ok neph thermal coef This command reports the nephelometer thermal coefficient set at the factory. The following example reports that the nephelometer thermal coefficient is 0.00058. Send: Receive: neph thermal coef neph thermal coef 0.00058 set neph thermal coef value This command sets the nephelometer thermal coefficient to user-defined values to value, where value is a floating-point representation of the coefficient. The following example sets the nephelometer thermal coefficient to 0.001. Send: Receive: set neph thermal coef 0.001 set neph thermal coef 0.001 ok tape to ncal ratio This command reports the ratio of filter tape changes per nephelometer auto-zero. The following example reports this value. Send: Receive: tape to ncal ratio tape to ncal ratio 1:1 set tape to ncal ratio This command sets the filter tape change per nephelometer auto-zero ratio to a user-defined value, where value is a floating-point representation of the ratio. The following example sets the nephelometer filter tape change to auto-zero to 2:1. Send: Receive: set tape to ncal ratio 2:1 set tape to ncal ratio 2:1 ok vac pres span This command reports the vacuum span for the detector at the time of calibration. The following example reports that the vacuum pressure span is 1.0. Send: Receive: Thermo Fisher Scientific vac pres span vac pres span 1.000 Model 5030i SHARP Instruction Manual B-43 C-Link Protocol Commands Keys/Display set vac pres span value This command sets the vacuum span to the value specified at the time of calibration, where value is a floating-point representation of vacuum span. The following example successfully sets the new value for vacuum pressure span to 1.002. Send: Receive: set vac pres span 1.002 set vac pres span 1.002 ok vac pres offset This command reports the vacuum offset for the detector at the time of calibration. The following example reports that the vacuum pressure offset is 0.3. Send: Receive: vac pres zero vac pres zero 0.3 set vf pres cal def This command resets the vacuum and flow pressure calibration to their default values. Send: Receive: Keys/Display set vf pres cal def set vf pres cal def ok push button do me 1 down menu 2 en ri 3 enter right 4 he ru help run le up left button = | do | down | en | enter | he | help | le | left | me | menu | ri | right | ru | run | up | 1 | 2 | 3 | 4 | These commands simulate pressing the front panel pushbuttons. The numbers represent the front panel soft keys, from left to right. Send: Receive: push enter push enter ok isc iscreen These commands retrieve the framebuffer data used for the display on the iSeries instrument. It is 19200 bytes in size, 2-bits per pixel, 4 pixels per byte arranged as 320 by 240 characters. The data is sent in RLE encoded B-44 Model 5030i SHARP Instruction Manual Thermo Fisher Scientific C-Link Protocol Commands Measurement Configuration form to save time in transmission. It is sent as a type '5' binary C-Link response with no checksum. The RLE encoding consists of a 0 followed by an 8-bit count of consecutive 0xFF bytes. The following 'c' code will expand the incoming data. void unpackDisplay ( void far* tdib, unsigned char far* rlescreen ) { int i,j,k; unsigned char far *sc4bpp, *sc2bpp, *screen, *ptr; ptr = screen = (unsigned char far *)malloc(19200); //RLE decode the screen for (i=0; i<19200 && (ptr - screen) < 19200; i++) { *(ptr++) = *(rlescreen + i); if (*(rlescreen + i) == 0) { unsigned char rlecount = *(unsigned char *)(rlescreen + ++i); while (rlecount) { *(ptr++) = 0; rlecount--; } } else if (*(rlescreen + i) == 0xff) { unsigned char rlecount = *(unsigned char *)(rlescreen + ++i); while (rlecount) { *(ptr++) = 0xff; rlecount--; } } } } To convert this data into a BMP for use with Windows, it needs to be saved as a 4-bit-per-pixel gray-scale image. Also note that BMP files are upside down relative to this data, that is, the top display line is the last line in the BMP. sc screen These commands are meant for backward compatibility with the C series. Screen information is instead reported using the “iscreen” command above. Send: Receive: Measurement Configuration Thermo Fisher Scientific screen screen This is an iSeries instrument. Screen information not available. conc unit This command reports the current concentration units (mg/m3 or μg/m3). The following example reports that the concentration units are set to mg/m3. Model 5030i SHARP Instruction Manual B-45 C-Link Protocol Commands Measurement Configuration Send: Receive: conc unit conc unit μg/m3 set conc unit unit unit = | μg/m3 | mg/m3 | This command sets the concentration units to mg/m3 or μg/m3. The following example sets the concentration units to mg/m3. Send: Receive: set conc unit mg/m3 set conc unit mg/m3 ok custom range range = | 1 | 2 | 3 | This command reports the user-defined value of custom range 1, 2, or 3. The following example reports that custom range 1 is defined to 5.50 mg/m3. Send: Receive: custom 1 custom 1 5.500E+00 mg/m3 set custom range range value set custom 1 value set custom 2 value set custom 3 value These commands are used to set the maximum concentration for any of the three custom ranges 1, 2, or 3 to range value, where value is a floating-point number representing concentration in the currently selected units. The following example sets the custom 1 range to 100.5 μg/m3. Send: Receive: set custom 1 100.5 μg/m3 set custom 1 100.5 μg/m3 ok filter period This command reports the number of hours to be added to filter next time for the filter tape change. The following example reports that the filter period is eight hours. Send: Receive: filter period filter period 8 HRS set filter period value This command sets the number of hours to be added to filter next time for the filter tape change to value, where value is a floating-point representation of the filter period in hours. The following example sets the filter period to 10 hours. Send: Receive: B-46 Model 5030i SHARP Instruction Manual set filter period 10 set filter period 10 ok Thermo Fisher Scientific C-Link Protocol Commands Measurement Configuration filter time This command reports the next date and time of the filter tape change. The following example reports that the date and time is January 1, 2008, 6:12 pm. Send: Receive: filter time filter time 01Jan08 18:12 set filter time dd-mm-yyyy hh:mm:ss dd = day mm = month yyyy = year hh = hours mm = minutes ss = seconds This command sets the next filter tape change. The following example sets the filter time to October 1, 2008, 11:32 pm. Send: Receive: set filter time 10-01-2008 23:32 set filter time 10-01-2008 23:32 ok flow target This command reports the current flow. The following example reports that the flow is 16.0 LPM. Send: Receive: flow target flow target 16.00 set flow target value This command sets the flow to value, where value is a floating-point number representation of flow between 1 to 20 LPM. The following example sets the flow to 16.67 LPM. Send: Receive: set flow target 16.67 set flow target 16.67 ok ht control This command reports the current status of the heater (off, RH threshold, or temp threshold). The following example reports that the heater is RH threshold. Send: Receive: ht control ht control RH set ht control selection selection = | off | rh | temp | Thermo Fisher Scientific Model 5030i SHARP Instruction Manual B-47 C-Link Protocol Commands Measurement Configuration This command sets the heater to off, RH threshold, or temp threshold. The following example sets the heater to temp threshold. Send: Receive: set ht control temp set ht control temp ok int time This command reports the current integration time of the calculated mass and concentration. The following example reports the integration time is 15 minutes. Send: Receive: int time int time 15 min set int time value This command sets the integration time to value, where value can be 15, 20, 30, 40, 45, or 60 minutes. The following example sets the integration time to 20 minutes. Send: Receive: set int time 20 set int time 20 ok mass limit This command reports the current filter mass limit. The following example reports that the mass limit is 1,500 mg. Send: Receive: mass limit mass limit 1500 set mass limit value This command sets the filter mass limit to value, where value is a floatingpoint number representation of mass limit between 0.5 to 5.0 mg or 500 to 5,000 μg. The following example sets the mass limit to 1.0 mg/m3. Send: Receive: set mass limit 1.0 set mass limit 1.0 ok pres comp This command reports whether pressure compensation is for actual or standard conditions. The following example shows the pressure compensation is standard. Send: Receive: pres comp pres comp std set pres comp selection selection = | act | std | B-48 Model 5030i SHARP Instruction Manual Thermo Fisher Scientific C-Link Protocol Commands Measurement Configuration These commands turn the pressure compensation to either actual or standard conditions. The following example turns the pressure compensation to actual. Send: Receive: set pres comp act set pres comp act ok pres std This command reports the standard pressure. The following example reports that the standard pressure is 760 mmHg. Send: Receive: pres std pres std 760 mmHg set pres std value This command sets the standard pressure to value, where value is a floatingpoint number representation of standard pressure between 0 to 760 mmHg. The following example sets the standard pressure to 730 mmHg. Send: Receive: set pres std 730 set pres std 730 ok range This command reports the current PM range. If the mode is incorrect, the instrument responds with “can’t, wrong settings”. The following example reports that the PM range is set to 5 mg/m3, according to Table B–5. Send: Receive: range range 4: 5.000E+00 mg/m3 set range selection This command selects the PM ranges, according to Table B–5. The following example sets the PM range to 10 mg/m3. Send: Receive: set range 5 set range 5 ok Table B–5. Standard Ranges Thermo Fisher Scientific Selection μg/m3 mg/m3 0 100 0.1 1 1000 1.0 2 2000 2.0 3 3000 3.0 4 5000 5.0 5 10000 10.0 Model 5030i SHARP Instruction Manual B-49 C-Link Protocol Commands Measurement Configuration Selection μg/m3 mg/m3 6 C1 C1 7 C2 C2 8 C3 C3 rh th This command reports the current heater RH threshold for the sample. The following example reports that the RH threshold is 30%. Send: Receive: rh th rh th 30 % set rh th value This command sets the heater RH threshold for the sample to value, where value is a floating-point number representation of RH threshold between 25 to 90%. The following example sets the RH threshold to 35%. Send: Receive: set rh th 35 set rh th 35 ok temp comp This command reports whether temperature compensation is for actual or standard conditions. The following example shows the temperature compensation is standard. Send: Receive: temp comp temp comp std set temp comp selection selection = | act | std | These commands turn the temperature compensation to either actual or standard conditions. The following example turns the temperature compensation to actual. Send: Receive: set temp comp act set temp comp act ok temp std This command reports the standard temperature. The following example reports that the standard temperature is 18 °C. Send: Receive: B-50 Model 5030i SHARP Instruction Manual temp std temp std 18 degC Thermo Fisher Scientific C-Link Protocol Commands Hardware Configuration set temp std value This command sets the standard temperature to value, where value is a floating-point number representation of standard temperature between 0 to 25 °C. The following example sets the standard temperature to 15 °C. Send: Receive: set temp std set temp std 15 ok temp th This command reports the heater temperature threshold for the sample. The following example reports that the temperature threshold is 30 °C. Send: Receive: temp th temp th 30 degC set temp th value This command sets the heater temperature threshold for the sample to value, where value is a floating-point number representation of temperature threshold between 0 to 70 °C. The following example sets the temperature threshold to 35 °C. Send: Receive: Hardware Configuration set temp th 35 set temp th 35 ok contrast This command reports the screen’s level of contrast. The following example shows the screen contrast is 55%, according to Table B–6. Send: Receive: contrast contrast 11: 55% set contrast level This command sets the screen’s level of contrast, according to Table B–6. The following example sets the contrast level to 50%. Send: Receive: set contrast 10 set contrast 10 ok Table B–6. Contrast Levels Thermo Fisher Scientific Level Contrast Level 0 0% 1 5% 2 10% 3 15% 4 20% Model 5030i SHARP Instruction Manual B-51 C-Link Protocol Commands Hardware Configuration Level Contrast Level 5 25% 6 30% 7 35% 8 40% 9 45% 10 50% 11 55% 12 60% 13 65% 14 70% 15 75% 16 80% 17 85% 18 90% 19 95% 20 100% date This command reports the current date. The following example reports the date as April 1, 2009. Send: Receive: date date 04-01-09 set date mm-dd-yy mm = month dd = day yy = year This command sets the date of the analyzer’s internal clock. The following example sets the date to May 1, 2009. Send: Receive: set date 05-01-09 set date 05-01-09 ok set default params This command sets all the parameters to their default values. This does not affect the factory-calibrated parameters. B-52 Model 5030i SHARP Instruction Manual Thermo Fisher Scientific C-Link Protocol Commands Hardware Configuration Send: Receive: set default params set default params ok det This command reports the status of the detector board (sharp/beta/map/none). The following example reports that the detector is beta. Send: Receive: det det beta pump This command reports the current status of pump as on or off. The following example reports that the pump is set to off. Send: Receive: pump pump off set pump onoff onoff = | on | off | This command sets the pump on or off. The following example sets the pump to on. Send: Receive: set pump on set pump on ok save set save params These commands store all current parameters in FLASH memory. It is important that each time instrument parameters are changed, that this command be sent. If changes are not saved, they will be lost in the event of a power failure. The following example saves the parameters to FLASH memory. Send: Receive: set save params set save params ok time This command reports the current time (24-hour format). The following example reports that the internal time is 2:15:30 pm. Send: Receive: time time 14:15:30 set time hh:mm:ss hh = hours mm = minutes ss = seconds Thermo Fisher Scientific Model 5030i SHARP Instruction Manual B-53 C-Link Protocol Commands Communications Configuration This command sets the internal clock (24-hour format). The following example sets the internal time to 2:15 pm. Note If seconds are omitted, the seconds default to 00. ▲ Send: Receive: Communications Configuration set time 14:15 set time 14:15 ok addr dns This command reports the TCP/IP address for the domain name server. Send: Receive: addr dns addr dns 192.168.1.1 set addr dns address This command sets the domain name server address, where address consists of four numbers ranging from 0-255 inclusive, separated by “.”. Send: Receive: set addr dns 192.168.1.1 set addr dns 192.168.1.1 ok addr gw This command reports the default TCP/IP gateway address. Send: Receive: addr gw addr gw 192.168.1.1 set addr gw address This command sets the default gateway address, where address consists of four numbers ranging from 0-255 inclusive, separated by “.”. Note This command cannot be used when DHCP is on. Refer to the DHCP command that follows for additional information. ▲ Send: Receive: set addr gw 192.168.1.1 set addr gw 192.168.1.1 ok addr ip This command reports the IP address of the analyzer. Send: Receive: addr ip addr ip 192.168.1.200 set addr ip address This command sets the analyzer’s IP address, where address consists of four numbers ranging from 0-255 inclusive, separated by “.”. B-54 Model 5030i SHARP Instruction Manual Thermo Fisher Scientific C-Link Protocol Commands Communications Configuration Note This command cannot be used when DHCP is on. Refer to the DHCP command that follows for additional information. ▲ Send: Receive: set addr ip 192.168.1.200 set addr ip 192.168.1.200 ok addr nm This command reports the IP netmask. Send: Receive: addr nm addr nm 255.255.252.0 set addr nm mask This command sets the netmask mask, where mask consists of four numbers ranging from 0-255 inclusive, separated by “.”. Note This command cannot be used when DHCP is on. Refer to the DHCP command that follows for additional information. ▲ Send: Receive: set addr nm 255.255.252.0 set addr nm 255.255.252.0 ok addr ntp This command reports the IP address for the network time protocol server. See “Network Time Protocol Server” in the Communications Settings” section of the “Operation” chapter for more information. Send: Receive: addr ntp addr ntp 10.209.43.237 set addr ntp address This command sets the network time protocol server address, where address consists of four numbers ranging from 0-255 inclusive, separated by “.”. Send: Receive: set addr ntp 10.209.43.237 set addr ntp 10.209.43.237 ok allow mode cmd This command reports the current allow mode setting: 1 = allow “set mode local” and “set mode remote” commands; 0 = ignore “set mode local” or “set mode remote”commands, according to Table B–7. The default value is 0; ignore the commands. The following example shows that the instrument is configured to ignore “set mode local” or “set mode remote” commands. Send: Receive: Thermo Fisher Scientific allow mode cmd allow mode cmd 0 Model 5030i SHARP Instruction Manual B-55 C-Link Protocol Commands Communications Configuration set allow mode cmd value This command is used to configure the instrument to value, where value is either 1 = accept or 0 = ignore the “set mode local” and “set mode remote” commands, according to Table B–7. If the instrument is set to accept the commands (value = 1), the “set mode local” command will unlock the instrument and the keypad can be used to make changes via the front panel. If the instrument is set to ignore the commands (value = 0), the instrument will respond with “ok” as if the command has been accepted and acted upon, but will not change the instrument lock status (this is for compatibility with systems expecting and “ok” response). Note The instrument will always respond to the command “mode” with the status of the password lock as “mode local” or “mode remote”, regardless of the above setting. ▲ The following example sets the instrument to accept the “set mode local” and “set mode remote” commands. Send: Receive: set allow mode cmd 1 set allow mode cmd 1 ok Table B–7. Allow Mode Command Values Value Allow Mode Command 0 Ignore (default) 1 Accept baud This command reports the current baud rate for the serial port (RS232/RS485). The following example reports that the current baud rate is 9600 baud. Send: Receive: baud baud 9600 set baud rate rate = | 1200 | 2400 | 4800 | 9600 | 19200 | 38400 | 57600 | 115200 | B-56 Model 5030i SHARP Instruction Manual Thermo Fisher Scientific C-Link Protocol Commands Communications Configuration This command sets the instrument baud rate to rate. The following example sets the instrument’s baud rate to 9600. Note After the command is sent, the baud rate of the sending device must be changed to agree with the instrument. ▲ Send: Receive: set baud 9600 set baud 9600 ok dhcp This command reports the current state of use of the Dynamic Host Configuration Protocol (DHCP) as on or off. DHCP is used to assign an IP address to the instrument automatically. The following example shows that DHCP is on. Send: Receive: dhcp dhcp on set dhcp onoff onoff = | on | off | This command enables (on) and disables (off) the DHCP service. When DHCP is set to on, the instrument gets the IP address, the netmask address, and the gateway address from a DHCP server. When DHCP is set to off, the instrument gets these addresses from system memory. The following example sets the DHCP service to on. Note If DHCP is changed from on to off and then the IP address, the netmask address, or the gateway address is changed, you must cycle power to the instrument before the change takes effect. Until you cycle the power, the address assigned by the DHCP server will still be used and reported as the current address. ▲ Send: Receive: set dhcp on set dhcp on ok format This command reports the current reply termination format. The following example shows that the reply format is 00, which means reply with no checksum, according to Table B–8. Send: Receive: Thermo Fisher Scientific format format 00 Model 5030i SHARP Instruction Manual B-57 C-Link Protocol Commands Communications Configuration set format format This command sets the reply termination format, where format is set according to Table B–8. The following example sets the reply termination format to checksum. Send: Receive: set format 01 set format 01 ok Table B–8. Reply Termination Formats Format Reply Termination 00 <CR> 01 <NL> sum xxxx <CR> where xxxx = 4 hexadecimal digits that represent the sum of all the characters (bytes) in the message host name This command reports the host name string. The following example reports the host name is set to iSeries. Send: Receive: host name host name iSeries set host name string This command sets the host name string, where string is 1-13 alphanumeric characters. The following example sets the host name to analyzer01. Send: Receive: set host name analyzer01 set host name analyzer01 ok instr name This command reports the instrument name. The following example reports the instrument name for the Model 5030i. Send: Receive: instr name instr name SHARP Particle Analyzer instrument id This command reports the instrument identification (ID). The following example reports the current setting of the instrument ID. Send: Receive: B-58 Model 5030i SHARP Instruction Manual instrument id instrument id 14 Thermo Fisher Scientific C-Link Protocol Commands Communications Configuration set instrument id value This command sets the instrument ID to value, where value is an integer between 0 and 127 inclusive. The following example shows the instrument ID changed to 12. Note Sending this command via RS-232 or RS-485 will require the host to use the new ID for subsequent commands. ▲ Send: Receive: set instrument id 12 set instrument id 12 ok layout ack This command reports the stale layout/layout change indicator (*) that is attached to each response if the erec layout has changed since the last time erec layout was requested, according to Table B–9. The following example reports that the instrument is configured to do nothing. Send: Receive: layout ack layout ack 0 set layout ack value This command disables the stale layout/layout change indicator (*) that is attached to each response if the erec layout has changed since the last time erec layout was requested, according to Table B–9. Send: Receive: set layout ack set layout ack ok Table B–9. Set Layout Ack Values Value Function 0 Do nothing (default) 1 Append “*” power up mode This command reports the current power up mode setting to either 0 = local/unlocked or 1 = remote/locked, according to Table B–10. The default value is 0; power up in local/unlocked mode. The following example shows that the instrument is configured to power up in the remote/locked mode. Send: Receive: Thermo Fisher Scientific power up mode power up mode 1 Model 5030i SHARP Instruction Manual B-59 C-Link Protocol Commands Communications Configuration set power up mode value This command is used to configure the instrument to power up in the local/unlocked mode (value = 0) or the remote/locked mode (value = 1), according to Table B–10. If the instrument is set to power up in the local/remote mode, the keypad can be used to make changes via the front panel. If the instrument is set to power up in the remote/locked mode, changes can not be made from the front panel. The following example sets the instrument to power up in remote/locked mode. Send: Receive: set power up mode 1 set power up mode 1 ok Table B–10. Power Up Mode Values Value Power up Mode 0 Local/Unlocked Mode (default) 1 Remote/Locked Mode program no This command reports the analyzer’s model information and program version number. Send: Receive: program no program no iSeries 5030i 00.05.37.093 tz This command reports the “tz” timezone string for the NTP server. See “Network Time Protocol Server” in the “Communications Settings” section of the “Operation” chapter for more information. Send: Receive: tz tz EST+5EDT set tz string This command sets the timezone string for the instrument for use with the NTP server, where string is a standard timezone string. Common strings are listed in the “Timezone” screen description in Chapter 3. Send: Receive: B-60 Model 5030i SHARP Instruction Manual set tz EST+5EDT set tz EST+5EDT ok Thermo Fisher Scientific C-Link Protocol Commands I/O Configuration I/O Configuration analog iout range channel This command reports the analog current output range setting for channel, where channel must be between 1 and 6, inclusive. The following example reports current output channel 4 is in the 4-20 mA range, according to Table B–11. This command responds with “feature not enabled” if the I/O expansion board is not detected. Send: Receive: analog iout range 4 analog iout range 4 2 set analog iout range channel range This command sets analog current output channel to the range where channel is between 1 and 6 inclusive, and range is set according to Table B– 11. The following example sets current output channel 4 to the 0-20 mA range. This command responds with “feature not enabled” if the I/O expansion board is not detected. Send: Receive: set analog iout range 4 1 set analog iout range 4 1 ok Table B–11. Analog Current Output Range Values Range Output Range 1 0-20 mA 2 4-20 mA 0 [cannot be set to this, but may report] Undefined analog vin channel This command retrieves the analog voltage input channel data, both the calculated value and the actual voltage. In the following example, the “calculated” value of channel 1 is 75.325 degrees F, volts are 2.796. This command responds with “feature not enabled” if the I/O expansion board is not detected. Send: Receive: analog vin 1 analog vin 1 75.325, 2.796 V analog vout range channel This command reports the analog voltage output channel range, where channel is between 1 and 6 inclusive, according to Table B–12. The following example reports that analog voltage output channel 2 is set to 3 (0-10 V). Thermo Fisher Scientific Model 5030i SHARP Instruction Manual B-61 C-Link Protocol Commands I/O Configuration Send: Receive: analog vout range 2 analog vout range 2 3 set analog vout range channel range This command sets analog voltage output channel to the range, where channel is between 1 and 6 inclusive, and range is set according to Table B– 12. The following example sets channel 2 to the 0-10 V range. Send: Receive: set analog vout range 2 3 set analog vout range 2 3 ok Table B–12. Analog Voltage Output Range Values Range Output Range 1 0-1 V 2 0-100 mV 3 0-10 V 4 0-5 V 0 [cannot be set to this, but may report] Undefined dig in This command reports the status of the digital inputs as a 4-digit hexadecimal string with the most significant bit (MSB) being input 16. Send: Receive: dig in dig in 0xffff din channel This command reports the action assigned to the digital input channel and the index number of the corresponding active state. The following example reports input 1 to be assigned an index number 3 corresponding to action of “PM mode” with the active state being high. Send: Receive: din 1 din 1 3 PM MODE high set din channel index state This command assigns digital input channel (1-16) to activate the action indicated by index (1-12), when the input transitions to the designated state (high or low). Use the “list var din” command to obtain the list of supported index values and corresponding actions. The following example sets the digital input channel 1 to 3 on a low-to-high transition. Send: Receive: B-62 Model 5030i SHARP Instruction Manual set din 1 3 high set din 1 3 high ok Thermo Fisher Scientific C-Link Protocol Commands I/O Configuration dout channel This command reports the index number, output variable and the active state assigned to digital output channel. The following example reports output 4 to be assigned an index number 11 corresponding to action of “flowl alarms”. Send: Receive: dout 4 dout 4 11 FLOW ALARMS open set dout channel index state This command assigns digital output channel to be assigned to the action associated with index, and assigns it an active state of state (open or closed). Use the “list var dout” command to obtain the list of supported index values and corresponding state. The following example sets the digital output channel 4 to state 11. Send: Receive: set dout 4 11 open set dout 4 11 open ok dtoa channel This command reports the outputs of the 6 or 12 Digital to Analog converters, according to Table B–13. The following example shows that the D/A #1 is 97.7% full-scale. Send: Receive: dtoa 1 dtoa 1 97.7% Note If the instrument is in a mode which does not provide a particular output, and that output is selected, the value will be 0.0. ▲ All channel ranges are user definable. If any customization has been made to the analog output configuration, the default selections may not apply. ▲ Table B–13. Default Analog Output Channel Assignments Thermo Fisher Scientific D to A Function Range 1 Voltage Output PM 2 Voltage Output AVG PM 3 Voltage Output Flow 4 Voltage Output Ambient Temperature 5 Voltage Output Flow Temperature 6 Voltage Output Ambient Relative Humidity 7 Current Output PM Model 5030i SHARP Instruction Manual B-63 C-Link Protocol Commands I/O Configuration D to A Function Range 8 Current Output AVG PM 9 Current Output Flow 10 Current Output Ambient Temperature 11 Current Output Flow Temperature 12 Current Output Ambient Relative Humidity list din list dout These commands report the current selection for the digital inputs or the digital outputs in the format. Output no Index number variable name active state. The active state for digital outputs is open or closed. The active state for digital inputs is high or low. Send: Receive: list dout list dout output index variable state 1 5 CONC ALARM open 2 1 LOCAL/REMOTE open 3 3 UNITS open list var aout list var dout list var din list var log These commands report the list of possible index numbers, and the variables (associated with that index number) available for selection in the current mode for analog outputs, digital outputs, digital inputs and datalogging. The index number is used to insert the variable in a field location in a list using “set sp field index”. The following example reports the list of analog outputs, index numbers, and variables. Send: Receive: B-64 Model 5030i SHARP Instruction Manual list var aout list var aout index variable 0 none 1 pm 3 baro 4 vac 6 pflow 8 ambrt 9 srh 11 ambtemp 12 brdtemp 13 ftemp 15 stemp Thermo Fisher Scientific C-Link Protocol Commands I/O Configuration 17 19 28 29 30 32 34 45 50 52 53 frol beta braw araw avgpm mass bzero exfg bref cflg aflg relay stat This command reports the current relay logic as normally “open” or normally “closed,” if all the relays are set to same state, that is all open or all closed. The following example shows that the status of all the relays’ logic is set to normally “open”. Send: Receive: relay stat relay stat open Note If individual relays have been assigned different logic, then the response would be a 4-digit hexadecimal string with the least significant byte (LSB) being relay no 1. ▲ For example: Receive: relay stat 0x0001 (indicates relay no 1 is set to normally open logic, all others are normally closed) Receive: relay stat 0x0005 (indicates relay no 1 and 3 are set to be normally open logic, all others are normally closed) set relay open set relay open value set relay closed set relay closed value These commands set the relay logic to normally open or closed for relay number value, where value is the relay between 1 and 16. The following example sets the relay no 1 logic to normally open. Note If the command is sent without an appended relay number, then all the relays are assigned the set logic of normally open/closed. ▲ Thermo Fisher Scientific Model 5030i SHARP Instruction Manual B-65 C-Link Protocol Commands Record Layout Definition Send: Receive: Record Layout Definition set relay open 1 set relay open 1 ok The erec, lrec, and srec layouts contain the following: ● A format specifier for parsing ASCII responses ● A format specifier for parsing binary responses In addition to these, the erec layout contains: ● A format specifier for producing the front panel display screens Values are read using either the ASCII or binary format specifiers and converted to uniform internal representations (32-bit floats or 32-bit integers). These values are converted into text for display on the screen using the format specifier for the front panel display. Normally, the specifier used to parse a particular datum from the input stream will be strongly related to the specifier used to display it (such as, all of the floating point inputs will be displayed with an 'f' output specifier, and all of the integer inputs will be displayed with a 'd' specifier). Format Specifier for ASCII Responses The first line of the layout response is the scanf-like parameter list for parsing the fields from an ASCII erec response. Parameters are separated by spaces and the line is terminated by a “\n” (the normal line separator character). Valid fields are: %s - parse a string %d - parse a decimal number %ld - parse a long (32-bit) decimal number %f - parse a floating point number %x - parse a hexadecimal number %lx - parse a long (32-bit) hex number %* - ignore the field Note Signed versus unsigned for the integer values does not matter; it is handled automatically. ▲ Format Specifier for Binary Responses The second line of the layout response is the binary parameter list for parsing the fields from a binary response. Parameters MUST be separated by spaces, and the line is terminated by a '\n'. Valid fields are: t - parse a time specifier (2 bytes) D - parse a date specifier (3 bytes) i - ignore one 8-bit character (1 byte) e - parse a 24-bit floating point number (3 bytes: n/x) B-66 Model 5030i SHARP Instruction Manual Thermo Fisher Scientific C-Link Protocol Commands Record Layout Definition E - parse a 24-bit floating point number (3 bytes: N/x) f - parse a 32-bit floating point number (4 bytes) c - parse an 8-bit signed number (1 byte) C - parse an 8-bit unsigned number (1 byte) n - parse a 16-bit signed number (2 bytes) N - parse a 16-bit unsigned number (2 bytes) m - parse a 24-bit signed number (3 bytes) M - parse a 24-bit unsigned number (3 bytes) l - parse a 32-bit signed number (4 bytes) L - parse a 32-bit unsigned number (4 bytes) There is an optional single digit d which may follow any of the numeric fields, which indicates that after the field has been parsed out, the resulting value is to be divided by 10^d. Thus the 16-bit field 0xFFC6 would be interpreted with the format specifier 'n3' as the number -0.058. Format Specifier for Erec Layout The subsequent lines in the erec layout response describe the appearance of the full panel. The full instrument panel as it appears on the screen has two columns of lines. Each line is composed of three major components: (1) a text field, (2) a value field, and (3) a button. None of these three components is required. The text field contains statically displayed text. The value field displays values which are parsed out of the response to a erec command. It also displays, though background changes, alarm status. The button, when pressed, triggers input from either a dialog box or a selection list. There are five kinds of buttons, B, I, L, T, and N. Each line in the layout string corresponds to one line on the display. The layout string describes each of the three major fields as well as translation mechanisms and corresponding commands. Thermo Fisher Scientific Text The first field in the layout string is the text. It is delimited by a ':'. The string up to the first ':' will be read and inserted in the text field of the line. Value String This is followed by a possible string enclosed in quotes that is used to place a string into the value field. Value Source The value source, which is the item (or word) number in the DATA/EREC response, appears next. This is followed by an optional bitfield designator. The datum identified by the value source can be printed as a string 's', hexadecimal 'x', decimal 'd', floating point 'f', or binary 'b' number. Model 5030i SHARP Instruction Manual B-67 C-Link Protocol Commands Record Layout Definition Typically, bitfield extractions are only done for decimal or hexadecimal numbers. Floating-point numbers can be followed with an optional precision specifier which will be used as an argument to printf's %f format (for example, a field of '4' would be translated into the printf command of '%.3f'). Alternately, the special character '*' can precede the precision specifier; this causes an indirection on the precision specifier (which now becomes a field number). This is useful when formatting, for example, numbers which have varying precision depending on the mode of the instrument. Binary numbers can also have an optional precision specifier which is used to determine how many bits to print. For example, the specifier 'b4' will print the lowest four bits of the parsed number. There are serious restrictions on where an 's' field may appear: currently sources 1 and 2 must be 's', and no others may be 's'. Alarm Information The value source is followed by optional alarm information, indicated by a commercial at sign '@' with a source indicator and a starting bit indicator. All alarm information is presumed to be two bits long (low and high). The bitfield extraction is performed on the integer part of the source. Typical alarm information would appear as '@6.4'. Translation Table Then, there appears an optional translation table within braces '{}'. This is a string of words separated by spaces. An example translation table would be '{Code_0 Code_1 Code_2 Code_3}'. The value, once extracted, is used as a zero-based index into the translation table to determine the string to display. Selection Table Then there appears an optional selection table within parentheses '(...)'. This is a string of numbers separated by spaces '(0 1)'. The selection table lists the translation table entries which the user may select from when setting the parameter. This is not necessarily the same as the entries which may be displayed. Button Designator Then there appears an optional button designator. This will be one of 'B', 'I', 'L', 'T', or 'N'. B- Indicates a button which pops up an input dialog prompting the user for a new value using the designated input format. The input format is specified from the 'B' through the subsequent semicolon. B-68 Model 5030i SHARP Instruction Manual Thermo Fisher Scientific C-Link Protocol Commands Record Layout Definition I—Indicates a button which pops up a selection list with input translation. That is, the values read are translated before they are compared to the selection list options. L—Indicates a button which pops up a selection list without any translation. The output value is the number of the selected option. T—Indicates a button which pops up a selection list with output translation. The number of the option selected is used as an index into the translation table to generate an output string. N—Indicates a button which only sends the subsequent command to the instrument. No user-prompting happens. The following string through an optional ‘|’ or the end of the line is the command which is to be sent to the instrument upon the completion of the button selection. The command string should normally contain print-style formatting to include the user input. If a ‘|’ is present, it indicates a command which is sent to the instrument upon successful completion of the button command to update the value field. Examples Some examples ('\n' is the C syntax for an end-of-line character): 'Concentrations\n' This is a single text-only line. '\n' This is a single blank line. ' NO:3s\n' This is a line which appears slightly indented. The text field is 'NO', the value is taken from the third element of the data response, and interpreted as a string. ' NO:18sBd.ddd;set no coef %s\n' This is a line which also appears slightly indented. The next field is also 'NO', but the value is taken from the eighteenth element of the data response, again interpreted as a string. A button appears on this line which, when pressed, pops up an input dialog which will state "Please enter a new value for NO using a d.ddd format." The string entered by the user is used to construct the output command. If the user enters, for example, '1.234', the constructed command will be 'set no coef 1.234'. Thermo Fisher Scientific Model 5030i SHARP Instruction Manual B-69 C-Link Protocol Commands Record Layout Definition ' NO:21f{Code_0 Code_1 Code_2 Code_3 Code_4 Code_5 Code_6 Code_7 Code_8 Code_9 Code_10 Code_11}Lset range no %d\n' This is a line which appears slightly indented, the title is again 'NO', and the value is the twenty-first element of the data response, interpreted as a floating-point number. There is a no-translation button which creates a selection list of twelve "Code nn" options. The number of the user selection is used to create the output command. 'Mode:6.12-13x{local remote service service}(0 1)Tset mode %s\n' This is a line which has a title of 'Mode' and value taken from the sixth field of the data response. There is a bitfield extraction of bits 12 through 13 from the source (the value type is not important here because the value is being translated to an output string). Once the bits have been extracted, they are shifted down to the bit-zero position. Thus, the possible values of this example will be 0 through 3. The translation list shows the words which correspond to each input value, the zero index value appearing first (0 -> local, 1 -> remote, etc.). The selection list shows that only the first two values, in this case, are to be shown to the user when the button is pressed. The 'T' button indicates full translation, input code to string, and user selection number to output string. '\xC' This is a line that starts a new column (the \xC or ^L). ' Comp:6.11x{off on}Tset temp comp %s\n' This shows that the bitfield end (the second part of a bitfield specification) is optional. The bitfield will be one bit long, starting in this case at the eleventh bit. 'Background:7f*8Bd.ddd;set o3 bkg %s\n' This shows the use of indirect precision specifiers for floating point displays. The background value is taken from the 7th element, and the precision specifier is taken from the 8th. If the asterisk were not present, it would indicate instead that 8 digits after the decimal point should be displayed. B-70 Model 5030i SHARP Instruction Manual Thermo Fisher Scientific Appendix C MODBUS Protocol This appendix provides a description of the MODBUS Protocol Interface and is supported both over RS-232/485 (RTU protocol) as well as TCP/IP over Ethernet. The MODBUS commands that are implemented are explained in detail in this document. The MODBUS protocol support for the iSeries enables the user to perform the functions of reading the various concentrations and other measurement values, read the status of the digital outputs of the analyzer, and to trigger or simulate the activation of a digital input to the instrument. This is achieved by using the supported MODBUS parameters listed below. Up to three simultaneous connections are supported over Ethernet. For details of the Model 5030i MODBUS Protocol specification, see the following topics: ● “Serial Communication Parameters” on page C-1 ● “TCP Communication Parameters” on page C-2 ● “Application Data Unit Definition” on page C-2 ● “Function Codes” on page C-3 ● “MODBUS Parameters Supported” on page C-8 Additional information on the MODBUS protocol can be obtained at http://www.modbus.org. References are from MODBUS Application Protocol Specification V1.1a MODBUS-IDA June 4, 2004. Serial Communication Parameters Thermo Fisher Scientific The following are the communication parameters that are used to configure the serial port of the iSeries to support MODBUS RTU protocol. Number of Data bits : 7 or 8 Number of Stop bits : 1 or 2 Parity : None, Odd, or Even Data rate : 1200 to 115200 Baud (9600 is default) Model 5030i SHARP Instruction Manual C-1 MODBUS Protocol TCP Communication Parameters TCP Communication Parameters iSeries instruments support the MODBUS/TCP protocol. The register definition is the same as for the serial interface. Up to three simultaneous connections are supported over Ethernet. TCP connection port for MODBUS : 502 Application Data Unit Definition Here are the MODBUS ADU (Application Data Unit) formats over serial and TCP/IP: Serial: Slave Address Slave Address Function Code Data TCP/IP: MBAP Header Function Code Data Error Check The MODBUS slave address is a single byte in length. This is the same as the instrument ID used for C-Link commands and can be between 1 and 127 decimal (i.e. 0x01 hex to 0x7F hex). This address is only used for MODBUS RTU over serial connections. Note Device ID ‘0’, used for broadcast MODBUS commands, is not supported. Device IDs 128 through 247 (i.e. 0x80 hex to 0xF7 hex) are not supported because of limitations imposed by C-Link. ▲ MBAP Header C-2 Model 5030i SHARP Instruction Manual In MODBUS over TCP/IP, a MODBUS Application Protocol Header (MBAP) is used to identify the message. This header consists of the following components: Transaction Identifier 2 Bytes 0x0000 to 0xFFFF (Passed back in response) Protocol Identifier 2 Bytes 0x00 (MODBUS protocol) Length 2 Bytes 0x0000 to 0xFFFF (Number of following bytes) Unit Identifier 1 Byte 0x00 to 0xFF (Passed back in response) Thermo Fisher Scientific MODBUS Protocol Function Codes Function Code The function code is a single byte in length. The following function codes are supported by the instrument: Read Coils : 0x01 Read Inputs : 0x02 Read Holding Registers : 0x03 Read Input Registers : 0x04 Force (Write) Single Coil : 0x05 Read Exception Status : 0x06 If a function code is received that is not in this list, an invalid function exception is returned. Data Error Check Function Codes (0x01/0x02) Read Coils/Read Inputs The data field varies depending on the function. For more description of these data fields, see “Function Codes” below. In MODBUS over serial, an error check is included in the message. This is not necessary in MODBUS over TCP/IP because the higher-level protocols ensure error-free transmission. The error check is a two-byte (16 bit) CRC value. This section describes the various function codes that are supported by the Model 5030i. Read Coils/Inputs read the status of the digital outputs (relays) in the instrument. Issuing either of these function codes will generate the same response. These requests specify the starting address, i.e. the address of the first output specified, and the number of outputs. The outputs are addressed starting at zero. Therefore, outputs numbered 1–16 are addressed as 0–15. The outputs in the response message are packed as one per bit of the data field. Status is indicated as 1 = Active (on) and 0 = Inactive (off). The LSB of the first data byte contains the output addressed in the query. The other Thermo Fisher Scientific Model 5030i SHARP Instruction Manual C-3 MODBUS Protocol Function Codes outputs follow toward the high end of this byte, and from low order to high order in subsequent bytes. If the returned output quantity is not a multiple of eight, the remaining bits in the final data byte will be padded with zeros (toward the high order end of the byte). The Byte Count field specifies the quantity of complete bytes of data. Note The values reported may not reflect the state of the actual relays in the instrument, as the user may program these outputs for either active closed or open. ▲ Request Function Code 1 Byte 0x01 or 0x02 Starting Address 2 Bytes 0x0000 to maximum allowed by instrument Quantity of Outputs 2 Bytes 1 to maximum allowed by instrument Unit Identifier 1 Byte 0x00 to 0xFF (Passed back in response) Function Code 1 Byte 0x01 or 0x02 Byte Count 1 Byte N* Output Status N Byte N = N or N+1 Response *N = Quantity of Outputs / 8, if the remainder not equal to zero, then N=N+1 Error Response Function Code 1 Byte 0x01 or 0x02 Exception Code 1 Byte 01=Illegal Function, 02=Illegal Address, 03=Illegal Data, 04=Slave Device Failure C-4 Model 5030i SHARP Instruction Manual Thermo Fisher Scientific MODBUS Protocol Function Codes Here is an example of a request and response to read outputs 2–15: Request Field Name (Hex) Function 0x01 Starting Address Hi 0x00 Starting Address Lo 0x02 Quantity of Outputs Hi 0x00 Quantity of Outputs Lo 0x0D Response Field Name (Hex) Function 0x01 Byte Count 0x03 Output Status 2–10 0xCD Output Status 11–15 0x0A The status of outputs 2–10 is shown as the byte value 0xCD, or binary 1100 1101. Output 10 is the MSB of this byte, and output 2 is the LSB. By convention, bits within a byte are shown with the MSB to the left and the LSB to the right. Thus, the outputs in the first byte are ’10 through 2’, from left to right. In the last data byte, the status of outputs 15-11 is shown as the byte value 0x0A, or binary 0000 1010. Output 15 is in the fifth bit position from the left, and output 11 is the LSB of this byte. The four remaining high order bits are zero filled. (0x03/0x04) Read Holding Registers/Read Input Registers Read Holding/Input Registers reads the measurement data from the instrument. Issuing either of these function codes will generate the same response. These functions read the contents of one or more contiguous registers. These registers are 16 bits each and are organized as shown below. All of the values are reported as 32-bit IEEE standard 754 floating point format. This uses 2 sequential registers, least significant 16 bits first. The request specifies the starting register address and the number of registers. Registers are addressed starting at zero. Therefore, registers numbered 1–16 are addressed as 0–15. The register data in the response message are packed as two bytes per register, with the binary contents right justified within each byte. For each register, the first byte contains the high order bits and the second contains the low order bits. Thermo Fisher Scientific Model 5030i SHARP Instruction Manual C-5 MODBUS Protocol Function Codes Request Function Code 1 Byte 0x03 or 0x04 Starting Address 2 Bytes 0x0000 to maximum allowed by instrument Quantity of Registers 2 Bytes 1 to maximum allowed by instrument Function Code 1 Byte 0x03 or 0x04 Byte Count 1 Byte 2 x N* Register Value N* x 2 Bytes N = N or N+1 Function Code 1 Byte Function code + 0x80 Exception Code 1 Byte 01=Illegal Function, 02=Illegal Address, Response *N = Quantity of Registers Error Response 03=Illegal Data, 04=Slave Device Failure Here is an example of a request and response to read registers 10–13: Request Field Name (Hex) Function 0x03 Starting Address Hi 0x00 Starting Address Lo 0x09 No. of Registers Hi 0x00 No. of Registers Lo 0x04 Response C-6 Model 5030i SHARP Instruction Manual Field Name (Hex) Function 0x03 Byte Count 0x06 Register Value Hi (10) 0x02 Register Value Lo (10) 0x2B Register Value Hi (11) 0x00 Register Value Lo (11) 0x00 Thermo Fisher Scientific MODBUS Protocol Function Codes Register Value Hi (12) 0x00 Register Value Lo (12) 0x64 Register Value Hi (13) 0x00 Register Value Lo (13) 0x64 The contents of register 10 are shown as the two byte values of 0x02 0x2B. Then contents of registers 11–13 are 0x00 0x00, 0x00 0x64 and 0x00 0x64, respectively. (0x05) Force (Write) Single Coil The Force (Write) Single Coil function simulates the activation of the digital inputs in the instrument, which triggers the respective action. This function code is used to set a single action to either ON or OFF. The request specifies the address of the action to be forced. Actions are addressed starting at zero. Therefore, action number 1 is addressed as 0. The requested ON/OFF state is specified by a constant in the request data field. A value of 0xFF00 requests the action to be ON. A value of 0x0000 requests it to be OFF. All other values are illegal and will not affect the output. The normal response is an echo of the request, returned after the state has been written. Note This function will not work if the instrument is in service mode. ▲ Request Function Code 1 Byte 0x05 Starting Address 2 Bytes 0x0000 to maximum allowed by instrument Output Value 2 Bytes 0x0000 or 0xFF00 Function Code 1 Byte 0x05 Starting Address 2 Bytes 0x0000 to maximum allowed by instrument Output Value 2 Bytes 0x0000 or 0xFF00 Function Code 1 Byte Function code + 0x80 Exception Code 1 Byte 01=Illegal Function, 02=Illegal Address, Response Error Response 03=Illegal Data, 04=Slave Device Failure Thermo Fisher Scientific Model 5030i SHARP Instruction Manual C-7 MODBUS Protocol MODBUS Parameters Supported Here is an example of a request to write Coil 5 ON: Request Field Name (Hex) Function 05 Output Address Hi 00 Output Address Lo 05 Output Value Hi FF Output Value Lo 00 Response MODBUS Parameters Supported Field Name (Hex) Function 05 Output Address Hi 00 Output Address Lo 05 Output Value Hi FF Output Value Lo 00 Table C–1 through Table C–3 lists the MODBUS addresses supported for the Model 5030i. IMPORTANT NOTE The addresses in the following tables are Protocol Data Unit (PDU) addresses. Verify the coil number on your MODBUS master to ensure that it matches the coil number on the instrument. ▲ Note Coil status 1 indicates active state. ▲ Table C–1. Read Coils for 5030i C-8 Model 5030i SHARP Instruction Manual Coil Number Status 0 INVALID 1 LOCAL/REMOTE 2 SERVICE 3 NOT USED 4 GEN ALARM 5 CONC ALARM 6 INST ALARMS Thermo Fisher Scientific MODBUS Protocol MODBUS Parameters Supported Coil Number Status 7 BETA DETECTOR ALARMS 8 NEPHELOMETER ALARMS 9 RH/TEMP ALARMS 10 PRES/VAC ALARMS 11 FLOW ALARMS 12 NOT USED 13 NOT USED 14 NOT USED 15 EXT ALARM 1 16 EXT ALARM 2 17 EXT ALARM 3 IMPORTANT NOTE The addresses in the following tables are Protocol Data Unit (PDU) addresses. Verify the register number on your MODBUS master to ensure that it matches the register number on the instrument. ▲ Note For additional information on how to read registers and interpret the data, refer to the “(0x03/0x04) Read Holding Registers/Read Input Registers” section in this appendix. ▲ Table C–2. Read Registers for 5030i Thermo Fisher Scientific Register Number Variable 0 INVALID 1&2 PMa 3&4 NOT USED 5&6 BARO PRES 7&8 VACUUM 9 & 10 NOT USED 11 & 12 FLOW PRES 13 & 14 NOT USED 15 & 16 AMB RH 17 & 18 SAMP RH 19 & 20 NOT USED 21 & 22 AMB TEMP Model 5030i SHARP Instruction Manual C-9 MODBUS Protocol MODBUS Parameters Supported C-10 Model 5030i SHARP Instruction Manual Register Number Variable 23 & 24 BOARD TEMP 25 & 26 FLOW TEMP 27 & 28 NOT USED 29 & 30 NOT USED 31 & 32 NOT USED 33 & 34 FLOW VOL 35 & 36 NOT USED 37 & 38 BETA 39 & 40 ANALOG IN 1 41 & 42 ANALOG IN 2 43 & 44 ANALOG IN 3 45 & 46 ANALOG IN 4 47 & 48 ANALOG IN 5 49 & 50 ANALOG IN 6 51 & 52 ANALOG IN 7 53 & 54 ANALOG IN 8 55 & 56 BETA RAW 57 & 58 ALPHA RAW 59 & 60 AVG PM 61 & 62 NOT USED 63 & 64 MASS 65 & 66 NOT USED 67 & 68 BETA ZERO 69 & 70 NOT USED 71 & 72 NEPH 73 & 74 NOT USED 75 & 76 NOT USED 77 & 78 NOT USED 79 & 80 NOT USED 81 & 82 NOT USED 83 & 84 SHARP 85 & 86 NOT USED 87 & 88 AVG SHARP 89 & 90 NOT USED Thermo Fisher Scientific MODBUS Protocol MODBUS Parameters Supported Register Number Variable 91 & 92 EXT ALARMS 93 & 94 NEPH TEMP 95 & 96 NEPH RH 97 & 98 NEPH IRED 99 & 100 NEPH REF 101 & 102 BETA REF 103 & 104 NOT USED 105 & 106 COMMON FLAGS 107 & 108 BETA DETECTOR FLAGS 109 & 110 NOT USED 111 & 112 COMP MASS 113 & 114 NOT USED 115 & 116 AVG NEPH IMPORTANT NOTE The addresses in the following tables are Protocol Data Unit (PDU) addresses. Verify the coil number on your MODBUS master to ensure that it matches the coil number on the instrument. ▲ Note Writing 1 to the coil number shown in the following table will initiate the “action triggered” listed in the table. This state must be held for at least 1 second to ensure the instrument detects the change and triggers the appropriate action. ▲ Note The coils within each coil group in the following table are mutually exclusive and will not be triggered if there is conflict. Before you assert (1) one coil in a group, make sure the other coils in the group are de-asserted (0). ▲ Table C–3. Write Coils for 5030i Thermo Fisher Scientific Coil Number Action Triggered 100 INVALID 101 NOT USED 102 NOT USED 103 NOT USED 104 AOUTS TO ZERO 105 AOUTS TO FS Model 5030i SHARP Instruction Manual C-11 MODBUS Protocol MODBUS Parameters Supported C-12 Model 5030i SHARP Instruction Manual Coil Number Action Triggered 106 FILTER TAPE COUNT RESET TO ZERO 107 FILTER TAPE CNTRL 108 PUMP CNTRL ON/OFF 109 TEMP COMP ON/OFF 110 PRES COMP ON/OFF 111 HEATER ON/OFF 112 HTR RH/TEMP CNTRL 113 EXT ALARM 1 114 EXT ALARM 2 115 EXT ALARM 3 Thermo Fisher Scientific Appendix D Gesytec (Bayern-Hessen) Protocol This appendix provides a description of the Gesytec (Bayern-Hessen or BH) Protocol Interface and is supported both over RS-232/485 as well as TCP/IP over Ethernet. The Gesytec commands that are implemented are explained in detail in this document. The Gesytec protocol support for the iSeries enables the user to perform the functions of reading the various concentrations and to trigger the instrument to be in sample/zero/span mode if valid for that instrument. This is achieved by using the supported Gesytec commands listed below. Up to three simultaneous connections are supported over Ethernet. For details of the Model 5030i Gesytec Protocol specification, see the following topics: Serial Communication Parameters Thermo Fisher Scientific ● “Serial Communication Parameters” on page D-1 ● “TCP Communication Parameters” on page D-2 ● “Instrument Address” on page D-2 ● "Abbreviations Used” on page D-2 ● “Basic Command Structure” on page D-2 ● “Block Checksum” on page D-3 ● “Gesytec Commands” on page D-3 The following are the communication parameters that are used to configure the serial port of the iSeries to support Gesytec protocol. Number of Data bits : 7 or 8 Number of Stop bits : 1 or 2 Parity : None, Odd, or Even Data rate : 1200 to 115200 Baud (9600 is default) Model 5030i SHARP Instruction Manual D-1 Gesytec (Bayern-Hessen) Protocol TCP Communication Parameters TCP Communication Parameters iSeries instruments support the Gesytec protocol over TCP/IP. The register definition is the same as for the serial interface. Up to three simultaneous connections are supported over Ethernet. TCP connection port for Gesytec: Instrument Address 9882 The Gesytec instrument address has a value between 0 and 127 and is represented by a 3 digit ASCII number with leading zeros or leading spaces if required (e.g. instrument address of 1 is represented as 001 or <SP><SP>1). The default instrument address is 14. The instrument address is the same as the Instrument ID used for C-Link and MODBUS commands. This can be set via the front panel. The instrument address is represented by <address> in the examples throughout this document. Note Device IDs 128 through 247 are not supported because of limitations imposed by the C-Link protocol. ▲ Abbreviations Used The following is a list of abbreviations used in this document: <CR> is abbreviation for Carriage Return (ASCII code 0x0D) <STX> is abbreviation for Start of Text (ASCII code 0x02) <ETX> is abbreviation for End of Text (ASCII code 0x03) <SP> is abbreviation for space (ASCII code 0x20) Basic Command Structure The following is the basic structure of a Gesytec command: <STX>Command text<ETX><BCC> OR <STX>Command text<CR> Each command is framed by control characters, <STX> at the start and terminated with either <ETX> or <CR>. If a command is terminated with <ETX>, then two additional characters <BCC> is attached after <ETX>. This is the block checksum. Block Checksum Characters <BCC> may be added to the command to prevent processing invalid commands. D-2 Model 5030i SHARP Instruction Manual Thermo Fisher Scientific Gesytec (Bayern-Hessen) Protocol Block Checksum Characters <BCC> Block Checksum Characters <BCC> The Block Checksum Characters are calculated beginning with a seed value of 00000000, binary (0x00), and bitwise exclusive ORing with each of the characters of the command string (or response) including the framing characters <STX> and <ETX>. The checksum works as an error check. The command terminator determines the presence or absence of <BCC>. If a command is terminated by <ETX> then the next two characters are the checksum, if the command is terminated with <CR> no checksum is attached. The block checksum is represented by two characters, which represent a 2 digit hex number (1byte) (e.g. 1 byte 0xAB hex checksum will be represented by the two characters ‘A’ & ‘B’). The checksum is referred to as <BCC> throughout this document. Gesytec Commands Instrument Control Command (ST) The following commands are supported by the Gesytec protocol: ● Instrument Control Command (ST) ● Data Sampling/Data Query Command (DA) There is one control command supported by the Gesytec protocol. This <control command> is a single letter, which triggers an action in the instrument. These commands are active only when service mode is inactive and the zero/span option is present. Command ‘N’ initiates a filter change. The following are the different acceptable formats of the ST command: <STX>ST<address><control command><ETX><BCC> OR <STX>ST<address><control command><CR> OR <STX>ST<address><SP><control command><CR> OR <STX>ST<address><SP><control command><ETX><BCC> The <address> is optional, which means it can be left out completely. The <address>, if present, must match the Instrument Address. Additional space can be present after the <address>. Thermo Fisher Scientific Model 5030i SHARP Instruction Manual D-3 Gesytec (Bayern-Hessen) Protocol Gesytec Commands If the received command does not satisfy the above formats, or if the <address> does not match the Instrument Address, the command is ignored. This is a sample command to switch the instrument to initiate a filter change, instrument address 14: <STX>ST014<SP>N<CR> Data Sampling/Data Query Command (DA) This command initiates a data transfer from the instrument. The instrument responds with measurement data, which depends on the range mode and is listed in “Measurements reported in response to DA command” below. The command structure for a data query command is as follows: <STX>DA<address><ETX><BCC> The <address> is optional, which means it can be left out completely. The <address>, if present, must match the Instrument Address. Additional space can be present after the <address>. If the <address> is left out, then no space is allowed in the query string. A command with no address is also a valid command. The following are the different acceptable formats of the DA command with Instrument Address 14: <STX>DA<CR> <STX>DA014<CR> <STX>DA<SP><14<ETX><BCC> <STX>DA<ETX><BCC> The data query string is valid and will be answered with data transmission only if the command starts with <STX>, which is followed by the characters DA, and the <address> (if present) matches the Instrument Address, and the command is terminated with either <CR> with no checksum or <ETX>, followed by the correct checksum <BCC>. D-4 Model 5030i SHARP Instruction Manual Thermo Fisher Scientific Gesytec (Bayern-Hessen) Protocol Gesytec Commands Sample Data Reply String in response to Data Query Command (DA): In response to a valid data query command, the instrument responds in the following format: <STX>MD09<SP><address><SP><measured value1><SP><status><SP><SFKT><SP><address+1><SP><measured value2><SP ><status><SP><SFKT><ETX><BCC> The response uses the same command terminators as used by the received command, i.e. if the received command was terminated with a <CR> then the response is terminated with <CR>, and if the command was terminated with a <ETX><BCC>, then the response is terminated with<ETX> and the computed checksum <BCC>. The 09 after the MD indicates that nine measurements are present in the reply string, 10 for ten measurements and so on. This will also determine the length of the reply string. <address> is the Instrument Address. Each subsequent measurement attached to the response will have the <address + X>, where X keeps incrementing by 1 for each measurement included. <measured value> is the concentration value in currently selected gas units, represented as exponential representation with 4 characters mantissa and 2 characters exponent, each with sign. Mantissa: sign and 4 digits. The decimal point is assumed to be after the first digit and is not transmitted. Exponent: sign and 2 digits. Example: -5384000.0 is represented as -5384+06 +0.04567 is represented as +4567-02 <status>: is formed by < operating status > and < error status > and separated by a space, i.e.: <operating status><SP><error status> Each of the two (<operating status> and <error status>) are formed by two characters, each representing a 2 digit hex number which is one byte (8 Bits) operation status and one byte (8 Bits) error status. These two bytes contain the information about the main operating conditions of the instrument at that instant. For details on how to interpret the status bytes, refer to Table D–1 and Table D–2 below. <SFKT>: is the space provided for future use for special function. It currently contains a string of ten 0’s, i.e. <0000000000>. Thermo Fisher Scientific Model 5030i SHARP Instruction Manual D-5 Gesytec (Bayern-Hessen) Protocol Gesytec Commands The Gesytec serial number defaults to zero. To set the Gesytec serial number select Main Menu > Instrument Controls > Communication Settings > Gesytec Serial No. Example of response to DA command from an instrument with Gesytec serial number set to 000. The Gesytec serial number is bold in the example. Gesytec Protocol with transmission of three concentrations (Instrument ID is 1, Operation Status is 03, Error Status is 04): Data Query String: <STX>DA<CR> Reply String: <STX>MD03<SP>001<SP>+2578+01<SP>03 <SP>04<SP>0000000000 <SP>002 <SP> ↑ ↑ Address First Concentration(E-format)=25.78 ↑ Address+1 +5681+00<SP>03<SP>04<SP>0000000000<SP>003<SP>+1175+01<SP>03<SP>04<SP ↑ Second Concentration = 5.681 ↑ Address+2 ↑ Third Concentration=11.75 0000000000<SP><CR> Example of response to DA command from an instrument with Gesytec serial number set to 123. The Gesytec serial number is bold in the example. Gesytec Protocol with transmission of three concentrations (Instrument ID is 1, Operation Status is 03, Error Status is 04): Data Query String: <STX>DA<CR> Reply String: <STX>MD03<SP>001<SP>+2578+01<SP>03 <SP>04<SP>1230000000 <SP>002 <SP> ↑ ↑ Address First Concentration(E-format)=25.78 ↑ Address+1 +5681+00<SP>03<SP>04<SP>0000000000<SP>003<SP>+1175+01<SP>03<SP>04<SP ↑ Second Concentration = 5.681 ↑ Address+2 ↑ Third Concentration=11.75 1230000000<SP><CR> The attached concentrations are in the selected gas units. The measurements that are attached to the response, if not valid in a particular mode, will report a value of 0.0. D-6 Model 5030i SHARP Instruction Manual Thermo Fisher Scientific Gesytec (Bayern-Hessen) Protocol Gesytec Commands Measurements reported in response to DA command Thermo Fisher Scientific The following 14 measurements reported in response to DA command for the Model 5030i include: ● SHARP ● PM ● Nephelometer ● Volumetric Flow ● Ambient Temperature ● Sample Temperature ● Ambient RH ● Sample RH ● Flow Pressure ● Vacuum Pressure ● Barometric Pressure ● Average SHARP ● Average PM ● Average Neph Model 5030i SHARP Instruction Manual D-7 Gesytec (Bayern-Hessen) Protocol Gesytec Commands Operating and Error Status See Table D–1 for operating status and Table D–2 for error status for the Model 5030i. Table D–1. Operating Status for Model 5030i D7 D6 D5 D4 D3 D2 D1 D0 Æ Bit 8 7 6 5 4 3 2 1 Æ Hex-value 80 40 20 10 08 04 02 01 MSB LSB Operating status: Service Mode (On) 0 0 0 0 0 0 0 1 No Password Protect 0 0 0 0 0 0 1 0 Pump (Off) 0 0 0 0 0 1 0 0 Heater (Off) 0 0 0 0 1 0 0 0 Filter Change 0 0 0 1 0 0 0 0 Nephelometer Zero 0 0 1 0 0 0 0 0 Nephelometer Standby 0 1 0 0 0 0 0 0 Not Used 1 0 0 0 0 0 0 0 Table D–2. Error Status for Model 5030i D7 D6 D5 D4 D3 D2 D1 D0 Æ Bit 8 7 6 5 4 3 2 1 Æ Hex-value 80 40 20 10 08 04 02 01 MSB LSB Error status: D-8 Model 5030i SHARP Instruction Manual Filter Tape Cntr Alarm 0 0 0 0 0 0 0 1 Filter Change 0 0 0 0 0 0 1 0 Beta Cnts Alarm 0 0 0 0 0 1 0 0 Neph Brd Alarm 0 0 0 0 1 0 0 0 Detector Board Status Alarm 0 0 0 1 0 0 0 0 Motherboard Status Alarm 0 0 1 0 0 0 0 0 Flow Alarm 0 1 0 0 0 0 0 0 Nephelometer Reference Voltage Alarm 1 0 0 0 0 0 0 0 Thermo Fisher Scientific Appendix E ESM Protocol Commands This appendix provides a description of the ESM Protocol commands (from the prior FH62 platform) that can be used to remotely control a Model 5030i instrument using a host device such as a PC or a datalogger. ESM protocol may be used over RS-232, RS-485 or over Ethernet. ESM functions can be accessed over Ethernet using TCP port 9884. Up to three simultaneous connections per protocol may be made over Ethernet. ESM Commands Supported Thermo Fisher Scientific Table E–1 through Table E–3 lists the ESM commands supported for the Model 5030i. Table E–1. Read Commands for 5030i Command Description C3 PM conc always always μg/m³ C2 Neph conc μg/m³ C SHARP conc μg/m³ H3 Avg PM conc always μg/m³ H2 Avg Neph conc μg/m³ HT Avg SHARP conc μg/m³ JB temperature sampling head–ambient temp JD temperature inside of the flow meter orifice–flow temp JF different pressure of the air flow measuring module in Pa JG low pressure suction chamber JH barometer in hPa JI air flow sampling head–volumetric flow JJ norm air flow (273K, 1013hPa) JR relative humidity value (%RH) JS sample relative humidity value (%RH) m1 non filtered mass in μg or mg based on units selected o reports “offline” in service mode, “online” if NOT in service mode Model 5030i SHARP Instruction Manual E-1 ESM Protocol Commands ESM Commands Supported Command Description UA beta count rate (1/s) UB beta zero count rate (1/s) UC alpha count rate (1/s) UD alpha zero count rate (1/s) UQ radon-EEC activity concentration (Bq/m³) US Read neph (coef factor) ? read device address–instrument ID # flags–need nephelometer alarms Table E–2. Write Commands for 5030i Command Description d4 baud rate d7 device address–instrument ID K4 concentration factor KB filter change dust load in μg KD filter change cycle in hours KG external heating control 0=off 1=RH control 2=TEMP control KH set point air flow regulation in l/h KN 0=temp comp on pres comp off 1=temp comp off pres comp off KS nephelometer coef factor KU establishes the RH target value KT establishes the temp target value K$ norm-Pressure K% norm-Temp Y$ write parameters to EEPROM Table E–3. Control Commands for 5030i E-2 Model 5030i SHARP Instruction Manual Command Description A pump off Thermo Fisher Scientific ESM Protocol Commands ESM Commands Supported Thermo Fisher Scientific Command Description E pump on F filter change Model 5030i SHARP Instruction Manual E-3