1
PX Developer Version 1
Operating Manual
(Monitor Tool)
-SW1D5C-FBDQ-E
-SW1D5C-FBDQMON-E
SAFETY PRECAUTIONS
(Always read these instructions before using this product.)
Before using this product, thoroughly read this manual and the relevant manuals introduced in this manual
and pay careful attention to safety and handle the products properly.
The precautions given in this manual are concerned with this products. For the safety precautions of the
programmable controller system, refer to the User’s Manual for the CPU module.
In this manual, the safety precautions are ranked as " ! WARNING " and " ! CAUTION".
!
WARNING
Indicates that incorrect handling may cause hazardous conditions,
resulting in death or severe injury.
!
CAUTION
Indicates that incorrect handling may cause hazardous conditions,
resulting in minor or moderate injury or property damage.
Note that the ! CAUTION level may lead to serious consequences according to the circumstances.
Always follow the precautions of both levels because they are important for personal safety.
Please save this manual to make it accessible when required and always forward it to the end user.
[Startup/Maintenance Precautions]
CAUTION
The online operations have to be executed after the manual has been carefully read and the safety
has been ensured.
Failure to do so may cause a miss operation which results in machine damage or an accident.
A-1
A-1
CONDITIONS OF USE FOR THE PRODUCT
(1) Mitsubishi programmable controller ("the PRODUCT") shall be used in conditions;
i) where any problem, fault or failure occurring in the PRODUCT, if any, shall not lead to any major or
serious accident; and
ii) where the backup and fail-safe function are systematically or automatically provided outside of the
PRODUCT for the case of any problem, fault or failure occurring in the PRODUCT.
(2) The PRODUCT has been designed and manufactured for the purpose of being used in general
industries.
MITSUBISHI SHALL HAVE NO RESPONSIBILITY OR LIABILITY (INCLUDING, BUT NOT LIMITED
TO ANY AND ALL RESPONSIBILITY OR LIABILITY BASED ON CONTRACT, WARRANTY, TORT,
PRODUCT LIABILITY) FOR ANY INJURY OR DEATH TO PERSONS OR LOSS OR DAMAGE TO
PROPERTY CAUSED BY the PRODUCT THAT ARE OPERATED OR USED IN APPLICATION NOT
INTENDED OR EXCLUDED BY INSTRUCTIONS, PRECAUTIONS, OR WARNING CONTAINED IN
MITSUBISHI'S USER, INSTRUCTION AND/OR SAFETY MANUALS, TECHNICAL BULLETINS AND
GUIDELINES FOR the PRODUCT.
("Prohibited Application")
Prohibited Applications include, but not limited to, the use of the PRODUCT in;
Nuclear Power Plants and any other power plants operated by Power companies, and/or any other
cases in which the public could be affected if any problem or fault occurs in the PRODUCT.
Railway companies or Public service purposes, and/or any other cases in which establishment of a
special quality assurance system is required by the Purchaser or End User.
Aircraft or Aerospace, Medical applications, Train equipment, transport equipment such as Elevator
and Escalator, Incineration and Fuel devices, Vehicles, Manned transportation, Equipment for
Recreation and Amusement, and Safety devices, handling of Nuclear or Hazardous Materials or
Chemicals, Mining and Drilling, and/or other applications where there is a significant risk of injury to
the public or property.
Notwithstanding the above, restrictions Mitsubishi may in its sole discretion, authorize use of the
PRODUCT in one or more of the Prohibited Applications, provided that the usage of the PRODUCT is
limited only for the specific applications agreed to by Mitsubishi and provided further that no special
quality assurance or fail-safe, redundant or other safety features which exceed the general
specifications of the PRODUCTs are required. For details, please contact the Mitsubishi
representative in your region.
A-2
A-2
REVISIONS
*The manual number is given on the bottom left of the back cover.
Print date
*Manual number
Dec., 2002
SH (NA)-080370E-A
First edition
Oct., 2003
SH (NA)-080370E-B
Addition
Revision
Section 8.6, Section 8.6.1 to 8.6.5, Section 9.15.14, Appendix 1.7,
Appendix 2.3
Correction
Section 2.1.3, Section 2.1.4, Section 2.2, Section 2.3, Section 3.1,
Section 3.2, Section 5.1, Section 6.2.1, Section 6.3.1, Section 6.5.2,
Section 7.3.1, Section 7.4.1, Section 7.6, Section 7.7.1, Section 7.7.4,
Section 8.4, Section 8.5, Section 9.3, Section 9.5, Section 9.11,
Section 9.14, Section 9.15, Section 9.15.8, Section 9.15.9,
Section 10.1, Section 10.3.5, Section 11.3.4, Section 12.1,
Section 12.2, Appendix 1.1, Appendix 1.2, Appendix 1.3, Appendix 1.4,
Appendix 1.5, Appendix 2, Appendix 2.1, Appendix 3
Section 7.3.4 to 7.3.9 changed to Section 7.3.2 to 7.3.7
Appendix 1.7 changed to Appendix 1.8
Appendix 2.3 changed to Appendix 2.4
Deletion
Section 7.3.2, Section 7.3.3
Jun., 2004
SH (NA)-080370E-C
Model Addition
Q12PRHCPU, Q25PRHCPU
Addition
Appendix 1.9, Appendix 4
Correction
Generic Terms, Abbreviations And Terms, Section 1.2,
Section 2.1 to 2.2, Section 4.5, Section 5.1, Section 6.3, Section 7.2.6,
Section 7.3.1, Section 7.4.1, Section 7.7.4, Section 8.4 to 8.5,
Section 9.3, Section 9.14, Section 10.1, Section 10.3.7, Section 10.5,
Section 11.2, Section 11.3.2, Section 11.3.4, Section 12.1,
Appendix 1.2, Appendix 1.6 to 1.7, Appendix 2.4, Appendix 3
Feb., 2005
SH (NA)-080370E-D
Correction
Section 2.2
A-3
A-3
*The manual number is given on the bottom left of the back cover.
Print date
*Manual number
Feb., 2006
SH (NA)-080370E-E
Revision
Correction
Generic Terms, Abbreviations And Terms, Section 1.1, Section 1.2,
Section 2.1.2, Section 2.1.3, Section 2.1.4, Section 2.1.6, Section 2.2,
Section 3.2, Section 7.1.3, Section 7.3.1, Section 7.4.1, Section 7.6.2,
Section 7.7, Section 7.7.1, Section 7.7.3, Section 7.7.5, Section 7.7.8,
Section 8.5.1, Section 8.6, Section 9.1.1, Section 9.3, Section 9.4,
Section 9.5, Section 9.11, Section 9.12, Section 9.14, Section 9.15.9,
Section 10.1, Section 10.3.1, Section 10.3.2, Section 10.3.3,
Section 10.3.4, Section 10.3.5, Section 10.3.6, Section 10.4,
Section 10.5, Section 10.5.1, Section 10.5.2, Section 10.5.7,
Section 10.6.1, Chapter 11, Appendix 1.2, Appendix 1.3, Appendix 2.1,
Appendix 3, Appendix 4.2, Index
Mar., 2007
SH (NA)-080370E-F
Additions
Section 10.3.5, Section 10.3.6, Section 10.5.5, Section 11.1,
Section 11.1.1, Appendix 3, Appendix 3.2, Appendix 3.2.1
Correction
Section 1.2, Section 2.1.2, Section 2.1.3, Section 2.2, Section 3.2,
Section 5.1, Section 6.3.1, Section 6.3.2, Section 7.2, Section 7.3,
Section 7.4, Section 7.5, Section 7.7, Section 7.7.5, Section 8.6.2,
Section 9.1.4, Section 9.3, Section 9.8, Section 10.3.1, Section 10.3.2,
Section 10.3.3, Section 10.3.4, Section 10.4, Section 10.5, Chapter 11,
Section 11.2, Section 11.2.1, Section 11.3.4, Section 12.1,
Appendix 1.2, Appendix 1.3, Appendix 1.8, Appendix 1.9.2,
Appendix 1.9.3, Appendix 2.2, Appendix 2.4, Appendix 5.2,
Section 10.3.5 to 10.3.11 changed to Section 10.3.7 to 10.3.13
Section 10.5.5 to 10.5.9 changed to Section 10.5.6 to 10.5.10
Section 11.1 changed to Appendix 3.1
Section 11.3 changed to Appendix 3.1.2
Section 11.4 changed to Appendix 3.1.1
Appendix 3 changed to Appendix 4
Appendix 4 to 4.3 changed to Appendix 5 to 5.3
A-4
A-4
*The manual number is given on the bottom left of the back cover.
Print date
*Manual number
Jun., 2008
SH (NA)-080370E-G
Revision
Model Addition
Q02PHCPU, Q06PHCPU
Addition
Section 9.1.4, Appendix 4
Correction
MANUALS, GENERIC TERMS, ABBREVIATIONS, AND TERMS,
Section 1.1, Section 1.2, Section 2.1.1, Section 2.1.2, Section 2.1.4,
Section 2.1.6, Section 2.2, Section 3.2, Section 4.6, Section 5.1,
Section 6.1, Section 6.3.1, Section 6.4.2, Section 7.1, Section 7.1.3,
Section 7.3.1, Section 7.5, Section 7.6.2, Section 7.7, Section 7.7.1,
Section 8.3, Section 8.5.1, Section 9.1.1, Section 9.1.3, Section 9.3,
Section 9.8, Section 9.14, Section 9.15.2, Section 10.1, Section 10.3.7,
Section 10.3.9, Section 10.5.1 to 10.5.3, Section 10.5.6, Section 10.5.8,
Section 10.5.9, Section 11.1.1, Section 11.2.1, Section 12.1,
Appendix 1.2.1, Appendix 1.2.2, Appendix 3.1.1 [4], Appendix 3.1.2 [2],
Appendix 4 to 5.3 changed Appendix 5 to 6.3
Jan., 2009
SH (NA)-080370E-H
Addition
Section 6.6, Section 8.6, Section 9.4, Section 10.5.8, Appendix 2
Correction
GENERIC TERMS, ABBREVIATIONS, AND TERMS, Section 1.2,
Section 2.1.6, Section 2.2, Section 2.3, Section 3.1, Section 3.2,
Section 4.6, Section 5.1, Section 6.1, Section 6.3.1, Section 6.4.2,
Section 6.5.2, Section 7.3.1, Section 7.3.2, Section 7.3.5, Section 7.4.1,
Section 7.4.2, Section 7.4.4, Section 7.6, Section 7.7.3, Section 8.1,
Section 8.2, Section 8.4 to 8.5.3, Section 9.1.1, Section 9.1.4,
Section 9.3, Section 9.14, Section 9.15, Section 10.1, Section 10.3.2,
Section 10.3.3, Section 10.3.8, Section 10.4, Section 10.5,
Section 11.1.1, Section 12.1, Appendix 1.1 to 1.3, Appendix 1.7,
Appendix 3.1.1 [4], Appendix 3.1.2 [2], Appendix 3.2,
Appendix 4.1.1 [4], Appendix 4.1.2 [2], Appendix 4.2, Appendix 5,
Appendix 6, Appendix 6.2, Appendix 7.2
Section 8.6 to 8.6.5 changed to Section 8.7 to 8.7.5
Section 9.4 to 9.15.14 changed to Section 9.5 to 9.16.14
Section 10.5.8 to 10.5.10 changed to Section 10.5.9 to 10.5.11
Appendix 2 to 6.3 changed to Appendix 3 to 7.3
A-5
A-5
*The manual number is given on the bottom left of the back cover.
Print date
*Manual number
Dec., 2009
SH (NA)-080370E-I
Revision
Addition
CONDITIONS OF USE FOR THE PRODUCT, Section 7.2.7,
Section 8.6.4, Section 10.3.14, Section 10.5.12, Section 10.6.3,
Appendix 2.1
Correction
SAFETY PRECAUTIONS, Section 1.2, Section 2.1.2, Section 2.1.4,
Section 2.1.6, Section 2.2, Section 2.3, Section 3.2, Section 4.7,
Section 5.1, Section 6.3.1, Section 6.6, Section 7.2, Section 7.2.1,
Section 7.2.3, Section 7.2.4, Section 7.3.1, Section 7.4.1, Section 7.7.1,
Section 8.5.1, Section 8.6.1 to 8.6.3, Section 8.6.5, Section 8.7,
Section 8.7.1, Section 8.7.4, Section 9.1.4, Section 9.2 to 9.4,
Section 9.6, Section 9.11, Section 9.15, Section 9.16.4, Section 9.16.5,
Section 9.16.9, Section 9.16.14, Section 10.3.1 to 10.3.3,
Section 10.3.8, Section 10.3.9, Section 10.4, Section 10.5,
Section 10.6, Section 12.1, Appendix 1.1 to 1.3, Appendix 4.1.1 [4],
Appendix 4.1.2 [2], Appendix 5.1, Appendix 6, Appendix 7.2
Section 8.6.4 to 8.6.6 changed to Section 8.6.5 to 8.6.7
Section 10.6.2 changed to Section 10.6.3
Appendix 2 changed to Appendix 2.2
Dec., 2010
SH (NA)-080370E-J
Addition
Section 9.5, Section 9.17.12, Appendix 1.6, Appendix 1.7
Correction
MANUALS, GENERIC TERMS, ABBREVIATIONS, AND TERMS,
Section 1.1, Section 1.2, Section 2.1.4, Section 2.1.6, Section 2.2,
Section 2.3, Section 3.1, Section 3.2, Section 5.1, Section 6.3.1,
Section 6.4.1, Section 6.6, Section 7.2 to 7.2.2, Section 7.2.5,
Section 7.2.6, Section 7.3.1, Section 7.4.1, Section 7.5, Section 7.6,
Section 7.7.1, Section 7.7.6, Section 8.5.1 to 8.5.3, Section 8.6.6,
Section 9.1.1, Section 9.1.3, Section 9.3, Section 9.7, Section 9.10,
Section 9.16, Section 9.17, Section 9.17.3, Section 11.2,
Section 11.2.1, Section 12.1, Appendix 1.1, Appendix 1.2.2,
Appendix 1.8, Appendix 1.10, Appendix 4.1.1 [1], Appendix 4.1.2 [1],
Appendix 5 to 5.2, Appendix 6, Appendix 7.1, Appendix 7.2
Section 9.5 to 9.16 changed to Section 9.6 to 9.17
Appendix 1.6 to 1.9 changed to Appendix 1.8 to 1.11
A-6
A-6
*The manual number is given on the bottom left of the back cover.
Print date
*Manual number
Oct., 2011
SH (NA)-080370E-K
Revision
Addition
Section 7.7.9, Section 9.2, Section 10.5.13, Section 10.5.14,
Appendix 4,
Correction
HOW TO USE THIS MANUAL,
GENERIC TERMS, ABBREVIATIONS, AND TERMS, Section 1.2,
Section 2.1.2, Section 2.2, Section 3.1, Section 3.2, Section 4.1 to 4.5,
Section 5.1, Section 5.2, Section 6.3.1 to 6.3.4, Section 6.3.9,
Section 7.2.6, Section 7.3.1, Section 7.3.2, Section 7.3.4 to 7.3.7,
Section 7.4.1 to 7.5, Section 7.7.1, Section 7.7.3 to 7.7.5, Section 7.7.8,
Section 8.1, Section 8.2, Section 8.5.1, Section 8.5.3, Section 8.6.6,
Section 9.1.1, Section 9.1.3, Section 9.3, Section 9.5, Section 9.11,
Section 9.13, Section 9.16, Section 9.17, Section 9.18.1,
Section 9.18.7, Section 9.18.9, Section 10.1, Section 10.2,
Section 10.3.1 to 10.3.3, Section 10.3.8, Section 10.3.9,
Section 10.3.13, Section 10.4, Section 10.5, Section 10.5.8,
Section 10.5.12, Chapter 11 to Section 11.2.1, Section 12.1,
Appendix 1.2, Appendix 1.2.2, Appendix 1.3, Appendix 5.1,
Appendix 5.1.1 [1], Appendix 5.1.1 [4], Appendix 5.2, Appendix 7,
Appendix 8.1, Appendix 8.2
Section 9.2 to 9.17.15 changed to Section 9.3 to 9.18.15
Appendix 4 to 7.3 changed to Appendix 5 to 8.3
Feb., 2014
SH (NA)-080370E-L
Addition
Section 10.7.2, Section 10.8.2
Correction
GENERIC TERMS, ABBREVIATIONS, AND TERMS, Section 1.2,
Section 2.1.2 to 2.1.4, Section 2.2, Section 3.2, Section 4.5,
Section 5.1, Section 5.2, Section 6.3.1, Section 6.4.1, Section 6.6,
Section 7.2.1, Section 7.3.1, Section 7.4, Section 7.4.1, Section 7.4.5,
Section 7.4.6, Section 7.5 to 7.7.1, Section 8.5.1 to 8.5.3, Section 9.1.1,
Section 9.4 to 9.6, Section 9.11, Section 9.16, Section 9.17,
Section 9.18, Section 9.18.11, Section 9.18.12, Section 10.1,
Section 10.2, Section 10.3.2 to 10.3.4, Section 10.4, Section 10.7,
Section 10.7.1, Section 10.8, Section 10.8.1,Chapter 11 to11.1.2,
Section 12.1, Appendix 1.1 to 1.2.2, Appendix 4, Appendix 6 to 8,
Appendix 8.2, Section 8.3
A-7
A-7
*The manual number is given on the bottom left of the back cover.
Print date
*Manual number
Jul., 2015
SH (NA)-080370E-M
Revision
Correction
GENERIC TERMS, ABBREVIATIONS, AND TERMS, Section 2.1.4,
Section 2.1.6, Section 2.2, Section 5.1, Section 6.5.2, Section 7.6,
Section 7.7.3, Section 8.6.1, Section 8.6.7, Section 9.5, Appendix 1.10,
Appendix 7, Appendix 8.1
Japanese manual version SH-080260- AF
This manual confers no industrial property rights or any rights of any other kind, nor does it confer any patent
licenses. Mitsubishi Electric Corporation cannot be held responsible for any problems involving industrial
property rights that may occur as a result of using the contents noted in this manual.
c
A-8
2002 MITSUBISHI ELECTRIC CORPORATION
A-8
INTRODUCTION
Thank you for choosing the Mitsubishi MELSOFT series Integrated FA software.
Read this manual and make sure you understand the functions and performance of MELSOFT series
thoroughly in advance to ensure correct use.
CONTENTS
SAFETY PRECAUTIONS ................................................................................................................................ A-1
CONDITIONS OF USE FOR THE PRODUCT ............................................................................................... A-2
REVISIONS ...................................................................................................................................................... A-3
INTRODUCTION .............................................................................................................................................. A-9
CONTENTS ...................................................................................................................................................... A-9
MANUALS ......................................................................................................................................................A-15
HOW TO USE THIS MANUAL ......................................................................................................................A-16
MANUAL ORGANIZATION ...........................................................................................................................A-18
GENERIC TERMS, ABBREVIATIONS, AND TERMS .................................................................................A-20
1
OVERVIEW ............................................................................................................................................ 1-1
1.1
1.2
2
Overview ................................................................................................................................................. 1-1
Features .................................................................................................................................................. 1-3
SYSTEM CONFIGURATION ................................................................................................................. 2-1
2.1 System Configuration ............................................................................................................................. 2-1
2.1.1
Supported CPU ............................................................................................................................ 2-1
Communication route................................................................................................................... 2-1
2.1.2
2.1.3
Serial/USB connection ............................................................................................................... 2-11
2.1.4
Network board ............................................................................................................................ 2-13
2.1.5
Printer ......................................................................................................................................... 2-14
2.1.6
Monitoring system configuration with Monitor Tool .................................................................. 2-15
2.2 Operating Environment ........................................................................................................................ 2-19
2.3 Folder Configuration of Monitor Tool ................................................................................................... 2-24
3
FUNCTION OVERVIEW ........................................................................................................................ 3-1
3.1
3.2
4
Function Overview .................................................................................................................................. 3-1
Function List............................................................................................................................................ 3-2
MODE ADMINISTRATION .................................................................................................................... 4-1
4.1
4.2
4.3
4.4
4.5
4.6
4.7
A-9
Mode Overview ....................................................................................................................................... 4-1
Mode Types ............................................................................................................................................ 4-1
User Authorities ...................................................................................................................................... 4-1
Mode Transition ...................................................................................................................................... 4-2
Mode Change ......................................................................................................................................... 4-2
User Setting ............................................................................................................................................ 4-3
Changing Mode after Installation ........................................................................................................... 4-4
A-9
START AND EXIT .................................................................................................................................. 5-1
5
5.1
5.2
6
Starting Monitor Tool .............................................................................................................................. 5-1
Exiting Monitor Tool ................................................................................................................................ 5-7
SCREEN CONFIGURATION AND BASIC OPERATION..................................................................... 6-1
6.1 Overview of Screen Configuration ......................................................................................................... 6-1
6.2 General Operation of Screen ................................................................................................................. 6-2
6.2.1
Closing a window ......................................................................................................................... 6-2
6.2.2
Maximizing a window ................................................................................................................... 6-2
6.2.3
Minimizing a window .................................................................................................................... 6-3
6.2.4
Restoring a window ..................................................................................................................... 6-3
6.2.5
Changing the window size ........................................................................................................... 6-3
6.3 Monitor Toolbar ....................................................................................................................................... 6-4
6.3.1
Contents of monitor toolbar ......................................................................................................... 6-4
6.3.2
Screen display buttons .............................................................................................................. 6-10
6.3.3
Stop buzzer button ..................................................................................................................... 6-12
6.3.4
Print screen button ..................................................................................................................... 6-12
6.3.5
Screen alignment button............................................................................................................ 6-12
6.3.6
Find button ................................................................................................................................. 6-13
6.3.7
Change mode button ................................................................................................................. 6-13
6.3.8
Setting window button................................................................................................................ 6-13
6.3.9
Exit button .................................................................................................................................. 6-13
6.4 Monitor Window .................................................................................................................................... 6-14
6.4.1
Types of monitor window ........................................................................................................... 6-14
6.4.2
Display form of monitor window ................................................................................................ 6-14
6.5 Pop-up Window .................................................................................................................................... 6-16
6.5.1
Types of pop-up window............................................................................................................ 6-16
6.5.2
Display form of pop-up window ................................................................................................. 6-16
6.6 Task Tray Icon ...................................................................................................................................... 6-17
7
MONITOR FUNCTION ........................................................................................................................... 7-1
7.1 Control Panel .......................................................................................................................................... 7-1
7.1.1
Faceplate display ......................................................................................................................... 7-2
7.1.2
Switching groups to be displayed ................................................................................................ 7-2
7.1.3
Displaying the pop-up tuning screen ........................................................................................... 7-2
7.2 Trend Graph............................................................................................................................................ 7-3
7.2.1
Displaying a trend graph .............................................................................................................. 7-4
7.2.2
Collecting trend data .................................................................................................................... 7-8
7.2.3
Switching groups to be displayed ................................................................................................ 7-9
7.2.4
Displaying the latest value ........................................................................................................... 7-9
7.2.5
Changing the display magnification .......................................................................................... 7-10
7.2.6
Exporting to CSV file .................................................................................................................. 7-12
7.2.7
Displaying CSV file .................................................................................................................... 7-13
7.3 Alarm List .............................................................................................................................................. 7-15
7.3.1
Displaying alarm list ................................................................................................................... 7-16
7.3.2
Confirm check ............................................................................................................................ 7-23
7.3.3
Displaying selected alarms ........................................................................................................ 7-23
A-10
A-10
Deleting recovered alarms......................................................................................................... 7-24
7.3.4
7.3.5
Confirming all alarms ................................................................................................................. 7-24
7.3.6
Printing an alarm list .................................................................................................................. 7-25
7.3.7
Exporting to CSV file .................................................................................................................. 7-26
7.4 Event List .............................................................................................................................................. 7-27
7.4.1
Displaying event list ................................................................................................................... 7-28
7.4.2
Confirm check ............................................................................................................................ 7-36
7.4.3
Deleting all events...................................................................................................................... 7-36
7.4.4
Confirming all events ................................................................................................................. 7-37
7.4.5
Printing an event list................................................................................................................... 7-38
7.4.6
Exporting to CSV file .................................................................................................................. 7-39
7.5 User-created Screen ............................................................................................................................ 7-40
7.6 Pop-up Faceplate ................................................................................................................................. 7-42
7.6.1
Displaying a faceplate................................................................................................................ 7-44
7.6.2
Displaying a pop-up tuning screen ............................................................................................ 7-44
7.7 Pop-up Tuning Screen ......................................................................................................................... 7-45
7.7.1
Displaying a pop-up tuning screen ............................................................................................ 7-47
7.7.2
Collecting tuning trend data ....................................................................................................... 7-51
7.7.3
Tuning trend collection instruction ............................................................................................. 7-52
7.7.4
Changing a current value .......................................................................................................... 7-53
7.7.5
Auto tuning ................................................................................................................................. 7-54
7.7.6
Changing the display magnification .......................................................................................... 7-63
7.7.7
Collected tag list ......................................................................................................................... 7-64
7.7.8
Exporting to CSV file .................................................................................................................. 7-65
7.7.9
AT reflection target..................................................................................................................... 7-66
8
OTHER FUNTION .................................................................................................................................. 8-1
8.1 Starting/Stopping Buzzer........................................................................................................................ 8-1
8.2 Print Screen ............................................................................................................................................ 8-2
8.3 Screen Alignment ................................................................................................................................... 8-3
8.4 Find ......................................................................................................................................................... 8-4
8.5 Displaying the PLC Communication Status ........................................................................................... 8-7
8.5.1
Displaying the communication status .......................................................................................... 8-7
8.5.2
Displaying the redundant system status ................................................................................... 8-10
8.5.3
Collection period for each communication type ........................................................................ 8-12
8.6 Server/Client Monitoring System ......................................................................................................... 8-14
8.6.1
Setting data in the secondary server/clients ............................................................................. 8-14
8.6.2
Procedure for copying the setting data ..................................................................................... 8-16
8.6.3
Switching server ......................................................................................................................... 8-17
8.6.4
Connecting to server .................................................................................................................. 8-18
8.6.5
Acquiring the server setting data ............................................................................................... 8-18
8.6.6
Time adjustment among OPSs ................................................................................................. 8-19
8.6.7
Displaying the server/client communication status ................................................................... 8-20
8.7 Automatic CSV File Export ................................................................................................................... 8-21
8.7.1
Automatic trend CSV file export ................................................................................................ 8-24
8.7.2
Automatic alarm CSV file export ............................................................................................... 8-29
8.7.3
Automatic event CSV file export................................................................................................ 8-31
8.7.4
Automatic CSV file deletion ....................................................................................................... 8-33
8.7.5
Disk free space check................................................................................................................ 8-34
A-11
A-11
SETTING ................................................................................................................................................ 9-1
9
9.1 Common Setting Window....................................................................................................................... 9-1
9.1.1
Displaying and operating the setting window.............................................................................. 9-1
9.1.2
Inputting to data setting grid ........................................................................................................ 9-4
9.1.3
Registering and saving the settings ............................................................................................ 9-6
9.1.4
Copying monitoring environment of monitor tool to other computers ........................................ 9-8
9.2 User Authority Setting........................................................................................................................... 9-10
9.3 User Setting .......................................................................................................................................... 9-12
9.4 Monitor Target Project Setting ............................................................................................................. 9-13
9.5 OPS Setting .......................................................................................................................................... 9-21
9.6 Monitor Variable Setting ....................................................................................................................... 9-27
9.7 Control Panel Setting............................................................................................................................ 9-30
9.8 Trend Setting ........................................................................................................................................ 9-32
9.9 Alarm Setting ........................................................................................................................................ 9-34
9.10
Event Setting ................................................................................................................................... 9-35
9.11
User-created Screen Setting .......................................................................................................... 9-36
9.12
Unit Setting ...................................................................................................................................... 9-42
9.13
Faceplate Display Pattern Setting .................................................................................................. 9-43
9.14
Faceplate Display Scale Setting ..................................................................................................... 9-46
9.15
Faceplate MV Characters Setting .................................................................................................. 9-48
9.16
Lockout Tag Setting ........................................................................................................................ 9-49
9.17
Option Setting.................................................................................................................................. 9-51
9.18
Setting under This Condition .......................................................................................................... 9-64
9.18.1
Changing the mode ................................................................................................................... 9-64
9.18.2
Displaying the control panel ...................................................................................................... 9-65
9.18.3
Displaying a trend graph ............................................................................................................ 9-66
9.18.4
Displaying an alarm ................................................................................................................... 9-67
9.18.5
Displaying an event ................................................................................................................... 9-69
9.18.6
Setting character string displayed on faceplate ........................................................................ 9-71
9.18.7
Design lockout tag ..................................................................................................................... 9-72
9.18.8
Specifying a font ........................................................................................................................ 9-73
9.18.9
Specifying a display color .......................................................................................................... 9-74
9.18.10 Specifying a beep sound ........................................................................................................... 9-77
9.18.11 Changing the transfer setup ...................................................................................................... 9-78
9.18.12 Connecting to Simulator ............................................................................................................ 9-79
9.18.13 Specifying a printer .................................................................................................................... 9-80
9.18.14 Changing the window mode ...................................................................................................... 9-81
9.18.15 Using automatic CSV file export................................................................................................ 9-82
10
FACEPLATE ......................................................................................................................................... 10-1
10.1
Faceplate Display............................................................................................................................ 10-1
10.2
Lockout Tag..................................................................................................................................... 10-7
10.3
Displaying Parts on Faceplate ........................................................................................................ 10-8
10.3.1
Operation display types ............................................................................................................. 10-8
10.3.2
Changing the I/O mode ........................................................................................................... 10-10
10.3.3
Changing the Control mode .................................................................................................... 10-12
10.3.4
Changing the PGS motion type ............................................................................................... 10-15
10.3.5
Executing step No. setting ....................................................................................................... 10-17
A-12
A-12
Time in the step setting............................................................................................................ 10-18
10.3.6
10.3.7
PV value setting ....................................................................................................................... 10-19
10.3.8
SV value setting ....................................................................................................................... 10-22
10.3.9
MV value setting ...................................................................................................................... 10-24
10.3.10 Count value setting .................................................................................................................. 10-26
10.3.11 Batch count operation .............................................................................................................. 10-27
10.3.12 Count/Timer operation ............................................................................................................. 10-28
10.3.13 Status operation ....................................................................................................................... 10-29
10.3.14 Command button operation ..................................................................................................... 10-30
10.4
Tag Types ..................................................................................................................................... 10-31
10.5
Loop Tag Faceplate ...................................................................................................................... 10-33
10.5.1
PID, PIDP, SPI, IPD, BPI, R, 2PID.......................................................................................... 10-35
10.5.2
2PIDH ....................................................................................................................................... 10-37
10.5.3
ONF2, ONF3 ............................................................................................................................ 10-40
10.5.4
PGS .......................................................................................................................................... 10-42
10.5.5
PGS2 ........................................................................................................................................ 10-44
10.5.6
MOUT ....................................................................................................................................... 10-47
10.5.7
MONI ........................................................................................................................................ 10-48
10.5.8
SWM......................................................................................................................................... 10-49
10.5.9
MWM ........................................................................................................................................ 10-51
10.5.10 SEL ........................................................................................................................................... 10-53
10.5.11 BC, PSUM ................................................................................................................................ 10-55
10.5.12 PFC_SF, PFC_SS, PFC_INT ................................................................................................. 10-57
10.5.13 PVAL ........................................................................................................................................ 10-59
10.5.14 HTCL ........................................................................................................................................ 10-61
10.6
Status Tag Faceplate .................................................................................................................... 10-64
10.6.1
NREV, REV, MVAL1, MVAL2 ................................................................................................. 10-65
10.6.2
TIMER1, TIMER2, COUNT1, COUNT2 .................................................................................. 10-67
10.6.3
PB ............................................................................................................................................. 10-69
10.7
Alarm Tag Faceplate..................................................................................................................... 10-71
10.7.1
ALM .......................................................................................................................................... 10-72
10.7.2
ALM_64PT ............................................................................................................................... 10-73
10.8
Message Tag Faceplate ............................................................................................................... 10-74
10.8.1
MSG ......................................................................................................................................... 10-76
10.8.2
MSG_64PT .............................................................................................................................. 10-77
11
MONITORING WITH USER-CREATED SCREEN ............................................................................. 11-1
11.1
Utilizing GT SoftGOT ...................................................................................................................... 11-1
11.1.1
Setting procedure to use the interaction function between the Monitor tool and GT
SoftGOT ..................................................................................................................................... 11-3
11.1.2
Monitoring procedure using the interaction function between the Monitor tool and GT
SoftGOT ................................................................................................................................... 11-12
11.2
Utilizing Microsoft Visual Basic Application ............................................................................. 11-15
11.2.1
Using procedure for ActiveX control........................................................................................ 11-16
R
12
12.1
12.2
A-13
R
TROUBLE OCCURRENCE ................................................................................................................. 12-1
Troubleshooting .............................................................................................................................. 12-1
Convenience Function .................................................................................................................... 12-5
A-13
APPENDIX.......................................................................................................................................................... B-1
Appendix 1 Communication of the Monitor Tool ........................................................................................ B-1
Appendix 1.1
Communication types ....................................................................................................... B-1
Event notification ............................................................................................................... B-4
Appendix 1.2
Appendix 1.2.1
System configuration that can receive event notification ...................................... B-5
Appendix 1.2.2
Settings for executing event notification ................................................................ B-8
Appendix 1.3
Collecting current value data ..........................................................................................B-13
Appendix 1.4
Collecting tag data ..........................................................................................................B-15
Appendix 1.5
Writing tag data ...............................................................................................................B-16
Appendix 1.6
Collecting process data...................................................................................................B-17
Appendix 1.7
Communication error ......................................................................................................B-18
Appendix 1.8
Return check ...................................................................................................................B-19
Appendix 1.9
PLC status check ............................................................................................................B-20
Appendix 1.10 Measures for delayed collection periods ........................................................................B-24
Appendix 1.11 Communication with Redundant CPU............................................................................B-25
Appendix 1.11.1 Communication route for monitoring ...................................................................B-25
Appendix 1.11.2 Monitor operation when the system is switched .................................................B-25
Appendix 1.11.3 Monitor operation when a communication error has occurred ...........................B-26
Appendix 2 Refreshing the monitoring data in the server/client monitoring system ...............................B-28
Appendix 2.1
Refreshing the monitoring data in a secondary server ..................................................B-28
Appendix 2.2
Refreshing the monitoring data in clients .......................................................................B-29
Appendix 3 Monitor Tool Startup Option...................................................................................................B-30
Appendix 3.1
Starting under hiding status ............................................................................................B-30
Appendix 3.2
Switching between monitor toolbar show/hide after starting .........................................B-31
Appendix 3.3
Starting the Monitor Tool by the Mode That Matches the Authority of the Specified User ....B-32
Appendix 4 Operation authority for tag data items ...................................................................................B-33
Appendix 5 External Control of the Monitor Tool ......................................................................................B-40
Appendix 5.1
ActiveX control ................................................................................................................B-40
Appendix 5.1.1
Tag Data Access Control .....................................................................................B-41
Appendix 5.1.1 [1] Custom Property ................................................................................................B-42
Appendix 5.1.1 [2] Method ...............................................................................................................B-45
Appendix 5.1.1 [3] Event ..................................................................................................................B-45
Appendix 5.1.1 [4] Error list ..............................................................................................................B-46
Appendix 5.1.2
Faceplate Control .................................................................................................B-54
Appendix 5.1.2 [1] Custom Property ................................................................................................B-54
Appendix 5.1.2 [2] Error list ..............................................................................................................B-55
Appendix 5.2
MonCtrl command ...........................................................................................................B-59
Appendix 6 Warning Message Appears on Windows Vista or later ......................................................B-63
Appendix 6.1
Overview of warning message .......................................................................................B-63
Appendix 6.2
Methods for preventing the warning message ...............................................................B-64
Appendix 7 Functions Added to and Changed from Old Version ............................................................B-70
Appendix 8 Version Compatibility .............................................................................................................B-76
Appendix 8.1
Monitor tool version compatibility ...................................................................................B-76
Appendix 8.2
Version compatibility between monitor tool and programming tool...............................B-78
Appendix 8.3
Combined use of monitor tool and GX application ........................................................B-79
R
INDEX ................................................................................................................................................................ C-1
A-14
A-14
MANUALS
The following manuals are also related to this product.
Refer to the following table for ordering a manual.
Related manuals
Manual name
PX Developer Operating Manual (Programming Tool)
Explains FBD language programming, compilation, online operations, and debug methods
with PX Developer.
(Sold separately.)
PX Developer Programming Manual
Explains details of programming with PX Developer, lists of FB parts, and the PID
instructions.
(Sold separately.)
PX Developer Operating Manual (GOT Screen Generator)
Explains the generation procedure for GOT screen project and details about generated
screen.
(Sold separately.)
PX Developer Operating Manual (InTouch Interaction)
Explains the interaction between PX Developer monitor tool and SCADA software (InTouch).
(Sold separately.)
PX Developer Operating Manual (JoyWatcherSuite Interaction)
Explains the interaction between PX Developer monitor tool and SCADA software
(JoyWatcherSuite).
(Sold separately.)
Manual number
(model code)
SH-080369E
(13JU38)
SH-080371E
(13JW00)
SH-080772ENG
(13JU61)
SH-080773ENG
(13JU62)
SH-080976ENG
(13JU70)
CAUTION
Please note that we do not guarantee commercially available software
R
R
compatible with Microsoft Windows Operating System introduced in this
manual.
The software copyright of this product belongs to Mitsubishi Electric
Corporation.
No contents in this manual can be reproduced or duplicated in any form or by
any means without permission.
Although we make utmost efforts, this manual may not completely follow the
revisions of the software and hardware.
In principle, this software should be purchased by one set per personal
computer or by license purchase.
This product (including this manual) can only be used under the software
license agreement.
Please note that we are not responsible for any influence resulting from
operating this product (including the manual).
The contents of this manual are subject to change without notice.
A-15
A-15
HOW TO USE THIS MANUAL
BASIC OPERATION
PURPOSE
Describes the purpose of operations for each chapter or section.
DISPLAY/SETTING SCREEN
Describes the screen display procedure.
A-16
Reference location
leads to the reference location.
Describes the operations to set the intended settings.
DISPLAY/SETTING DATA
Describes the display contents on the screen.
A-16
There are also the following types of explanations.
POINT
Informs items to be noted and useful functions relevant to the contents in the chapter or section.
REMARKS
Supplements contents in the chapter or section.
The following table explains symbols in this manual and their description.
Symbol
[
]
Description
Expresses an item in a window or dialog box, or a menu on the menu bar.
[
]
[
] expresses the drop-down menu.
Example: [File]
(
)
"
"
<< >>
A-17
[Save the setting data]
Indicates the related button.
Example: "Go to Previous Folder" button (
Expresses a command button.
)
Example: "OK" button
Expresses dialog box tab.
Example: <<General>> tab
A-17
MANUAL ORGANIZATION
This manual consists of 12 chapters and APPENDICES.
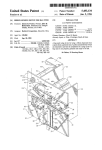
The contents of the manual: The steps from the system programming to the run of DC
processing on CPU module by using the PX Developer. The steps are shown as
follows:
< Operating procedures before running the process control system >
Operating procedure 1: The setting and wiring of the process control system
Install CPU module, Network module, Input/Output module, the related
equipments of PLC, and the process control system and other external
equipments to realize wiring
Operating procedure 2: Confirm the base of using the FBD language of PX Developer
for programming
Confirm both of the FBD language form and the instruction/data which can be
used on CPU module
Operating procedure 3: Set PX Developer
Reference
QCPU User's Manual
(Hardware Design,
Maintenance and Inspection)
Qn(H)/QnPH/QnPRHCPU
User's Manual
(Function Explanation,
Program Fundamentals)
Reference
PX Developer Programming
Manual
Reference
Confirm the system which can be used by PX Developer
Confirm the function which can run on PX Developer
Connect the personal computer to the network of the process control system
Install PX Developer to the personal computer
Operating procedure 4: Programming with the programming tool
PX Developer Operating
Manual (Programming Tool)
and (Monitor Tool)
Method of installing the PX
Developer (Included with the
product)
Reference
Start the programming tool of PX Developer
Remember the screen display and basic operation of the programming tool
Create the project of PX Developer with the programming tool
Programming with the programming tool in FBD language
PX Developer Operating
Manual (Programming Tool)
Compile FBD language program with the programming tool
Download the program to CPU module with the programming tool
Online operation and debug with the programming tool
(To the next page)
A-18
A-18
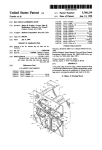
(From the previous page)
Operating procedure 5: Set the monitor tool
Reference
Start the monitor tool of PX Developer
Chapter 5
Switch the monitor tool mode to the engineer mode
Chapter 4
Confirm the screen configuration and basic operation
Chapter 6
Set the display mode of the monitor target and the monitor screen
Chapter 9
Operating procedure 6: Execute test operation and confirm/adjust the setting
Reference
Display the monitor screen and reconfirm the settings
Chapter 7
Confirm the content of tag data by monitoring the faceplate
Chapter 10
Execute test operation and tuning
Operating procedure 7: Set the user-created screen (User monitor screen)
Create the user-created screen (user monitor screen) with Microsoft
R
Basic with ActiveX control
R
Reference
Visual
Assign the created user-created screen to the buttons of the monitor toolbar so
that the screen can be started from the monitor tool
Chapter 11
Chapter 9
Operating procedure 8: Run the process control system
Reference
Switch the monitor tool mode to operator mode
Chapter 4
Display the monitor screen and begin system monitor
Chapter 7
QCPU User's Manual
(Hardware Design,
Maintenance and Inspection)
Run the process control system with the program which has been downloaded to
CPU module
QCPU User's Manual
(Function Explanation,
Program Fundamentals)
QnUCPU User's Manual
(Function Explanation,
Program Fundamentals)
A-19
A-19
GENERIC TERMS, ABBREVIATIONS, AND TERMS
The following table shows the generic terms, abbreviations, and terms in this manual.
(1) Generic terms and abbreviations
Generic term/abbreviation
PX Developer
Programming tool
Monitor tool
GX Works2
GX Developer
GX Simulator
GX Simulator2
GX application
GX project
Simulator
OPS
Standalone
Server
Primary server
Secondary server
Client
GT SoftGOT
GT Designer2
GT Designer3
Windows 8.1
R
Windows 8
R
Windows 7
R
Description
Generic term for PX Developer Version 1 (SW1D5C-FBDQ-E) and PX Developer Monitor Tool
(SW1DNC-FBDQMON-E)
For PX Developer, Programming Tool and Monitor Tool are installed.
For PX Developer Monitor Tool, only Monitor Tool is installed.
Abbreviation for PX Developer programming tool
Abbreviation for PX Developer monitor tool
Abbreviation for GX Works2 Version 1 (SW1DNC-GXW2-E Version 1.98C) or later
Abbreviation for GX Developer Version 7 (SW7D5C-GPPW-E Version 7.20W) or later
Abbreviation for GX Simulator Version 7 (SW7D5C-LLT-E Version 7.27D) or later
Abbreviation for GX Works2 simulation function
Generic term for GX Works2 and GX Developer interacted with PX Developer
Generic term for GX Works2 project and GX Developer project included in PX Developer
Generic term for GX Simulator2 (GX Works2 simulation function) and GX Simulator
Abbreviation for Operator Station
Abbreviation for a monitor tool configured by of the standalone monitoring system with only one
OPS, not interacting with other OPSs
Abbreviation for a monitor tool which starts up as Server in the server/client monitoring system
interacting with multiple OPSs
Abbreviation for a server to which clients connect primarily
Abbreviation for a server to which clients automatically reconnect when a primary server error
occurs
Abbreviation for a monitor tool which starts up as Client in the server/client monitoring system
interacting with multiple OPSs
Generic term for GT SoftGOT1000 Version 2, GT SoftGOT1000 Version 3, and GT SoftGOT2000
Version 1
Abbreviation for GT Designer2 Version 2
Abbreviation for GT Designer3 Version 1
Generic term for Microsoft Windows 8.1 Operating System,
Microsoft Windows 8.1 Pro Operating System, and
Microsoft Windows 8.1 Enterprise Operating System
Generic term for Microsoft Windows 8 Operating System,
Microsoft Windows 8 Pro Operating System, and
Microsoft Windows 8 Enterprise Operating System
Generic term for Microsoft Windows 7 Starter Operating System,
Microsoft Windows 7 Home Premium Operating System,
Microsoft Windows 7 Professional Operating System,
Microsoft Windows 7 Ultimate Operating System, and
Microsoft Windows 7 Enterprise Operating System
Generic term for Microsoft Windows Vista Home Basic Operating System,
Microsoft Windows Vista Home Premium Operating System,
Microsoft Windows Vista Business Operating System,
Microsoft Windows Vista Ultimate Operating System, and
Microsoft Windows Vista Enterprise Operating System
Generic term for Microsoft Windows XP Professional Operating System and
Microsoft Windows Home Edition Operating System
Generic term for IBM-PC/AT-compatible personal computer
Generic term for Q02PHCPU, Q06PHCPU, Q12PHCPU, and Q25PHCPU
Generic term for Q12PRHCPU and Q25PRHCPU
Generic term for the Process CPU and Redundant CPU
R
R
R
R
R
R
R
R
R
R
R
R
R
R
R
R
R
R
R
R
R
R
R
Windows Vista
R
R
R
R
R
R
R
R
R
R
Windows XP
R
Personal computer
Process CPU
Redundant CPU
CPU module
A-20
R
R
R
R
A-20
Generic term/abbreviation
QCPU
PC CPU module
Computer link
module
Serial
communication
module
For A series
For AnU series
For QnA series
For Q series
Redundant type extension base unit
CC-Link IE Controller Network
module
MELSECNET/H module
Ethernet module
Description
Generic term for Q00JCPU, Q00UJCPU, Q00CPU, Q00UCPU, Q01CPU, Q01UCPU, Q02CPU,
Q02HCPU, Q02PHCPU, Q02UCPU, Q03UDCPU, Q03UDECPU, Q03UDVCPU, Q04UDHCPU,
Q04UDVCPU, Q06HCPU, Q06PHCPU, Q06UDHCPU, Q06UDEHCPU, Q06UDVCPU,
Q10UDHCPU, Q10UDEHCPU, Q12HCPU, Q12PHCPU, Q12PRHCPU, Q13UDHCPU,
Q13UDEHCPU, Q13UDVCPU, Q20UDHCPU, Q20UDEHCPU, Q25HCPU, Q25PHCPU,
Q25PRHCPU, Q26UDHCPU, Q26UDEHCPU, Q26UDVCPU, Q50UDEHCPU, and
Q100UDEHCPU
Abbreviation for MELSEC-Q series-compatible PC CPU module manufactured by CONTEC CO. ,
LTD.
Generic term for A1SJ71C24-R2, A1SJ71C24-R4, A1SJ71C24-PRF, A2CCPUC24, A2CCPUC24PRF, and A1SCPUC24-R2
Generic term for AJ71UC24, A1SJ71UC24-R2, A1SJ71UC24-R4, and A1SJ71UC24-PRF
Generic term for AJ71QC24, AJ71QC24-R2, AJ71QC24-R4, AJ71QC24N, A1SJ71QC24,
A1SJ71QC24-R2, AJ71QC24N-R2, AJ71QC24N-R4, A1SJ71QC24N, and A1SJ71QC24N-R2
Generic term for QJ71C24, QJ71C24-R2, QJ71C24N, QJ71C24N-R2, and QJ71C24N-R4
Abbreviation for Q65WRB extension base unit for redundant system
Generic term for QJ71GP21-SX and QJ71GP21S-SX
Generic term for QJ71LP21, QJ71LP21-25, QJ71LP21S-25, QJ71LP21G, and QJ71BR11
Generic term for E71, QE71, and Q series-compatible E71
Generic term for AJ71E71-S3, A1SJ71E71-B2-S3, A1SJ71E71-B5-S3, AJ71E71N-B2, AJ71E71NE71
B5T, A1SJ71E71N-B2, A1SJ71E71N-B5T, AJ71E71N-T, A1SJ71E71N-T, AJ71E71N-B5,
A1SJ71E71N-B5, AJ71E71N3-T, and A1SJ71E71N3-T
Generic term for AJ71QE71, AJ71QE71-B5, A1SJ71QE71-B2, A1SJ71QE71-B5, AJ71QE71N-T,
QE71
A1SJ71QE71N-T, AJ71QE71N-B5, A1SJ71QE71N-B5, AJ71QE71N-B2, A1SJ71QE71N-B2,
AJ71QE71N-B5T, A1SJ71QE71N-B5T, AJ71QE71N3-T, and A1SJ71QE71N3-T
Q series-compatible E71
Generic term for QJ71E71-100, QJ71E71-B5, QJ71E71-B2, and QJ71E71
Generic term for AJ61BT11, A1SJ61BT11, AJ61QBT11, A1SJ61QBT11, QJ61BT11, and
CC-Link module
QJ61BT11N
C24
Generic term for computer link module and serial communication module
G4 module
Abbreviation for AJ65BT-G4(-S3) peripheral connection module
CC-Link IE Controller Network
Abbreviation for CC-Link IE Controller Network system compatible with the Q series
MELSECNET/H
Abbreviation for MELSECNET/H network system compatible with the Q series
MELSECNET/10
Abbreviation for MELSECNET/10 network system compatible with the AnU, QnA/Q4AR
Abbreviation for function and performance-compatible mode so that the MELSECNET/H network
MELSECNET/10 compatible mode
system can have upward compatibility to existing MELSECNET/10 network system
CC-Link IE Controller Network board Abbreviation for CC-Link IE Controller Network interface board
MELSECNET/H board
Abbreviation for MELSECNET/H interface board
MELSECNET/10 board
Abbreviation for MELSECNET/10 interface board
R
Ethernet board
Generic term for Ethernet PC card and Ethernet interface board supported by Windows
CC-Link board
Generic term for A80BDE-J61BT11, A80BDE-J61BT13, Q81BD-J61BT11, and Q80BD-J61BT11N
Generic term for MELSECNET/10(H) network module of QJ71LP21, QJ71LP21-25, and
Network module
QJ71BR11, and Ethernet interface module of QJ71E71(-B2)
(2) Terms
Term
DDC
FBD
ST
FB
A-21
Description
Abbreviation for Direct Digital Control
A control of controller functions with a digital device.
Abbreviation for Function Block Diagram defined in IEC61131-3
Programs are created by connecting variables, constants, and blocks containing specific processing,
according to the flow of data signal.
Abbreviation for Structured Text defined in IEC61131-3
Programs are created by writing arithmetic operations and logical operations in text format.
Abbreviation for Function Block
A block with a specific function used in a program.
A-21
Term
Tag
Tag data
Tag data item
Tag FB
Global variable
Faceplate
Lockout tag
SV
PV
DV
MV
PID control
Auto tuning step response
method
Auto tuning limit cycle
method
Project ID code
Assignment information
database
Operation mode
Backup mode
Separate mode
Debug mode
Operation mode change
System A
System B
A-22
Description
Identification symbol attached to each DDC processing defined by JIS
This can be likened to a tag attached to process control equipment.
Summarizes data attached to DDC processing indicated with a tag (process condition data/process status
data).
Accessing the tag data can monitor status and set conditions of the relevant DDC.
Each data item that makes up tag data
Function block works as a controller or an indicator containing tag data
Variables registered in the global variable declaration window in programming tool.
Gauge window on which an indicator such as a controller is displayed in image format
Values assigned to tag data are manipulated.
Eye-graph tag displayed on a faceplate that indicates precautions for operations and restrictions according to
operation authority
Also, this designates making the settings to the faceplate.
Setting value
Process variable
Deviation
Difference between setting value (SV) and process variable (PV)
Manipulated variable
Control that calculates and outputs a manipulated variable (MV) to have the process variable (PV) reach to
the same value as the setting value (SV) sooner and precisely by combining P action (proportional action), I
action (integral action), and D action (derivative action)
Method that detects dynamic characteristics by moving the plant and automatically obtains proportional gain
(Kp), integral time (Ti), and derivative time (Td) of PID based on the Ziegler-Nichols step response method
Method that detects dynamic characteristics by moving the plant and automatically obtains proportional gain
(Kp), integral time (Ti), and derivative time (Td) of PID based on the vibration amplitude and vibration period
caused by two-step action (on-off action) of manipulated variable (MV)
Identification code used to check whether the monitor target project (
Section 9.4) set with the monitor
tool matches the project in the CPU module
‘*.mdb’ file which is created when compilation is executed in the programming tool
This file stores assignment information of variables for storing data such as tag data, global variable and
device information of the CPU module.
Mode for determining the operation method of the redundant system
The following three modes are available.
• Backup mode
• Separate mode
• Debug mode
Mode for normal operation of the redundant system
If a failure or an error occurs in the control system, the standby system switches to the control system to
continue the control of the redundant system.
The operation mode can be switched to the separate mode using GX application.
Mode for maintaining a system (partial modification of a program, replacement of modules mounted on the
main base unit) without stopping the control during run of the redundant system
During this mode, different programs can be executed in the control system and standby system.
System switching cannot be made in this mode (User switching is possible).
The operation mode can be switched to the backup mode using GX application.
Mode for performing a debug using a single system prior to redundant system operation
This permits operations without connecting tracking cables.
In this mode, the CPU module is fixed to system A, control system.
(Tracking of the redundant system is not performed.)
Set/cancel this mode in the redundant parameter setting of GX application.
Switching of the operation mode for system A and system B using GX application while the redundant
system is running
The operation mode can be switched between the backup mode and separate mode.
System to which system A connector for tracking cable is connected in the redundant system
System to which system B connector for tracking cable is connected in the redundant system
A-22
Term
System switching
System switching
User switching
Control system
Standby system
Tracking transfer function
Redundant system
Redundant parameter
Well-known port number
Modal dialog box
Modeless dialog box
A-23
Description
Control switching to backup system to continue system control and network communication when a trouble
occurs in the system that performs control in the redundant system (when a failure or an error occurs in the
power supply system, mounted module, or network)
(Switching between control system and standby system to avoid system down)
The following two types are available.
• System switching
Automatic system switching by the redundant system when a trouble occurs
• User switching
System switching by sequence program/GX application
A system that performs program operation, system control, and network communication in the redundant
system
When system A and system B start concurrently in the backup mode, the system A will be the control
system.
(Concurrent startup: One system starts within three seconds after the other system has started.)
When the system A and system B start separately, a system that starts first will be the control system.
Backup system to continue system control in case of a failure or an error in the module in the control system
in the redundant system (The CPU module in the standby system does not calculate programs.)
When system A and system B start concurrently in the backup mode, the system B will be the standby
system.
(Concurrent startup: One system starts within three seconds after the other system has started.)
When the system A and system B start separately, a system that starts later will be the standby system.
Data transfer function that keeps the data of control system and standby system consistent
This function enables the standby system to serve as the control system to continue the system control in
case of system down of the control system.
The Redundant CPU can perform tracking transfer without making the tracking settings, as it tracking transfer
setting data has been set by default. (Change tracking transfer setting data using GX application.)
System configured using Redundant CPUs
This system consists of two basic systems including CPU modules, power supply modules, and network
modules. (If module error occurs in one system, the other system continues the system control. Thus, system
reliability is improved.)
To configure the redundant system, prepare two sets of the systems where the above modules of the same
models are mounted on the base unit, and connect the CPU modules with tracking cables.
Parameter for setting operation mode of Redundant CPU system and tracking transfer setting data (tracking
setting)
Use GX application to set the parameter.
Port number used in main protocols of TCP/IP
Assigned in the range of 0 to 1023.
A dialog box that avoids any operations other than relating to the open dialog box until it is closed
A dialog box that can be left open while performing any other operations
A-23
MEMO
A-24
A-24
1 OVERVIEW
MELSOFT
1 OVERVIEW
1
1.1 Overview
PX Developer is a software package which supports processing DDC on CPU
module.
PX Developer consists of programming tool and monitor tool. The programming work
is done in FBD language. DDC processing monitor is done with tag data.
PX Developer
Programming tool (FBD program editing function,
FBD Ladder compile function)
Monitor tool (DDC monitoring function)
FBD: Function Block Diagram. DDC: Direct Digital Control.
The monitor tool mentioned in this manual is a software tool monitoring and
controlling DDC processing on CPU module.
<Monitor Tool Screen>
1-1
1-1
1 OVERVIEW
MELSOFT
The monitor tool monitors and controls DDC processing executed in the way of tag
FB with the programming tool.
Inside Tag FB, there is a data area called tag data. This tag data is arranged on the
PLC device. When a program with this tag FB is executed, the tag data can show the
logical status of DDC processing at any time. Meanwhile, the monitor tool controls
DDC processing logic itself through parameters in this tag data.
Monitor tool communicates with CPU module, and monitors/controls this tag data.
The content of tag data can be read and displayed on various kinds of monitor
screens. And values can be written to the tag data by users' operation.
The global variables and devices can be read and displayed on the various kinds of
monitor screens.
1
CPU module
PLC Device
(R device)
TIC001
M_PID
MVN
PVP
CASIN
CASOUT
:
:
Monitor tool accesses tag data,
monitors and controls DDC process
on CPU module.
:
FUNC
TAG FB
Monitor tool
MODE
MDH
ALM
INH
Various
monitoring
functions
Device read out
Device write in
ALML
CTNO
:
:
:
:
:
Tag data
Personal computer
The monitoring status with the insertion of tag data
Besides, monitor tool offers ActiveX controls which can be acquired/set the desired
values inside tag data or display faceplates. As a result, the desired user graphic
screens (user monitor screens) can be created with Microsoft Visual Basic .
User-created screens made with ActiveX control are easy to be opened by pressing
buttons on the monitor tool.
R
1-2
R
1-2
1 OVERVIEW
MELSOFT
1.2 Features
(1) Shorten configuration time of process control system with tag
monitoring control function.
Various standard functions are installed inside the monitor tool for tag monitoring
control, which are necessary for the start adjustment of process control system.
Communication processing does not need to be programmed, because
monitoring work can be done by easily setting tags made by PX Developer
programming tool.
[Standard monitor function installed inside PX Developer monitor tool]
<Tuning trend graph>
<Control panel>
<Alarm list>
<Faceplate>
<Trend graph>
<Event list>
(2) Various connection methods with CPU
The monitor tool can monitor and operate up to 16 CPU modules via CC-Link IE
Controller Network, MELSECNET/10(H) or Ethernet network.
The serial/USB connection, CC-Link connection and GOT transparent are
allowed for adjusting the CPU.
[Communication route of PLC transfer setup that can be set in the monitor tool]
Communication route
Adjustment
Application
Serial/USB
MELSECNET/10
MELSECNET/H
CC-Link IE Controller Network
: usable
: unusable
Ethernet
CC-Link
GOT transparent
1-3
1-3
1 OVERVIEW
MELSOFT
(3) Operation environment with single/multiple windows adapted to
different purposes.
According to different purposes, single-window mode and multi-window mode
can be selected. The former can always display only one screen in maximal size.
The latter can display several screens at the same time, furthermore, the
window's size and its arrangement can be changed freely through easy setting.
<Single-window mode>
<Multi-window mode>
(4) Mis-operation by persons not concerned can be avoided by
managing user names and passwords.
In monitor tool, operators without registering user names and passwords
(without right) cannot change modes to change numerical values and setting.
Setting the mode to the lock mode enables to avoid mis-operations by persons
not concerned even operators are out.
Lock Mode
Only monitoring is available.
Engineer Mode
(for design and
management)
Operator Mode
(for monitoring)
The monitoring operation *1
is available.
User name and password specifying
mode modification
The monitoring operation *1
and setting data change
are available.
*1: The monitoring operation is for monitoring/changing the tag data.
1-4
1-4
1 OVERVIEW
MELSOFT
(5) Interaction with GT SoftGOT is possible
Graphic screens created with GT Designer2 can be displayed by starting up GT
SoftGOT from the Monitor tool. The existing GOT screens can be utilized and
also graphics can be created using familiar GT Designer2 or GT Designer3.
Calling monitor tool functions such as faceplate from GT SoftGOT reduces
working hours for creating screens.
Monitor toolbar
Switches the GT SoftGOT base
screen.
GT SoftGOT base screen
A graphic screen that is displayed
full-screen on the desktop.
Faceplate screen
GT SoftGOT touch switch
Monitors or operates tags
and performs tuning.
Pops up each screen
for Monitor tool.
(6) Auto-generation of GOT screen is possible
GOT screen project can be generated automatically from PX Developer project
by using the monitor tool to execute simple setting such as placing screens and
then following the wizard to enter required items. This reduces working hours for
creating monitoring operation screens.
< Monitor tool >
1-5
< GOT screen project >
1-5
1 OVERVIEW
MELSOFT
(7) Support user-created screen made by Microsoft Visual Basic
R
R
Monitor tool provides ActiveX control to get tag data value. To use this control on
the graphs made by Microsoft Visual Basic , the tag data can be monitored.
R
R
Click button on the
screen to open the
faceplate
Display the monitoring
value of tag data on the
user-created screen
(8) Application to Redundant CPU
Monitoring and control can be performed by redundant system including
Redundant CPUs.
When the system is switched, the monitoring/control target is automatically
changed.
QnPRHCPU Redundant configuration
Tracking cable
PX
Developer
(9) Monitoring is enabled by the monitor tool only.
The personal computer in which GX application has not been installed can be
monitored by the PX Developer Version 1.06G or later monitor tool only.
(10) Connecting to Simulator
Offline debugging is possible with Simulator in PX Developer Version 1.28E or
later.
This enables simulation of setting check and monitor operation without
connecting a CPU module.
1-6
1-6
1 OVERVIEW
MELSOFT
(11) Configuring the server/client monitoring system is possible
1) Improving communication performance between the monitor tool and PLCs
A server performs communication with PLCs in a batch, so communication
loads on PLCs can be reduced and communication performance can be
improved.
2) Displaying the same monitor screen with the monitor tool on every OPS
The monitoring data collected/managed by a server can be displayed on
clients. In other words, the same monitor screen can be displayed with the
monitor tool on every OPS.
3) Continuous monitoring is possible regardless of server errors
Installing a primary server and a secondary server in the monitoring system
enables continuous monitoring when an error occurs in the primary server,
for clients switch the server to connect automatically.
4) Synchronizing a buzzer stop and check/deletion of an alarm/event
When an operation, such as a buzzer stop and check/deletion of an
alarm/event, is performed in one of OPSs in the monitoring system, its result
synchronizes in every OPS in the monitoring system.
Monitor tool clients
Access the monitoring data collected/managed
by a server and display it.
A operation result in one OPS
synchronizes in all other OPSs
in the monitoring system.
PX
Developer
PX
Developer
PX
Developer
Personal computers
(client)
Ethernet
Monitor tool server (primary)
Communicates with PLCs in a batch
and collects/manages/displays the
monitoring data.
PX
Developer
PX
Developer
Personal computer
(primary server)
Monitor tool server (secondary)
Synchronizes the setting data
with the primary server to
provide against outages of the
primary server.
Personal computer
(secondary server)
CC-Link IE Controller Network, MELSECNET/10(H), Ethernet
QnPHCPU
QnPHCPU
Tracking cable
Tracking cable
QnPRHCPU (redundant system)
QnPRHCPU (redundant system)
POINT
In the redundant server system, the setting data can be changed in the primary
server. The secondary server starts up using the setting data of the primary
server.
The monitoring data is not equalized between primary and secondary servers.
The monitoring data equalization is a process that synchronizes the monitoring
data, such as trend and alarm, between primary and secondary servers.
1-7
1-7
1 OVERVIEW
MELSOFT
MEMO
1-8
1-8
2 SYSTEM CONFIGURATION
MELSOFT
2 SYSTEM CONFIGURATION
2.1 System Configuration
This section deals with system configuration of monitor tools.
2
2.1.1 Supported CPU
Process CPU:
Q02PHCPU, Q06PHCPU, Q12PHCPU, Q25PHCPU
Redundant CPU: Q12PRHCPU, Q25PRHCPU
2.1.2 Communication route
(1) Connecting to Process CPU
QnPHCPU +
Serial communication module
QnPHCPU
MELSECNET/H Remote I/Omodule
RS-232 cable
1)-2
MELSECNET/10(H)
(RemoteI/O network)
RS-232 cable
QnPHCPU +
CC-Link IE Controller Network,
MELSECNET/H module
1)-3
QnPHCPU
RS-232 cable
USB cable
QnPHCPU + CC-Link module
1)-1
G4 module
1)-4
RS-422
conversion cable
PX
Developer
CC-Link IE Controller Network,
MELSECNET/10(H) board
2) 3) 4) 5)
CC-Link IE
Controller Ne twork,
MELSECNET/10(H)
(PLC network)
Twisted pair cable
7)
8) 6)
Commercially available Ethernetboard
CC-Link board
QnPHCPU + Ethernet module
Twisted pair cable
USB cable
RS-232 cable
Ethernet
GOT
QnPHCPU
2-1
2-1
2 SYSTEM CONFIGURATION
MELSOFT
Supported route when using Process CPU
When Process CPU is applied for normal operations as operator station, configuring the system that can
receive the event notification is required. For details, refer to Appendix 1.2.
No.
2
1)-1
Connection method
CPU module
Precautions for connection
Applicable only for adjusting the CPU.
If applied for performing normal operations of the CPU as operator station, the
1
performance cannot be guaranteed. *
2
One CPU module can be connected from one personal computer by USB cable. *
1)-2
C24
Applicable only for adjusting the CPU.
Serial/USB
If applied for performing normal operations of the CPU as operator station, the
connection MELSECNET/10(H)
1
performance cannot be guaranteed. *
1)-3
remote
Use the type of AJ65BT-G4-S3.
Applicable only for adjusting the CPU.
1)-4
G4 module
If applied for performing normal operations of the CPU as operator station, the
1
performance cannot be guaranteed. *
The PLC must be set to the MELSECNET/10 compatible mode.
MELSECNET/10 connection
When connecting a PLC using different types of networks in single network
(When using the MESECNET/
2)
connection or connecting in coexistence network connection, the performance
10 board)
1
as an operator station in normal operation is not guaranteed. *
The MELSECNET board and PLC must be set to the MELSECNET/10
MELSECNET/10 connection
compatible mode.
(When using the MESECNET/ H When connecting a PLC using different types of networks in single network
3)
connection or connecting in coexistence network connection, the performance
board)
1
as an operator station in normal operation is not guaranteed. *
When connecting a PLC using different types of networks in single network
connection or connecting in coexistence network connection, the performance
4)
MELSECNET/H connection
1
as an operator station in normal operation is not guaranteed. *
3
CC-Link IE Controller Network compatible version of Process CPU is required.*
The driver for CC-Link IE Controller Network board which supports the event
4
notification function is required.*
CC-Link IE Controller Network
Applicable only for adjusting the CPU when connecting a PLC using different
5)
connection
types of networks in single network connection or connecting in coexistence
network connection.
If applied for performing normal operations of the CPU as operator station, the
1
performance cannot be guaranteed. *
The performance as an operator station in normal operation is not guaranteed
1
under the following conditions. *
• The IP addresses of the Ethernet module and personal computer are not in the
same segment.
6)
Ethernet connection
5
• When a wireless LAN adapter (NZ2WL) * is applied for communication route.
• Single network connection in which a PLC is connected using different types of
networks or in coexistence network connection.
Applicable only for adjusting the CPU.
If applied for performing normal operations of the CPU as operator station, the
7)
CC-Link connection
1
performance cannot be guaranteed. *
CC-Link Ver.1 and Ver.2 boards cannot be used together.
Connection method via GOT is the same as that of GX application.
Note that, GOT transparent function via GOT 2000 is not supported by GX
Developer.
6
8)
GOT transparent connection*
Applicable only for adjusting the CPU.
If applied for performing normal operations of the CPU as operator station, the
1
performance cannot be guaranteed. *
2-2
2-2
2 SYSTEM CONFIGURATION
MELSOFT
*1: This happens as the monitor tool cannot receive event notification. For the system configuration that can receive event
notification, refer to Appendix 1.2.
*2: Refer to POINT in Section 2.1.3 .
*3: The Process CPU whose first five digits of serial number is 10042 or later is required.
*4: The driver for CC-Link IE Controller Network board (SW1DNC-MNETG-B) version 1.08J or later is required.
*5: Use a wireless LAN adapter corresponding to national standards where it is used. For details, refer to the manuals of
wireless LAN adapter.
*6: For details of GOT transparent function, refer to the following manuals:
• GOT2000 Series Connection Manual (Mitsubishi Product) For GT Works3 Version1
• GOT1000 Series Connection Manual (Mitsubishi Products) for GT Works3
• GOT-A900 Series User's Manual (Connection System Manual)
• GOT-F900 SERIES HARDWARE MANUAL [Connection]
2-3
2-3
2 SYSTEM CONFIGURATION
MELSOFT
(2) Connecting to Redundant CPU of redundant system
(backup mode/separate mode)
QnPRHCPU redundant configuration
Tracking cable
Redundant type extension base unit
+ serial communication module
QnPRHCPU redundant configuration
QnPRHCPU redundant configuration
Tracking cable
MELSECNET/10(H)
(remote I/O network)
USB cable
RS-232 cable
RS-232 cable
MELSECNET/H remote I/O module
RS-232 cable
or serial communication module
1)-2
1)-1
1)-2,3
PX
Developer
Tracking cable
QnPRHCPU+CC-Link IE
Co ntroller Ne twork, MELSECNET/H module
redundant configuration
CC-Link IE Co ntroller Ne twork,
MELSECNET/H board
2) 3) 4)
Tracking cable
CC-Link IE
Controller Network,
MELSECNET/10(H)
(PLC network)
QnPRHCPU +
CC-Link module redundant configuration
G4 module
Tracking
cable
Twisted pair cable
1)-4
RS-422
conversion
cable
6) 7) 5)
Commercially
QnPRHCPU +
available
Ethernet board Ethernet module redundant configuration
CC-Link board
Twisted pair cable
QnPRHCPU redundant configuration
Tracking cable
Ethernet
Tracking cable
QnPRHCPU redundant configuration
Twisted pair cable
Redundant type extension base unit
+ CC-Link module
USB cable
RS-232 cable
Tracking cable
GOT
Redundant type extension base unit
+ Ethernet module
QnPRHCPU redundant configuration
Tracking cable
2-4
2-4
2 SYSTEM CONFIGURATION
MELSOFT
Supported route when using Redundant CPU (redundant configuration)
When Process CPU is applied for normal operations as operator station, configuring the system that can
receive the event notification is required. For details, refer to Appendix 1.2.
No.
1)-1
1)-2
1)-3
1)-4
2)
3)
4)
2-5
Connection method
Precautions for connection
Applicable only for adjusting the CPU.
If applied for performing normal operations of the CPU as operator station, the
1
performance cannot be guaranteed. *
Connect a cable to the CPU module in either of system A or system B.
CPU module
(The communication is performed with the CPU module of another system via
tracking cable.)
2
One CPU module can be connected from one personal computer by USB cable. *
When connecting via the serial communication module mounted to the
redundant type extension base unit, the version of Redundant CPU needs to be
Serial/USB
3
compatible with the redundant type extension base unit. *
connection C24
Applicable only for adjusting the CPU.
If applied for performing normal operations of the CPU as operator station, the
1
performance cannot be guaranteed. *
Applicable only for adjusting the CPU.
MELSECNET/10(H)
If applied for performing normal operations of the CPU as operator station, the
remote
1
performance cannot be guaranteed. *
Applicable only for adjusting the CPU.
If applied for performing normal operations of the CPU as operator station, the
G4 module
1
performance cannot be guaranteed. *
The MELSECNET board and PLC must be set to the MELSECNET/10
compatible mode.
4
MELSECNET/10 connection*
The driver for MELSECNET/H interface board and the MELSECNET/H module
5
(When using the MESECNET/ H whose versions support Redundant CPU are required. *
When connecting PLCs using different types of networks in single network
board)
connection or connecting in coexistence network connection, the performance
1
as an operator station in normal operation is not guaranteed. *
The driver for MELSECNET/H interface board and the MELSECNET/H module
5
whose versions support Redundant CPU are required. *
When connecting PLCs using different types of networks in single network
MELSECNET/H connection
connection or connecting in coexistence network connection, the performance
1
as an operator station in normal operation is not guaranteed. *
CC-Link IE Controller Network compatible version of Redundant CPU is required.
6
*
The CC-Link IE Controller Network module whose version supports Redundant
7
CPU is required.*
The driver for CC-Link IE Controller Network board which supports the event
CC-Link IE Controller Network
8
notification function is required.*
connection
Applicable only for adjusting the CPU when connecting a PLC using different types
of networks in single network connection or connecting in coexistence network
connection.
If applied for performing normal operations of the CPU as operator station, the
1
performance cannot be guaranteed. *
2-5
2 SYSTEM CONFIGURATION
No.
Connection method
5)
Ethernet connection
6)
CC-Link connection
7)
GOT transparent connection*
11
MELSOFT
Precautions for connection
The Ethernet module of function version D or later is required to support the
Redundant CPU.
When connecting via the Ethernet module mounted to the redundant type
extension base unit, the version of Redundant CPU needs to be compatible with
3
the redundant type extension base unit. *
The performance as an operator station in normal operation is not guaranteed
1
under the following conditions. *
• The IP addresses of the Ethernet module and personal computer are not in the
same segment.
9
• When a wireless LAN adapter (NZ2WL) * is applied for communication route.
• Single network connection in which a PLC is connected using different types of
networks or in coexistence network connection.
• Connection via the Ethernet module mounted to a redundant type extension
base unit.
R
• When using monitor tool with Windows Vista or later, the IP addresses of
Ethernet modules of both system A and system B are not on the same
segment.
The driver for CC-Link Ver.1 board and CC-Link module whose versions support
10
Redundant CPU are required. *
Applicable only for adjusting the CPU.
If applied for performing normal operations of the CPU as operator station, the
1
performance cannot be guaranteed. *
CC-Link Ver.1 and Ver.2 boards cannot be used together.
When connecting via the CC-Link module mounted to the redundant type
extension base unit, the version of Redundant CPU needs to be compatible with
3
the redundant type extension base unit. *
Connection method via GOT is the same as that of GX application.
Applicable only for adjusting the CPU.
Note that, GOT transparent function via GOT 2000 is not supported by GX
Developer.
If applied for performing normal operations of the CPU as operator station, the
1
performance cannot be guaranteed. *
*1: This happens as the monitor tool cannot receive event notification. For the system configuration that can receive event
notification, refer to Appendix 1.2.
*2: Refer to POINT in Section 2.1.3.
*3: The Redundant CPU whose first five digits of serial number is 09012 or later is required.
*4: The MELSECNET/10 board is inapplicable, as the driver (SW DNF-MNET10) is incompatible with the Redundant
CPU.
*5: For MELSECNET/H interface board, refer to Section 2.1.4 (1). For MELSECNET/H interface module, the function
version D or later is required.
*6: The Redundant CPU whose first five digits of serial number is 10042 or later is required.
*7: The CC-Link IE Controller Network module whose first five digits of serial number is 10041 or later is required.
*8: The driver for CC-Link IE Controller Network board (SW1DNC-MNETG-B) version 1.08J or later is required.
*9: Use a wireless LAN adapter corresponding to national standards where it is used. For details, refer to the manuals of
wireless LAN adapter.
*10: For CC-Link Ver.1 board, refer to Section 2.1.4 (3). For CC-Link module, the QJ61BT11N whose first five digits is
06052 or later is required.
*11: For details of GOT transparent function, refer to the following manuals:
• GOT2000 Series Connection Manual (Mitsubishi Product) For GT Works3 Version1
• GOT1000 Series Connection Manual (Mitsubishi Products) for GT Works3
• GOT-A900 Series User's Manual (Connection System Manual)
• GOT-F900 SERIES HARDWARE MANUAL [Connection]
2-6
2-6
2 SYSTEM CONFIGURATION
MELSOFT
(3) Connecting to Redundant CPU of single configuration (debug
mode)
QnPRHCPU single CPU configuration
Redundant type extension base unit
+ serial communication module
QnPRHCPU single CPU configuration
QnPRHCPU single CPU configuration
RS-232 cable
MELSECNET/10(H)
(remote I/O network)
USB cable
RS-232 cable
1)-2
MELSECNET/H
remote I/O module or
serial communication module
RS-232 cable
1)-4
6)
QnPRHCPU+CC-Link IE
Controller Network, MELSECNET/H module
single CPU configuration
CC-Link IE Controller Network,
MELSECNET/H board
CC-Link IE
PX
Developer
1)-2,3
QnPRHCPU + CC-Link module
G4 module
single CPU configuration
1)-1
2) 3) 4)
Controller Network,
MELSECNET/10(H)
(PLC network)
5)
RS-422
conversion
cable
Commercially QnPRHCPU + Ethernet module
single CPU configuration
available
Ethernet board
Twisted pair cable
QnPRHCPU
single CPU configuration
CC-Link board
Ethernet
Twisted pair cable
QnPRHCPU
single CPU configuration
7)
USB cable
RS-232 cable
Redundant type extension base unit
+ CC-Link module
GOT
Redundant type extension base unit
+ Ethernet module
QnPRHCPU
Single CPU configuration
POINT
When monitoring the Redundant CPU in the debug mode, power off the other
Redundant CPU or disconnect the CPU from network. Otherwise, a communication
error may occur or PX Developer may not normally monitor.
2-7
2-7
2 SYSTEM CONFIGURATION
MELSOFT
Supported route when using Redundant CPU (single CPU configuration)
When Process CPU is applied for normal operations as operator station, configuring the system that can
receive the event notification is required. For details, refer to Appendix 1.2.
No.
1)-1
1)-2
1)-3
1)-4
2)
3)
4)
5)
2-8
Connection method
Precautions for connection
Applicable only for adjusting the CPU.
If applied for performing normal operations of the CPU as operator station, the
CPU module
1
performance cannot be guaranteed. *
2
One CPU module can be connected from one personal computer by USB cable. *
When connecting via the serial communication module mounted to the
redundant type extension base unit, the version of Redundant CPU needs to be
3
compatible with the redundant type extension base unit. *
C24
Applicable only for adjusting the CPU.
Serial/USB
If applied for performing normal operations of the CPU as operator station, the
connection
1
performance cannot be guaranteed. *
Applicable only for adjusting the CPU.
MELSECNET/10(H)
If applied for performing normal operations of the CPU as operator station, the
remote
1
performance cannot be guaranteed. *
Applicable only for adjusting the CPU.
If applied for performing normal operations of the CPU as operator station, the
G4 module
1
performance cannot be guaranteed. *
The MELSECNET board and PLC must be set to the MELSECNET/10
compatible mode.
4
MELSECNET/10 connection*
The driver for MELSECNET/H interface board and the MELSECNET/H module
5
(When using the MESECNET/ H whose versions support Redundant CPU are required. *
When connecting a PLC using different types of networks in single network
board)
connection or connecting in coexistence network connection, the performance
1
as an operator station in normal operation is not guaranteed. *
The driver for MELSECNET/H interface board and the MELSECNET/H module
5
whose versions support Redundant CPU are required. *
When connecting a PLC using different types of networks in single network
MELSECNET/H connection
connection or connecting in coexistence network connection, the performance
1
as an operator station in normal operation is not guaranteed. *
CC-Link IE Controller Network compatible version of Redundant CPU is
6
required.*
The CC-Link IE Controller Network module whose version supports Redundant
7
CPU is required. *
The driver for CC-Link IE Controller Network board which supports the event
CC-Link IE Controller Network
8
notification function is required.*
connection
Applicable only for adjusting the CPU when connecting a PLC using different
types of networks in single network connection or connecting in coexistence
network connection.
If applied for performing normal operations of the CPU as operator station, the
1
performance cannot be guaranteed. *
The Ethernet module of function version D or later is required to support the
Redundant CPU.
When connecting via the Ethernet module mounted to the redundant type
extension base unit, the version of Redundant CPU needs to be compatible with
3
the redundant type extension base unit. *
The performance as an operator station in normal operation is not guaranteed
1
under the following conditions. *
Ethernet connection
• The IP addresses of the Ethernet module and personal computer are not in the
same segment.
9
• When a wireless LAN adapter (NZ2WL) * is applied for communication route.
• Single network connection in which a PLC is connected using different types of
networks or in coexistence network connection.
• Connection via the Ethernet module mounted to a redundant type extension
base unit.
2-8
2 SYSTEM CONFIGURATION
No.
Connection method
6)
CC-Link connection
7)
GOT transparent connection*
11
MELSOFT
Precautions for connection
The driver for CC-Link Ver.1 board and CC-Link module whose versions support
10
Redundant CPU are required. *
Applicable only for adjusting the CPU.
If applied for performing normal operations of the CPU as operator station, the
1
performance cannot be guaranteed. *
CC-Link Ver.1 and Ver.2 boards cannot be used together.
When connecting via the CC-Link module mounted to the redundant type
extension base unit, the version of Redundant CPU needs to be compatible with
3
the redundant type extension base unit. *
Connection method via GOT is the same as that of GX application.
Applicable only for adjusting the CPU.
Note that, GOT transparent function via GOT 2000 is not supported by GX
Developer.
If applied for performing normal operations of the CPU as operator station, the
1
performance cannot be guaranteed. *
*1: This happens as the monitor tool cannot receive event notification. For the system configuration that can receive event
notification, refer to Appendix 1.2.
*2: Refer to POINT in Section 2.1.3.
*3: The Redundant CPU whose first five digits of serial number is 09012 or later is required.
*4: The MELSECNET/10 board is inapplicable, as the driver (SW DNF-MNET10) is incompatible with the Redundant
CPU.
*5: For MELSECNET/H interface board, refer to Section 2.1.4 (1). For MELSECNET/H interface module, the function
version D or later is required.
*6: The Redundant CPU whose first five digits of serial number is 10042 or later is required.
*7: The CC-Link IE Controller Network module whose first five digits of serial number is 10041 or later is required.
*8: The driver for CC-Link IE Controller Network board (SW1DNC-MNETG-B) version 1.08J or later is required.
*9: Use a wireless LAN adapter corresponding to national standards where it is used. For details, refer to the manuals of
wireless LAN adapter.
*10: For CC-Link Ver.1 board, refer to Section 2.1.4 (3). For CC-Link module, the QJ61BT11N whose first five digits is
06052 or later is required.
*11: For details of GOT transparent function, refer to the following manuals:
• GOT2000 Series Connection Manual (Mitsubishi Product) For GT Works3 Version1
• GOT1000 Series Connection Manual (Mitsubishi Products) for GT Works3
• GOT-A900 Series User's Manual (Connection System Manual)
• GOT-F900 SERIES HARDWARE MANUAL [Connection]
2-9
2-9
2 SYSTEM CONFIGURATION
MELSOFT
(4) Using the PC CPU module
MELSECNET/H
(Remote I/O network)
QnPHCPU/
QnPRHCPU
Serial communication module
MELSECNET/H
(Remote I/O network)
MELSECNET/H remote I/O module
QnPHCPU/QnPRHCPU
+CC-Link module
QnPHCPU+Serial communication module
QnPRHCPU
Twisted pair cable
RS-232 cable
G4 module
MELSECNET/H
board
RS-232 cable
RS422 cable
1)-4
1)-3
1)-2
1)-1
Serial/USB
QC PU
QnPHCPU/
QnPRHCPU
USB cable
QnPHCPU/QnPRHCPU
+Ethernet module
4)
Ethernet
MELSEC
NET/H
module
PC CPU module
QnPHCPU/QnPRHCPU
+MELSECNET/H module
CC-Link
module
2) 3)
PX Developer
5)
MELSECNET/H
(PLC network)
QnPHCPU/QnPRHCPU
+CC-Link module
BUS I/F driver
MELSECNET/H
CC-Link
Main base module (Q series bus)
Supported route when using PC CPU module
When Process CPU is applied for normal operations as operator station, configuring the system that can
receive the event notification is required. For details, refer to Appendix 1.2.
No.
Connection method
1)-1
1)-2
1)-3
1)-4
Precautions for connection
CPU module
Serial/USB
connection
C24
MELSECNET/H
remote
Same with the precautions for Serial/USB connection of (1) to (3).
G4 module
2
2)
3)
Same with the precautions for MELSECNET/10 connection of (1) to (3). *
MELSECNET/10 connection
However, applicable only for adjusting the CPU.
(When using the MESECNET/
If applied for performing normal operations of the CPU as operator station, the
H module)
1
performance cannot be guaranteed. *
2
Same with the precautions for MELSECNET/H connection of (1) to (3). *
However, applicable only for adjusting the CPU.
MELSECNET/H connection
If applied for performing normal operations of the CPU as operator station, the
1
performance cannot be guaranteed. *
4)
Ethernet connection
Same with the precautions for Ethernet connection of (1) to (3).
5)
CC-Link connection
Same with the precautions for CC-Link connection of (1) to (3). *
2
*1: This happens as the monitor tool cannot receive event notification. For the system configuration that can receive event
notification, refer to Appendix 1.2.
*2: If accessing other station via MELSECNET/H module and CC-Link module, the PC CPU must be set to control the
network modules.
2-10
2-10
2 SYSTEM CONFIGURATION
MELSOFT
2.1.3 Serial/USB connection
(1) Connection cables for serial/USB connection
The connection method of serial/USB connection cable is the same when they
are connected to GX application. For the applicable cables, refer to the following
manuals:
GX Works2 Version 1 Operating Manual (Common)
GX Developer Version 8 Operating Manual
POINT
The USB cable connection is not applicable in the following connection structure.
Only one personal computer and one CPU module can be connected by USB
cable.
<Structures cannot be constructed>
One personal computer installed with several USB ports is connected to
multiple CPU modules.
CPU module
USB cable
USB
c
CPU module
able
One personal computer is connected to multiple CPU modules through USB
hub.
CPU module
USB cable
USB
hub
USB cable
US
B
cab
le
CPU module
REMARK
By connecting a tracking cable to the Redundant
CPU in either of system A or system B,
QnPRHCPU in both systems can be monitored.
(The communication is performed with the CPU
module of another system via tracking cable.)
QnPRHCPU
Tracking cable
RS-232 cable (QC30R2)
or USB cable
PX
Developer
2-11
2-11
2 SYSTEM CONFIGURATION
MELSOFT
(2) Precautions on USB connection
1) A communication error may occur when the personal computer
communicates with the CPU module after setting the resume function,
suspend setting, power-saving function or standby mode.
Do not set any of the above functions for communication with the CPU
module.
2) A communication error may occur and normal operation may not be
recovered if connecting and disconnecting a USB cable, resetting the CPU
module or turning the power ON/OFF is performed frequently during
communication with the CPU module.
When a communication error occurs and normal operation is not recovered,
remove a USB cable from the CPU module, and then reconnect it after
more than five seconds.
(Even after this operation, an error may occur at the initial communication.
Communication, however, will be performed normally at the second time
and later.)
2-12
2-12
2 SYSTEM CONFIGURATION
MELSOFT
2.1.4 Network board
The following describes the applicable network boards to PX Developer Monitor Tool.
For details of corresponding operating systems of network boards, refer to the each
network board manual.
(1) MELSECNET/10, MELSECNET/H, CC-Link IE Controller Network
board
Network
Board
Driver
MELSECNET/10
A70BD-J71QLP23 (For PC/AT, optical)
A70BD-J71QBR13 (For PC/AT, coaxial)
MELSECNET/10 *
MELSECNET/H
Q81BD-J71LP21-25 (For PC/AT, optical) *
4
Q80BD-J71LP21-25 (For PC/AT, optical) *
Q80BD-J71LP21S-25 (For PC/AT, optical)
4
(With external power supply) *
4
Q80BD-J71LP21G (For PC/AT, optical) *
4
Q80BD-J71BR11 (For PC/AT, coaxial) *
CC-Link IE
Controller Network
Q81BD-J71GP21-SX (For PC/AT, coaxial) * *
Q81BD-J71GP21S-SX (For PC/AT, optical)
9, 10
(With external power supply) * *
9, 10
Q80BD-J71GP21-SX (For PC/AT, optical) * *
Q80BD-J71GP21S-SX (For PC/AT, optical)
9, 10
(With external power supply) * *
1, 2
SW3DNF-MNET10 (For PC/AT, optical) * *
4
3
SW0DNC-MNETH(-B)
5, 6, 7, 8, 14
(For PC/AT, optical) * * * * *
9, 10
11, 12, 13, 15
SW1DNC-MNETG-B *
*
*
*
*1: MELSECNET/10 board is inapplicable to Redundant CPU.
*2: Can be used only for Microsoft Windows 98 Operating System and Microsoft Windows NT
Workstation Operating System Version 4.0
*3: Should be used in the MELSECNET/10 compatibility mode.
*4: The product whose first five digits of serial number are "06032" or later is required to connect to the
Redundant CPU.
*5: Cannot be used for Microsoft Windows Millennium Edition Operating System
*6: The driver (SW0DNC-MNETH(-B)) version 90K or later is required to connect to Redundant CPU.
*7: For Windows 7, the driver (SW0DNC-MNETH-B) version 21X or later is required.
*8: For Windows 8, the driver (SW0DNC-MNETH-B) version 26C or later is required.
*9: When connecting with the following CPUs, the CPU module whose first five digits is 10042 or later is
required.
Q12PHCPU, Q25PHCPU, Q12PRHCPU, Q25PRHCPU
*10: When connecting with Redundant CPU, the CC-Link IE Controller Network module whose first five digits is
10041 or later is required.
*11: To connect to Q02PHCPU or Q06PHCPU, the driver (SW1DNC-MNETG-B) version 1.03D or later is
required. (When connecting to other Process CPU or Redundant CPU, the driver for QnHCPU can be
used.)
*12: For Windows 7, the driver (SW1DNC-MNETG-B) version 1.11M or later is required.
*13: For Windows 8, the driver (SW1DNC-MNETG-B) version 1.16S or later is required.
*14: Cannot be used for Windows 8.1.
*15: For Windows 8.1, the driver (SW1DNC-MNETG-B) version 1.17T or later is required.
R
R
R
R
R
R
R
R
R
R
R
R
2-13
2-13
2 SYSTEM CONFIGURATION
MELSOFT
(2) Ethernet Board
The following table shows the Ethernet board/card whose operations are
guaranteed by us.
Maker
Model
3COM
EthernetLink
LAN PC Card
CentreCOM LA-PCM Ethernet PC Card LAN Adapter
Allied Telesis
RE2000 (ISA)
TDK
10BASE-T LAN card (Model: LAN-CD021BX)
If there are restrictions on Ethernet module to Ethernet board, follow the
restrictions.
(3) CC-Link board
Network
Board
Driver
1
CC-Link Ver.1
A80BDE-J61BT11 (Ver.1 Board) *
1
A80BDE-J61BT13 (Ver.1 Board) *
CC-Link Ver.1
CC-Link Ver.2
Q81BD-J61BT11 (Ver.2 Board) *
1
Q80BD-J61BT11N (Ver.2 Board) *
2, 3
SW4DNF-CCLINK-B (for PC/AT) * *
1
4, 5, 6
SW1DNC-CCBD2-B (for PC/AT) * * *
*1: CC-Link Ver.1 and Ver.2 boards cannot be used together with the same PC.
*2: If connecting to a Redundant CPU, SW4DNF-CCLINK-B of version G or later is required.
*3: Cannot be used for Microsoft Windows Millennium Edition Operating System, Microsoft Windows
XP Home Edition, and Windows Vista or later.
*4: For Windows Vista , the driver (SW1DNC-CCBD2-B) version 1.04E or later, for Windows 7, the driver
(SW1DNC-CCBD2-B) version 1.08J or later is required.
*5: For Windows 8, the driver (SW1DNC-CCBD2-B) version 1.13P or later is required.
*6: Cannot be used for Windows 8.1.
R
R
R
R
R
R
R
R
R
2.1.5 Printer
No limitation in this application.
Printer on personal computer can be used.
2-14
2-14
2 SYSTEM CONFIGURATION
MELSOFT
2.1.6 Monitoring system configuration with Monitor Tool
(1) Server/client monitoring system configuration
*1
In the server/client monitoring system, up to eighteen OPSs and up to sixteen
*2
PLCs are connectable. In this case, clients access the monitoring data
collected/managed by a server.
*1: One primary server, one secondary server, and up to sixteen clients, coming
to eighteen in all, in the server/client configuration
*2: Clients can display the following kinds of the monitoring data collected by
Server.
Setting data
Tag data (Displayed on the control panel and pop-up windows)
Trend data
Alarm data
Event data
18 OPSs
Monitor tool clients
Access the monitoring data collected/managed
by a server and display it.
PX
Developer
PX
Developer
PX
Developer
Personal computers
(client)
Ethernet
Monitor tool server (primary)
Communicates with PLCs in a batch
and collects/manages/displays the
monitoring data.
PX
Developer
PX
Developer
Personal computer
(primary server)
Monitor tool server (secondary)
Synchronizes the setting data
with the primary server to
provide against outages of the
primary server.
Personal computer
(secondary server)
CC-Link IE Controller Network, MELSECNET/10(H), Ethernet
QnPHCPU
QnPHCPU
Tracking cable
Tracking cable
QnPRHCPU (redundant system)
QnPRHCPU (redundant system)
POINT
The CC-Link IE Controller Network or Ethernet connection is recommended if five or
more PLCs are to be connected.
2-15
2-15
2 SYSTEM CONFIGURATION
MELSOFT
<System configuration preparing for server outages>
1) Installing two servers (primary and secondary)
Preparing and running a backup server (secondary server) which uses the same
setting data as a regular server (primary server) enables the server/client
monitoring system configuration providing against server outages. However, the
*1
monitoring data is not equalized even though two servers are running.
Redundant servers enables automatic server switching in the event of a fault of
the primary server. Afterward, the connection server can be manually switched
after restoration of the primary server. Refer to Section 9.5 for the setting method,
Section 8.6.3 for switching server.
In the redundant server system, the setting data can be changed in the primary
server. The secondary server starts up using the setting data of the primary
server.
*1: The monitoring data equalization is a process that synchronizes the
monitoring data, between the primary server and the secondary server.
(Normal)
Ethernet
PX
Developer
PX
Developer
PX
Developer
PX
Developer
Communication
Clients
Primary
server
Secondary
server
CC-Link IE Controller Network, MELSECNET/10(H), Ethernet
(Primary server fails)
Ethernet
PX
PX
PX
PX
Developer
Developer
Developer
Developer
Down
Primary
server
Connecting to the
secondary server
automatically
Communication
Clients
Secondary
server
CC-Link IE Controller Network, MELSECNET/10(H), Ethernet
2-16
2-16
2 SYSTEM CONFIGURATION
2)
MELSOFT
Installing one server
The server/client monitoring system that has one server (does not have a
redundant server) can also be configured.
1
In the event of a server failure, a client can be connected to PLCs* , and
2
restarted as a substitute server that uses the same setting data* as one used by
an original server before the failure.
Change the connection server in the client side when starting a new server. For
the setting method, refer to Section 9.5.
*1: To connect a client restarted as Server to PLCs via the same communication
route as the failed server, mounting the same network board on a personal
computer (client) as a personal computer (server) is necessary.
Also, for connecting a client to PLCs directly, change the PC transfer setting
Section 9.4).
in the monitor target project setting (
*2: A client gets the setting data from a server and saves it in itself during
executing. Therefore, when restarting as Server, a client can use the setting
data gotten from a server immediately before.
(Normal)
Ethernet
PX
Developer
Communication
PX
Developer
PX
Developer
PX
Developer
Clients
Server
CC-Link IE Controller Network, MELSECNET/10(H), Ethernet
(Server fails)
Ethernet
PX
Developer
Down
Server
PX
Developer
Communication
Client
Standalone
Connecting to PLCs directly.
CC-Link IE Controller Network, MELSECNET/10(H), Ethernet
POINT
The monitoring data that had been collected by a failed server cannot be
transferred to a substitute server.
After recovering, a regular server also cannot receive the monitoring data collected
by a substitute server during the outage.
2-17
2-17
2 SYSTEM CONFIGURATION
MELSOFT
(2) Standalone configuration
In the standalone monitoring system, one OPS and up to sixteen PLCs are
connectable.
For the system configuration in normal operation, refer to Appendix 1.2.1.
PX
Developer
Monitor tool
Communicates with PLCs and collects/manages/displays
the monitoring data.
CC-Link IE Controller Network, MELSECNET/10(H), Ethernet
QnPHCPU
Tracking cable
QnPRHCPU (redundant system)
QnPHCPU
Tracking cable
QnPRHCPU (redundant system)
Up to 16 PLCs
(3) Multiple CPU system with Process CPU
The multiple CPU system including Process CPU can be monitored when the
following conditions are satisfied.
A network module is controlled by each Process CPU, and each Process CPU
communicates with control CPU via that network module.
The whole network includes up to 16 CPUs, including Process CPU of
multiple CPU system and CPU module of single CPU system. (In the following
diagram, 3 QnPHCPUs are counted.)
CC-Link IE Controller Network, MELSECNET/10(H), Ethernet
Management
Management
Network
module
QnPHCPU
QnPHCPU
Other CPU
Network
module
Network
module
QnPHCPU
Other CPU
<System configuration with multiple CPU system>
* The redundant system does not support the multiple CPU system.
POINT
The CC-Link IE Controller Network or Ethernet connection is recommended if five or
more PLCs are to be connected.
2-18
2-18
2 SYSTEM CONFIGURATION
MELSOFT
2.2 Operating Environment
The following table describes is the operating environment.
Item
Description
R
Computer
CPU
Required memory
R
PC/AT compatible where Microsoft Windows Operating System runs
Refer to "Applicable operating system and the corresponding required personal computer
performance" in this section.
When installing : Hard disk 200MB or more
Hard disk free space
When operating: Free space of virtual memory 100MB or more
Disk drive
CD-ROM disk drive
Display
Resolution: 800
600 pixels (256 colors) or more
One of the following is required
*1
Ethernet board
MELSECNET/10 interface board
Network interface
MELSECNET/H interface board
CC-Link IE Controller Network board
Serial, USB and CC-Link board can only be used for adjustment.
Pointing devices
2-button mode mouse or the compatible pointing device
R
R
Microsoft Windows NT Workstation Operating System Version 4.0 (English Version)
4
Service Pack 3 or later *
R
R
Microsoft Windows 2000 Professional Operating System (English Version)
R
R
Microsoft Windows XP Professional Operating System (English Version) Service Pack 1
5
or later *
R
R
Microsoft Windows XP Home Edition Operating System (English Version) Service Pack
5
1 or later *
Microsoft Windows Vista Home Basic Operating System (English Version)
Microsoft Windows Vista Home Premium Operating System (English Version)
Microsoft Windows Vista Business Operating System (English Version)
Microsoft Windows Vista Ultimate Operating System (English Version)
2, 3
Microsoft Windows Vista Enterprise Operating System (English Version)
Operating system * *
Microsoft Windows 7 Starter Operating System (English Version)
Microsoft Windows 7 Home Premium Operating System (English Version)
Microsoft Windows 7 Professional Operating System (English Version)
Microsoft Windows 7 Ultimate Operating System (English Version)
Microsoft Windows 7 Enterprise Operating System (English Version)
Microsoft Windows 8 Operating System (English Version)
Microsoft Windows 8 Pro Operating System (English Version)
Microsoft Windows 8 Enterprise Operating System (English Version)
Microsoft Windows 8.1 Operating System (English Version)
Microsoft Windows 8.1 Pro Operating System (English Version)
Microsoft Windows 8.1 Enterprise Operating System (English Version)
When PX Developer Version 1.04E
GX Developer Version 7
6
or earlier is used
(SW7D5C-GPPW Version 7.20W or later is required) *
Required software
package
When PX Developer Version 1.06G
None
or later is used
*1: In the server/client monitoring system configuration, Ethernet boards are necessary for OPS's network interface as
network between a personal computer (server) and ones (client) is the Ethernet connection.
R
R
R
R
*2: Monitor tool cannot be installed on Microsoft Windows 98 Operating System and Microsoft Windows Millennium
Edition Operating System.
Big fonts (Details setting of Screen properties) are not supported.
*3: The operation on virtual PC environment is not supported. This product may not operate normally.
R
R
*4: USB is inapplicable for Microsoft Windows NT Workstation 4.0 Operating System, as it will cause a communication
error.
R
*5: Select "Windows Classic" from the Theme dropdown list in the Display Properties in Windows XP Service Pack2, or
R
install Windows XP Service Pack3.
*6: GX Developer must be installed because the communication library in GX Developer is used for communication
between monitor tool and Process CPU.
R
R
R
R
R
R
R
R
R
2-19
R
R
R
R
R
R
R
R
R
R
R
R
R
R
R
R
R
R
R
R
R
R
R
2-19
2 SYSTEM CONFIGURATION
MELSOFT
Item
Description
Versions of software package required for interaction between PX Developer and GT
SoftGOT1000
Related software
Model name
PX Developer Version 1
GT SoftGOT1000 Version 2
GT Designer2 Version 2
GT SoftGOT1000 Version 3
GT Designer3 Version 1
SW1D5C-FBDQ-E *
SW2D5C-GTD2-E
SW2D5C-GTWK2-E
SW1DNC-GTWK3-E
SW1DNC-GTWK3-E
7
Version
Base screen
switching
Security level
PX Developer
change
function call
1.14Q or later
1.31H or later
Not supported
2.47Z or later
2.47Z or later
3.01B or later
3.37P or later
1.01B or later
1.01B or later
Versions of software package required for interaction between PX Developer and GT
SoftGOT2000
Related software
PX Developer Version 1
GT SoftGOT2000 Version 1
GT Designer3 Version 1
Related software
package
Model name
7
SW1D5C-FBDQ-E *
SW1DNC-GTWK3-E
SW1DNC-GTWK3-E
Version
1.42U or later
1.105K or later
1.105K or later
Versions of software package required for GOT screen generator
Using GT Designer2
Related software
PX Developer Version 1
GT Designer2 Version 2
Model name
7
SW1D5C-FBDQ-E *
SW2D5C-GTD2-E
SW2D5C-GTWK2-E
Version
1.18U or later
2.73B or later
Using GT Designer3
Related software
PX Developer Version 1
GT Designer3 Version 1
Model name
7
SW1D5C-FBDQ-E *
SW1DNC-GTWK3-E
Version
1.28E or later
1.23Z or later
Versions of software package required for debugging with Simulator
Using GX Simulator
Related software
PX Developer Version 1
GX Developer Version 8
GX Simulator Version 7
Model name
*7
SW1D5C-FBDQ-E
SW8D5C-GPPW-E
SW7D5C-LLT-E
Version
1.28E or later
8.94Y or later
7.27D or later
Model name
*7
SW1D5C-FBDQ-E
SW1DNC-GXW2-E
Version
1.42U or later
1.98C or later
8
Using GX Simulator2 *
Related software
PX Developer Version 1
GX Works2 Version 1
Programming language
R
Programming
language
Visual Basic
Microsoft
R
Microsoft
R
Microsoft
R
Microsoft
R
Microsoft
R
Microsoft
Development software
R
Visual Basic 6.0
R
Visual Basic .NET 2002
R
Visual Basic .NET 2003
R
Visual Studio 2005 Visual Basic
R
Visual Studio 2008 Visual Basic
R
Visual Studio 2010 Visual Basic
*7: For software that has Monitor Tool only, the model name is SW1DNC-FBDQMON-E.
*8: When connecting GX Simulator2 to monitor tool, the operating environment of monitor tool is the same as that of GX
Works2. For the operating environment of GX Works2, refer to "GX Works2 Installation Instructions".
2-20
2-20
2 SYSTEM CONFIGURATION
Item
MELSOFT
Description
Versions of SCADA software package whose operations are verified
Recommended
SCADA software
package
Recommended SCADA software
Wonderware InTouch
JoyWatcherSuite
Version
10.0 or later
6.0 or later
Note that the operations are not guaranteed when using the mixture of the SCADA software
other than mentioned above and ActiveX control provided by the monitor tool.
Check the system before operations.
Applicable operating system and the corresponding required personal computer performance
Required Personal Computer Performance
Operating System
1
R
CPU *
Required memory
Pentium 133MHz or more
R
(Pentium 300MHz or more recommended)
64MB or more
R
Windows NT Workstation 4.0
(Service Pack 3 or later)
R
Pentium 133MHz or more
R
(Pentium 300MHz or more recommended)
R
Windows 2000 Professional
64MB or more
R
Windows XP
(Service Pack 1 or later)
Windows Vista
R
Pentium 300MHz or more
R
128MB or more
R
Pentium 1GHz or more
1GB or more
R
Pentium 1GHz or more
R
1GB or more
R
64-bit (x64) processor 1GHz or more
2GB or more
R
Pentium 1GHz or more
1GB or more
R
64-bit (x64) processor 1GHz or more
2GB or more
R
Pentium 1GHz or more
1GB or more
R
64-bit (x64) processor 1GHz or more
2GB or more
Windows 7 (32-bit edition)
Windows 7 (64-bit edition)
R
Windows 8 (32-bit edition)
Windows 8 (64-bit edition)
R
Windows 8.1 (32-bit edition)
Windows 8.1 (64-bit edition)
*1: Cannot be used in the multi processor environment.
POINT
Folder and file access authorization
This product may make change access to the files of the installation destination
folder and sub-folder.
Hence, file change access enable must have been set for these folders and files
by the user who uses this product.
If file change access enable has not been set, this product may not operate
normally.
When this product is used, it is recommended to log on as the user of the
administrators group who has the authority to control all of the computer.
When Windows XP, Windows Vista or Windows 7 is used, the following
new functions cannot be used.
If any of the following new functions is used, this product may not operate
normally.
Windows XP Mode
Start of application in Windows compatible mode
Fast user switching
Remote desktop
DPI setting other than 100% (set the size of text and illustration other than
[smaller-100%])
Windows Touch or Touch
Modern UI
Client Hyper-V
Windows XP (64-bit edition) and Windows Vista (64-bit edition) are not
supported.
R
R
R
R
R
2-21
R
2-21
2 SYSTEM CONFIGURATION
MELSOFT
POINT
Monitor tools cannot be used with the built-in guest account in Windows Vista
or later.
Version compatibility between server and client
In the server/client monitoring system, clients and a connection server must
have the same product language, and clients must satisfy the following
conditions of versions.
Version of
server
1.20W
version of server
Version of client > version of server
1.23Z
1.23Z
Connectability of
client
Version of server and client
Version of client
R
Version of client
version of server
Version of client < 1.23Z
Version of client > version of server
1.28E
1.28E
Version of client
version of server
Version of client < 1.28E
Version of client > version of server
1.31H to
1.34L
1.31H
version of server
Version of client > version of server
1.42U
1.42U
Version of client
Version of client < 1.31H
Version of client
version of server
Version of client < 1.42U
Version of client > version of server
1.44W
1.44W
Version of client
version of server
Version of client < 1.44W
Version of client > version of server
: Applicable,
: Not applicable
In the redundant server system, a primary server and secondary server must
have the same product language and product version.
Using monitor tools in the server/client monitoring system configuration
When using the Ethernet connection for communication between a server and
the PLC, two Ethernet boards need to be mount on the server to configure two
Ethernet network separately, for the PLC communication and the server/client
communication. In this case, the server address needs to be specified with IP
Section 9.5) on
address format in the monitor tool execution type setting (
the server.
Set to use fixed IP addresses in the network connection setting on personal
computers (server/client). (The server/client monitoring system cannot be
configured with the setting to obtain IP addresses automatically.)
Personal computers (server/client) need to be connected to the same segment
network. The following functions are not available among personal computers
connected to different segments.
Section 8.6.6)
"Time adjustment among OPSs" function (
Section 8.1)
"Synchronizing a buzzer stop" function (
2-22
2-22
2 SYSTEM CONFIGURATION
MELSOFT
POINT
Server/client are required to allow the communication to the monitor tool via a
network in Windows firewall setting.
For details of Windows firewall setting, refer to the POINT in Appendix 1.2.2.
User account control (UAC)
In the following cases, the monitor tool needs to be started up setting
"Privilege Level" to "Run this program as an administrator".
*1
When the setting mentioned above is set, all user-created screens set in the
user-created setting also need to be set to "Run this program as an
administrator".
In addition, when communication with the PLC is simultaneously performed
*2
using another MELSOFT application , the MELSOFT application also needs to
be set to "Run this program as an administrator".
R
R
(1) When "Privilege Level" of the application that is set in the user-created
screen setting is set to "Run this program as an administrator", "Privilege
Level" of the monitor tool also needs to be set to "Run this program as an
administrator."
(2) When the "Time adjustment among OPSs" function is used in the
server/client monitoring system, the monitor tools started as Secondary
Server or Client need to be set to "Run this program as an administrator".
*3
(3) When PX Developer is installed in the system area of Windows, the
*4
monitor data file of the monitor tool is not saved in the folder of PX
Developer installation destination. The data file is saved in the virtualized
*5
folder for each user by the virtualization function of Windows .
Therefore, the monitor data file cannot be shared between users.
To save the monitor data in the folder of PX Developer installation
destination, "Privilege Level" of the monitor tool needs to be specified to
"Run this program as an administrator."
For the method to execute programs as an administrator, refer to Section
5.1.
R
*1:
*2:
*3:
*4:
Applications such as GT SoftGOT and Visual Basic
PX Developer programming tool, GX application or etc.
Folders such as "Program Files" and "Windows"
Monitoring data file includes the following:
• Setting data file
• Trend binary data file (when the storage folder is not specified or in the system area)
• Alarm list/Event list data file
• Trend/Alarm/Event automatic CSV file (when the output folder is not specified or in
the system are)
*5: For example, when PX Developer is installed in the "Program Files", the file is stored
in the "C:\Users\User_name\AppData\Local\VirtualStore\ProgramFiles\FBDQ" as
default.
2-23
2-23
2 SYSTEM CONFIGURATION
MELSOFT
2.3 Folder Configuration of Monitor Tool
(1) Installation folders/files
Following will explain the folder configuration and file when the monitor tool is
stated up correctly and project made by programming tool is monitored.
The default folder structure of monitor tool is as follows.
[Folder structure after the monitor tool is started.]
C:\
Melsec
Fbdq Store application program files.
Prjdata
Store assignment information database files of monitor target project.
(Read files under file package when the monitor tool is started)
.mdb
Copies of the assignment information database files configured by results
compiled through programming tool.
Setdata
Store setting data files.
M_SET.MDB
Monitor tool configures data files.
M_USER.MDB
Monitor tool user configures information files.
M_OPS.mdb
Monitor tool execution type setting data files.
Store system data files.
Sysdata
Monitor tool configures data files, and stores initial setting.
M_SET.mdb
Monitor tool user configures information files, and store initial setting.
M_USER.mdb
M_OPS.mdb
Monitor tool execution type setting data files, and store initial setting.
M_MASTER.mdb
Master data files of monitor tool, and store master tag data.
Tmpprjdata
.mdb
WorkClient
Store temporary files for Client.
Workdata
ALARM. DAT
Store wording files. One file is created for one trend pen.
Alarm list data files, written when monitor tool is
ended, read when it is started.
Event list data files, written when monitor tool is ended, read
when it is started.
EVENT.DAT
WorkServer
Store temporary files for Server.
Trenddata
Store trend binary data files. One file is created for one trend pen.
This folder package can change the save detination by option setting.
.DAT
Trend binary data files.
<Tag item> File name: Project name_Tag name_Item name_sampling period.DAT
<Monitor variable> File name: Project name_Monitor variable name_sampling period.DAT
Store CSV files provided by automatic CSV file export.
Userdata
TrendCSV
.csv
AlarmCSV
.csv
EventCSV
.csv
2-24
Store assignment information database files of monitor target project.
Used as temporary folder when modifying registration on monitor target project setting screen.
The folder is renamed as Prjdata when saving setting data (close the monitor target project setting
screen, save with file menu).
Copies of assignment information database files configured by results compiled
through programming tool.
Store CSV files provided by automatic trend CSV file export.
The position of storing this folder can be changed by option setting.
Automatic trend CSV files. One file is created for one group.
<When the sampling period is 1s or 10s (one file is created in an hour)>
File name: TrendGroup*1 (trend group No.)_(storage date)_(time).csv
<When the sampling period is 1 min, 5 min or 10 min (one file is created in a day)>
File name: TrendGroup*1 (trend group No.)_(storage date)_.csv
*1: With the settings to include a group name, replaced with a group name
Store CSV files provided by automatic alarm CSV file export.
The position of storing this folder can be changed by option setting.
Automatic alarm CSV files. One file is created in a day.
File name: Alarm_(storage date).csv
Store CSV files provided by automatic event CSV file export.
The position of storing this folder can be changed by option setting.
Automatic event CSV files. One file is created in a day.
File name: Event_(storage date).csv
Data that can be edited
2-24
2 SYSTEM CONFIGURATION
MELSOFT
POINT
Do not open or edit the folders/files other than the data that can be edited.
However, the copy operation target folders/files of setting data can be
Section 9.1.4)
copied/pasted. (
Installation directory can be changed when installing.
The positions of the "Trenddata", "TrendCSV", "AlarmCSV" and "EventCSV"
folders, which store trend binary data files and the files output by automatic
CSV file export, can be changed by option setting.
(2) Reference files in the server/client monitoring system configuration
In a secondary server and clients, by default, file paths in the following settings in
clients are the same as in a primary server. If applications/sound files are
installed/located to different paths in a secondary server and clients, change their
paths individually in these settings.
Applications registered in the user-created screen setting
Sound files of Minor alarm/Major alarm/Event in the option setting
2-25
2-25
3 FUNCTION OVERVIEW
MELSOFT
3 FUNCTION OVERVIEW
3.1 Function Overview
The functions of PX Developer monitor tool are as follows
3
The primary functions performed by toolbar and their corresponding set function
screens are introduced here.
For details, refer to "Section 9.18 Setting under This Condition".
Function
Control panel
Monitor
function
Trend graph
Alarm list
Event list
User-created
screen
Pop-up faceplate
Pop-up tuning
Buzzer stop
Print screen
Screen Align
Find
Manage Mode
Setting
Display PLC communication
status
Server/client communication
status
Switch Server
Acquire server setting data
Automatic CSV file export
Exit
3-1
Description
Display up to 8 faceplates simulating the process control
device
A time sequence change chart that displays trend item value.
A list that maximum displays 2000 alarm records
A list that maximum displays 2000 event records
Applied program pointed by start which can display the usercreated screen.
A faceplate that can display simulating the process control
device by using pop-up window.
A faceplate that can display a tuning pop-up window
(faceplate + tuning trend graph + tag monitor).
Stop alarm buzzer.
Hardcopy of whole screen in the print display.
Overlap the diagrams in display or redisplay after vertical
arrangement.
Find tag, Control panel, and Trend graph. Display pop-up
faceplate after finding it.
Determining function limit according to the authority of user.
(Mode divided into: lock mode, operator mode engineer mode)
Set up work conditions of each function.
Display the communication status between a monitor tool and
CPU modules.
Display the communication status between a server and
clients in the server/client monitoring system.
Clients can manually switch the server to be connecting when
"Redundant Server" is activated.
Clients load the setting data from a server when it is changed
in the server.
Save trend, alarm and event data in CSV files automatically as
histories.
Stop monitor, exit monitor tool.
Setting Window
Control panel setting
Trend setting
Alarm setting
Event setting
User-created screen
setting
Option setting
Option setting
Control panel setting,
trend setting.
User authority setting
User setting
Monitor target project
setting
OPS setting
OPS setting
OPS setting
Trend setting
Option setting
3-1
3 FUNCTION OVERVIEW
MELSOFT
3.2 Function List
The functions of monitor tool are shown here. "Authority" in the table shows the mode
in which this function can be used. A certain function cannot be selected and used in
other modes.
For details, refer to "Chapter 4 MODE ADMINISTRATION".
Monitor function (General operation) list
Function
Authority
General operation of monitor window
Reference
Section 6.2
Close window
E/O/L
Section 6.2.1
Maximize/Minimize Window
E/O/L
Section 6.2.2 to
Section 6.2.4
Change window size
E/O/L
Section 6.2.5
General operation of faceplate
3
Section 10.1
SPA (stop alarm) reset
E/(O)
Section 10.1
Setting/Removing Lockout Tag
E/(O)
Section 10.2
Change I/O mode
E/(O)
Section 10.3.2
Change control mode
E/(O)
Section 10.3.3
Change motion type
E/(O)
Section 10.3.4
PV value setting
E/(O)
Section 10.3.7
SV value setting
E/(O)
Section 10.3.8
MV value setting
E/(O)
Section 10.3.9
Count value setting
E/(O)
Section 10.3.10
Batch count operation
E/(O)
Section 10.3.11
Counter/timer operation
E/(O)
Section 10.3.12
Status operation
E/(O)
Section 10.3.13
(Authority...E: Engineer mode/O: Operator mode/(O): Operator mode with operation authority/L: Valid for lock mode)
REMARK
In the operator mode, only tag levels permitted by User Authority Setting (
Section 9.2) can be operated with the setting/removing lockout tag function of the
faceplate general operation.
3-2
3-2
3 FUNCTION OVERVIEW
MELSOFT
Monitor function (Monitor window) list
Function
Authority
Control panel|
Display
Operation
Section 7.1
Group tab display (Maximum 500 group)
E/O/L
Section 7.1.1
Switch groups to be displayed
E/O/L
Section 7.1.2
Faceplate operation
E/O
Chapter 10
Display pop-up tuning screen
E/O/L
Section 7.1.3
Faceplate display (Maximum 8 per screen)
Trend graph
Display
Operation
Section 7.2
Group tab display (Maximum 125 group)
Trend graph display (maximum 8 per screen)
E/O/L
Operation
Section 7.2.1
Switch groups to be displayed
E/O/L
Section 7.2.3
Latest value display
E/O/L
Section 7.2.4
E/O/L
Section 7.2.5
Gridline Interval setting
Y-axis scale setting
Export to CSV file
E/(O)
Section 7.2.6
Display CSV file
E/O/L
Section 7.2.7
Alarm list
Display
Reference
Section 7.3
Display system alarm detail screen
E/O/L
Section 7.3.1
Display pop-up faceplate screen
E/O/L
Section 7.6
Alarm display
E/O/L
Section 7.3.1
Confirm check
E/(O)
Section 7.3.2
Selected display of alarm
E/O/L
Section 7.3.3
Delete Recovered Alarms
E/(O)
Section 7.3.4
Confirm all
E/(O)
Section 7.3.5
Print
E/(O)
Section 7.3.6
Export to CSV file
E/(O)
Section 7.3.7
Event list
Section 7.4
Operation record
State change record
Display
E/O/L
Section 7.4.1
Confirm check
E/(O)
Section 7.4.2
Delete all
E/(O)
Section 7.4.3
Confirm all
E/(O)
Section 7.4.4
Print
E/(O)
Section 7.4.5
Information record
Monitor target project load history
Monitor tool start/stop history
Operation
Export to CSV file
User-created screen
E/(O)
Section 7.4.6
E/O/L
Section 7.5
(Authority...E: Engineer mode/O: Operator mode/(O): Operator mode with operation authority/L: Valid for lock mode)
3-3
3-3
3 FUNCTION OVERVIEW
MELSOFT
Monitor function (Pop-up window) list
Function
Authority
Pop-up faceplate
Display
Operation
Reference
Section 7.6
Faceplate display
E/O/L
Section 7.6.1
Faceplate operation
E/(O)
Chapter 10
Display pop-up tuning screen
E/O/L
Section 7.6.2
Pop-up tuning
Section 7.7
Faceplate display
Display
E/O/L
Section 7.7.1
Faceplate operation
E/(O)
Chapter 10
Tuning trend collecting instruction
E/(O)
Section 7.7.3
Change current value
E/(O)
Section 7.7.4
E/(O)
Section 7.7.5
E/O/L
Section 7.7.6
Collected tag list
E/O/L
Section 7.7.7
Export to CSV file
E/(O)
Section 7.7.8
Tag monitor display
Tuning trend display
Auto tuning (Step Response method/Limit Cycle method)
Operation
Tuning
function
Gridline interval setting
Y-axis scale setting
(Authority...E: Engineer mode/O: Operator mode/(O): Operator mode with operation authority/L: Valid for lock mode)
Other functions (Monitor toolbar)
Function
Authority
Reference
Stop Buzzer
E/(O)
Section 8.1
Print screen
E/(O)
Section 8.2
E/O/L
Section 8.3
E/O/L
Section 8.4
Change Mode
E/O/L
Section 4.5
Exit
E/(O)
Section 5.2
Screen Alignment
Cascade display
Tile display
Search by tag name
Find
Search by control panel group name
Search by trend graph group name
Display PLC communication
status
Help Menu
Display
E/O/L
Reset
E/(O)
Section 8.5
Display server/client communication status
E/O/L
Section 8.6.7
Switch Server/Connect Server
E/O/L
Acquire server setting data
E/O/L
Section 8.6.5
E/O/L
Section 6.3.1
Section 8.6.3/
Section 8.6.4
PLC error display
Display operating manual
Monitor Tool
GOT Screen Generator
About PX Developer
(Authority...E: Engineer mode/O: Operator mode/(O): Operator mode with operation authority/L: Valid for lock mode)
3-4
3-4
3 FUNCTION OVERVIEW
MELSOFT
Other functions (Automatic functions)
Function
Authority
Automatic CSV file export
Reference
Section 8.7
Automatic trend CSV file export
E/O/L
Section 8.7.1
Automatic alarm CSV file export
E/O/L
Section 8.7.2
Automatic event CSV file export
E/O/L
Section 8.7.3
Automatic CSV file deletion
E/O/L
Section 8.7.4
Disk free space check
E/O/L
Section 8.7.5
(Authority ... Valid in E: Engineer mode/O: Operator mode/L: Lock mode)
List of usable software component in Microsoft Visual Basic
R
R
Function
Authority
Tag data access control
Reference
Section 11.2
Faceplate control
Setting (General operation) list
Function
Authority
Common item of setting window
Section 9.1
Setting item selection
Button operation
Reference
Apply setting
Setting cancel
E
Section 9.1.1
E
Section 9.1.3
E
Section 9.1.1
Save the setting data
File
Export setting data to CSV file
Generate GOT screen
Close
Menu
Cut
Copy
Edit
Paste
Delete
Delete row
(Authority...E: Engineer mode/O: Operator mode/L: Valid for lock mode)
3-5
3-5
3 FUNCTION OVERVIEW
MELSOFT
Setting (Item) list
Function
Setting item
Authority
Reference
Change in a
Change
secondary
in clients
server
User authority setting
Stop buzzer
General
Print screen
Exit monitor tool
Process instruction values/Mode
Change of the values
of tag data item
Alarm threshold values
Tuning parameter values
Process design values
Trend graph
Pop-up tuning
Export to CSV file
Export to CSV file
Tuning trend collecting instruction
E
Export to CSV file
Alarm/event
Section 9.2
Print
Confirm
Delete
PLC communication
status
Reset
Operator1 level
Setting/removing
lockout tag
Operator2 level
Operator3 level
Operator4 level
Engineer level
User setting
User name
E
Password
Section 9.3
Authority
Monitor target project setting
Project name
Assignment information database file
Transfer setup
E
Section 9.4
Simulator Connection
OPS setting
Monitor tool execution type setting
OPS list
E
Section 9.5
Monitor variable setting
Variable name/Device
Data type
Variable type
Low limit
E
High limit
Section 9.6
Digits after decimal point
Unit
Comment
(Authority...E: Engineer mode/O: Operator mode/L: Valid for lock mode)
(Change...
3-6
: Changeable,
: Not changeable)
3-6
3 FUNCTION OVERVIEW
Function
MELSOFT
Setting item
Authority
Reference
Change in a
Change
secondary
in clients
server
Control panel setting
Group name
E
Tag name
Section 9.7
Trend setting
Group name
Sampling period
Automatic CSV file export
E
Section 9.8
Tag data item
Y-axis scale top limit, bottom limit
Alarm setting
Alarm contents
E
Message contents
E
Event setting
Section 9.9
Section 9.10
User-created screen setting
Application
E
Argument
Unit setting
Unit
E
Section 9.11
Section 9.12
Faceplate display pattern setting
Tag type selection
String of display and operation button
Character string color/background color of
operation button and display (indicator)
E
Section 9.13
Faceplate display scale setting
Tag name
PV graph display scale bottom limit
PV graph display scale top limit
PV graph display division number
E
Section 9.14
PV graph display direction
PV graph base point when both direction
is set
Faceplate MV characters setting
Tag name
MV graph display character (0%)
E
Section 9.15
MV graph display character (100%)
Lockout tag setting
Lockout tag name
Text color, background color
E
Section 9.16
Authority level
(Authority...E: Engineer mode/O: Operator mode/L: Valid for lock mode)
(Change...
3-7
: Changeable,
: Not changeable)
3-7
3 FUNCTION OVERVIEW
Function
MELSOFT
Setting item
Authority
Reference
Change in a
Change
secondary
in clients
server
Option setting
Setting window font
Monitor window font
Printer
Window mode
Minor alarm color
Major alarm color
Return check interval (s)
General
Return check timeout (s)
PLC status check interval (s)
Write tag data (even if the PC's and
PLC's project ID codes are different)
Automatic CSV file deletion time (0 to 23)
Disk free space check size (MB)
Exit monitor tool when windows logoff or
shutdown
Time adjustment among OPSs
Server/client
Switch/Reconnect server during screens
are displayed
Alarm/Event display on 2nd Line of
monitor toolbar
Alarm/Event display format of monitor
toolbar
E
Section 9.17
Highlighted display while alarms occur
Event notification UDP port No.(HEX)
Automatic alarm CSV file export
Automatic alarm CSV file deletion
Alarm CSV file storage period (days)
Alarm/
event
Automatic alarm CSV file export target
General folder
Tag data item display of alarm
Unconfirmed alarms deletion at delete
recovered alarms
Automatic event CSV file export
Automatic event CSV file deletion
Event CSV file storage period (days)
Automatic event CSV file export target
folder
Tag data item display of event
Unconfirmed events deletion at delete all
Buzzer type
Minor
alarm
Beep sound time interval
Beep sound frequency
Sound file
(Authority...E: Engineer mode/O: Operator mode/L: Valid for lock mode)
(Change...
3-8
: Changeable,
: Not changeable)
3-8
3 FUNCTION OVERVIEW
Function
MELSOFT
Setting item
Authority
Reference
Change in a
Change
secondary
in clients
server
Buzzer type
Major
alarm
Beep sound time interval
Beep sound frequency
Sound file
Alarm/
event
Buzzer type
Event
Beep sound time interval
Buzz sound frequency
Sound file
SV limit excess setting
Background color
Text color
Alarm area color (No alarm)
Button text color
Button background color
PV bar positive direction color
PV bar negative direction color
Faceplate
PV bar both direction color (Positive)
PV bar both direction color (Negative)
Option
setting
(continued)
PV high/low limit value bar color
PV high high/low low limit value bar color
E
Section 9.17
SV/MV limit value bar color
SV/MV pointer color
SV(Target) pointer color
MV status color
Frame color (No lockout tag)
Item name display
Gridline
Gridline color
Background color
Graph 1 to 8 color
Trend binary data storage folder
Trend graph
Automatic trend CSV file export target
folder
Automatic trend CSV file export file name
Automatic trend CSV file export time
(0 to 23)
Automatic trend CSV file deletion
Trend CSV file storage period (days)
(Authority...E: Engineer mode/O: Operator mode/L: Valid for lock mode)
(Change...
3-9
: Changeable,
: Not changeable)
3-9
4 MODE ADMINISTRATION
MELSOFT
4 MODE ADMINISTRATION
4.1 Mode Overview
When using the monitor tool, register the users in advance and define their password
and authority. (Engineer or Operator1 to 4)
When starting the monitor tool, the mode is in the lock mode with which any operations
of settings or values cannot be performed.
The monitoring operation can be executed within the user authority with specifying a
user name and a password, and changing the mode.
Before the operator leaves, if the lock mode is set, the mis-operation by irrelevant
persons can be avoided.
4.2 Mode Types
4
Among the monitoring tools 3 kinds of modes can be set for every user
Mode name
Description
A mode with which the monitoring operation (monitoring/changing tag
Engineer Mode
data) and setting data change are available
Operator Mode A mode with which the monitoring operation is available
Lock Mode
A mode with which only the monitoring is available
Corresponding user's authority
Engineer
Operator4
Operator3
Operator2
Operator1
(No designated user)
4.3 User Authorities
In the monitor tool, the user authority can be set up to 6, and the operation restrictions
for the functions that need the security of monitoring/control can be set depending on
user authority for changing the mode.
The operation restrictions for the authority of engineer/ lock are fixed, however, that for
Section 9.2).
the authority of operator1 to 4 can be set with User Authority Setting (
User authority
Operation restriction item
Monitor tool setting
Exit monitor tool
Stop buzzer/Print screen
Change of the values of tag data item
Export data to CSV file of trend graph
Export data to CSV file of pop-up tuning/
Tuning trend collecting instruction
Export to CSV file/Print/Confirm/Delete of
Alarm data
Reset the maximum value/number of times
of PLC communication status
Setting/Removing lockout tag
Engineer
Operator (1 to 4)
Lock
Available only for users whose authority
is specified for the corresponding
operation on User Authority Setting
Section 9.2)
(
: Applicable, : Not applicable
(For details of operation authority of functions with each mode, refer to "Section 3.2 Function List")
4-1
4-1
4 MODE ADMINISTRATION
MELSOFT
4.4 Mode Transition
At the starting time, the lock mode is used.
The operation for exiting the monitor tool can be executed by a user who has the
authority only.
Lock mode
Starting
Operator mode
Change mode
<User authority>
Operator1 to 4
Engineer mode
<User authority>
Engineer
*1
4
Only a user who has the authority
Exit
*1: The display is switched in accordance with status of operator1 to 4.
POINT
Specify the authority for operator1 to 4 on User Authority Setting (
Section
9.2), and set the authority specified for user name with User Setting
(
Section 4.6, Section 9.3) to change the operation range for each operator.
The operation authority for operator1 to 4 after installation is the initial setting
status (
Section 9.2).
4.5 Mode Change
The mode can be changed by specifying a user name and a password registered with
the Change Mode function beforehand.
User name, its corresponding authority and password are registered by user settings.
Section 4.6, Section 9.3)
(
1. Click the "Change Mode" button on the monitor
toolbar.
2. One of the following two operations can be
executed in the "Change Mode" dialog box.
(In the setting operator/engineer mode)
Input character string to user name and
password item.
Click the "OK" button.
(Return to lock mode)
Click the "Lock" button.
POINT
The security level of GT SoftGOT can be changed in accordance with the user
authority which changes the mode by setting the security level change on Usercreated Screen Setting. For details, refer to Section 9.11.
4-2
4-2
4 MODE ADMINISTRATION
MELSOFT
4.6 User Setting
To register the individual user name and password of each operator for operation, the
mode must be changed to the engineer mode after a start of the monitor tool.
In the following procedure, display the user setting window and make necessary user
setting.
Only in the engineer mode, can the user setting be executed.
For details about the setting window, refer to Section 9.3.
1. Click the "Setting window" button on the monitor
toolbar.
2. The monitor tool setting window is displayed.
3. Select "User Setting" in the setting item on the
left side of the screen, then set freely on the user
setting graph displayed on the right side.
4. Click the "Apply" button after finishing inputting all
the user name, password and authority.
5. Execute the instruction in the menu: [File]
[Save the setting data] (even without this
operation, the setting result will be automatically
saved into the setting data file when the monitor
tool finishes its task).
6. Close the setting window.
4-3
4-3
4 MODE ADMINISTRATION
MELSOFT
4.7 Changing Mode after Installation
In order to execute change mode, the user name and password should be registered
Section 4.6, Section 9.3)
through the user setting beforehand. (
But when the monitor tool starts, the setting window cannot be displayed, and the
mode is the lock mode.
After the installation, the user setting has not yet been executed. In order to display
the user setting window and use it as the initial screen, the following user name and
password have been registered in advance.
If the mode is changed with designated user name and password, all function of the
monitor tool can be operated when the mode changes into the engineer mode.
User Name
Password
Authority
admin
admin
Engineer
1. Click the "Change Mode" button in the monitor
toolbar.
2. Input user name (admin) and password
(admin), and then click the "OK" button.
(The mode will be changed into engineer
mode.)
POINT
If the user name and password for the registered engineer-authority user have
been forgotten and the operation cannot be performed, set the "product ID" in the
"User Name" and "Password". The mode can be changed using the first
engineer-authority user registered in the user setting.
(The product ID is given in the "License certificate" packed with the product.
Replace delimiters in the product ID with "-".)
4-4
4-4
4 MODE ADMINISTRATION
MELSOFT
MEMO
4-5
4-5
5 START AND EXIT
MELSOFT
5 START AND EXIT
5.1 Starting Monitor Tool
PURPOSE
Start the monitor tool.
The execution type (Standalone/Server/Client) can be selected to be suited for
the system configuration and the role of an OPS, in the monitor tool execution
Section 9.5).
type setting dialog box displayed from the OPS setting (
BASIC OPERATION
The following describes a starting method from the start menu of
Microsoft Windows Operating System.
R
R
1. The cursor moves this way: [Start]
[MELSOFT Application]
[Program]
[PX Developer].
5
2. Click [Monitor Tool].
3. Start monitor tool of PX Developer.
The starting screen appears.
4. The monitor toolbar appears on the top
of the screen.
Immediately after the installation, a monitor tool is started up as Standalone by
default.
POINT
The security level of GT SoftGOT can be changed in accordance with the user
authority which changes the mode by setting the security level change on Usercreated Screen Setting. For details, refer to Section 9.11.
REMARK
Use of PX Developer Version 1.04E or earlier
To use monitor tool, GX Developer Version 7(SW7D5C-GPPW-E Version 7.20W)
or later is necessary. Without the above-mentioned software, the corresponding
information will be shown at beginning, and the monitor tool cannot be started.
5-1
5-1
5 START AND EXIT
MELSOFT
(1) Procedure for starting up a monitor tool as Standalone
1. Click the "Setting window" button on the monitor
toolbar.
2. Select [OPS setting] in the monitor tool setting
screen, and click the "Setting..." button.
3. The monitor tool execution type setting dialog
box is displayed.
Select "Standalone" in the "Execution Type" and
click the "OK" button.
4. Click the "Apply" button in the OPS setting
screen, and exit the monitor tool.
5. Restart the monitor tool.
5-2
5-2
5
5 START AND EXIT
MELSOFT
(2) Procedure for starting up a monitor tool as Server
1. Click the "Setting window" button on the monitor
toolbar.
2. Select [OPS setting] in the monitor tool setting
screen, and click the "Setting..." button.
3. The monitor tool execution type setting dialog
box is displayed.
Select "Server" in the "Execution Type" and click
the "OK" button.
To run a redundant server, refer to Section 9.5
and set the required items.
4. Click the "Apply" button in the OPS setting
screen, and exit the monitor tool.
5. Restart the monitor tool.
POINT
A primary/secondary server starts up acquiring the setting data from another
1
server.*
*1: A primary server acquires the setting data only when it is restarted checking
“Acquiring setting data from Secondary Server next start time”.
5-3
5-3
5 START AND EXIT
MELSOFT
(3) Procedure for starting up a monitor tool as Client
1. Click the "Setting window" button on the monitor
toolbar.
2. Select [OPS setting] in the monitor tool setting
screen, and click the "Setting..." button.
3. The monitor tool execution type setting dialog
box is displayed.
Select "Client" in the "Execution Type", enter IP
addresses of the connection server and client,
and execute the "Connection Test".
Section 9.5)
(
Then click the "OK" button.
To connect a redundant server, refer to Section
9.5 and set the required items.
4. Click the "Apply" button in the OPS setting
screen, and exit the monitor tool.
5. Restart the monitor tool.
POINT
A client starts up acquiring the setting data from a server.
In the redundant server system, a client firstly connects to a primary server. If it
cannot connect to the primary server, then it connects to a secondary server.
5-4
5-4
5 START AND EXIT
MELSOFT
<Method to execute programs as an administrator>
(1) When user account control (UAC) is enabled
All users including administrator are fixed at and operate as "standard user".
To execute programs in administrator authority, specify "Run as administrator".
(2) When user account control (UAC) is disabled
Programs can be executed by logon user.
(Specifying "Run as administrator" is not necessary.)
(3) Procedure to execute programs as an administrator
The following shows a procedure to execute the monitor tool as an administrator
when UAC is enabled.
Select "Monitor Tool", right-click, and select "Run as administrator".
* When the user account that is logging on to Windows is an
administrator, the following message will be displayed. *1
Selecting "Allow" or "Yes" enables to execute as an
administrator.
R
<Windows Vista >
R
<Windows 7 or later>
R
*1: For the method to prevent this screen from appearing, refer to
Appendix 6.
5-5
5-5
5 START AND EXIT
MELSOFT
(4) Setting to always execute programs as an administrator
To always "execute programs as an administrator", set as follows.
When using Windows 8 or Windows 8.1, select
"Monitor Tool", right-click, and select "Open file
location".
1) Select "Monitor Tool", right-click, and select
"Properties".
R
R
2) Select the <<Compatibility>> tab and check "Run
this program as an administrator".
5-6
5-6
5 START AND EXIT
MELSOFT
5.2 Exiting Monitor Tool
PURPOSE
Exit monitor tool.
BASIC OPERATION
1. Click the "Exit" button in the monitor
toolbar.
2. Click the "Yes" button in the dialog box.
3. Exit the monitor tool.
POINT
The operation for exiting the monitor tool can be executed by a user who
has the authority.
A user who has the authority for exiting the operation is a user for whom
Section 9.2) is specified to exit the monitor tool
user-authority (
Section 4.6, Section 9.3).
(
"Exit the monitor tool" will stop all the data collecting process.
When the monitor tool is closed, the user-created screen started with it
Section 7.5) will also be entirely shut off.
(
Windows can be logged off/shut down during the monitor tool
execution. Note that when the monitor tool is in the following status,
Windows cannot be logged off/shut down.
When a current user does not have the authority for exiting the monitor
1
tool operation*
When a modal dialog box or a message box is displayed
2
When applying the setting data*
When switching/connecting the server
When acquiring the server setting data
R
R
*1: Only when "Follow the user authority setting" is set to "Exit monitor tool
when windows logoff or shutdown" in Option Setting (General)
*2: Monitor Target Project Setting (apply, reload), Trend Setting, Option
Setting (changing the trend binary data storage folder and the related
automatic CSV file export), during the processing for applying Monitor
Variable Setting
5-7
5-7
5 START AND EXIT
MELSOFT
MEMO
5-8
5-8
6 SCREEN CONFIGURATION AND BASIC OPERATION
MELSOFT
6 SCREEN CONFIGURATION AND BASIC OPERATION
6.1 Overview of Screen Configuration
The screens displayed by monitor tools can be approximately classified as follows:
Screen
Feature
Maximum number
Menus to select primary functions. They are always on the top of
the screen and will not be cascaded by other windows.
1
Multi-window mode
Normal windows with variable sizes, possible to be maximized
and minimized.
4
Single-window mode
Windows displayed in maximum size, unable to be displayed
simultaneously within a plurality of windows.
1
Pop-up window
Usually displayed in front of other windows, with variable sizes,
maximization and minimization unallowable.
4
Message dialog box
Used for display of confirmations and settings, fixed window-size.
Task tray icon
An appropriate task tray icon is displayed depending on the
execution type of the monitor tool.
Monitor toolbar
Monitor
Window
The number of screens that can be displayed is subject to the type of the screen.
Besides monitor toolbars, 4 monitor windows and 4 pop-up windows can be displayed
simultaneously under the multi-window mode.
Monitor tool bar
6
Monitor window
Pop-up window
6-1
Message dialog box
Task tray icon
6-1
6 SCREEN CONFIGURATION AND BASIC OPERATION
MELSOFT
6.2 General Operation of Screen
A title bar indicating the name of each screen will be available on the upper part of
each window.
Close button
Title bar
Maximize button
Minimize button
The title bar can be used to display the system menu for primary operations of the
window. And the system menu can be displayed via two ways.
Right click the title bar on the upper part of the window.
Press Alt + Space
6.2.1 Closing a window
PURPOSE
Close a displayed window
6
BASIC OPERATION
Use any one of the methods shown below to close a window except a
toolbar.
Click the close button at the upper right corner of the window.
Select the [Close] option from the system menu.
Press Alt + F4.
Click the "Close" button on the faceplate. (Except the control panel)
6.2.2 Maximizing a window
PURPOSE
To extend a displayed window to a window overlapping the whole screen below
the toolbar.
BASIC OPERATION
Use any one of the methods shown below to maximize a window.
Click the maximize button at the upper right corner of window.
Select the [Maximize] option from the system menu.
Press Alt + Space and press x key.
Double click the title bar at the top of the window.
6-2
6-2
6 SCREEN CONFIGURATION AND BASIC OPERATION
MELSOFT
6.2.3 Minimizing a window
PURPOSE
Temporarily close a displayed window and show buttons of taskbars of Microsoft
Windows Operating System.
BASIC OPERATION
Use any one of the methods shown below to minimize a window.
Click the minimize button at the upper right corner of the window.
Select the [Minimize] option from the system menu.
Press Alt + Space and press n key.
6.2.4 Restoring a window
PURPOSE
To restore the maximized window back to its original state before maximization.
BASIC OPERATION
Use any one of the methods shown below to restore a maximized window to its
original size.
Click the restore button at the upper right corner of the window.
Select the [Restore] option from the system menu.
Press Alt + Space and press r key.
6.2.5 Changing the window size
PURPOSE
Change the size of a displayed window.
BASIC OPERATION
(1) Change the width of a window
Scroll the cursor at the right or left of the window until the cursor becomes a
right-left directional arrow, and then pull the border of the window rightward or
leftward (hold the key of the mouse and move it).
(2) Change the height of a window
Scroll the cursor at the upper or lower of the window until the cursor becomes
an upper-lower directional arrow, then pull the border of the window upward or
downward.
(3) Change the width and height simultaneously
Move the cursor to one corner of the window till the cursor becomes a slant
two-direction arrow, and then pull the border of the window toward any
direction.
REMARK
The window size is not changeable after maximized (full-screen display).
The characters size will be automatically adjusted according to the window size.
6-3
6-3
6 SCREEN CONFIGURATION AND BASIC OPERATION
MELSOFT
6.3 Monitor Toolbar
The monitor toolbar is displayed on the top of the screen after the monitor tool is
started.
The major function menu is displayed in button form, on the monitor toolbar.
6.3.1 Contents of monitor toolbar
The following is the monitor toolbar in the monitor tool.
1)
2)
5)
6)
7)
8)
9)
10)
11)
12)
13)
3)
14)
15)
16)
4)
17)
(1) The list of the displayed components
The components on the monitor toolbar are as follows.
Depending on difference of modes etc, there are also situations in which buttons
are not displayed. (The details will be recounted in later part of the passage.)
No.
Item
Description
L
1)
Alarm/event display area
Display alarm/events.
2)
Faceplate screen display button
Display pop-up faceplate screens of the tag
associated with alarm/events.
3)
4)
5)
6)
7)
8)
Date/time display area
Display current date/time.
9)
10)
11)
12)
13)
14)
15)
16)
17)
Help menu display button
Display help menu.
Control panel screen display button
Display control panel screen.
Trend graph screen display button
Display trend graph screen.
Alarm list screen display button
Display alarm list screen.
Event list screen display button
Display event list screen.
User-created screen button 1 to 4
Start up registered application program and
display user-created screen.
Stop buzzer button
Stop the buzzer beep.
Print screen button
Print the displayed screen.
Cascade window button
Cascade monitor window.
Tile window button
Tile the monitor window.
Find button
Display find dialog box.
Change mode button
Display change mode dialog box.
Setting window button
Display setting window.
Exit button
Exit monitor tools.
O
E
Setting
No registration:
1
*
1
*
Multi :
Single :
1
*
(L: Lock mode, O: Operator mode, E: Engineer mode, Setting: Setting window is displayed
: Valid display,
: Gray display indicates an invalid click,
: Nothing displayed)
*1: The button is displayed only for a user who has the authority for the
operation.
6-4
6-4
6 SCREEN CONFIGURATION AND BASIC OPERATION
MELSOFT
(2) Display/hide buttons
Depending on different modes and settings, unavailable buttons will not be
displayed.
Buttons of 2), 5) to 9), 14), 15), 17) cannot be clicked when the setting window
is opened.
The applications registered to User-created Screen Setting or icons
registered to detail setting of User-created Screen Setting are displayed on
the 9) user-created screen button 1 to 4. (For details of the registration, refer
to Section 9.11.)
Cascade window button 12)/ Tile window button 13) is only displayed in multiwindow mode, not in single-window mode. Window mode can be switched
Section 9.17 (1))
with option setting (General). (
Setting window button 16) is only displayed in engineer mode. Switching to
the engineer mode can be implemented with change mode button 15).
The following are some display samples of the monitor toolbars.
Lock Mode (No User-created Screen Setting, multi-window mode)
Operator Mode (User-created screen Setting 3 activated, multi-window mode)
Engineer Mode (User-created screen Setting 1 to 4 activated, multi-window mode, 1 row of alarm
messages)
Setting window in display (No User-created screen Setting, multi-window mode)
Setting window in display (User-created screen Setting 3 activated, single-window mode, 2 rows of alarm
messages)
(3) Alarm and event display area
The upper portion of the monitor toolbar is the area where 2 rows of messages
are shown.
6-5
6-5
6 SCREEN CONFIGURATION AND BASIC OPERATION
MELSOFT
(a) Alarm and event display
The first line of alarm and event display shows the up-to-date alarm.
The second line can display alarm and event at user’s disposal.
The option at the second line can be executed with option setting
Section 9.17 (2))
(Alarm/Event general) of function setting. (
1) Case1:
selected "alarm" in option setting (Alarm/Event general)
The first row
The unconfirmed latest alarm highlighted in alarm list screen.
The second row
The second alarm after the unconfirmed latest alarm highlighted in alarm list screen.
2) Case2:
selected "event" in option setting (Alarm/Event general)
The first row
The unconfirmed latest alarm highlighted in alarm list screen.
The second row
The unconfirmed latest event message in event list screen.
<Display form of alarm>
A
Occurrence
date
Occurrenec
time
Tag
name
Tag
comment
Alarm
content *1
01/26/2002
11:13:23AM
TIC001
**************
**************
Faceplate
display button
..
*1: The display format as to the tag data items is according to "Tag Data Item Display of Alarm" of
Option Setting (Alarm/Event).
<Display form of event>
A
Faceplate
display button
Occurrence
date
Occurrenec
time
Tag
name
Tag
comment
Event
content
01/26/2002
11:13:23AM
TIC001
**************
**************
..
When a tag name/tag comment is too long to display in the area, it is cut-down. When a tag
name/tag comment is cut-down, suspension points (...) are attached to it.
Example)
TAG012345678
TAG0123456789
TAG012345678
TAG012345678...
In the "Alarm/Event display format of monitor toolbar" of the option setting, the display format of
tag names and tag comments can be changed. The display format is selectable from three
choices, "Tag Name", "Tag Comment", and "Tag Name + Tag Comment".
Tag comments are not displayed for system alarms because they do not have any tag comments.
POINT
Display character counts of tag names, tag comments, and alarm/event contents
may flexibly vary, because the size of the display areas varies depending on the
screen resolution.
The following table shows approximate display character counts when "Tag Name
+ Tag Comment" is selected as the display format.
6-6
Resolution
Tag name
Tag comment
Alarm/event content
800 600
12 characters
24 characters
12 characters
1024 768
12 characters
24 characters
30 characters
1280 1024
12 characters
24 characters
52 characters
1600 1200
12 characters
36 characters
64 characters
6-6
6 SCREEN CONFIGURATION AND BASIC OPERATION
MELSOFT
(b) Faceplate display button
The faceplate display button appears at the right end of the alarm/event
display area.
A faceplate screen correlative with the displayed alarm will pop up when
this button is clicked.
The faceplate display button appears only for able-to-show-faceplate
alarms/events.
The so-called able-to-show-faceplate alarm means the alarms other than
system alarm.
The so-called able-to-show faceplate event means the event that tag data
of message tag has a confirmation check.
For details of warnings and events, refer to Section 7.3.1 and Section 7.4.1.
(c) Displaying alarm/event list
The Alarm list screen/Event list screen is displayed by double-clicking any
space other than the Faceplate screen display button in the alarm/event
1
display area while alarm/event is displayed on the monitor toolbar. *
The Alarm list screen/Event list screen shows relevant alarm/event selected.
2
*
Event list example displayed by double-clicking the alarm/event display area
*1: List screen is not displayed in the following cases:
• When the maximum number of screens to be monitored
Section 6.1) is opened
(
• When the setting window is displayed
• When the change mode screen is displayed
• When the message box, which appears when the "Exit" button or
"Print" button is clicked, is displayed
In the Alarm list screen, all alarms are displayed.
*2: When dialog boxes or message boxes are displayed from the list
screen, relevant alarm/event will not be selected.
6-7
6-7
6 SCREEN CONFIGURATION AND BASIC OPERATION
MELSOFT
(4) Date/Time display area
It is the upper right area of the monitor toolbar displaying the current date and
time according to the personal computer's settings.
(5) Display button of help menu
It is the button in the top right corner of monitor toolbar. Click this button to
display help menu.
Display help menu
Click button to display help menu.
[Connect Server] is displayed for a secondary server
or a client in the non-redundant server system
Item
PLC Communication Status
Description
Section 8.5).
Display the PLC communication status screen (
This menu cannot be selected when the setting window (
Section 9.1.1) is in
display or when the monitor tool execution type is "Client" (
Section 9.5).
Display the server/client communication status screen (
Section 8.6.7).
This menu cannot be selected when the setting window (
Section 9.1.1) is in
Server/Client Communication Status
display or when the monitor tool execution type is "Standalone" or "Client"
(
Section 9.5).
Switch Server/Connect Server
Switch the server to be connecting manually with clients in the redundant server
monitoring system (
Section 8.6.3).
For a secondary server this menu connects it to a primary server manually, and for
a client this menu connects it to a server manually (
Section 8.6.4).
This menu cannot be selected when the setting window (
Section 9.1.1) is in
display or when the monitor tool execution type is "Standalone" or "Server"
(“Primary Server” for Connect Server) (
Section 9.5).
Acquire Server Setting Data
A client acquires the setting data from a server when it is changed in the server
(
Section 8.6.5).
This menu cannot be selected when a server error is occurring, when the setting
window (
Section 9.1.1) is in display or when the setting data has already
been acquired.
PLC Error
Display the help screen related to the PLC CPU error codes of the installed GX
1
application. *
R
Operating
Manual
Monitor Tool
Start Acrobat Reader to display PX Developer Operating Manual (Monitor Tool).
2
*
GOT Screen Generator
Start Acrobat Reader to display PX Developer Operating Manual (GOT Screen
2
Generator). *
R
About PX Developer
Display product information such as version.
*1: If GX application has not been installed, the PLC error help screen will not appear.
*2: If Acrobat Reader has not been installed, the manual will not appear.
R
6-8
6-8
6 SCREEN CONFIGURATION AND BASIC OPERATION
MELSOFT
POINT
When starting up HELP with a project whose GX project type is GX Developer
project, the "Windows Help and Support" screen shown below may appear, and the
Help screen is not displayed.
Perform the following procedure to install "WinHlp32.exe" which is needed to
display the Help screen. (Note: The personal computer needs to be connected to
the internet.)
(Example) Using Windows 7
R
(1) Click the "Help" button.
(2) The screen shown above opens. Click the link section.
(3) The Microsoft technical information page opens.
http://support.microsoft.com/kb/917607 (AS of Jul., 2015)
Follow the instruction and download the Windows Help program
(WinHlp32.exe).
(4) Install the file that has been downloaded.
6-9
6-9
6 SCREEN CONFIGURATION AND BASIC OPERATION
MELSOFT
6.3.2 Screen display buttons
It displays all monitor window buttons of the monitoring function.
For details of the monitoring function, refer to Chapter 7.
(1) Control panel screen display button (
)
PURPOSE
Section 7.1 )
Display the control panel screen. (
Although one control panel screen already exists, another one will be displayed
again.
(2) Trend graph screen display button (
)
PURPOSE
Section 7.2)
Display the trend graph screen. (
Although one trend graph screen already exists, another one will be displayed
again.
(3) Alarm list screen display button (
)
PURPOSE
Section 7.3)
Display Alarm list screen. (
If the alarm list screen is in display, the current screen can be activated without the
need to reopen it.
(4) Event list screen display button (
)
PURPOSE
Section 7.4)
Display Event list screen. (
If the Event list screen is in display, the current screen can be activated without
the need to reopen it.
POINT
When opening the setting window, no buttons can be clicked.
6-10
6-10
6 SCREEN CONFIGURATION AND BASIC OPERATION
MELSOFT
The following functions are to display those screens that are not immediately set
after installation.
Arbitrary screen structure can be specially customized depending on different
demands.
(5) User-created screen display button (The button icon is subject to
registered application programs.)
PURPOSE
Assign monitoring applications to user-created screen buttons on the monitor
toolbar.
Section 11.1) or Microsoft Visual
Programs created with GT SoftGOT (
Section 11.2) can be assigned as applications.
Basic (
R
POINT
When opening the setting window, no buttons can be clicked.
The applications registered to User-created Screen Setting or icons registered to
detail setting of User-created Screen Setting is displayed on the user-created
screen button 1 to 4.
Even though the monitoring screen opened by user-created screen button is not
a monitoring screen, it will still be treated as a monitor window.
As for the limitation of screens to be open simultaneously, please calculate it as
Section 6.4).
one screen of monitor window (
When the monitor tool is closed, all user-created screens (
Section 7.5)
started by it are also closed.
6-11
6-11
6 SCREEN CONFIGURATION AND BASIC OPERATION
MELSOFT
6.3.3 Stop buzzer button
PURPOSE
Stop the buzzer beep.
No changes will occur if this button is clicked when the buzzer is not beeping.
Section 8.1)
(
POINT
A user who does not have the authority of operation for stopping the buzzer cannot
click the button.
6.3.4 Print screen button
PURPOSE
Print the whole hard copy of the displayed desktop. (
Section 8.2)
POINT
A user who does not have the authority of operation for copying the screen cannot
click the button.
6.3.5 Screen alignment button
PURPOSE
Rearrange the displayed windows. (
Section 8.3)
(1) Cascade display button
One window is slightly cascaded on another window for alignment.
(2) Title display button
Screens are evenly divided. Windows are aligned when they are not displayed in
cascaded way.
POINT
Buttons will not be displayed in the single-window mode. Switching of the window
mode can be accomplished with option setting (General). (
Section 9.17 (1))
6-12
6-12
6 SCREEN CONFIGURATION AND BASIC OPERATION
MELSOFT
6.3.6 Find button
PURPOSE
Search for tags, control panel and trend graphs. (
Section 8.4)
POINT
Do not click the Find button when opening the setting window.
6.3.7 Change mode button
PURPOSE
Switching the Lock/Operator/Engineer mode. (
Chapter 4)
POINT
Do not click the change mode button when opening the setting window.
6.3.8 Setting window button
PURPOSE
Display the monitor tool setting window. (
Chapter 9)
POINT
Only executable in engineer mode.
This button will not be displayed in lock mode or operator mode.
6.3.9 Exit button
PURPOSE
Exit the monitor tool. (
Section 5.2)
POINT
This button will not be displayed with a user who does not have the authority for
exiting the monitor tool operation.
All screens displayed from the monitor toolbar are closed.
Do not click the Exit button during the opening of the setting window.
6-13
6-13
6 SCREEN CONFIGURATION AND BASIC OPERATION
MELSOFT
6.4 Monitor Window
Monitor windows are screens to display monitor results.
6.4.1 Types of monitor window
Monitor windows can be classified as following types:
Type
Description
Reference
Control panel
Display tag faceplates taking group as a unit.
Section 7.1
Trend graph
Display time sequence change of the values of trend items by curves.
Section 7.2
Alarm list
Display a recorded alarm list
Section 7.3
Event list
Display a recorded event list
Section 7.4
User-created screen
Display a created screen.
The monitor screen of the desired configuration can be created.
Section 7.5
6.4.2 Display form of monitor window
Monitor windows display in the normal window style. Display styles vary with the
window modes, arranging form of the screen and maximize/minimize of the screen.
(1) Window mode
In monitor tool, the display mode can be selected from two types of display forms
of monitor window according to different uses.
Window modes can be set through option setting (General).
Window Mode
Description
Maximum display
screens
It remembers screen size of each window when they are closed, and still
Multi-window
displays at the remembered sizes next time. If sizes are not remembered
4 screens
when installation is finished, it displays the basic sizes.
Single-window
It is always displayed at the maximum status. (It cannot be set as the normal
window size.)
1 screen
(2) Alignment of the screens
Under the multi-window mode, buttons on the monitor toolbar can be used to set.
Cascade display
Tile display
6-14
One window is slightly cascaded on another window for alignment.
Screens are evenly divided. Windows are aligned when they are not
displayed in cascaded way.
6-14
6 SCREEN CONFIGURATION AND BASIC OPERATION
MELSOFT
(3) Maximize/minimize
Under the multi-window mode, windows can be set separately.
Under the single-window mode, only one screen can be displayed and it is
always displayed in maximum size.
Maximize
Windows are displayed in full screens.
Minimize
Windows are changed to buttons on the taskbar.
For the operation method, refer to "Section 6.2 General Operation of Screen".
Switch method of window mode is as follows.
1. Click the "Change Mode" button in the
monitor toolbar to change to engineer
mode.
2. Click the "Setting Window" button in
the monitor toolbar.
3. The monitor tool setting window is
displayed.
4. Select [Option Setting] from items on
the left of the screen, and perform
setting in the option setting screen
displayed in the right of the screen.
5. Select Multi-window/Single-window
from the [Window Mode] of [General].
6. Click the "Apply" button.
7. Execute the instruction in the menu:
[Save the setting data] (even
[File]
without this operation, the setting
result will be automatically saved into
the setting data file when the monitor
tool finishes its task).
8. Close setting window.
6-15
6-15
6 SCREEN CONFIGURATION AND BASIC OPERATION
MELSOFT
6.5 Pop-up Window
A pop-up window is a window that displays monitor results of each tag.
6.5.1 Types of pop-up window
Pop-up windows are classified as follows.
Type
Pop-up faceplate
Pop-up tuning
Description
A faceplate to display the adjusting instrument for
simulating the process control device.
A screen to display a tuning screen of control.
(Faceplate + tuning trend graph + tag monitor)
Reference
Section 7.6
Section 7.7
6.5.2 Display form of pop-up window
Up to four pop-up windows can be displayed.
If a new pop-up window is opened when four pop-up windows have already been
displayed, the earliest opened (displayed in the bottom) one among the four on-screen
windows is automatically closed.
However, if it cannot be closed as displaying a dialog box for example, one next to the
bottom is closed.
The window size can be changed as desired. (However, the aspect ratio of the
faceplate is not variable.)
Maximize/minimize is not allowed.
REMARK
When a window is closed, its position and size will be stored. Thus it will be
displayed at the same size next time. When other windows have been displayed,
a new window is displayed in the slightly bottom-right position of the top window.
However, it will be displayed at a specific size after installation, as its size has not
been stored.
If a new pop-up window is opened when four pop-up windows have already been
displayed, the bottom of the on-screen pop-up windows is forcibly closed.
To keep the desired pop-up window open, close the unnecessary pop-up window
before opening a new one.
In the server/client monitoring system, up to 72 windows among all OPSs (up to
4 windows in each OPS) can be displayed.
6-16
6-16
6 SCREEN CONFIGURATION AND BASIC OPERATION
MELSOFT
6.6 Task Tray Icon
When the monitor tool starts, a monitor tool icon is displayed on the task tray
depending on the execution type.
The connecting status can be confirmed with the tooltip.
(1) Icon
Icons displayed on the task tray are as follows.
Monitor tool execution type
Icon
Standalone
Server
Client
(2) Tooltip
A tooltip is displayed by hovering the mouse pointer.
The monitor tool execution type is displayed in the tooltip. The status of
connection to the server is also displayed.
POINT
To display a monitor tool icon and tooltip on the task tray, set the following setting.
<Windows XP, Windows Vista >
1) Right-click anywhere on a free space on the taskbar and select [Properties].
2) The [Taskbar and Start Menu Properties] dialog box is displayed.
Click the <<Taskbar>> tab (the <<Notification Area>> tab for Windows Vista ).
Uncheck "Hide inactive icons".
Or, keep "Hide inactive icons" checked and click the "Customize…" button to
display the [Customize Notification] dialog box, and select "Always show" from the
1
"Behavior" of "PX Dev. Monitor Tool* ".
R
R
R
Uncheck "Hide inactive icons".
Select "Always show" for "PX Dev. Monitor Tool*1".
("Show" for Windows Vista ).
R
*1: The execution type is displayed after "PX Dev. Monitor Tool".
6-17
6-17
6 SCREEN CONFIGURATION AND BASIC OPERATION
MELSOFT
POINT
<Windows 7 or later>
1) Right-click anywhere on a free space on the taskbar and select [Properties].
2) The [Taskbar and Start Menu Properties] dialog box is displayed.
Click the <<Taskbar>> tab and then the "Customize…" button.
The window is displayed. Check "Always show all icons and notifications on
taskbar" on the displayed customize dialog box, or uncheck it and then select
"Show icon and notifications" from the "Behavior" list box of "PX Dev. Monitor
1
Tool* ".
R
Check "Always show all icons and
notifications on taskbar"
Select "Show icon and notifications"
for "PX Dev. Monitor Tool*1".
*1: The execution type is displayed after "PX Dev. Monitor Tool".
6-18
6-18
6 SCREEN CONFIGURATION AND BASIC OPERATION
MELSOFT
MEMO
6-19
6-19
7 MONITOR FUNCTION
MELSOFT
7 MONITOR FUNCTION
7.1 Control Panel
PURPOSE
Implement grouping administration to the screen called faceplate with the
simulating adjusting meter, and every group is displayed in a parallel way.
On the faceplate, the current PID control status can be monitored with histogram
and be executed ON/OFF control.
BASIC OPERATION
1. Click the "Control Panel" button (
) on the monitor toolbar.
2. The control panel screen is displayed.
DISPLAY/SETTING SCREEN
Faceplate
7
Sheet scroll
button
Group
selection tab
8 faceplates/group, 500 groups at most
At most 500 groups can be registered.
Maximum 8 (the number of tags) faceplates can be displayed in one group.
8 = 4000 tags can be registered at most.
On the control panel, total 500
Section 9.7)
(
7-1
7-1
7 MONITOR FUNCTION
MELSOFT
7.1.1 Faceplate display
Every piece of assigned tag information is displayed on the faceplate.
In control panel, the tag faceplates of the chosen groups are displayed together on one
graphic screen.
The group, number and tag allocation of the faceplate can be set with control panel
Section 9.7).
setting (
For details of the faceplate, refer to "Chapter 10 FACEPLATE".
7.1.2 Switching groups to be displayed
(1) Choose the display group from the tabs displayed on the graphic
screen
By means of clicking group selection tab, the faceplate group on the screen can
be switched. The group names set with control panel setting configuration
Section 9.7) are displayed in the group selection tab.
(
At the time of starting, monitor tool will memorize the chosen group, and display
it with the "chosen" status next time.
(2) To see unseen tab with the sheet scroll button.
With the sheet scroll button at the right side of group selection tab, the unseen
group selection tab can be displayed on the current screen.
7
1)
2)
1) Scroll one tab to the left with one click.
Scroll to the left if pressing the button continuously.
2) Scroll one tab to the right with one click Scroll to the right if
pressing the button continuously.
7.1.3 Displaying the pop-up tuning screen
On the control panel, the following operation with displayed faceplate enables this
tuning screen in the pop-up window.
For details of pop-up tuning screen, refer to "Section 7.7 Pop-up Tuning Screen".
1. Click the "Details" button.
2. The pop-up tuning screen of the
selected faceplate is displayed.
7-2
7-2
7 MONITOR FUNCTION
MELSOFT
7.2 Trend Graph
PURPOSE
Display the time series process of the trend item value with curve graph.
Trend item is a generic term for tag data items and monitor variables (global
variable/device variable).
The curve graph is managed in groups, and every group is displayed respectively.
The display can be switched between trend data being collected and trend data
saved by the automatic trend CSV file export function.
BASIC OPERATION
1. Click the "Trend Graph" button (
) on the monitor toolbar.
2. The trend graph screen is displayed.
DISPLAY/SETTING SCREEN
2)
1)
4)
9)
3)
8)
5)
11)
Group
selection tab
Sheet
scrolliang
button
10)
7)
Maximum 125 groups
6)
For 1) to 11), refer to "Section 7.2.1 Displaying a trend graph".
Maximum 125 groups can be registered.
Maximum 8(the number of trend items) trend graphs can be displayed in one
group.
8 = 1000 trend items.
At most total 125
Section 9.8)
(
In the 1 second or 10 seconds sampling period, collectable trend item number is
100 at most.
7-3
7-3
7 MONITOR FUNCTION
MELSOFT
7.2.1 Displaying a trend graph
The trend graph displays the trend item value in chosen group. The group and number
of trend graph, trend item allocation and trend item can be set with trend setting
Section 9.8).
(
The displayed contents on the trend graph are as follows.
No.
1)
Item
Cursor position date and
time
2)
Cursor position data
display grid
3)
Trend cursor position
4)
Sampling period
5)
Trend graph
6)
Trend graph scroll bar
7)
Gridline time display
8)
Y-axis scale
9)
Trend Graph Display
check box
10)
Status bar
11)
Skip button
Description
Display the date and time at the cursor position.
Display every trend item value at the cursor position
Display the status name (TRUE or FALSE) if it is the bit item.
The item column and comment column can be selected whether to display or not with
the popup menu which is displayed by right-clicking on a column title.
Designate any position in the trend graph.
Display the data of that time through moving cursor.
Display the sampling period of the trend data.
Sampling period is set by trend setting (
Section 9.8).
The background color, gridline and the graph color are set by choice setting (trend
graph) (
Section 9.17 (4)).
In the screen, the newest value is at the right end, and the oldest value at the left end.
The trend graph can be scrolled without cursor position change; therefore the cursor
position data will change after scrolling.
Display the date and time indicated by grid line.
Display the top and bottom limit of the scale ruler in every trend graph. Automatically
calculate and display the result according to the top and bottom limit of the scale
simultaneously.
Section 9.8).
Top and bottom limit can be set by trend setting (
Nothing displays in BOOL type.
WORD type fixes within the range of 0 to HFFFF.
Double-click on 5) Trend graph to switch to display/hide Y-axis scale and zoom
in/zoom out the graph area.
Checked ……… Display trend graph.
Unchecked ….. Not display trend graph.
Display the type of data being displayed.
When displaying data being collected
Display "The trend data that is being collected is displayed".
When displaying data of an automatic trend CSV file
Display the specified period in "The trend data during Start date - End date is
1
displayed" format.*
Displayed only when data of automatic trend CSV files are displayed.
The previous/next 10000 points worth of data are displayed by a click.
*1: The format of the displayed date and time depends on the setting of Microsoft
Windows Operating System.
R
R
7-4
7-4
7 MONITOR FUNCTION
MELSOFT
POINT
Collect data from PLCs with the communication functions shown in the chart
below in accordance with the type of trend items and sampling cycles (For details
of communication type, refer to Appendix 1.3, Appendix 1.6.)
Type of trend item
Sampling period: 1second
Sampling period: 10 seconds or more
Tag data item
High-speed current value collection
Low-speed current value collection
Monitor variable
High-speed process data collection
Low-speed process data collection
The sampling period of current value collection can be specified in the PLC
Section 8.5).
communication status screen (
When registering a trend item whose sampling period is set to 1 second, confirm
the following current values displayed on <<High-speed Collection Period>> tab
Section 8.5) are within 1
of the PLC Communication Status screen (
second.
The current value of Current Value Collection (unit: second)
The current value of Tag Data Collection (unit: second)
The current value of Process Data Collection (unit: second)
If either of the value exceeds 1 second, the data cannot be collected in 1-second
period. Therefore, the last collected data is recorded as the current value of trend
items, the same data may be displayed for some sampling periods on the trend
graph.
When registering a trend item whose sampling period is set to 10 seconds or
more, confirm the following current value displayed on the <<Low-speed
Collection Period>> tab of the PLC Communication Status screen are within the
setting value for sampling period.
The current value of Current Value (unit: second)
The current value of Process Data Collection (unit: second)
When the current value of Low-speed Current Value Collection exceeds, the data
cannot be collected in set sampling period. Therefore, the last collected data is
recorded as the current value of trend items, the same data may be displayed for
some sampling periods on the trend graph.
The column display status of cursor position data display grid in displaying the
trend graph screen is depending on "Item Name Display" specified in the option
setting (trend graph).
If the Snap function of Windows 7 or later is applied to the trend graph screen,
the area of the pen information and graph display becomes smaller, therefore,
the content may not be checked.
In this case, resize the trend graph screen to restore a window size and check
the content.
R
7-5
7-5
7 MONITOR FUNCTION
MELSOFT
(1) Trend graph (except BOOL type) display
For the types except BOOL (such as REAL), the trend graph is drawn in the
drawing zone according to the Y-axis scale without considering the sequence of
the graph number.
Graph No.4
Graph No.2
Graph No.5
(2) BOOL type trend graph display
For BOOL type, the trend graph drawing zone is fixed by the Graph No.
In the order of No.1, No.2, display 8 levels other than Y-axis scale from the
lowest gridline.
7-6
Graph No.8
level 8
Graph No.7
level 7
Graph No.6
level 6
Graph No.5
level 5
Graph No.4
level 4
Graph No.3
level 3
Graph No.2
level 2
Graph No.1
level 1
7-6
7 MONITOR FUNCTION
MELSOFT
(3) Mixed display of BOOL type and except BOOL type
Graph No.1, 3, 8 (namely level 1, 3, 8 displayed in the diagram) belong to BOOL
type.
Graph No.8
Level 8
Graph No.4
Graph No.2
Graph No.5
Graph No.3
Level 3
Graph No.1
Level 1
REMARK
The time interval of trend graph gridline row is fixed, and the collected data is saved
into files according to trend item. Therefore the graph will be neither displayed nor
collected, when monitor tools stop result in data-collecting termination and the timedifference graph of allocation trend item (When collection begins) is displayed.
Graph 1
Graph 2
1)
2)
1) The termination time of monitor tool (Graph 1 is disconnected halfway).
2) The allocation time of trend items (Graph 2 is displayed from the allocation
time).
7-7
7-7
7 MONITOR FUNCTION
MELSOFT
7.2.2 Collecting trend data
The collected data is saved to files with binary system
Item
Collection target
Sampling period
Collected data
quantity
Recordable time
Folders for
storage
Description
Tag data item and monitor variable
Select and designate from 1 s, 10 s, 1 min, 5 min and 10 min.
Maximum 10000 points of collected data can be stored in files. The older data will
be overwritten when the maximum points are exceeded.
Sampling period
1s
10 s
1 min
5 min
10 min
Recordable time
2.77 hours
27.7 hours
6.9 days
34.7 days
69.4 days
Folders for storage are installation destination.
Melsec\Fbdq\Trenddata.
File name is as follows
Tag data item: "Project name_ tag name_ tag data item name_ sampling period"
+ extension (.DAT).
Monitor variable: "Project name_ monitor variable name_ sampling period" +
extension (.DAT).
< An example when the installation destination is drive C>
C:\Melsec\Fbdq\Trenddata\PROJECT1_TAG001_MV_10S.DAT
Make one file for one trend item.
The folders for storage can be modified with option setting (trend graph).
(
Section 9.17 (4))
When trends are collected, the relation between group and trend binary data file is as
following diagram:
[Group]
The sampling period is set
by each group.
Group 1(period:10 s)
PROJECT1::TIC0001.PV
PROJECT1::TIC0002.PV
PROJECT1::TIC0003.PV
[Trend binary data file]
Save respectively with the order
of "project name_ tag name_ tag data
item name_ sampling period".
Data in 10 s period
PROJECT1_TIC0001_PV_10S.DAT
PROJECT1_TIC0002_PV_10S.DAT
PROJECT1_TIC0003_PV_10S.DAT
PROJECT1_TIC0004_PV_10S.DAT
PROJECT1_TIC0005_PV_10S.DAT
Group 2(period:10 s)
PROJECT1::TIC0001.PV
PROJECT1::TIC0004.PV
PROJECT1::TIC0005.PV
Group 3(period:1 min)
PROJECT1::TIC0001.PV
PROJECT1::TIC0004.PV
PROJECT1::TIC0005.PV
7-8
Data in 1 min period
PROJECT1_TIC0001_PV_1M.DAT
PROJECT1_TIC0004_PV_1M.DAT
PROJECT1_TIC0005_PV_1M.DAT
7-8
7 MONITOR FUNCTION
MELSOFT
7.2.3 Switching groups to be displayed
(1) Choose the group from displayed tabs in the graphic screen.
Switch to the group displaying trend line by clicking group selection tab. The
group names set by trend setting (
Section 9.7) are displayed in groupselection tabs.
When monitor tool starts, the chosen group will be memorized and displayed in
"chosen" status next time.
When re-switching to the previous group after switching groups from one to
another, contents of data are the same as before. Once the trend graph screen is
closed, data being collected are displayed in all trend groups next time.
(2) Display the unseen tabs with sheet scroll button in the graphic
screen.
Use the sheet scroll button at the right end of group selection tab to display the
unseen group selection tab in current screen.
1)
2)
1) Scroll one tab to the left with one click.
Scroll to the left if pressing the button continuously.
2) Scroll one tab to the right with one click.
Scroll to the right if pressing the button continuously.
7.2.4 Displaying the latest value
Click the "Latest Value Display" button to display the latest value of trend graph.
1. Click the "Latest Value Display" button on
the top of the graphic screen.
2. Trend cursor position and graph-scrolling
bar move to the right to display the latest
value of the trend graph with data being
collected.
POINT
Click the "Latest Value Display" button. When the scroll bar is at the right end, the
trend graph automatically scrolls from the right to the left during the collection. If the
bar is not at the right end, display the time trend graph designated by diagram scroll
bar. At that time, the trend graph will not scroll automatically even if the collection is
in execution.
7-9
7-9
7 MONITOR FUNCTION
MELSOFT
7.2.5 Changing the display magnification
The display magnification of trend graph can be modified by time gridline interval in the
diagram and the Y-axis scale setting determined by top and bottom limit of data display.
Memorizes changed scale for every group during trend graph display.
Once the trend graph screen is closed, the initial scale ruler will appear next time when
the trend graph is opened.
Button name
Description
X-axis
Gridline interval
Select the time interval separated by gridline.
(30 s, 1 min, 5 min, 10 min, 30 min, 1 h, 2 h, 6 h, 12 h, 24 h, 48 h).
Y-axis
Y-axis scale
Designate the value of display top and bottom limit for every trend item.
(1) The change of horizontal axis magnification
Transverse magnification can be changed by selecting the time interval for
displaying trend graph.
1. Click the "Gridline Interval" button.
2. The "Gridline Interval" dialog box is
displayed.
3. Select the time interval separated by gridline.
4. Click the "OK" button.
5. Change the X-axis display magnification of
the trend graph.
After the change of gridline intervals, the minimum unit of displayable data by
moving the trend cursor changes too. The value appears once every 1 second
when the interval is 30 seconds, while once every 2 hours when the interval is 48
hours.
Because the interval value shorter than sampling period cannot be displayed, the
designated gridline interval is limited by the length of sampling period.
Section 9.8)
Sampling period change is executed by trend setting. (
The relation between the display unit of every gridline interval and sampling
period with designation availability is as follows:
Gridline interval
30 s
1 min
5 min
10 min
30 min
1h
2h
6h
12 h
24 h
48 h
Unit of display
1s
2s
10 s
20 s
1 min
2 min
5 min
10 min
30 min
1h
2h
1s
10 s
Sampling
period
1 min
5 min
10 min
: Available for setting
7-10
: Unavailable for setting
7-10
7 MONITOR FUNCTION
MELSOFT
POINT
Ctrl + mouse wheel scroll enables the gridline interval to be wider/narrower on the
trend graph screen.
Ctrl + turn mouse wheel forward : wider the gridline Interval
Ctrl + turn mouse wheel backward : narrower the gridline Interval
(2) The change of Y-axis magnification
Longitudinal magnification can be changed by the top and bottom limit of the data
displayed in the designated trend graph.
1. Click the "Y-axis Scale" button on the
top of the screen.
2. The "Y-axis scale" dialog box is
displayed.
3. Designate the top and bottom limit of
the data in trend graph.
4. Click the "OK" button.
5. Change the Y-axis display magnification
in the trend graph.
The top and bottom limit of WORD type:
H0000-HFFFF fixed
The top and bottom limit of BOOL type:
0-1 fixed
POINT
In the Item field on the Y-axis Scale dialog box, item names or comments are
displayed in accordance with the display format of Cursor position data display grid.
(An item name is displayed when comment is blank.)
7-11
7-11
7 MONITOR FUNCTION
MELSOFT
7.2.6 Exporting to CSV file
Click the "Export to CSV File" button in trend graphic screen to save the trend data to
files in CSV form after appointing storage folder and file name.
Output form is as follows:
The first line is the title indicating all data contents. Under it, the collecting data is
output in the original order of date and time.
Data, TAG001.MLL, TAG001.MV, TAG001.SV, TAG00.MODE,,,,
7/30/2002 6:05:52 PM, 0, 65.2, 450.0, H0010,,,,
7/30/2002 6:05:53 PM, 0, 66.9, 450.0, H0010,,,,
The format of the outputted date and time depends on the setting of Microsoft
Windows Operating System.
For example, in the case of Windows 2000, it can be changed using Regional
Settings within Control panel.
R
R
R
Data type of item
Output form
Tag data item
Output in accordance with decimal point digit.
REAL type
Monitor variable
Output in accordance with digits after decimal point registered in
the Monitor variable setting.
INT, DINT type
Output after the character string conversion as the original example.
WORD type
Output after attaching "H" to the head of the value.
BOOL type
Output 0 or 1.
POINT
Trend data can be output to CSV files automatically. (
Section 8.7)
Only a user who has the authority for CSV file export can execute the operation.
The title of CSV file is displayed in tag name even though it is displayed in tag
comment on the trend graphic screen.
7-12
7-12
7 MONITOR FUNCTION
MELSOFT
7.2.7 Displaying CSV file
The period of trend data of an automatic trend CSV file to be displayed can be
specified by clicking the "Display CSV File" button on the trend graph screen.
1. Click the "Display CSV File" button on the top of
the screen.
2.
3.
4.
5.
The "Display CSV File" dialog box is displayed.
Specify the period and folder of data to display.
Click the "OK" button.
The specified trend graph is displayed.
The format of the outputted date and time depends on the setting of Microsoft
Windows Operating System.
R
R
See as below for the specified contents on the "Display CSV File" dialog box.
Item
Description
Specify period
Select ‘Start Date’ or ‘End Date’ from the list box, and enter the date and time.
For the method for specifying date and time, refer to POINT in this section.
Period : 10,000 points
The period of date and time specified in [Specify period] is displayed.
Specify a folder in which an automatic trend CSV file to be displayed is stored.
This item cannot be selected when the monitor tool is running as Client.
Specify folder
Automatic trend CSV file export target folder
An automatic trend CSV file saved in the folder set to "Automatic trend CSV file export
target folder" in Option setting (Trend graph) is to be referred.
Specifying a folder
Specify a folder in "Path". An automatic trend CSV files saved in the folder is to be referred.
7-13
7-13
7 MONITOR FUNCTION
MELSOFT
POINT
When the pen assignment of the group is changed in the trend setting, automatic
trend CSV files which are output before the change cannot be displayed.
When the monitor tool is running as Client, only trend data of automatic trend
CSV files saved in the automatic trend CSV file export target folder in the server
side can be displayed.
When the date and time format on OS is changed, trend data of automatic trend
CSV files may not be displayed.
For example, when day of week is included in the date format, when an unusual
symbol or delimiter is used in the date and time format or when the display order
of date and time is changed, automatic trend CSV files saved in the previous
date and time format may not be displayed.
When automatic trend CSV files saved with different language OS are displayed,
incorrect date may be displayed or trend data may not be displayed.
The following explain the method for specifying date and time.
Date input area
Time input area
Date selection
calendar
1) Input method of date
Enter a date in the date input area in suitable format for the setting of OS.
It can be input with the keyboard.
The date selection calendar is displayed immediately below by clicking the
button in the date input area.
2) Input method of time
Enter a time in the time input area in suitable format for the setting of OS.
It can be input with the keyboard.
Value of the hour, minute and second at the cursor position can be increased
and decreased by clicking the
button in the time input area.
3) Input method using the date selection calendar
button in the date
The date selection calendar is displayed by clicking the
input area.
The date is set to the date input area by clicking the desired date.
The
button is displayed and the year can be changed by clicking the year
displayed above. Also, the popup menus from January to December are
displayed and the month can be selected.
The
button displays the previous month’s calendar and the
button
displays the next month’s calendar.
Also, today’s date can be specified by clicking today’s date displayed in the
lower part of the screen.
When automatic trend CSV files are saved including group names in accordance
with the setting of "Automatic trend CSV file export target folder" in the option
setting (
Section 9.17 (4)), if the trend group name is changed, CSV files
that were output before the change cannot be displayed on the trend graph.
7-14
7-14
7 MONITOR FUNCTION
MELSOFT
7.3 Alarm List
PURPOSE
Display a list of alarm record
BASIC OPERATION
1. Click the "Alarm List" button (
) on the monitor toolbar.
2. The alarm list screen is displayed.
DISPLAY/SETTING SCREEN
The current
row is
selected for
display.
1)
2)
3)
4)
5)
6)
7)
8)
Maximum 2000 alarms can be displayed.
*For 1) to 7), refer to "Section 7.3.1 Displaying alarm list".
POINT
Double-clicking the alarm line displays the alarm-related faceplate (if any) or the
system alarm details dialog box (in the case of the system alarm (
Section
7.3.1) line).
The dates and times of the PLC CPU stopping errors and PLC CPU errors
displayed in the system alarm details dialog box are those when the errors occurred
in the CPU module (dates and times according to the internal clock of the CPU
module).
The dates and times of the PLC CPU stopping errors and PLC CPU errors
displayed in the alarm list are those when the monitor tool recognized the errors.
Hence, the dates and times displayed in the alarm list may not match those
displayed in the system alarm details dialog box.
7-15
7-15
7 MONITOR FUNCTION
MELSOFT
7.3.1 Displaying alarm list
The alarm records are displayed in descending order of the alarm occurrence date and
time. Contents of each field are shown as follows.
No.
Item
Description
1)
Confirm field
2)
Tag field
The tag name that displays the alarm occurrence/recovered.
3)
Tag comment field
Displays a tag comment.
4)
Alarm contents field *
Display the alarm name.
5)
Occurrence date field
Display the date and time of alarm occurrence. *
6)
Display the check box for confirmation only when the alarm occurs.
1
2
2
Recovered date field
Display the date and time of alarm recovered. *
7)
Level field
Display Major/Minor alarm.
If the alarm level (ALM for alarm tag, ALML_W1 to ALML_W4 for 64-points alarm
tag) bit of tag data is ON, display Major error. If the alarm level (ALM) bit of tag data
is OFF, display Minor error. Display major error when system alarm occurs.
8)
Measured Value field
Display related measured value.
*1: The display format as to the tag data items is according to "Tag Data Item Display of Alarm" of Option
Setting (Alarm/Event).
*2: The format of the displayed date and time depends on the setting of Microsoft Windows Operating
System.
R
7-16
R
7-16
7 MONITOR FUNCTION
MELSOFT
(1) Alarm types
An alarm will be displayed when the status of related tag data items changes or a
system error occurs.
It is displayed on the alarm list screen and in the alarm/event display area of the
Section 6.3.1).
monitor toolbar (
The following table shows alarm types that are listed.
Type
Description
Measured value
exists
To add the related measured value and keep the records for the 6 items of MLA, MHA, PLA, PHA,
LLA, HHA involved in item of ALM of the loop tag.
If the tag type is 2PIDH, PFC_SF, PFC_SS, PFC_INT or PVAL an alarm is displayed for SVLA and
SVHA in item of ALM2.
MLA, MHA
: Display MV value when measured value alarm occurs.
PLA, PHA, LLA, HHA : Display PV value when measured value alarm occurs.
SVLA, SVHA
: Display SV value when measured value alarm occurs.
Measured value
not exist
To use the changing bit of the item of ALM included in the loop tag and the status tag (TIMER1,
TIMER2, COUNT1, COUNT2) as the occurrence and recovered of the alarm, and then keep the
record.
If the tag type is 2PIDH, PFC_SF, PFC_SS, PFC_INT or PVAL, an alarm is displayed for ALM2 items.
Faceplate
display pattern
To use the changing bit of the item of ALM included in the loop tag (PVAL) and the status tag (NREV,
REV, MVAL1, MVAL2, PB) as the occurrence and recovered of the alarm, and then keep the record.
Alarm contents are to display character string, which is set and registered by faceplate display pattern
setting. (
Section 9.13)
The referred number of display mode is got from the display name mode number of tag data (FPNO).
The settings is not registered, it will be displayed as blank. (
Section 10.6)
Alarm tag
System alarm
7-17
Alarm tag
To use the changing bit of the item of ALM as the occurrence and recovered the alarm and then
keep the record. The alarm contents are to display the character string which is registered to the
alarm setting. (
Section 9.9)
The referred alarm number is the alarm name number of tag data (the value stored to ALM1NO to
ALM8NO). The settings is not registered, it will be displayed as blank. (
Section 10.7)
64-points alarm tag
To use the changing bit of the item of ALM_W1 to ALM_W4 as the occurrence and recovered the
alarm and then keep the record. The alarm contents are to display connected character string of
group name and alarm content which are registered to the alarm setting (
Section 9.9).
The referred alarm number is the alarm group name number of tag data (the value stored to
ALMG1NO to ALMG8NO) and the alarm name number of tag data (the value stored to ALM1NO
to ALM64NO). The settings is not registered, it will be displayed as blank. (
Section 10.7)
To keep the record of the occurrence and recovered of monitor tool system alarm.
The displayed alarm contents are determined by alarm types. (refer to the table in next page)
7-17
7 MONITOR FUNCTION
MELSOFT
The following table is the system alarm list
Alarm content
Content
1, 5, 6
"Communication open error" + project name * * *
1, 5, 6
"Communication reading error" + project name * * *
1, 5, 6
"Communication writing error" project name * * *
1, 5, 6
"Communication close error" + project name * * *
7
"Disk free space error" + drive name *
2, 7
"File error" + File type * *
2, 7
"Memory error" * *
2, 7
"Exception error" * *
3, 4, 5
"PLC CPU stopping error" + project name * * *
3, 4, 5
"PLC CPU error" + project name * * *
4
"Project ID code inconsistency" + project name *
4
"Incorrect PLC type" + project name *
"Redundant System: PLC Parameter Read Error"
5
+ project name *
"Redundant System: System A/B Identification Error"
1, 4, 5
+ project name * * *
"Redundant System: Control/Standby System Status
3, 4, 5
Error" + project name * * *
2
"Event notification source error" *
2
"Event notification data receiving error" *
2, 7
"SCADA Interaction Function Error" * *
8
"Event notification execution error" + project name *
"Client Communication Error" + client name
"Server Initialization Error"
9
"Server Communication Error" *
10
"Invalid Simulator Version" *
7-18
Alarm occurs when network communication open error is
detected.
Alarm occurs when network communication reading error is
detected.
Alarm occurs when network communication writing is detected.
Alarm occurs when network communication close error is
detected.
Alarm occurs when the free space of the PX Developer
installation destination, trend binary data, CSV files created by
automatic CSV file export memory driver is under "Disk free
space check size" of option setting (general).
It will be detected once per 10 minutes.
Alarm occurs when file exceptional error is detected.
A file error occurs for each of trend binary data, automatic trend
CSV, automatic alarm CSV and automatic event CSV files.
Alarm occurs when memory exceptional error is detected.
Alarm occurs when exception error (not including file exception
and memory exception) is detected.
Alarm occurs when a stop error occurs in the CPU module.
Alarm occurs when an operation continue error occurs in the CPU
module.
Alarm occurs if the monitor target project set with the monitor tool
does not match the project in the CPU module.
Alarm occurs when the monitor target project and connected PLC
are inconsistent in the PLC type.
Alarm occurs when the connection target is Redundant CPU and
read of PLC parameter has failed.
Alarm occurs when the connection target is Redundant CPU and
the system cannot be identified (system A or system B).
Alarm occurs when the connection target is Redundant CPU and
the control/standby system status is invalid.
Alarm occurs when the event notification source cannot be
specified.
Alarm occurs when the size of data received through event
notification is out of the range, or the tag block No. is invalid.
Alarm occurs when an error arises during SCADA interaction
function processing.
Alarm occurs when the event notification function cannot be used.
Alarm occurs when the communication between a server and
client is failed in the server/client monitoring system.
Alarm occurs when the initialization of communication is failed at
startup as Server.
Alarm occurs when the communication between a primary server
and a secondary server is failed.
Alarm occurs when the simulator to be connected has not
installed or the version installed is not applicable to the process
control instruction when connecting to the simulator.
7-18
7 MONITOR FUNCTION
MELSOFT
*1: Only when the connection target is Redundant CPU, either of "Specified connection target" (specification
in "Transfer Setup" screen), "System A" or "System B" (connection target for system monitor) is added.
(Alarm example) Communication Open Error: Project1 System A
*2: With regard to this error, the condition where the system is recovered from the error cannot be recognized.
When the confirm field is checked in the alarm list, the system is recovered from the error. When
unchecked, the error occurs. "…" always appears in the recovery date.
If the same name alarm (alarm content) has occurred, the alarm is not recorded. If not occurred, the
alarm is recorded.
*3: Only when the connection target is Redundant CPU, either of "System A" or "System B" (connection target
for system monitor) is added.
(Alarm content example) Communication Open Error: Project1 System A
*4: The alarm is issued/deactivated when checking the PLC status. For details of the relevant processing,
refer to Appendix 1.9.
*5: In the case of Redundant CPU only, the alarm is deactivated once when the operation mode is switched
(backup mode/separate mode/debug mode)
*6: When communication board errors are detected, communication board name is displayed instead of
project name.
(For example: It will be displayed as "Communication open error MELSECNET_BOARD_51" when selfinterface access error of MELSECNET/10 is detected.)
*7: An OPS name is appended only in the server/client monitoring system.
(Alarm example) Memory Error: [Client1]
*8: This error is caused by either of the following conditions. Once the error occurs due to either of the
conditions, another alarm does not occur even the other condition is satisfied.
The version of the driver for CC-Link IE Controller Network board (SW1DNC-MNETG-B) is earlier than
1.08J.
The network type set in the <<Event Notification>> tab of the project parameter setting and that set in
the transfer setup are different.
*9: This error is recovered when a secondary server connects to a primary server.
*10: Recovers by the following operation
Clear all the connection settings with simulator in the monitor target project setting, and click the "Apply"
Section 9.4 (3))
button. (
Exit the monitor tool and restart the monitor tool after installation of Simulator whose version is
applicable to the process control instruction.
POINT
If a system alarm has occurred, double-click the system alarm line in the alarm list
to display the corresponding system alarm details dialog box.
Take corrective action, referring to the dialog box.
For details of the other troubleshooting, refer to Section 12.1.
7-19
7-19
7 MONITOR FUNCTION
MELSOFT
(2) Display items based on alarm types
The description of display items based on alarm types is as follows.
Confirm
Tag
Measured
value exists
Measured
value not
exists
Faceplate
display
pattern
Occurrence
1
date *
Recovered
1
date *
Display date
and time of
alarm
occurrence
Display date
and time of
alarm
3
recovered *
Level
Name of bit item
that has been
2
changed. *
Display
check
box
Display tag
name
Alarm tag
System
alarm
Alarm contents
#SYSTEM
Registered
character string in
Faceplate display
pattern setting
Registered
character string in
alarm setting
System alarm
contents
Measured
value
MV/PV/
SV(Current)
Major/minor
None
Major
*1: When monitor tool is started or "Apply" button or "Reload" button of monitor target project setting
Section 9.4) is clicked, alarms in occurrence status will transit into recovered status.
(
If alarm is occurring when it is transiting into recovered date, new alarm will be displayed.
Date and time of the operations mentioned above is displayed in the recovered date field.
*2: The display format as to the tag data items is according to "Tag Data Item Display of Alarm" of Option
Setting (Alarm/Event).
*3: Recovered date and time of file error, memory error and exception error is not displayed in the recovered
date field.
POINT
For the communication open, read, write and close errors, only one of them is
displayed for each connection target of the project.
Only the first error is displayed. Recovery from the above error is made as soon as
communication succeeds.
7-20
7-20
7 MONITOR FUNCTION
MELSOFT
(3) Display example of alarm
The display examples of alarm types are as follows.
With measured value
Confirm
Tag
TIC001
TIC001
Tag comment
Room temperature
adjustment valve 1
Room temperature
adjustment valve 1
Alarm contents *1
Occurrence Date *2
Recovered Date *2
Level
Measured
value
MLA
1/30/2002 11:43:20 AM
Major 4.8%
MLA
1/30/2002 11:43:20 AM 1/30/2002 11:43:50 AM Major 4.8%
Without measured value
Confirm
Tag
TIC001
TIC001
Tag comment
Room temperature
adjustment valve 1
Room temperature
adjustment valve 1
Alarm contents *1
Occurrence Date *2
Recovered Date *2
Level
DVLA
1/30/2002 11:43:20 AM
DVLA
1/30/2002 11:43:20 AM 1/30/2002 11:43:50 AM Minor
Measured
value
Minor
Faceplate display pattern
Confirm
Tag
VALV001
VALV001
Tag comment
Water level
adjustment valve 1
Water level
adjustment valve 1
Alarm contents
Occurrence Date *2
Recovered Date *2
Level
Time-out
1/30/2002 11:43:20 AM
Time-out
1/30/2002 11:43:20 AM 1/30/2002 11:43:50 AM Minor
Measured
value
Minor
Alarm tag
Confirm
Tag
ALM001
ALM001
Tag comment
Operation start
alarm 1
Operation start
alarm 1
Alarm contents
Processing A
abnormal
Processing A
abnormal
Occurrence Date *2
Recovered Date *2
1/30/2002 11:43:20 AM
Level
Measured
value
Minor
1/30/2002 11:43:20 AM 1/30/2002 11:43:50 AM Minor
System alarm
Confirm*4
Tag
#SYSTEM
#SYSTEM
Tag comment
Alarm contents
Communication open
error: PROJECT1
Communication open
error: PROJECT1
Occurrence Date *2
1/30/2002 11:43:20 AM
Recovered Date *2 *3
Level
Measured
value
Major
1/30/2002 11:43:20 AM 1/30/2002 11:43:50 AM Major
*1: The display format as to the tag data items is according to "Tag Data Item Display of Alarm" of Option
Setting (Alarm/Event).
*2: When monitor tool is started or "Apply" button or "Reload" button of monitor target project setting
Section 9.4) is clicked, alarms in occurrence status will transit to recovered status. (Except the file
(
error, memory error and exception error of system alarm)
If the alarm is occurring when it is transiting to recovered status, the new alarm will be displayed. The date
and time displayed by recovered date and time is the date and time of the above operation.
*3: For file error, memory error and exception error, recovered date will not be displayed in recovered date field.
*4: For file error, memory error and exception error, make a check mark in the confirm field to set alarm to
recovered status.
If the check is cancelled in the check box, it will be changed to the occurrence status.
The alarm will not be recovered until checking the checkbox in the confirm field.
7-21
7-21
7 MONITOR FUNCTION
MELSOFT
POINT
If new alarms occur when there have been 2000 registered alarms, the latest alarm
is registered by deleting the already registered alarm.
The alarm to be deleted is selected in accordance with “Unconfirmed Alarms
Deletion at Delete Recovered Alarms” of Option Setting (Alarm/Event) in the
following order.
The setting is "Yes" : 1) an alarm whose date of occurrence is the oldest in the list and the
status is the recovery status.
The setting is "No" : 1) a checked alarm whose date of occurrence is the oldest in the list
and the status is the recovery status
2) an alarm whose date of occurrence is the oldest in the list and the
status is the recovery status
When no alarms that can be deleted from the list exist, the latest alarm is not
recorded on the alarm list.
However, the latest alarm is recorded to the automatic alarm CSV file even though
it cannot be recorded on the alarm list.
(4) The display color of alarm
Display color can be set as changing color in terms of the alarm level and status
in the alarm list.
Color setting in terms of alarm level can use option setting (General).
If [Highlighted display while alarms occur] is set as <Available> in the option
setting (Alarm/Event), the occurring alarm which is not confirmed flashes.
For details, refer to "Section 9.17 Option Setting".
Highlighted display
while alarms occur
Available
None
Not confirmed in occurrence status
After confirmation check
In recovered
Background color flicks in alarm level
Background color flicks in
Background: white
color in 1-second period.
alarm level color.
Character : black
No matter what the status is, display characters of alarm content in alarm level color.
POINT
Character size will not change in changing the window size timely.
7-22
7-22
7 MONITOR FUNCTION
MELSOFT
7.3.2 Confirm check
Click to check the checkbox.
In the server/client monitoring system, when the confirmation check status is changed
on the alarm list screen of one OPS, the alarm list screens of all OPSs are
synchronized.
For details of confirming all alarms on the list, refer to "Section 7.3.5 Confirming all
alarms".
POINT
A user who has the authority of operation for checking the alarm can check the
check box.
The file error, memory error and exception error of system alarm are treated as
alarm recovered at confirming and checking step.
If cancel the check, it will be treated as alarm occurrence.
7.3.3 Displaying selected alarms
Click list box (
) on the alarm list screen, and select the displayed alarm.
Information about the contents of list box is listed in the following table:
Item
7-23
Description
All
Display all the alarms.
Occurring
Display the alarms in occurrence.
Recovered
Display the recovered alarms.
7-23
7 MONITOR FUNCTION
MELSOFT
7.3.4 Deleting recovered alarms
Click the "Delete Recovered Alarms" button on the alarm list screen to delete the
alarms in the recovered status.
In the server/client monitoring system, when the "Delete Recovered Alarms" button is
clicked on the alarm list screen of one OPS, the alarm list screens of all OPSs are
synchronized.
The setting for "Unconfirmed Alarms Deletion at Delete Recovered Alarms" of Option Setting
(Alarm/Event)
"Yes" : delete all the alarms in the recovered status
"No" : delete the checked alarms in the recovered status
POINT
A user who has the authority for deleting the alarms can execute the operation.
"Delete Recovered Alarms" cannot be executed if "Occurring" is selected in
Section 7.3.3).
selected display of alarm (
7.3.5 Confirming all alarms
Click the "Confirm All" button on the alarm list screen to confirm the unconfirmed
alarms that are displayed.
In the server/client monitoring system, when the "Confirm All" button is clicked on the
alarm list screen of one OPS, the alarm list screens of all OPSs are synchronized.
Unconfirmed alarms are all confirmed.
POINT
A user who has the authority for checking the alarms can execute the operation.
If "Occurring" and "Recovered" are selected in displayed of alarm (
Section
7.3.3), it indicates that the displayed data are confirmed.
7-24
7-24
7 MONITOR FUNCTION
MELSOFT
7.3.6 Printing an alarm list
Click the "Print" button on the alarm list screen to print the alarm list.
It will be printed on the printer that is set in the print setting of option setting (General).
If the printer name is not specified, the default printer specified in the personal
computer will be applied.
Following dialog box will be displayed after printing is started. The dialog box will be
closed after printing. Click the "Cancel" button to cancel printing during execution.
Display the selected
alarm
Following are the print image.
Print titles
(with fixed position)
The alarms selected
for display is
displayed to the
right of titles.
Alarm List (All)
2/1 3/2007 1:56:00 PM
Print date and time of printing
(with fixed position)
Only the lines with data are
printed.
Print the messages displayed
on the alarm list screen.
Use narrow printing if the
width of the print paper is less
than the width of the grid.
50 lines can be filled in 1 page
at most.
1
Print page
(position, fonts fixed)
POINT
A user who has the authority for printing the alarms can execute the operation.
Print in the status that is displayed on alarm list screen.
7-25
7-25
7 MONITOR FUNCTION
MELSOFT
7.3.7 Exporting to CSV file
Click the "Export to CSV File" button on the alarm list screen to save all the alarms
selected for displaying on the alarm list in CSV file format. When saving a file, specify
the saving folder and file name.
It indicates the selection status of alarms
that are saved in CSV file.
The output form is as follows.
The first row indicates the title of the data contents and the following rows are output
the collected data in chronological order.
Tag,Tag Comment,Alarm Contents,Detailed Name of Alarm Contents,Occurrence Date,Recovered
Date,Level,Measured Value
LIC002,Tank 2 water level,PLA,Input low limit,9/5/2011 2:14:10 PM,9/5/2011 2:44:08 PM,Minor,0.0
LIC002,Tank 2 water level,LLA, Input low low limit,9/5/2011 2:14:10 PM,9/5/2011 2:44:08 PM,Minor,0.0
#SYSTEM,,Project ID Code Inconsistency : PROJECT,,9/5/2011 2:43:58 PM,9/5/2011 2:44:16 PM,Major,
#SYSTEM,,PLC CPU Error : PROJECT System A,,9/5/2011 2:44:17 PM,,Major,
LIC002,Tank 2 water level,PLA, Input low limit,9/5/2011 2:44:18 PM,,Minor,0.0
LIC002,Tank 2 water level,LLA, Input low low limit,9/5/2011 2:44:18 PM,,Minor,0.0
POINT
Alarm data can be output to CSV files automatically. (
Section 8.7)
(However, its output form differs from that of the alarm list.)
A user who has the authority for exporting data of the alarms to CSV file can
execute the operation.
In CSV file, output as the status selected in the alarm list screen.
The items of "Detailed Name of Alarm Contents" are output regardless of "Tag
Data Item Display of Alarm" display format of Option Setting (Alarm/Event).
7-26
7-26
7 MONITOR FUNCTION
MELSOFT
7.4 Event List
PURPOSE
Display a list of event record.
BASIC OPERATION
1. Click the "Event List" button (
) on the monitor toolbar.
2. The event list screen is displayed.
DISPLAY/SETTING SCREEN
The current
row is
selected for
display.
1)
2)
3)
4)
5)
6)
7)
8)
9)
Maximum 2000 events can be displayed.
* For 1) to 8), refer to "Section 7.4.1 Displaying event list".
POINT
Double-clicking the event line displays the event-related faceplate (if any).
7-27
7-27
7 MONITOR FUNCTION
MELSOFT
7.4.1 Displaying event list
The event records are displayed in descending order of the event occurrence date and
time. Contents of each field are shown as follows.
No.
Item
Description
1)
Confirm field
Display a check box, which attaches a confirm label, when there needs confirm
check in information label event, display this check box.
2)
Tag field
Display the tag name of an object.
3)
Tag comment field
Displays a tag comment.
1
4)
Event Message field *
Display event name (the name is different as the type of event is different).
5)
Occurrence Date field
Display the date and times of an event occur. *
6)
Status field *
1
2
Display information related to status.
1
7)
Set Value field *
Display information related to setting value.
8)
Previous Value field
Display when a value before the change exists.
9)
User field
Display the user name that operates the machine when an event occurs.
*1: The display format as for items of tag data is in accordance with "Tag Data Item Display of Event" of Option
Setting (Alarm/Event).
*2: The format of the displayed date and time depends on the setting of Microsoft Windows Operating
System.
R
7-28
R
7-28
7 MONITOR FUNCTION
MELSOFT
(1) Event types
The history of events is the general output of the tag data and the status change
of the tag data determined by the system. The event contents can generally be
classified into the following four types: operation history, status change history,
message history and system event. The types of events are as the following
table.
Type
Description
Word write
The history of loop tag and status tag when there is a word write operation.
Display the value written to setting value field
When item nature is WORD, DWORD; display in hexadecimal.
When item nature is INT, DINT; attach item unit.
When item nature is REAL, display using decimal point of item and attach
item unit.
When item is CTNO (lockout tag), display lockout tag name.
Bit write
The history of loop tag and status tag when there is a kind of bit write operation
(ON/OFF). The setting value (FALSE or TRUE) will be displayed in setting value
field.
Bit write in radio
button format
The history of loop tag and status tag, when there is a radio button (when one is
on, all others are changed to off) bit write operation. Display selected bit item
name in setting field.
The history when there is a bit write operation that can be registered using the
faceplate display pattern setting (
Section 9.13).
In the setting value field, a string is displayed using faceplate display pattern
Section 9.13) to register.
setting (
If the setting is unregistered or the display pattern number is out of the range, the
display is empty (
Section 10.6).
Operation history
1
*
(An output history
of tag data)
For loop tag (PVAL) and status tag (NREV, REV, MVAL1 or MVAL2)
The history when there is a bit write operation in radio button format.
The number of display pattern is from display name pattern number of tag
data (FPNO).
In the case of Time-out reset, it will be Time-out setting name + "RESET".
Faceplate display
pattern write
For status tag (PB)
The history when there is a bit write operation.
The number of display pattern is from display name pattern number of tag
data (FPNO1 to FPNO5).
A string is displayed as follows in accordance with the ON/OFF history type
registered in the faceplate display pattern setting. (
Section 9.13)
ON/OFF history type
Description
Only ON
The ON name of the operated button is
displayed.
Both ON and OFF
The ON name is displayed when the status
answer (DIM_ON1 to DIM_ON5) of the tag
data corresponding to the button is OFF, and
the OFF name is displayed when the status
answer is ON.
*1: The record is saved on a personal computer with which tag data was operated.
When the server/client monitoring system has been configured, the operation histories can be checked with
any OPS in the system.
7-29
7-29
7 MONITOR FUNCTION
Type
Description
Control mode
The history of an item, when register bit of mode item of loop tag and
status tag is changed to "ON".
Display bit item name in the status field.
I/O mode
The history when the bit status for TAG STOP (TSTP), OVERRIDE
(OVR) and SIMULATION (SIM) in the DIM of loop tag and status tag
transferred.
Display the mode of changing in status field.
Loop tag
(BC, PSUM)
Status change
history
(Specific tag
data status
change history)
MELSOFT
DIM
Loop tag
(PVAL, HTCL)
Status tag
(NREV, REV,
MVAL1, MVAL2, PB)
The history when the bit registered in DIM item is changed to "ON".
Display bit item name in a status field.
The history when the bit registered in DIM item is changed to "ON".
Display a button name registered in the faceplate display pattern setting
(
Section 9.13) set in a status field. The number of display pattern is
from display name pattern number of FPNO of tag data. If not registered,
display is empty. (
Section 10.6)
When the tag type is PB
The ON/OFF history type is "Both ON and OFF", the history of OFF
triggers is also stored.
When the tag type is PVAL
The performance differs depending on the open/close status history.
Always
: store the history at all times.
Only MAN Mode : store the history only in the MAN mode.
(Store when MAN mode bit is ON.)
Status tag
(TIMER1, TIMER2,
COUNT1, COUNT2)
7-30
The history when a bit registered in DIM item is changed to "ON".
Display A bit item name in status field.
Lockout tag
The history when CTNO of loop tag status tag is changing. Display the
name related to number in status field. If not registered, display is empty.
Motion type
The history of motion type change when loop tag and tag type are PGS
or PGS2. Display the motion type in status field.
7-30
7 MONITOR FUNCTION
Type
Message history
System
event
7-31
MELSOFT
Description
Message tag
The history of MSG item, when its bit is changed to "ON". Display a
confirm check box when there is a specific confirm in tag data. Event
message comes from event setting (
Section 9.10). Event
number is the message number of tag data (the value stored to
MSG1NO to MSG8NO). The settings is not registered, it will be
displayed as blank (
Section 10.8).
64-points message tag
The history of MSG_W1 to MSG_W4 item, when its bit is changed to
"ON". Display a confirm check box when there is a specific confirm in
tag data. The event message is to display connected character string
of group name and message content which are registered to event
setting (
Section 9.10). Event number is the message group
name number of tag data (the value stored to MSGG1NO to
MSGG8NO) and the message number of tag data (the value stored to
MSG1NO to MSG64NO). The settings is not registered, it will be
displayed as blank (
Section 10.8).
Monitor target project load history
The history of monitor target projects read by the monitor tool.
Checking this record allows judgment of whether tag data has been
newly added or changed.
Monitor tool start/stop history
The history of starting and stopping the monitor tool.
Checking this record allows confirmation of whether or not the monitor
tool started in the time zone where no alarms occurred in the alarm list.
Mode change history
The history when the mode is changed.
Redundant system:
control system switching history
The history when standby system is switched to control system.
(connection target is Redundant CPU)
Redundant system:
operation mode change history
The history when the operation mode is changed. (connection target is
Redundant CPU)
7-31
7 MONITOR FUNCTION
MELSOFT
(2) Display items based on event types
The description of display items based on event types is as follows.
Event type
Confirm
Tag
Word write
Bit write
Operation
history
Bit write in radio
button format
No
display
Faceplate
display pattern
write
Tag
Occurrence
Event message
comment
date
Displays
operation item
name. *1
Displays
the tag
Displays
name of a tag
operation comment.
No display
objects.
Displays
date and
time of
operation.
I/O mode
Loop tag
(BC, PSUM)
Loop tag
(PVAL, HTCL)
Status tag
(NREV, REV,
MVAL1, MVAL2,
Status
No
changing PB)
display
history
Status tag
(TIMER1,
TIMER2,
COUNT1,
COUNT2)
No display
Displays
the tag
name of
changing
object.
Displays
date and
time of
changing.
Displays
a tag
comment.
Display bit item
name "CTNO"s
*1
Display bit item
name "TYP"s *1
Displays Set character
According
Displays
a tag
string in event
to tag
tag name.
comment. setting
data
Monitor target
project was
loaded
Monitor tool
start/stop history
(standalone)
Monitor Tool
was started/
stopped
Monitor Tool
was
started:+OPS
name/
stopped:+OPS
name
Monitor tool
start/stop history
(server/client)
Redundant
system:
control system
switching history
Redundant
system:
operation mode
change history
Displays the
character
string set in No
display
display
pattern
setting.
Displays user
name (input
user name at
mode change).
No
display
#SYSTEM
Displays
character string
set in display
pattern setting.
No display
No display
No display
No display
Lockout tag
Motion type
Bit item name *1
No display
Monitor target
project load
history
Mode change
history
(server/client)
Previous
Value
Bit item name *1
No display
User
Bit item name *1
Motion type
(PGS)
Motion type
(PGS2)
Mode change
history
(standalone)
Setting
value
Previous
Value
Bit item name *1
Lockout tag
System
event
Set value
Bit item name *1
Mode in
changing *1
(NOR/SIM/
OVR/TSTP)
Control mode
Message history
Status
No
display
Change mode
Change mode
+OPS name
Redundant
system control
switching:
+ Project name
Redundant
system
operation mode
change:
+ Project name
Displays
date and
time of
changing.
Displays
date and
time of
changing.
No display
No display
Displays
date and
time of
start/end.
Displays
date and
time of
changing.
Displays
date and
time of
changing.
(display a user
name when
exiting Monitor
Tool)
No display
Mode after
change
(Engineer mode/
Operator mode/
Lock mode)
No display
Display a user
name after
change (no
user name is
displayed when
changed to the
lock mode)
System A/B
No display
Separate mode
/Backup mode
/Debug mode
No display
*1: The display format as for items of tag data is in accordance with "Tag Data Item Display of Event" of Option Setting (Alarm/Event).
7-32
7-32
7 MONITOR FUNCTION
MELSOFT
POINT
Even if the size of window is changed, the font size displayed is not changed.
When a new event occurs while 2000 events have been registered, the latest
event is registered by deleting the already registered event.
The event to be deleted is selected in accordance with "Unconfirmed Events
Deletion at Delete All" of Option Setting (Alarm/Event) in the following order.
The setting is "Yes" : an event whose date of occurrence is the oldest in the list
The setting is "No" : a checked event or an event without the confirmation check box
display whose date of occurrence is the oldest in the list
When no events that can be deleted on the list exist, the latest event is not
recorded on the event list.
However, the latest event is recorded to the automatic event CSV file even
though it cannot be recorded on the event list.
7-33
7-33
7 MONITOR FUNCTION
MELSOFT
(3) Display example of event
The display example of event types are as follows.
Operation record (Word write)
Confirm
Tag
TIC001
TIC001
Event Message *1
Tag comment
Room temperature
SV
adjustment valve 1
Room temperature
CTNO
adjustment valve 1
Occurrence Date
Status
Set value
1/30/2002 11:43:20 AM TYP_RETURN 23.5
1/30/2002 11:43:50 AM
Previous
value
19.5
Checking
User
UserABC
UserABC
Operation log (Bit write)
Confirm
Tag
TIC001
Event Message *1
Tag comment
Room temperature
MLL
adjustment valve 1
Occurrence Date
Status
1/30/2002 11:43:40 AM
Set value
Previous
value
TRUE
FALSE
User
UserABC
Operation log (Bit write in radio button format)
Confirm
Tag
TIC001
Tag comment
Event Message
Room temperature
adjustment valve 1
Occurrence Date
Status
1/30/2002 11:43:40 AM
Set value Previous
value
*1
MAN
AUT
Set value
Previous
value
User
UserABC
Operation record (Faceplate display pattern write)
Confirm
Tag
VALV001
VALV001
Tag comment
Event Message
Water temperature
adjustment valve 1
Water temperature
adjustment valve 1
Occurrence Date
Status
User
1/30/2002 11:43:40 AM
ON
UserABC
1/30/2002 11:43:45 AM
Time-out
RESET
UserABC
Status change record (Control mode)
Confirm
Tag
TIC001
Tag comment
Event Message
Room temperature
adjustment valve 1
Occurrence Date
Status *1
Set value
Previous
value
User
Set value
Previous
value
User
Set value
Previous
value
User
1/30/2002 11:43:40 AM MAN
Status change record (I/O mode)
Confirm
Tag
TIC001
Tag comment
Event Message
Room temperature
adjustment valve 1
Occurrence Date
Status *1
1/30/2002 11:43:40 AM SIM
Status change record (Loop tag BC, PSUM)
Confirm
Tag
Tag comment
BC001
Batch counter 1
Event Message
Occurrence Date
Status *1
1/30/2002 11:43:40 AM DIM_RUN
Status change record (Loop tag PVAL, HTCL, Status tag NREV, REV, MVAL1, MVAL2, PB)
Confirm
Tag
VALV001
Tag comment
Event Message
Water temperature
adjustment valve 1
Status
Set value
Previous
value
User
Status *1
Set value
Previous
value
User
Set value
Previous
value
User
Set value
Previous
value
User
Occurrence Date
1/30/2002 11:43:40 AM ON
Status change record (Status tag TIMER1, TIMER2, COUNT1, COUNT2)
Confirm
Tag
Tag comment
Event Message
TIMER001 Timer 1
Occurrence Date
1/30/2002 11:43:40 AM DIM_RUN
Status change record (Lockout tag)
Confirm
Tag
TIC001
Tag comment
Event Message *1
Room temperature
CTNO
adjustment valve 1
Occurrence Date
Status
1/30/2002 11:43:40 AM Checking
Status change record (Motion type PGS)
Confirm
Tag
PGS001
Event Message *1
Tag comment
Program setter 1
TYP
Occurrence Date
Status
1/30/2002 11:43:40 AM 1
*1: The display format as for items of tag data is in accordance with "Tag Data Item Display of Event" of Option Setting (Alarm/Event).
7-34
7-34
7 MONITOR FUNCTION
MELSOFT
Status change record (Motion type PGS2)
Confirm
Tag
PGS2001
Tag comment
Event Message
Program setter 2
Occurrence Date
Set value
Previous
value
User
Status
Set value
Previous
value
User
Status
Set value
Previous
value
User
Status
Set value
Previous
value
User
Status
Set value
Previous
value
User
Status
Set value
Previous
value
User
Status *1
3/11/2006 11:43:40 AM TYP_RETURN
Message record
Confirm
Tag
MSG001
MSG002
Tag comment
Alarm message 1
Operation start
message 1
Event Message
Occurrence Date
Please turn to administrator 1/30/2002 11:43:40 AM
Start A process
1/30/2002 11:43:45 AM
Monitor target project load history
Confirm
Tag
Tag comment
Event Message
Monitor target project was
loaded
#SYSTEM
Occurrence Date
1/30/2002 11:43:40 AM
Monitor tool start/stop history
Confirm
Tag
Tag comment
#SYSTEM
#SYSTEM
Event Message
Monitor tool was started
Monitor tool was stopped
Occurrence Date
1/30/2002 11:43:40 AM
1/30/2002 11:43:50 AM
Monitor tool start/stop history (standalone)
Confirm
Tag
Tag comment
#SYSTEM
#SYSTEM
Event Message
Monitor tool was started
Monitor tool was stopped
Occurrence Date
8/05/2008 1:43:40 PM
8/05/2008 1:43:50 PM
Monitor tool start/stop history (server/client)
Confirm
Tag
Tag comment
Event Message
Monitor tool was
started:[Server 1]
Monitor tool was
stopped:[Server 1]
#SYSTEM
#SYSTEM
Occurrence Date
8/05/2008 1:43:40 PM
8/05/2008 1:43:50 PM
admin
Mode change history (standalone)
Confirm
Tag
Tag comment
#SYSTEM
Event Message
Change mode
Occurrence Date
Status
9/05/2011 2:13:32 PM
Engineer mode
Occurrence Date
Status
9/05/2011 2:13:32 PM
Engineer mode
Occurrence Date
Status
Set value
Previous
value
User
admin
Mode change history (server/client)
Confirm
Tag
Tag comment
#SYSTEM
Event Message
Change mode:[Server 1]
Set value
Previous
value
User
admin
Redundant system control switching history
Confirm
Tag
Tag comment
Event Message
Redundant System:
Control System switching:
PROJECT1
Redundant System:
Control System switching:
PROJECT1
#SYSTEM
#SYSTEM
Set value
Previous
value
User
Set value
Previous
value
User
4/01/2004 12:14:28 AM System A
4/01/2004 12:14:28 AM System B
Redundant system operation mode change history
Confirm
Tag
#SYSTEM
#SYSTEM
#SYSTEM
Tag comment
Event Message
Redundant System:
Operation Mode Change:
PROJECT1
Redundant System:
Operation Mode Change:
PROJECT1
Redundant System:
Operation Mode Change:
PROJECT1
Occurrence Date
4/01/2004 11:43:30 AM
Status
Separate
mode
4/01/2004 11:43:40 AM Backup mode
4/01/2004 11:43:50 AM Debug mode
*1: The display format as for items of tag data is in accordance with "Tag Data Item Display of Event" of Option Setting (Alarm/Event).
7-35
7-35
7 MONITOR FUNCTION
MELSOFT
7.4.2 Confirm check
The check box displays in the message record when tag data of message tag has a
confirm tag. Click to check the checkbox.
In the server/client monitoring system, when the confirmation check status is changed
on the event list screen of one OPS, the event list screens of all OPSs are
synchronized.
For details of confirming all events on the list, refer to "Section 7.4.4 Confirming all
events".
POINT
A user who has the authority of operation for checking the event can check the
check box.
7.4.3 Deleting all events
Click the "Delete All" button on the event list screen, the events are deleted.
In the server/client monitoring system, when the "Delete All" button is clicked on the
event list screen of one OPS, the event list screens of all OPSs are synchronized.
The setting for "Unconfirmed Events Deletion at Delete All" of Option Setting (Alarm/Event)
"Yes" : delete all the events in the recovered status
"No" : delete the checked events and events without the confirmation check box display
POINT
A user who has the authority for deleting the events can execute the operation.
7-36
7-36
7 MONITOR FUNCTION
MELSOFT
7.4.4 Confirming all events
Click the "Confirm All" button on the event list screen to confirm all confirmed events.
In the server/client monitoring system, when the "Confirm All" button is clicked on the
event list screen of one OPS, the event list screens of all OPSs are synchronized.
Unconfirmed
events are
all confirmed.
POINT
A user who has the authority for checking the events can execute the operation.
7-37
7-37
7 MONITOR FUNCTION
MELSOFT
7.4.5 Printing an event list
Click the "Print" button on the event list screen to print the event list. It will be printed
on the printer that is set in the print setting of option setting (General). If the printer
name is not specified, the default printer specified in the personal computer will be
applied.
Following dialog box will be displayed after printing is started. The dialog box will be
closed after printing.
Click the "Cancel" button to cancel printing execution.
Following are the print image:
Header position
print characters
fixed.
Alarm List (All)
2/1 3/2007 1:56:00 PM
Print date and time of printing
(with fixed position)
Only the rows with data are
printed.
Print the displayed image
on the event list screen.
Use narrow printing if the
width of the print paper is
less than the width of the
grid.
50 rows can be filled in
1 page at most.
Print page
(position, fonts fixed)
POINT
A user who has the authority for printing the events can execute the operation.
7-38
7-38
7 MONITOR FUNCTION
MELSOFT
7.4.6 Exporting to CSV file
Click the "Export to CSV File" button on the event list screen to save all events in CSV
file format. When saving a file, specify the saving folder and file name.
The output format is as follows.
The first row indicates the title of the data contents and the following rows are output
the collected data in chronological order.
Tag,Tag Comment,Event Message,Detailed Name of Event Message,Occurrence Date,
Status,Detailed Name of Status,Set Value,Detailed Name of Set Value,Previous Value,
Detailed Name of Previous Value,User
CON001,Batch counter1,,,9/5/2011 5:46:40 PM,DIM_COMP,Complete external output,,,,,
TIM001,Timer 1,,,9/5/2011 5:46:48 PM,DIM_STOP,Stop,,,,,
TIM001,Timer 1,,,9/5/2011 5:46:48 PM,DIM_PRE_COMP,Pre-complete external output,,,,,
TIM001,Timer 1,,,9/5/2011 5:46:48 PM,DIM_COMP,Complete external output,,,,,
#SYSTEM,,Monitor Target Project was loaded.,,9/5/2011 5:46:53 PM,,,,,,,
PGS2001,1st step program setter,T,,9/5/2011 5:49:02 PM,,,5s,,,,admin
POINT
Event data can be output to CSV files automatically. (
Section 8.7)
A user who has the authority for exporting data of the events to CSV file can
execute the operation.
The items of "Detailed Name of Event Message", "Detailed Name of Status",
"Detailed Name of Set Value" are output regardless of "Tag Data Item Display
of Event" display format of Option Setting (Alarm/Event).
7-39
7-39
7 MONITOR FUNCTION
MELSOFT
7.5 User-created Screen
PURPOSE
Assign monitoring applications to user-created screen buttons on the monitor
toolbar.
Section 11.1) or Microsoft Visual
Programs created with GT SoftGOT (
Section 11.2) can be assigned as applications.
Basic (
BASIC OPERATION
1. Click the "Setting window" button on the monitor toolbar, using [User-created
Screen Setting] to pre-register application program of screen necessary for
Section 9.11). Once an application is registered, as long as the
display (
setting is not changed, even if restart after monitor tool is exited, the
application program can still display on the monitor toolbar.
2. Click the "User-created screen display" button on the monitor toolbar (Button
icon is determined by the registered application).
3. Start the registered application program, display user-created screen.
User-created Screen Button 1 to 4
Maximum 4 application programs can be registered optionally and can be started up
by the buttons assigned on the monitor toolbar.
Screen of application program assigned to a button can only display 1 screen (even if
click user-created screen button1 twice, it can only activate the registered screen of
application program but cannot open two screens). To open multiple screens of the
same application program, it needs to register other buttons separately.
POINT
When monitor screen (such as control panel) is opened or another user-created
application is started up in single-window mode during the execution of the
application started up by the user-created screen button, the application being
executed will be closed.
When "Do not close when switching Monitor Window." is set in the Detail setting
Section 9.11) in single-window mode, the
of the user-created screen (
application being executed will not be closed.
Note, however, that the application being executed closes regardless of settings
when the setting window is displayed or the Monitor tool is exited.
7-40
7-40
7 MONITOR FUNCTION
MELSOFT
The example of user-created screen is as follows:
POINT
The button cannot be clicked during setting window opening.
The applications registered to User-created Screen Setting or icons registered
to detail setting of User-created Screen Setting are displayed on the usercreated screen button 1 to 4.
Even if the window opened by using "User-created screen" button is not used
for monitor screen, it is still treated as a monitor window about the limit for
Section 6.4)
maximum open screens. (
When close monitor tool, all application programs started by "User-created
screen" button must be closed.
Tag data access control (
Appendix 5.1.1) can be used to acquire or set
the value of tag data and display it on screen. Using a button in a user-created
screen, the same faceplate can be opened as the one displayed in other
screens of monitor tool. (As for sample data, refer to sample VB folder of CDROM).
Appendix 5.1.2), faceplate can be displayed
Through faceplate control (
on the screen.
When "Privilege Level" of the application is specified to "Run this program as an
administrator", "Privilege Level" of the monitor tool also needs to be specified to
"Run this program as an administrator."
For the method to execute programs as an administrator, refer to Section 5.1.
7-41
7-41
7 MONITOR FUNCTION
MELSOFT
7.6 Pop-up Faceplate
PURPOSE
To display a screen called faceplate in the form of a pop-up window. This screen
displays tag data contents in the forms of simulation adjusting meter and so on.
BASIC OPERATION
Any of the following methods can be used to display pop-up faceplate.
Find with tag names
1. Click the "Find" button (
) on the monitor toolbar.
2. Specify and search tag names with the find dialog box (
3. The pop-up faceplate screen is displayed.
Section 8.4).
Display the related faceplate with alarm display bar.
1. Click the faceplate display button at the alarm display bar. This bar is at the
Section 6.3.1).
top left corner of the monitor toolbar (
2. The pop-up faceplate screen related to alarm is displayed.
Display the related faceplate with alarm display bar
) on the monitor toolbar.
1. Click the "Alarm List" button (
2. Double click the alarm display bar on the alarm list screen
Section 7.3).
(
3. The pop-up faceplate screen related to the alarm is displayed.
Display from pop-up tuning screen.
1. Click the ">>" button on the pop-up tuning screen.
2. The pop-up tuning screen replaces the displayed pop-up faceplate screen.
DISPLAY/SETTING SCREEN
Faceplate
Display button for
switching to turning
screen
7-42
7-42
7 MONITOR FUNCTION
MELSOFT
POINT
Up to four pop-up windows can be displayed.
If a new pop-up window is opened when four pop-up windows have already
been displayed, the earliest opened (displayed in the bottom) one among the
four on-screen windows is automatically closed.
However, if it cannot be closed as displaying a dialog box for example, one next
to the bottom is closed.
If a new pop-up window is opened when four pop-up windows have already
been displayed, the bottom one of the on-screen pop-up windows is forcibly
closed.
To keep the desired pop-up window open, close the unnecessary pop-up
window before opening a new one.
In the server/client monitoring system, up to 72 windows among all OPSs (up to
four windows in each OPS) can be displayed.
Applying Windows 7 or later Snap function to the pop-up faceplate screen may
hinder the normal aspect ratio.
In this case, resize the pop-up faceplate screen to restore to the normal aspect
ratio.
R
7-43
7-43
7 MONITOR FUNCTION
MELSOFT
7.6.1 Displaying a faceplate
The information of distributed tag is displayed on the faceplate.
Section 9.7).
Tags are set by control panel setting (
For details of each faceplate, refer to "Chapter 10 FACEPLATE".
7.6.2 Displaying a pop-up tuning screen
Click the "<<" button on the pop-up faceplate, the tuning screen replaces the displayed
faceplate screen. For details of the tuning screen, refer to "Section 7.7 Pop-up Tuning
Screen".
POINT
Click the button at the bottom of the faceplate to change the window of the display
faceplate as shown below.
<Control panel>
Open a new pop-up tuning screen
Change display
<Pop-up tuning>
7-44
<Pop-up faceplate>
7-44
7 MONITOR FUNCTION
MELSOFT
7.7 Pop-up Tuning Screen
PURPOSE
Screens for tuning display in the form of pop-up windows.
BASIC OPERATION
Any of the following methods can be used to display pop-up tuning screens.
Display from the control panel
1. Click the "Control Panel" button (
) on the monitor toolbar.
2. Click the "Details" button of the faceplate on the control panel.
3. The pop-up faceplate screen is displayed.
Display from the pop-up faceplate screen
1. Click the "<<" button on the pop-up faceplate screen.
2. The pop-up tuning screen replaces the pop-up faceplate screen.
DISPLAY/SETTING SCREEN
MV Pointer line
SV Pointer line
3)
10)
4)
11)
5)
6)
12)
7)
8)
9)
13)
14)
1)Tag monitor
2)Tuning trend graph
Faceplate
1) Tag monitor
<Under the loop tag condition
(except for tag type PGS, PGS2)>
1) Tag monitor
16) Program pattern graph 2
15) Program pattern graph
Faceplate
< Loop tag (PGS tag type)>
Faceplate
< Loop tag (PGS2 tag type) >
7-45
7-45
7 MONITOR FUNCTION
1) Tag monitor
Faceplate
< Status tag, Alarm tag (ALM tag type),
Message tag (MSG tag type) >
7-46
MELSOFT
1) Tag monitor
17) Message display area Faceplate
< Alarm tag (ALM_64PT tag type),
Message tag (MSG_64PT tag type)
7-46
7 MONITOR FUNCTION
MELSOFT
7.7.1 Displaying a pop-up tuning screen
The following table is the displayed contents of all bars on the pop-up tuning screen.
No.
Item
1
1)
Tag monitor *
2)
Tuning trend graph *
3)
4)
5)
1
Graph display check
box
Cursor position data
Tuning trend cursor
position
Description
It displays values of the tag data items.
For the word item that can be displayed for each bit item, a
mark is displayed on the left
of the item for level indication.
The display of tag data items can be switched in the display switching tab of 8).
Values are input to the grid, which can change the values of tag data items.
Judgment between changeable tag data items and unchangeable tag data items can be
made by the text color displayed in the "Data" field.
Changeable data
:Black
Unchangeable data :Gray
A user who has authority of operation for changing tag data items can change the data.
For details of operation authority, refer to Appendix 4.
Note that data cannot be changed when lockout tag is set.
Each value of PV, SV, and MV is displayed in graphs.
By setting option setting, background color of the screen, color of the gridlines and each
Section 9.17).
graph can be specified (
With check………Display the graphs.
Without check......Cannot display the graphs.
It can only display but cannot change the cursor position data of the tuning trend graph
By moving the cursor position, data at any time on the tuning trend graph can be displayed
on 4) bar.
When moved on the split bar, the mouse pointer turns to a
mark.
Drag the split bar in this status to change the horizontal width of Tag monitor.
The tuning trend graph can be rolled.
The cursor position on the screen does not change, but the cursor position data changes
after rolling. When rolling to the left of the oldest value, it returns to the oldest data position
automatically.
Switches the display items in tag monitor.
Tab name
Display item
Displays only the tag data items (such as PV/MV/SV value, PID
Basic
constant and high/low limit alarm value) often monitored/set.
All
Displays all tag data items.
6)
Split bar
7)
Graph scroll bar
8)
Display switching tab
9)
Detailed names of the
tag data items
It displays items' detailed names of the lines selected with tag monitor.
Auto tuning status
display
Displays only tag types available for auto tuning.
Display format
Auto tuning
Alarm
executing status
Display
Background color
In executing
Not occurred
Auto Tuning…
Light blue
Not occurred
Auto Tuning…
White
Not in executing
Occurred
Auto Tuning…
Red
As for status, alarm and message tag, only the All tab is displayed.
10)
Text color
Black
Gray
Gray
Tuning trend collection
It sets tuning trend collection instructions and displays status.
11) instructions button and
For details, refer to "Section 7.7.3 Tuning trend collection instruction".
status display
At the bottom is the scale of MV, at the top section is the scale of PV, SV.
In the middle are the values automatically calculated and displayed according to top and
bottom limits of the scale.
12) Y-axis scale
The scale of MV displayed at the bottom is -10 to 110, and only the PFC_INT is -110 to 110.
For other than tags of PGS type, PGS2 type, double-click on the 2) Tuning trend graph to
switch to display/hide Y-axis scale and zoom in/zoom out the graph area.
It displays the gridline time in hour and minute.
13) Gridline time display
When the display trend data does not reach the gridline, the time will not be displayed.
14) "Close" button
Used to close the pop-up window.
*1: The displayed data are collected through high-speed tag data collection and high-speed current value collection (
Appendix 1.1).
The high-speed current value collection period is confirmed in the PLC communication status screen (
Section 8.5).
During collection of the tuning trend data, confirm the following current values displayed on the Collection Period for
Each Communication type tab of the PLC Communication Status screen (
Section 8.5) are within 1 second.
The current value of High-speed Current Value Collection (unit: second)
The current value of High-speed Tag Data Collection (unit: second)
If either of the value exceeds 1 second, the data cannot be collected in 1-second period.
7-47
7-47
7 MONITOR FUNCTION
No.
MELSOFT
Item
Description
SV and MV against elapsed time are displayed by graphs.
15) Program pattern graph Background color, gridline and color for each graph can be specified in the option setting.
(
Section 9.17)
Displays SV of the time set in advance for each step as graphs.
Program pattern
16)
Background color, gridline and color for each graph can be specified in the option setting.
graph2
(
Section 9.17)
Displays alarm/message group name and alarm/message name of 64-point alarm tag or 64point message tag.
64-points alarm tag
The background color (“Major/Minor alarm color” in the option setting) of the alarm name
cell will be changed depending on the alarm level during the corresponding error occur.
17) Message display area
64-points message tag
The background color of the message name cell will be changed to green during the
corresponding message occur.
When the corresponding alarm is not registered to the alarm setting, or the corresponding
message is not registered to the event setting, the cell will be blank.
(1) Loop tag (except for tag type PGS, PGS2)
On the tuning trend graph, the 3 graphs of PV (process variable), SV (setting
value) and MV (manipulated variable) are displayed one after another in the
passing time sequence. The lines of the graphs are displayed in the colors set as
the graph 1 to 3 display colors (PV: Graph 1 Color, SV: Graph 2 Color: MV:
Graph 3 Color) in option setting (trend graph). (
Section 9.17 (4))
DISPLAY/SETTING SCREEN
Cursor position
data
Tuning trend
cursor
Gridline time
display column
The pop-up tuning screen is composed of the tag
monitor bar, tuning trend graph and faceplate.
Graph scroll bar
<Tuning trend graph>
DISPLAY/SETTING DATA
Item
Description
Cursor position data
The values at the time selected with the tuning trend cursor are displayed.
Tuning trend cursor
Used to select a time point of the graph: the values corresponding to the
selected point are displayed in the cursor position data field.
Gridline time display column
The time is displayed for each gridline.
Graph scroll bar
Used to scroll the graph that cannot be displayed within a single screen.
REMARK
In the presence of displayed trend data, if the window size is changed or the gridline
interval is changed on the pop-up tuning screen, the tuning trend cursor and graph
scroll bar move to the right end.
7-48
7-48
7 MONITOR FUNCTION
MELSOFT
(2) Loop tag (PGS tag type)
On the program pattern graph, values of SV (set time: second) and MV (set
output: %) are displayed in graphs. These values are set with the tag item of
PGS.
When the MV output value is out of the high and low limit value range (this range
is set through tag data items MH and ML), the graph in this section is displayed in
a different color. It is displayed as the double graphs by gaining an integer from
the high and low limit values of MV.
DISPLAY/SETTING SCREEN
SV pointer line
SV pointer line
MV pointer line
Graph within range
(PV value bar positive
direction color)
MV low
limit
value
(ML)
The pop-up tuning screen consists of the tag
monitor bar, program pattern graph and faceplate.
Graph outside range
(PV high/low limit
value bar color)
<Program pattern graph>
DISPLAY/SETTING DATA
Item
Description
MV low limit value (ML)
The MV low limit value set in the tag data item ML is displayed.
SV pointer line
The current value of the SV is displayed.
The SV pointer line is displayed in white.
MV pointer line
The current value of the MV is displayed.
The MV pointer line is displayed in white.
Graph within range
(PV value bar positive direction color)
A graph whose MV output value is within the range of the MV high limit value
and low limit value set in the tag data items MH, ML.
The line of the graph is displayed in the "PV value bar positive direction color"
of the option setting (faceplate). (
Section 9.17 (3))
Graph outside range
(PV high/low limit value bar color)
A graph whose MV output value is outside the range of the MV high limit value
and low limit value set in the tag data items MH, ML.
The line of the graph is displayed in the "PV high/low limit value bar color" of
the option setting (faceplate). (
Section 9.17 (3))
7-49
7-49
7 MONITOR FUNCTION
MELSOFT
(3) Loop tag (PGS2 tag type)
On the program pattern graph2, the SV output value of the time set in advance
for each step are displayed as graphs. For the Y-axis scale of the graph, RH and
RL set with the tag data item of PGS2 are used.
When the SV output value is out of the SV high and low limit value range set at
the tag data item SH and SL, the corresponding section of the graph is displayed
overlapping with the graph, which the values are clipped in the SV high and low
limit value range, in a different color.
DISPLAY/SETTING SCREEN
Crosshair cursor line (vertical)
Graph within range
(PV value bar positive
direction color)
Crosshair cursor line
(horizontal)
Graph outside range
(PV high/low limit
value bar color)
<Pop-up tuning screen>
The screen consists of the tag monitor field,
tuning trend graph, and faceplate.
PV point, PV line
<program pattern graph2>
DISPLAY/SETTING DATA
Item
Description
Crosshair cursor line (vertical)
Displays the current time in the step.
The crosshair cursor line (vertical) is displayed in white.
Crosshair cursor line (horizontal)
Displays current setting value.
The crosshair cursor line (horizontal) is displayed in white.
PV point, PV line
Displays the current value of PV.
(PV point is displayed on the crosshair cursor line (vertical).)
PV point and PV line are both displayed in magenta.
Graph within range
(PV value bar positive direction color)
A graph displayed when the SV output value is within the SV high and low limit
value range set at the tag data item SH and SL.
The graph is displayed in color set for “PV bar positive direction color” in option
setting. (
Section 9.17 (3))
Graph outside range
(PV high/low limit value bar color)
A graph displayed when the SV output value is outside of the SV high and low
limit value range set at the tag data item SH and SL.
The graph is displayed in color set for “PV high/low limit value bar color” in
option setting. (
Section 9.17 (3))
7-50
7-50
7 MONITOR FUNCTION
MELSOFT
(4) Status tag, alarm tag (ALM tag type), and message tag (MSG tag
type)
The pop-up tuning screen is composed of the tag monitor bar and faceplate only.
(5) Alarm tag (ALM_64PT tag type), and message tag (MSG_64PT tag
type)
The pop-up tuning screen is composed of the tag monitor bar, message display
area, and faceplate.
7.7.2 Collecting tuning trend data
The tuned data is not saved in the files, but in the memory.
Data saved in the memory can be export to the CSV files. (
Item
Collection target
Section 7.7.8)
Description
Loop tag: 3 values of PV, SV and MV
Sampling period
1 second
Collected data quantity
Maximum number of 20000 points collected data can be stored in the memory each time of
tuning. Even if the screen is closed, the collected data will not be cleared, and when
collecting, it still continues to collect under the same condition.
If the buffer memory is full, it automatically stops collecting.
Recordable time
5.5 hours
Simultaneous execution
16 tuning
Storing destination
Memory
7-51
7-51
7 MONITOR FUNCTION
MELSOFT
7.7.3 Tuning trend collection instruction
On the pop-up tuning screen, click the button of tuning trend collection instructions to
start/stop collecting tuning trend data.
1) Start
4) Clear (Stopped)
2) Stop
3) Automatic stop
5) Clear (Collecting)
Description
Status display
after execution
1) Start
Click the button to start collecting the tuning trend data.
When the points are recorded to 20000 and the buffer memory is full,
tuning trend collection will start after deleting the current turning trend data.
Collecting
(Light Blue)
2) Stop
Click the button to stop collecting the tuning trend data.
No.
3) Automatic stop
4) Clear (Stopped)
5) Clear (Collecting)
When the points are recorded to 20000 and the buffer memory is full, it will
automatically stop.
Click the button to clear the tuning trend data. The tuning trend graph
returns to the initial display status.
Click the button to clear the tuning trend data and automatically start
collecting tuning trend.
Stopped
(Yellow)
Stopped
(Yellow)
Stopped
(Yellow)
Collecting
(Light Blue)
POINT
A user who has the authority of operation for tuning trend data collecting
instructions can execute the operation.
The collected data is cleared when the monitor tool is finished. When it is
restarted, the data should be collected again, and the maximum number of 16
tags is 16.
The maximum number of tags tuned simultaneously (retainable tuning trend
data) is 16.
If the total number of tag retaining tuning trend data is 16, any one of the
existing data must be cleared to start collecting of new tags.
Section 7.7.7)
Clear any one of the tags displayed in collected tag list (
after the collection stops.
If restarting collection without clearing the data after the collection stop, the
graph display in before stop and after restart are separated with dotted line.
The following shows the example when the collection is stopped/restarted.
Displays restarting line
(gridline color) with dotted line.
When stops collection at 15:21:45 and restarts 15:29:48:
Skips the time during stop and starts displaying the time when collection restarts.
In the server/client monitoring system, the maximum number of tags collected
simultaneously among all OPSs is 288.
7-52
7-52
7 MONITOR FUNCTION
MELSOFT
7.7.4 Changing a current value
The tag monitor bar can be used to change current values of the tag data on the popup tuning screen. Changed values can be set through a dialog box. This box is
displayed from the [Data] quadrille of the tag monitor.
1. On the tag monitor, select the [Data] quadrille
of the tag data items to be changed.
2. Click the displayed button.
3. The "Change Current Value" dialog box is
displayed. (When the dialog box is displayed,
the current value is displayed inside the
setting value field).
4. Input the setting value.
WORD, DWORD type: Input with H added on the
head in the Hex system.
INT, DINT type:
Input in the decimal
system.
REAL type:
Input in the form of floating
decimal points.
BOOL type:
Select TRUE or FALSE by
toggle button.
5. Click the "Set" button, and the current value is
changed.
POINT
A user who has the authority of operation for changing the corresponding tag
data items can change a current value.
For details of operation authority, refer to Appendix 4.
Judgment between changeable tag data and unchangeable tag data can be
made by the text color displayed in the "Data" field.
Changeable data : Black
Unchangeable data: Gray
Before clicking the "Close" button, the "Change Current Value" dialog box will
not be closed. Therefore, the setting value can be continuously changed (repeat
the operations of step 4 and 5 mentioned above).
REMARK
The current value should be set within the high and low limit range that is
specified by each tag data item.
(If the setting value is out of the limit range, "Error" information will be displayed.)
For the setting range of each tag item, refer to "PX Developer Programming
Manual".
Before setting values of PV, SV, and high high/low/low low limit (PV, SV, PH, PL,
HH, LL, SH, SL), the right high/low values (RL, RH) of the engineering value
should be set. If the tag data is R, when setting the SV value and its high/low
values (SV, SH, SL), the right ratio high/low values (RMAX, MIN) should be set
beforehand.
7-53
7-53
7 MONITOR FUNCTION
MELSOFT
7.7.5 Auto tuning
When tuning on the pop-up tuning screens of the tag of types PID, 2PID and 2PIDH, it
can be auto tuning before accurate adjustment. Thus, the value can be automatically
adjusted to the approximate value.
With the auto tuning function, the following operations/displays are performed in the
dialog boxes displayed when the "Auto Tuning" button located at the top center of the
screen is clicked.
(1) An execution of auto tuning by the Step Response method
(2) An execution of auto tuning by the Limit Cycle method (only for the 2PIDH type)
(3) Auto tuning status display
POINT
When the lockout tag is set, or a user who does not have the authority of
operation for changing a tuning parameter value cannot execute the following
auto tuning operations.
(a) Start
(b) Stop/Reset alarm
(c) Restore PID parameters
When an alarm occurs, auto tuning will stop automatically.
The Limit Cycle method is available with PX Developer Version 1.14Q or later.
The Step Response method can be executed when the control mode is in
MANUAL mode or COMPUTER MV mode.
The Step Response method and the Limit Cycle method share the time-out
period (AT1TOUT1). When changing the auto tuning method, please check
whether the time-out period is appropriate.
7-54
7-54
7 MONITOR FUNCTION
MELSOFT
(1) An execution of auto tuning by the Step Response method
BASIC OPERATION
1. Click the "Auto Tuning" button.
2. The "Select Auto Tuning Operations" dialog box is
displayed.
3. Select the radio button that says "Executes Auto Tuning by
the Step Response method".
4. Click the "Next" button.
5. The "Execute Auto Tuning (Step Response method)" dialog
box is displayed.
6. Set the following items.
• Step Manipulated Variable
• Sampling Period
• Time-out Period
• Time-out Period After Maximum Slope
7. By clicking the "Start" button, auto tuning starts
8. The "Status of Auto Tuning" dialog box is displayed.
9. Execution status of auto tuning can be checked in the auto
tuning status display field located above the tuning trend
graph even after the "Auto Tuning" dialog box is closed.
7-55
7-55
7 MONITOR FUNCTION
MELSOFT
The following shows the timing chart for auto tuning by the Step Response method.
Normal End
Command type *
Monitor tool command
ON
Start
Stop/Reset alarm
CPU module response
The PLC CPU turns OFF.
OFF
Status
Start
Stop
Alarm
Occurred
Not occurred
OFF
ON
(AT in execution)
OFF
End with a halt by the Stop command
Command type *
Monitor tool command
ON
Start
Stop/Reset alarm
CPU module response
The PLC CPU turns OFF.
OFF
Status
Start
Stop
Alarm
Occurred
Not occurred
OFF
ON
OFF (Halt)
ON (AT in execution)
OFF
Abnormal end due to alarm occurrence
Command type *
Monitor tool command
ON
Start
Stop/Reset alarm
CPU module response
OFF
Status
Start
Stop
Alarm
Occurred
Not occurred
OFF
OFF (Halt)
ON
(AT in execution)
ON
(Alarm occurrence)
Reset alarm after abnormal end
Command type *
Monitor tool command
The PLC CPU turns OFF.
OFF
ON
Start
Stop/Reset alarm
CPU module response
Status
Start
Stop
Alarm
Occurred
Not occurred
ON
ON
(AT in execution)
ON
(Alarm occurrence)
OFF
(Alarm reset)
* Command type is used only when auto tuning by the Limit Cycle method by the tag type 2PIDH is executed.
7-56
7-56
7 MONITOR FUNCTION
MELSOFT
(2) An execution of auto tuning by the Limit Cycle method (only for the
2PIDH model)
BASIC OPERATION
1. Click the "Auto Tuning" button.
2. The "Select Auto Tuning Operations" dialog box is
displayed.
3. Select the radio button that says "Executes Auto Tuning by
the Limit Cycle method". (Only the 2PIDH type can select
this method.)
4. Click the "Next" button.
5. The "Execute Auto Tuning (Limit Cycle method)" dialog box
is displayed.
6. Set the following items.
• Improves the disturbance response
• Suppresses the overshoot when the setting value is
changed
• Using the Derivative Action (rapid response)
7. Click the "Details" button if needed.
8.
To the next page
7-57
Set the following tag data items.
• Output High Limit Value (AT2MVH)
• Output Low Limit Value (AT2MVL)
• Hysterisis (AT2HS)
• Time-out Period (AT1TOUT1)
9. Close the "Detail Setting of Limit Cycle method" dialog box
by clicking the "OK" button.
7-57
7 MONITOR FUNCTION
MELSOFT
10. Click the "Start" button to start auto tuning.
11. The "Status of Auto Tuning" dialog box is displayed.
12. Execution status of auto tuning can be checked in the
auto tuning status display field located above the tuning
trend graph even after the "Auto Tuning" dialog box is
closed.
7-58
7-58
7 MONITOR FUNCTION
MELSOFT
The following shows the timing chart for auto tuning by the Limit Cycle method.
Normal End
Monitor tool command
ON
Start
Stop/Reset alarm
CPU module response
The PLC CPU turns OFF.
ON
Command type *
Status
Start
Stop
Alarm
Occurred
Not occurred
OFF
ON
(AT in execution)
OFF
End with a halt by the Stop command
Monitor tool command
The PLC CPU turns OFF.
ON
Command type *
ON
Start
Stop/Reset alarm
CPU module response
Status
Start
Stop
Alarm
Occurred
Not occurred
ON
OFF (Halt)
ON (AT in execution)
OFF
Abnormal end due to alarm occurrence
ON
Command type *
Monitor tool command
ON
Start
Stop/Reset alarm
CPU module response
Status
Start
Stop
Alarm
Occurred
Not occurred
OFF
OFF (Halt)
ON
(AT in execution)
ON
(Alarm occurrence)
Reset alarm after abnormal end
Monitor tool command
ON
Start
Stop/Reset alarm
CPU module response
The PLC CPU turns OFF.
ON
Command type *
Status
Start
Stop
Alarm
Occurred
Not occurred
OFF
ON
ON
(AT in execution)
ON
(Alarm occurrence)
OFF
(Alarm reset)
* When the command type turns ON, the system ladder refers to ATTYPE value to determine auto tuning type.
7-59
7-59
7 MONITOR FUNCTION
MELSOFT
(3) Auto tuning status display
PURPOSE
Displays an execution status or alarm status of auto tuning.
BASIC OPERATION
1. Click the "Auto Tuning" button.
2. The "Select Auto Tuning Operations" dialog box is
displayed.
3. Select the radio button that says "Displays the status of
Auto Tuning".
4. Click the "Next" button.
5. The "Status of Auto Tuning" dialog box is displayed.
POINT
During execution of auto tuning, the "Select Auto Tuning Operations" dialog box
is not displayed. Instead, the "Status of Auto Tuning" dialog box is displayed.
7-60
7-60
7 MONITOR FUNCTION
MELSOFT
DISPLAY/SETTING SCREEN
1)
2)
3)
4)
5)
6)
7)
8)
9)
DISPLAY/SETTING DATA
The Status of Auto Tuning can be checked on the pop-up tuning screen or Auto
Tuning dialog box.
No.
1)
Item
Title bar
Description
Displays the tag name of auto tuning target.
Displays auto tuning method.
Display
2)
Method
Step Response method
Limit Cycle method
------
Operating method of auto tuning
Status that auto tuning is executed by the Step Response method
Status that auto tuning is executed by the Limit Cycle method
Status that the method is not decided
Displays the following depending on the status of auto tuning.
Status
3)
7-61
Display format
Display
Background color
Text color
Auto tuning in execution
Executing
Light blue
Black
Auto tuning not in execution
Executing
White
Gray
Auto tuning
7-61
7 MONITOR FUNCTION
No.
MELSOFT
Item
Description
Displays the status of each alarm in different background color text color.
Alarm status
Background color
Text color
Occurred
Red
Black
Not occurred
White
Gray
The following shows the alarms to be displayed in the alarm display field.
Alarm occurrence condition
Alarm
Step Response method
When either of the bit for input high limit alarm (PHA) or
input high high limit alarm (HHA) is ON in the alarm (ALM) items of the loop tag data
Input Low
Limit Alarm
When either of the bit for input low limit alarm (PLA) or
input low low limit alarm (LLA) is ON in the alarm (ALM) items of the loop tag data
T1 > MV High Limit Value (MH) in Step
Output High
Manipulated Variable (AT1STEPMV) for T1
Limit Alarm
= MV + AT1
4)
Alarm
Limit Cycle method
Input High
Limit Alarm
Output Low
Limit Alarm
Time-out
Operation
Mode
Alarms do not occur. *1
(Output value (MV) is controlled
below MV High Limit Value (MH).)
Alarms do not occur. *1
T1 < MV Low Limit Value (ML) in Step
Manipulated Variable (AT1STEPMV) for T1 (Output value (MV) is controlled above MV
= MV + AT1
Low Limit Value (ML).)
When the time from the start of auto tuning exceeds the time-out period (AT1TOUT1)
When the control mode (MODE) is other
than MANUAL mode
Response speed for calculation
R’ = Maximum slope value (%)/
Sampling period for AT1
Identification Response speed
R = |R’|/100(s-1)
When calculation result of above formulas
0
is R
• When the control mode (MODE) is
switched during auto tuning
• When auto tuning is executed in CASDR
mode
• ATTYPE < 0 or ATTYPE > 4
AT2MVL
• AT2MVH
When PID parameters cannot be
calculated
• Xc=AT2HS
• Calculation result PID parameters are
Gain > 999 and Integral Time/Derivative
Time > 9999
*1: With auto tuning by the Limit Cycle method, MHA, MLA, and DMLA of ALM tag are cancelled.
5)
Stop/Reset
Alarm
Stops auto tuning and resets an alarm.
6)
PID
parameters
display
Displays current PID parameters and PID parameters before auto tuning execution.
7)
Writes the original PID parameters to the PLC.
This button cannot be used in the following cases: (Invalid)
Restore PID
• In lock mode
parameters
• when the lockout tag is set
• auto tuning in execution
• when no PID parameters exist before auto tuning execution ("------" display)
8)
Back
Displays the previously displayed dialog box.
9)
Close
Closes a dialog box.
7-62
7-62
7 MONITOR FUNCTION
MELSOFT
7.7.6 Changing the display magnification
The display magnification of the tuning trend graph can be changed through the time
gridline intervals displayed on the screen and the Y-axis scale setting. The Y-axis scale
can display the high and low limits of the data. When closing the window, the change
will not be remembered, when restarting, the initial scale is displayed.
Button name
X-axis
Gridline interval
Y-axis
Y-axis scale
Description
Select the time intervals of the gridline; the initial value is 30 seconds.
(30 seconds,1 minute, 2 minutes, 5 minutes, 10 minutes, 20 minutes, 60 minutes)
Specify the display high and low values of each tag data item.
(1) Change the magnification of the X-axis
Selecting time intervals of the trend graph display can change the multiplying
power of the horizontal direction.
1. Click the "Gridline Interval" button on the top
of the screen.
2. The "Gridline Interval" dialog box is displayed.
3. Select the time intervals for splitting the
gridline.
4. Click the "OK" button.
5. Change the X-axis display magnification of
the trend graph.
After the gridline intervals are changed, when moving the trend cursor, the
minimum unit of the data that can be displayed is also changed. When the
gridline interval is 30 seconds, the values per 1 second are displayed. But when
the interval is 60 minutes, only the values per 2 minutes can be displayed.
The following table is the display units of each gridline interval.
Gridline interval
30 seconds
1 minute
2 minutes
5 minutes
10 minutes
20 minutes
60 minutes
Display units
1 second
2 seconds
4 seconds
10 seconds
20 seconds
40 seconds
2 minutes
POINT
Ctrl + mouse wheel scroll enables the gridline interval to be wider/narrower on the
tuning trend graph screen.
Ctrl + turn mouse wheel forward: wider the gridline Interval
Ctrl + turn mouse wheel backward: narrower the gridline Interval
7-63
7-63
7 MONITOR FUNCTION
MELSOFT
(2) Change the magnification of the Y-axis
1. Click the "Y-axis Scale" button on the top of
the screen.
2. The "Y-axis Scale" dialog box is displayed.
3. Specify the high and low limits of the
displayed data on the screen.
4. Click the "OK" button.
5. Change the Y-axis display magnification of the
tuning trend graph.
7.7.7 Collected tag list
Click the "Collected Tag List" button on the pop-up tuning screen, the collecting and
stopping tag lists are displayed on the dialog box.
Select the tag on the "Collected Tag List" dialog box. Click the "Change Display" button
and the specified tag is displayed on the pop-up tuning screen.
Now, on the "Collected Tag List" dialog box on the pop-up tuning screen, tags are
displayed at the option status.
POINT
The display status of the "Collected Tag List" dialog box is refreshed at the period of
1 second.
7-64
7-64
7 MONITOR FUNCTION
MELSOFT
7.7.8 Exporting to CSV file
Click the "Export to CSV File" button on the pop-up tuning screen, and the trend data
can be saved in the form of CSV in the files. When saving the data, the saving folder
and file name should be specified.
The following table is the output forms.
In the first line are titles that can show contents of the data. In the rest of the lines, the
collected data are output at the previous sequence of the date and time.
If restarting collection without clearing the data after collection stop, data indicating
invalid (row only commas) is inserted for 1 row between the stop and the restart.
POINT
A user who has the authority of operation for exporting data of pop-up tuning to
CSV file can save the trend data to the files.
7-65
7-65
7 MONITOR FUNCTION
MELSOFT
7.7.9 AT reflection target
A reflection target for parameters of the auto tuning result executed by upper loop of
HTCL tag can be selected.
1. Click the "Reflect of AT" button on the top of
the screen.
2. The "Reflect of AT" dialog box is displayed.
3. Select a reflection target.
4. Click the "OK" button.
5. The value of selected radio button is written
to the tag data item (PRM_SEL).
The following are the values written to the tag data items (PRM_SEL).
Reflection target
7-66
Value to be written to PRM_SEL
None
0
Heat
1
Cool
2
Both
3
7-66
7 MONITOR FUNCTION
MELSOFT
MEMO
7-67
7-67
8 OTHER FUNCTION
MELSOFT
8 OTHER FUNTION
8.1 Starting/Stopping Buzzer
PURPOSE
When there is an alarm or event, it makes the buzzer beep then stop it after
confirmation.
In the server/client monitoring system, when the buzzer beep is stopped on one
*1
OPS, the buzzer beep on monitor tools of all OPSs in the system can be
stopped. In this case, the buzzer beep can be stopped even on an OPS which is
in the lock mode.
*1: Including a secondary server in the redundant server system configuration.
BASIC OPERATION
1. Click the "Setting Window" button on the monitor toolbar. Through operating
[Option Setting]
[Alarm/Event] on the displayed setting window, the
situation whether the buzzer beeps and types of the beeping sound can be
set beforehand when there is an alarm and event. As long as it is not
changed, the registered buzzer sound setting is still valid even after the
monitor tool is restarted. For details, refer to "Chapter 9 SETTING".
2. When the buzzer is beeping, click the button "Stop Buzzer" on the monitor
toolbar to stop it after confirming the cause.
DISPLAY/SETTING SCREEN
Stop buzzer button
On occasion of alarm and event in monitoring, the monitor tool can make the
buzzer beep to notify administrator the errors.
There are 3 different settings for the buzzer according to the degree of the alarm
(Major alarm/Minor alarm/Event).
After the installation, if the setting is not changed, the buzzer will not beep.
Clicking the button on the monitor toolbar can stop the beeping buzzer.
Besides, the buzzer can automatically stop after a certain time. Beeping time
can be set with second as unit (the maximum setting: 99999 seconds = 27 hours
46 minutes and 39 seconds).
8
When the specified
time is over, the buzzer
automatically stops beeping.
The buzzer starts
to beep on occasion
of an alarm or event.
Click the "Stop buzzer"
button to stop the
buzzer beeping.
POINT
A user who does not have the authority of operation for stopping the buzzer
cannot click the button.
When the buzzer is not beeping, nothing will change even if the "Stop Buzzer"
button is clicked.
Besides the normal beep sound, the sound files (with WAV file as their
extension character) can be set as the buzzer sound as well.
Section 9.17 (2))
(
8-1
8-1
8 OTHER FUNCTION
MELSOFT
8.2 Print Screen
PURPOSE
Print the hard copy of the entire displayed desktop.
BASIC OPERATION
1. Click the button "Setting Window" on the monitor toolbar. Then on the
displayed screen, set the printer as the printing beforehand through operating
[General]
[Printer], if the printer is preset and normally
[Option Setting]
used, it needs not to be reset. For details, refer to "Chapter 9 SETTING".
2. Click the "Print Screen" button on the monitor toolbar to display the print
screen dialog box. Select the print color from Normal/Gray Scale/Invert/Invert
black and white, and click the "OK" button to print.
DISPLAY/SETTING SCREEN
Print Screen button
<Print Screen dialog box>
8
It will be printed on the printer that is set in the print setting of Option Setting
Section 9.17 (1)). If the printer name is not specified, then the
(General) (
default printer specified in the personal computer will be applied.
POINT
A user who does not have the authority of operation for copying the screen
cannot click the button.
Print Screen function prints not only the section related to the monitor tool, but
also the entire screen like its original appearance.
8-2
8-2
8 OTHER FUNCTION
MELSOFT
8.3 Screen Alignment
PURPOSE
Display the displayed windows after align them.
BASIC OPERATION
1. Click the "Setting Window" button on the monitor toolbar. Through operating
[General]
[Window mode] on the displayed setting
[Option Setting]
window, the window is changed to multi-window. As long as the setting is not
changed after registration, it is still valid even after the monitor tool is
restarted. If it is not changed after installation, it is the multi-window setting.
For details, refer to "Chapter 9 SETTING".
2. Click the button "Cascade" or "Tile" on the monitor toolbar to print.
DISPLAY/SETTING SCREEN
Screen alignment buttons
There are two kinds of screen alignment buttons.
Tile
button
Cascade
button
Cascade display
Tile display
One window is slightly cascaded on another window for alignment.
Screens are evenly divided. Windows are aligned when they are not
displayed in cascaded way.
<Cascaded screens>
<Tiled screens>
Other application windows can also be aligned even if they are not opened with the
monitor tool. The pop-up windows of the monitor tool cannot be aligned.
POINT
At the single-window mode, screens cannot be aligned (Buttons are not
displayed).
8-3
8-3
8 OTHER FUNCTION
MELSOFT
8.4 Find
PURPOSE
Find tags, control panel and trend graph.
When finding the target, display it after opening the window.
BASIC OPERATION
Click the "Find" button on the monitor toolbar to display the Find Dialog Box. It is
always displayed at the front position. After finding, the dialog box will not be
closed as long as the close button is not clicked. Therefore, the finding can be
continuously done.
DISPLAY/SETTING SCREEN
Find button
<Find dialog box>
POINT
When the setting window is opened, the find button cannot be clicked.
The finding cannot be done through wildcards.
8-4
8-4
8 OTHER FUNCTION
MELSOFT
(1) Find with tag names
Select the radio button of the tags, then input the tag names, click the find button.
When the searching target is found, it becomes the following.
(a) If the pop-up faceplate is not opened
Open the pop-up faceplate on which the tag data is displayed as the target.
(b) If the target pop-up faceplate has already been opened
This faceplate becomes active.
(c) If 4 pop-up faceplate screens have already been opened
The earliest opened (displayed in the bottom) one among them is
automatically closed and the pop-up faceplate that displays the target tag
data opens.
However, if it cannot be closed as displaying a dialog box, for example, one
next to the bottom is closed.
When finding only with the tag names, if there are any duplicated tags, the find
will be done in the priority sequence of the projects; If simply finding with the tag
names, the finding can be done with "project name: : tag name".
(2) Find with group names of the control panel
Select the control panel group by checking the radio button of the control panel.
Or input to the Combo box directly, and then click the find button.
When the target is found,
(a) In the case of multi-window mode
Newly open a control panel to display the corresponding group.
However, if 4 monitor windows (maximum) are already opened, a control
panel cannot be newly opened. Close the monitor window, and start the
operation.
(b) In the case of single-window mode
If no monitor window is opened, newly open a control panel to display the
corresponding groups.
If a monitor window has been opened, the window is automatically closed
and a control panel is newly opened to display the corresponding group.
8-5
8-5
8 OTHER FUNCTION
MELSOFT
(3) Find with group names of the trend graph
Select the radio button of the trend graph, select the trend graph group, or
directly input to the Combo box, then click the find button.
When finding the target,
(a) In the case of multi-window mode
Newly open a trend graph to display the corresponding group.
However, if 4 monitor windows (maximum) are already opened, a trend
graph cannot be newly opened. Close the monitor window, and start the
operation.
(b) In the case of single-window mode
If no monitor window is opened, newly open a trend graph to display the
corresponding groups.
If a monitor window has been opened, the window is automatically closed
and a trend graph is newly opened to display the corresponding group.
For details of window modes, refer to "Section 6.4.2 Display form of monitor
window".
8-6
8-6
8 OTHER FUNCTION
MELSOFT
8.5 Displaying the PLC Communication Status
8.5.1 Displaying the communication status
PURPOSE
To check the communication between monitor tool and CPU module for each
project.
BASIC OPERATION
1. Click the "Help Menu" button (
) on the monitor toolbar.
2. Select "PLC Communication Status" on the displayed Help Menu.
3. Click the << Status >> tab.
DISPLAY/SETTING SCREEN
2)
3)
4)
5)
6)
7)
1)
8)
9)
DISPLAY/SETTING DATA
No.
Item
Description
1)
Title bar
PLC Communication Status" is displayed when connecting with CPU module,
"
"
PLC Communication Status: [Simulation]" is displayed when a project in which the
Section 9.4)
settings to be connected to simulator exists. (
2)
Project Name
Display the target name of monitor target.
Execute the setting of monitoring target project through monitor target project setting
(
Section 9.4).
8-7
8-7
8 OTHER FUNCTION
No.
MELSOFT
Item
Description
Display the communication condition between monitor tool and the CPU module
specified in "Transfer Setup" screen.
Display
3)
Explanation
Text color
Normal
Data communication is normal
Black
Abnormal
Data communication is abnormal or "Invalid Simulator Version"
system alarm occurs when connecting with Simulator.
Red
--------
Section 9.4)
• The PLC connection target is not set. (
• The assignment information database file which is not supported
is specified in a monitor target project
• Improper file is specified in a assignment information database file
of the monitor target project
• The project which is set not to be connected to simulator during
simulation*1 of monitor tool
Black
Status
2
Current
Value
4)
Response
Time [S]
5)
6)
Maximum
2
Value *
Number of event
notification received
2
*
Display the time from read request of low-speed tag data collecting * to data receiving.
However, "
" is displayed for the following situations.
The system alarm "Incorrect PLC type" occurs
The communication status is error or "
" is displayed
Display maximum response time of 3) above.
However, "
" is displayed for the following situations.
The system alarm "Incorrect PLC type" occurs
The communication status "
" is displayed
Communication error occurred in initial communication with PLC (when starting
monitor tool, re-reading with the monitor target project setting), has not restore the
communication error yet.
3
Display the times of event notification * received by CPU module.
Display range is 0 to 999999.
If it exceeds 999999, it returns to 0.
If a communication error occurs during communication condition display, the previous
value of the number of event notification received is kept displayed. In any of the
following cases, however, "
" is displayed for the following situations.
The system alarm "Incorrect PLC type" occurs
The PLC connection target is not set. (
Section 9.4)
The PLC connection target is Serial, USB, CC-Link, or GOT transparent (
Section 9.4)
The following two set network types are different.
1) PLC connection target of monitor tool
2) Event notification destination set on the <<Event Notification>> tab in the project
parameter setting of the programming tool.
A communication error occurred (cable break, etc.)
When performing a monitor tool in a PC CPU, the monitor tool is connected to PLC
CPU with MELSECNET/10(H).
The transfer setup is set to "CC-Link IE Controller Network" and the version of the
driver (SW1DNC-MNETG-B) is earlier than 1.08J.
*1
The project which is set not to be connected to simulator during simulation of monitor
tool
*1: The monitor tool will be in simulation when more than one project is set to perform simulator connection in
Section 9.4)
the monitor target project setting. (
Section 9.4).
*2: It will be reset after starting monitor tool or executing monitor target project setting (
*3: For details, refer to Appendix 1.2.
8-8
8-8
8 OTHER FUNCTION
No.
MELSOFT
Item
7)
Number of readings
retried
8)
"Reset" button
Description
Display the number of retry times of device data read processing from CPU module.
Display range is 0 to 999999.
If it exceeds 999999, it returns to 0.
However, "
" is displayed for the following situations.
The system alarm "Incorrect PLC type" occurs
The PLC connection target is not set. (
Section 9.4)
The assignment information database file which is not supported is specified in a
monitor target project
Improper file is specified in a assignment information database file of the monitor
target project
Communication error occurs straight after starting the monitor tool or re-reading a
monitor target project
1
The project which is set not to be connected to simulator during simulation* of
monitor tool
Click the button to reset the following items.
Response Time[s] (Maximum Value)
Number of event notification received
Number of readings retried
A user who has the authority of operation for resetting the maximum value/number of
times can reset.
Change the mode to the engineer mode or operator mode.
9)
"Close" button
Click the button to close communication condition screen.
*1: The monitor tool will be in simulation when more than one project is set to perform simulator connection in
Section 9.4)
the monitor target project setting. (
POINT
If the Setting Window button of monitor toolbar is clicked when displaying
communication condition screen, communication condition screen will be
closed automatically.
Additionally, if Setting Window has been displayed, the communication
condition screen cannot be opened.
If all of the status, response time and number of event notification are
", check the assignment information database file set in
displayed as "
monitor target project setting. (
Section 9.4)
8-9
8-9
8 OTHER FUNCTION
MELSOFT
8.5.2 Displaying the redundant system status
PURPOSE
To check the redundant system status for each project.
BASIC OPERATION
1. Click the "Help Menu" button (
) on the monitor toolbar.
2. Select "PLC Communication Status" on the displayed Help Menu.
3. Click the << Redundant System Status >> tab.
DISPLAY/SETTING SCREEN
2)
3)
4)
5)
1)
6)
DISPLAY/SETTING DATA
No.
Item
Description
1)
Title bar
"
PLC Communication Status" is displayed when connecting with CPU module,
"
PLC Communication Status: [Simulation]" is displayed when a project in which the
Section 9.4)
settings to be connected to simulator exists. (
2)
Project Name
Display the project name of monitor target.
Execute the setting of monitoring target project through monitor target project setting
(
Section 9.4).
8-10
8-10
8 OTHER FUNCTION
No.
MELSOFT
Item
Description
Display the communication conditions of system A and system B, and control/standby
system status.
Process CPU
Nothing is displayed in the gray background.
Redundant CPU
Backup mode/Separate mode
Normal
3)
4)
Status
Target System
Error
Message:
• When SM1516 is OFF
"Normal (Control System) "
• When SM1516 is ON
"Normal (Standby System) "
• When both SM1515 and SM1516 are OFF or ON
"Normal (Unknown) "
Message color: Black
Message: "Abnormal" Message color: Red
Debug mode
For system A,
the same as
described in left
section.
For system B,
"-----" is displayed
in black.
When the redundant system PLC parameter read error occurs, both system A/B) are
displayed as "Abnormal".
However, "
" is displayed for the following situations.
The system alarm "Incorrect PLC type" occurs
The PLC connection target is not set. (
Section 9.4)
The assignment information database file which is not supported is specified in a
monitor target project
Improper file is specified in a assignment information database file of the monitor
target project
When the system (system A/ B) cannot be specified
1
The project which is set not to be connected to simulator during simulation* of
monitor tool
Displays the redundant PLC specify in "Connection Setup".
However, "
" is displayed for the following situations.
Section 9.4)
The PLC connection target is not set. (
The assignment information database file which is not supported is specified in a
monitor target project
Improper file is specified in a assignment information database file of the monitor
target project
1
The project which is set not to be connected to simulator during simulation* of
monitor tool
When Process CPU is specified, nothing is displayed in the gray background.
"Not Specified" is displayed for the project which is set to be connected to simulator.
5)
Operation Mode
Displays the operation mode (Separate mode/Backup mode/Debug mode).
If a communication error occurs, the previous value is displayed.
However, "
" is displayed as communication status.
When Process CPU is specified, nothing is displayed in the gray background.
"Debug Mode" is displayed for the project which is set to be connected to simulator.
6)
"Close" button
Click the button to close the communication condition screen.
*1: The monitor tool will be in simulation when more than one project is set to perform simulator connection in
Section 9.4).
the monitor target project setting (
POINT
If "Setting window" button of monitor toolbar is clicked when the communication
condition screen is displayed, the screen will be automatically closed.
In addition, if the setting screen has been already opened, the communication
condition screen cannot be opened.
8-11
8-11
8 OTHER FUNCTION
MELSOFT
8.5.3 Collection period for each communication type
PURPOSE
To specify the collection period of each communication type of monitor tool and
CPU module.
<<High-speed Collection Period>> tab and <<Low-speed Collection Period>> tab
are displayed depending on the collection period.
BASIC OPERATION
1. Click "Help Menu" button (
) on the monitor toolbar.
2. Select "PLC Communication Status" on the displayed Help Menu.
3. Click << High-speed Collection Period>> tab or <<Low-speed Collection
Period>> tab.
DISPLAY/SETTING SCREEN
3)
2)
1)
4)
5)
<<High-speed Collection Period>> tab
<<Low-speed Collection Period>> tab
DISPLAY/SETTING DATA
No.
Item
1)
Title bar
2)
Project Name
Description
PLC Communication Status" is displayed when connecting with CPU module,
"
"
PLC Communication Status: [Simulation]" is displayed when a project in which the
Section 9.4)
settings to be connected to simulator exists. (
Display the target name of monitor target.
Execute the setting of monitoring target project through monitor target project setting
(
8-12
Section 9.4).
8-12
8 OTHER FUNCTION
MELSOFT
DISPLAY/SETTING DATA
No.
Item
Description
Display the current value of the collection period of each communication
type. (unit: second)
Collection
" is displayed for the following situations.
However, "
The system alarm "Incorrect PLC type" occurs
The PLC connection target is not set. (
Section 9.4)
The assignment information database file which is not supported is
specified in a monitor target project
Improper file is specified in a assignment information database file of the
monitor target project
Communication status error
The project which is set not to be connected to simulator during
1
simulation* of monitor tool
Period for Each
Display the maximum value of the collection period of each communication
Communication
type. (unit: second)
Current Value
Current Value
and Maximum
Value of
3)
2
Type *
Maximum Value
However, "
" is displayed for the following situations.
The system alarm "Incorrect PLC type" occurs
The PLC connection target is not set. (
Section 9.4)
The assignment information database file which is not supported is
specified in a monitor target project
Improper file is specified in a assignment information database file of the
monitor target project
The project which is set not to be connected to simulator during
1
simulation* of monitor tool
Click the button to reset the maximum value of collection period.
4)
A user who has the authority of operation for resetting the maximum
"Reset" button
value/number of times can reset.
Also, reset cannot be done during change mode dialog box.
5)
"Close" button
Click the button to close the communication status screen.
*1: The monitor tool will be in simulation when more than one project is set to perform simulator connection in
Section 9.4).
the monitor target project setting (
*2: For details, refer to Appendix 1.1.
POINT
If collection is performed behind the set period, take the measure by referring to
Appendix 1.10.
If "Setting window" button of monitor toolbar is clicked when the communication
condition screen is displayed, the screen will be automatically closed.
If the setting screen has been already opened, the communication condition
screen cannot be opened.
8-13
8-13
8 OTHER FUNCTION
MELSOFT
8.6 Server/Client Monitoring System
8.6.1 Setting data in the secondary server/clients
(1) Setting data in a secondary server
A secondary server starts up reading the setting data from a primary server so
that when the primary server fails and clients connect to the secondary server,
the clients can display the monitor screen having the same configuration as when
clients connect to the primary server previously.
[When a secondary server is started up]
1) A secondary server is started up.
2) The setting data is copied from the primary server to the secondary
server.
Secondary server
Setting data item
Ethernet
Setting data
Primary server
Data description to be copied
Data contents to be copied are different depending
on the "detail setting of overwriting the setting data"
in the monitor tool execution type setting
Setting items customizable (
Section 9.5).
in a secondary server
Overwrite all
(Items described as
The setting data in a server is copied to the
setting data in a secondary server. However, the
(changeable) in "Change in
setting data in the monitor tool execution type
a secondary server" in
setting is not copied.
Section 3.2)
Leave settings inherent in this OPS
Items set to leave the setting inherent in a
secondary server are not changed.
Common setting items
The setting data in a primary server is always
(Items not mentioned above) copied to the setting data in a secondary server.
[When the setting data in a secondary server is changed]
1) The setting data in a secondary server is changed.
Setting data item
Setting items customizable in
a secondary server
(Items described as
(changeable) in "Change in a
secondary server" in Section
3.2)
Common setting items
(Items not mentioned above)
Secondary server
Setting data
Data description to be copied
The setting data which has been copied to a
secondary server is changed.
The setting data cannot be changed in a
secondary server.
[When the setting data in a primary server is changed]
Secondary server
1) The setting data in a primary server is changed.
2) The setting data change is notified from the primary server to a
secondary server.
3) A message is displayed in the secondary server and the setting data
is automatically copied (refer to 2) in [When a secondary server is
started up] of this section) from the primary server to the secondary
server.
Ethernet
Primary server
Setting data
POINT
If neither setting screen nor monitor screen is opened on a secondary server when
the setting data is changed on a primary server, the secondary server copies the
setting data from the primary server automatically.
8-14
8-14
8 OTHER FUNCTION
MELSOFT
(2) Setting data in clients
In a client, starting up with loading the setting data configured in a server enables
to display monitor screens with the same configuration as the server.
Customizable settings (the monitor tool execution type setting, settings to
customize displays, and settings depending on environment of a personal
computer (client)) can be changed in a client.
[When a client is started up]
1) A client is started up.
2) The setting data is automatically copied from the server to the client.
Clients
Setting data item
Setting data Setting data Setting data
Ethernet
Setting data
Server
Data description to be copied
Data contents to be copied are different depending
on the "detail setting of overwriting the setting data"
in the monitor tool execution type setting
Section 9.5).
Setting items customizable (
Overwrite all
in clients
The setting data in a server is copied to the
(Items described as
setting data in a client. However, the setting data
(changeable) in "Change in
in the monitor tool execution type setting is not
clients" in Section 3.2)
copied.
Leave settings inherent in this OPS
Items set to leave the setting inherent in a client
are not changed.
Common setting items
The setting data in a server is always copied to the
(Items not mentioned above) setting data in a client.
[When the setting data in a client is changed]
1) The setting data in a client is changed.
Clients
Setting data item
Data description to be copied
Setting items customizable in
clients
The setting data which has been copied to a
(Items described as
client is changed.
(changeable) in "Change in
clients" in Section 3.2)
Common setting items
The setting data cannot be changed in a client.
(Items not mentioned above)
Setting data
[When the setting data in a server is changed]
Clients
1) The setting data in a server is changed.
2) The setting data change is notified from the server to a client.
3) A message is displayed in the client and the setting data is
automatically copied (refer to 2) in [When a client is started up] of this
section) from the server to the client.
Ethernet
Server
Setting data
POINT
If neither setting screen nor monitor screen is opened on a client when the setting
data is changed on a server, the client copies the setting data from the server
automatically.
8-15
8-15
8 OTHER FUNCTION
MELSOFT
8.6.2 Procedure for copying the setting data
Load the setting data automatically/manually from a server when the setting data is
changed in the server during the secondary server/client execution.
Start
The setting data is changed
in a server during the client
execution.
Click the "No" button.
Click the "Yes" button.
If the following message is displayed in the client,
load the setting data manually.
The setting data is
automatically loaded.
Execute "Acquire Server Setting Data" from the help menu.
(
Section 8.6.5)
Click the "Yes" button.
The processing dialog box is displayed and the message
"Receiving the setting data..." and "Reading the setting data..."
is displayed depending on progress.
Finish
8-16
8-16
8 OTHER FUNCTION
MELSOFT
8.6.3 Switching server
PURPOSE
The server to be connecting can be switched with clients when [Details]"Redundant Server" is activated in the monitor tool execution type setting
Section 9.5).
(
BASIC OPERATION
1. Click "Help Menu" button (
) on the monitor toolbar.
2. Select "Switch Server" on the displayed Help Menu to display the Switch
Server dialog box.
3. Select the server to switch to, and click the "OK" button.
DISPLAY/SETTING SCREEN
1)
2)
3)
DISPLAY/SETTING DATA
No.
Item
Description
1)
Server to switch
Select the server to switch to, either Primary Server or Secondary Server.
2)
"OK" button
Click the button to close the dialog box and start the switch server process.
3)
"Cancel" button
Click the button to close the dialog box and cancel the switch server process.
POINT
When the current user does not exist or the current user has been modified in the
data acquired from a new server after switching server, the monitor tool mode
switches to the lock mode automatically.
8-17
8-17
8 OTHER FUNCTION
MELSOFT
8.6.4 Connecting to server
PURPOSE
When a secondary server is not connected to a primary server or when a client is
not connected to a server in a non-redundant server system, they can be
connected to the servers manually.
BASIC OPERATION
1. Click "Help Menu" button (
) on the monitor toolbar.
2. A secondary server connects to a primary server and a client connects to a
server by selecting “Connect Server” on the displayed Help Menu.
POINT
When the current user does not exist or the current user has been modified in the
data acquired from a new server after connecting to server, the monitor tool mode
switches to the lock mode automatically.
8.6.5 Acquiring the server setting data
PURPOSE
In the server/client monitoring system, clients and a secondary server read the
1
setting data from a server* being connected in the following cases.
The setting data are changed on a server being connected while the client is
running.
The setting data are changed on a primary server being connected while the
secondary server is running.
*1: A secondary server connects to a primary server.
In addition, the setting data can manually be acquired when the message box
Section 8.6.2), which is displayed on a secondary server/client when the
(
setting data are changed on a server, is closed by clicking the “No” or “Cancel”
button.
BASIC OPERATION
1. Click "Help Menu" button (
) on the monitor toolbar.
2. Select "Acquire Server Setting Data" on the displayed Help Menu.
8-18
8-18
8 OTHER FUNCTION
MELSOFT
8.6.6 Time adjustment among OPSs
In the server/client monitoring system, client time is synchronized with the server time.
In the redundant server system, time of the secondary server is synchronized with one
of the primary server. The time adjustment among OPSs is executed when "Time
Adjustment among OPSs" on Option Setting of client/secondary server is "Yes".
Time adjustment is automatically made at the following timing.
Secondary server start up (in the redundant server configuration)
Client start up
Once every hour (5 minutes 0 second past the hour)
Server time adjustment
POINT
Setting "Time Adjustment among OPSs" to “Yes” on Option Setting is
recommended. Set to "No" only when another time adjustment system such as
SNTP is applied.
Use the following combination of settings to avoid the time adjustment among
OPSs in client/secondary server.
Set the Time Adjustment among OPSs setting to “Enable” in setting data
acquisition on Detail setting of overwriting the setting data of Monitor Tool
Execution Type Setting.
Set to "No" on "Time Adjustment among OPSs" of Option Setting.
Log on to a personal computer using an account belonging to Administrators
group with all rights to control whole the computer, and execute the monitor
tool.
When executing a secondary server or client, select "Run this program as an
administrator" under "Privilege Level" of the monitor tool and execute it.
The time data is sent from a server (primary) to a secondary server and
clients, and delays of less than 1 second may occur due to network loads.
8-19
8-19
8 OTHER FUNCTION
MELSOFT
8.6.7 Displaying the server/client communication status
PURPOSE
In the server/client monitoring system, to check the communication status between
a server and clients in the monitor tool server.
BASIC OPERATION
1. Click "Help Menu" button (
) on the monitor toolbar.
2. Select "Server/Client Communication Status" on the displayed Help Menu.
DISPLAY/SETTING SCREEN
1)
2)
3)
4)
In a secondary server,
the same contents as in a primary server are displayed.
<Running as Primary Server>
5)
<Running as Server (non-redundant)>
DISPLAY/SETTING DATA
No.
1)
2)
Item
OPS Name
Communication
Status
3)
Response Time [s]
4)
Number of bytes
sent
5)
"Close" button
8-20
Description
Display the secondary server name when the monitor tool is executed as Primary
Server or display the primary server name when it is executed as Secondary Server,
followed by the OPS names registered in the OPS setting (
Section 9.5) in a server
in order from Client 1 to Client 16.
Lines not registered in the OPS setting remain blank.
Display the communication status between a server and clients.
Lines not registered in the OPS setting remain blank.
Display
Explanation
Not connected Not connected to the client.
Connecting
Connecting to the client.
Connection from the client is not acceptable
due to the following reasons.
Conversion from a host name to an IP
address is failed.
As a result of conversion from a host
name to an IP address, the IP address
overlaps with an IP address of another
OPS.
Character color
Red
Black
Black
Display the response time of the communication with clients. (unit: second)
Lines not registered in the OPS setting remain blank.
However, this is not displayed when the communication status is "Not connected".
("
" is displayed.)
Display the data volume per second sent to clients. (unit: byte)
Lines not registered in the OPS setting remain blank.
However, this is not displayed when the communication status is "Not connected".
" is displayed.)
("
Click the button to close the communication status screen.
8-20
8 OTHER FUNCTION
MELSOFT
8.7 Automatic CSV File Export
PURPOSE
To output trend, alarm and event data to CSV files automatically.
Used when it is desired to save trend, alarm and event data in CSV files
automatically as histories.
(1) Functions related to automatic CSV file export
(a) Automatic trend CSV file export (
Section 8.7.1)
Trend data are output to CSV files automatically.
(b) Automatic alarm CSV file export (
Section 8.7.2)
Alarm data are output to CSV files automatically.
(c) Automatic event CSV file export (
Section 8.7.3)
Event data are output to CSV files automatically.
(d) Automatic CSV file deletion (
Section 8.7.4)
CSV files output automatically are deleted automatically when the storage
period has passed.
(e) Disk free space check (
Section 8.7.5)
When the free space of the disk drive that stores the PX Developer
installation destination, trend binary data file, and CSV files output
automatically has decreased to or below the preset value, the alarm
indicates a shortage of the free space of the disk drive.
(2) Setting items related to automatic CSV file export
The following table indicates the setting items related to automatic trend CSV file
export, automatic alarm CSV file export and automatic event CSV file export.
Setting item
8-21
Setting position
Reference
Trend setting
Automatic CSV file export
Section 9.8
Option setting (General)
Automatic CSV file deletion time (0 to 23)
Disk free space check size (MB)
Section 9.17 (1)
Option setting (Alarm/Event)
Automatic alarm CSV file export
Automatic alarm CSV file deletion
Alarm CSV file storage period (days)
Automatic alarm CSV file export target folder
Automatic event CSV file export
Automatic event CSV file deletion
Event CSV file storage period (days)
Automatic event CSV file export target folder
Section 9.17 (2)
Option setting (Trend graph)
Automatic trend CSV file export target folder
Automatic trend CSV file export file name
Automatic trend CSV file export time (0 to 23)
Automatic trend CSV file deletion
Trend CSV file storage period (days)
Section 9.17 (4)
8-21
8 OTHER FUNCTION
MELSOFT
(3) Automatic CSV file export setting procedure
BASIC OPERATION
1. The monitor tool can be set in the engineer mode only.
Section 4.5)
When the mode is not the engineer mode, change mode (
to the engineer mode.
2. Click the "Setting Window" button on the monitor toolbar.
The setting window is displayed.
3. Set the automatic CSV file export target folder, whether to include a group
name in an export file name, automatic CSV file deletion (Enable/Disable),
automatic CSV file export time (automatic trend CSV file export only), and
storage period (CSV file storage period when automatic CSV file deletion is
executed).
The setting positions are as indicated below.
After setting, click the "Apply" button.
Used function
Automatic trend CSV file export
Setting item
Option setting
(Trend graph)
Automatic alarm CSV file export
Option setting
(Alarm/Event)
Automatic event CSV file export
Setting position
Automatic trend CSV file export target folder
Automatic trend CSV file export file name
Automatic trend CSV file export time (0 to 23)
Automatic trend CSV file deletion
Trend CSV file storage period (days)
Automatic alarm CSV file deletion
Alarm CSV file storage period (days)
Automatic alarm CSV file export target folder
Automatic event CSV file deletion
Event CSV file storage period (days)
Automatic event CSV file export target folder
4. When Automatic CSV file deletion is set to "Enable" in above 3., set the time
for deleting CSV files automatically.
In Option setting (general), set the "Automatic CSV file deletion time (0 to
23)".
Click the "Apply" button.
5. In Option setting (general), set the "Disk free space check size (MB)."
Click the "Apply" button.
6. Set Automatic CSV file export to "Enable".
The setting positions are as indicated below.
After setting, click the "Apply" button.
Automatic CSV file export starts.
Used function
8-22
Setting item
Setting position
Automatic trend CSV file export
Trend setting
Automatic CSV file export (set to each group)
Automatic alarm CSV file export
Option setting
Automatic alarm CSV file export
Automatic event CSV file export
(Alarm/Event)
Automatic event CSV file export
8-22
8 OTHER FUNCTION
MELSOFT
DISPLAY/SETTING SCREEN
Trend Setting
Option Setting (General)
Option Setting (Alarm/Event)
Option Setting (Trend Graph)
POINT
Set the automatic trend CSV file export time and automatic CSV file deletion time to
the time when the monitor tool is running.
If the monitor tool has not yet started at the automatic trend CSV file export time,
CSV files not yet exported are output at the next monitor tool start.
8-23
8-23
8 OTHER FUNCTION
MELSOFT
8.7.1 Automatic trend CSV file export
This section explains the timing, storage destination, output form, precautions, etc. of
automatic trend CSV file export.
(1) Timing and data range of automatic trend CSV file export
The timing of automatic trend CSV file export is as indicated below depending on
Section 9.8) of trend data.
the sampling period (
Sampling Period
1s
10s
CSV Files Export timing
Output per hour (0 min every hour).
1min
Output per day.
5min
The CSV files export time is as set to "Automatic trend CSV
10min
file export time (0 to 23)" in Option setting (Trend graph).
Range of Data Output to 1 File
Trend data of past one hour
1
Trend data of past one day *
*1: The automatic trend CSV file output per day is the data between 0:00:00 to
23:59:59 of the previous day.
<Output CSV file>
Date, TAG001.MLL, TAG001.MV, TAG001.SV, TAG001.MODE,,,,
6/1/2003 0:00:00 AM, 0, 66.9, 450.0, H0010,,,,
6/1/2003 0:01:00 AM, 0, 66.9, 450.0, H0010,,,,
6/1/2003 23:58:00 PM, 0, 53.9, 450.0, H0010,,,,
6/1/2003 23:59:00 PM, 0, 53.9, 450.0, H0010,,,,
The output data are those between 0:00:00 to 23:59:59 of the previous day,
regardless of the automatic trend CSV file export time (0 to 23).
8-24
8-24
8 OTHER FUNCTION
MELSOFT
POINT
If the monitor tool has not yet started at the time of automatic CSV file export, the
automatic trend CSV file is output at the next start of the monitor tool.
Automatic trend CSV file export at a monitor tool start outputs the data of the
preceding file.
Automatic trend CSV file 1)
(Data between 0:00:00 to 23:59:59) Automatic trend CSV file 2)
Monitor tool already started
Monitor tool not Monitor tool already started
started
Time
Automatic CSV file export time
(CSV file cannot be output since
monitor tool has not yet started.)
Automatic trend CSV file 1) is output at start
of monitor tool, as it could not be output at the
previous export time.
When the "Automatic trend CSV file export time (0 to 23)" setting in Option
setting (Trend Graph) is changed to before the current time, the timing of trend
CSV file export changes as described below.
(a) When the output of the data for this day's output is completed
The automatic trend CSV file is output at the new automatic trend CSV file
export time, starting with the data for the next output (next day).
(b) When the output of the data for this day's output is not completed
The automatic trend CSV file for this day's output is output immediately after
the setting is changed.
For example, when the current time is 10:30:00, July 10 and the "Automatic
trend CSV file export time (0 to 23)" setting is changed to 8 o'clock, the data
at 00:00:00 to 23:59:59, July 9 is output.
8-25
8-25
8 OTHER FUNCTION
MELSOFT
(2) Output destination and file name of automatic trend CSV file
(a) Output destination of automatic trend CSV file
An automatic trend CSV file is output to the folder set to "Automatic trend
CSV file export target folder" in Option setting (Trend graph).
When the above setting has not been made, however, the file is output to
the "TrendCSV" folder indicated in Section 2.3.
(b) File name of trend CSV file to be output automatically
One automatic trend CSV file is created for one group.
The file name of the CSV file to be output automatically changes as shown
Section 9.8)
below depending on the sampling period of trend data (
Section 9.17 (4))
and "Automatic Trend CSV File Export File Name" (
in the option setting (trend graph).
Sampling Period
File Name
When "Do not include Group Name" is selected
TrendGroup(trend group No.)_(storage date)_(time).CSV
The format of the file name is as shown below.
TrendGroup003_20030601_09.CSV
Time (2 digits)
Storage date
Format is "YYYYMMDD".
(YYYY: Year in 4 digits, MM: Month in 2
digits, DD: Day in 2 digits)
1s
10s
Trend group No. (3 digits)
"TrendGroup" (Fixed to character string)
When "Include Group Name" is selected
(Group name)_(trend group No.)_(storage date)_(time).CSV
The "storage date" and "time" are those of the data output to the automatic trend CSV file.
(Example) When the trend group No. is 3, the group name is Device A, and the range of
the data output to the automatic trend CSV file is 9:00:00 to 9:59:59 on June 1,
2003
"Do not include Group Name" : "TrendGroup003_20030601_09.CSV"
"Include Group Name"
: "Device A_003_20030601_09.CSV"
When "Do not include Group Name" is selected
TrendGroup(trend group No.)_(storage date).CSV
The format of the file name is as shown below.
TrendGroup005_20030603.CSV
Storage date
Format is "YYYYMMDD".
(YYYY: Year in 4 digits, MM: Month in 2
digits, DD: Day in 2 digits)
1min
5min
10min
Trend group No. (3 digits)
"TrendGroup" (Fixed to character string)
When "Include Group Name" is selected
(Group name)_(trend group No.)_(storage date).CSV
The "storage date" is that of the data output to the automatic trend CSV file.
(Example) When the trend group No. is 5, the group name is Device A, and the range of
the data output to the automatic trend CSV file is 0:00:00 to 23:59:59 on June 3,
2003
"Do not include Group Name" : "TrendGroup005_20030603.CSV"
"Include Group Name"
: "Device A_005_20030603.CSV
8-26
8-26
8 OTHER FUNCTION
MELSOFT
POINT
When the automatic trend CSV file export target folder is changed during
automatic CSV file export, the setting change is reflected on the automatic
export processing in the next period.
The free space of the disk drive that includes the PX Developer installation
destination, trend binary data storage folder and automatic CSV file export target
folder is monitored according to the "Disk free space check size (MB)" in Option
setting (general).
When automatic trend CSV files are saved including group names, if the trend
group name is changed, CSV files that were output before the change cannot
be displayed on the trend graph.
(3) Output form of automatic trend CSV file
The output form of an automatic trend CSV file is the same as that of the CSV
output of a trend graph.
For details of the CSV output of a trend graph, refer to Section 7.2.6.
POINT
When no trend data exist, no characters are output to the value of item.
Collection of trend data started at 9:46:49
Trend data collection start
9:00:00
9:46:49
9:59:59
<Output CSV file>
Date, TAG001.MLL, TAG001.MV, TAG001.SV, TAG001.MODE,,,,
6/1/2003 9:00:00 AM,,,,,,,,
6/1/2003 9:00:01 AM,,,,,,,,
Trend data do not exist in this area.
(Only dates and times are output.)
6/1/2003 9:46:47 AM,,,,,,,,
6/1/2003 9:46:48 AM,,,,,,,,
6/1/2003 9:46:49 AM, 0, 66.9, 450.0, H0010,,,,
6/1/2003 9:46:50 AM, 0, 66.9, 450.0, H0010,,,,
Trend data
collection start
6/1/2003 9:59:58 AM, 0, 53.9, 450.0, H0010,,,,
6/1/2003 9:59:59 AM, 0, 53.9, 450.0, H0010,,,,
8-27
8-27
8 OTHER FUNCTION
MELSOFT
(4) Error processing
An error may occur during file processing due to the insufficient disk free space
at the time of CSV files export.
Section 7.3.1) occurs.
In this case, the system alarm "file error" (
When the file error occurs, the CSV file is not output.
The CSV file that could not be output will be output at either of the following
timings.
Output timing of automatic trend CSV file after recovery from file error
File error
occurrence
File error occurring
Recovery from
file error
Output timing of
automatic CSV file
Output at output timing of automatic CSV
file after recovery from file error
When monitor tool is started next time
The output timing is the same as when the monitor tool has not started at
the time set for exporting CSV file automatically.
For details, refer to POINT in (1) in this section.
POINT
If automatic trend CSV file export could not be performed due to a file error, etc., the
file that could not be output will also be output together at the next export time.
Only the data of the preceding file is output as the data that could not be output by
automatic trend CSV export.
In the case of the trend data whose sampling period is 1 s
(When automatic trend CSV file export is performed at 0 minutes every hour)
File error
occurrence
Output timing of
automatic CSV file
9 :00
10:00
File error occurring
11:00
12:00
Recovery from
file error
13:00
14 :00
Data output at 13:00 and 14:00 are output together.
Only the data of the preceding file is output as the
data that could not be output by trend CSV file export.
(In this example, only the data output at 13:00)
8-28
8-28
8 OTHER FUNCTION
MELSOFT
8.7.2 Automatic alarm CSV file export
This section explains the timing, storage destination, output form, precautions, etc. of
automatic alarm CSV file export.
(1) Timing and data range of automatic alarm CSV file export
The alarm data is output to a CSV file at alarm occurrence/recovery.
The data of one day are output to one alarm CSV file.
Hence, when the date changes, the output destination file of the automatic alarm
CSV file data changes.
POINT
If the alarm is cleared, i.e., alarm recovery is made by taking either of the following
actions, the alarm recovery date will not be output to the automatic alarm CSV file,
while the date will be stored and displayed in the alarm list.
Restart the monitor tool, or click the "Apply" or "Reload" button in the monitor
Section 9.4) to clear all the alarms.
target project setting (
(Except the following system alarm errors: file error, memory error and exception
error.)
Check the check box within the Confirm field to clear the alarm.
(Except the following system alarm errors: file error, memory error and exception
error.)
(2) Output destination and file name of automatic alarm CSV file
(a) Output destination of automatic alarm CSV file
An automatic alarm CSV file is output to the folder set to "Automatic alarm
CSV file export target folder" in Option setting (alarm/event).
When the above setting has not been made, however, the file is output to
the "AlarmCSV" folder indicated in Section 2.3.
(b) File name of alarm CSV file to be output automatically
One automatic alarm CSV file is created a day.
Hence, naming of the CSV file to be output automatically is as described
below.
File name
Alarm_(Storage date).CSV
The file name format is as indicated below.
Alarm_20030601.CSV
Storage date
Format is "YYYYMMDD".
(YYYY: Year in 4 digits, MM: Month in 2
digits, DD: Day in 2 digits)
"Alarm" (Fixed to character string)
The "storage date" indicates the data when the data are generated and output to the
automatic alarm CSV file.
(Example) When the data output to the automatic alarm CSV file is the data of June 1, 2003
"Alarm_20030601.CSV"
8-29
8-29
8 OTHER FUNCTION
MELSOFT
POINT
When the automatic alarm CSV file export target folder is changed during
automatic CSV file export, the setting change is reflected from the next
automatic alarm CSV file export processing.
The free space of the disk drive that includes: the PX Developer installation
destination, trend binary data storage folder and automatic CSV file export target
folder is monitored according to the "Disk free space check size (MB)" in Option
setting (general).
(3) Output form of automatic alarm CSV file
Unlike the CSV export of the alarm list (
Section 7.3.7), the alarm
occurrence and recovery in automatic alarm CSV file export are output to
different lines.
<CSV export of alarm list>
Alarm occurrence
and recovery are
output to one line.
<Automatic alarm CSV file export>
Alarm occurrence
and recovery are
output to different
lines.
Recovery date and time are not output to alarm occurrence line.
Occurrence date and time are not output to alarm recovery line.
(4) Error processing
An error may occur during file processing due to the insufficient disk free space
at the time of CSV files export.
Section 7.3.1) occurs.
In this case, the system alarm "file error" (
When the file error occurs, the alarm definition is not output to the CSV file.
Section 7.3) or in the alarm/event
The alarm is displayed in the alarm list (
Section 6.3.1) of the monitor toolbar.
display area (
8-30
8-30
8 OTHER FUNCTION
MELSOFT
8.7.3 Automatic event CSV file export
This section explains the timing, storage destination, output form, precautions, etc. of
automatic event CSV file export.
(1) Timing and data range of automatic event CSV file export
The event data is output to a CSV file at event occurrence.
The data of one day are output to a one event CSV file.
Hence, when the date changes, the output destination file of the automatic event
CSV file data changes.
(2) Output destination and file name of automatic event CSV file
(a) Output destination of automatic event CSV file
An automatic event CSV file is output to the folder set to "Automatic event
CSV file export target folder" in Option setting (alarm/event).
When the above setting has not been made, however, the file is output to
the "EventCSV" folder indicated in Section 2.3.
(b) File name of event CSV file to be export automatically
One automatic event CSV file is created a day.
Hence, naming of the CSV file to be export automatically is as described
below.
File name
Event_(Storage date).CSV
The file name format is as indicated below.
Event_20030601.CSV
Storage date
Format is "YYYYMMDD".
(YYYY: Year in 4 digits, MM: Month in 2
digits, DD: Day in 2 digits)
"Event" (Fixed to character string)
The "storage date" indicates the data when the data are generated and output to the
automatic event CSV file.
(Example) When the data output to the automatic event CSV file is the data of June 1, 2003
"Event_20030601.CSV"
POINT
When the automatic event CSV file export target folder is changed during
automatic CSV file export, the setting change is reflected from the next
automatic event CSV file export processing.
The free space of the disk drive that includes the PX Developer installation
destination, trend binary data storage folder and automatic CSV file export target
folder is monitored according to the "Disk free space check size (MB)" in Option
setting (general).
8-31
8-31
8 OTHER FUNCTION
MELSOFT
(3) Output form of automatic event CSV file
The output form of an automatic event CSV file is the same as in the CSV export
of the event list.
For details of the CSV export of the event list, refer to Section 7.4.6.
(4) Error processing
An error may occur during file processing due to the insufficient disk free space
at the time of CSV files export.
Section 7.3.1) occurs.
In this case, the system alarm "file error" (
When the file error occurs, the alarm definition is not output to the CSV file.
Section 7.4) or in the alarm/event
The event is displayed in the event list (
Section 6.3.1) of the monitor toolbar.
display area (
8-32
8-32
8 OTHER FUNCTION
MELSOFT
8.7.4 Automatic CSV file deletion
PURPOSE
Use of automatic CSV file export stores CSV file automatically. Hence, the disk
drive may be short of free space if automatic CSV file storage is continued.
Set automatic CSV file deletion in order to prevent the disk drive from being short
of free space.
BASIC OPERATION
The following table shows the setting item related to the automatic CSV file
deletion.
Setting item
Option setting (General)
Option setting (Alarm/Event)
Option setting (Trend graph)
Setting position
Reference
Automatic CSV file deletion time (0 to 23)
Automatic alarm CSV file deletion
Alarm CSV file storage period (days)
Automatic event CSV file deletion
Event CSV file storage period (days)
Automatic trend CSV file deletion
Trend CSV file storage period (days)
Section 9.17 (1)
Section 9.17 (2)
Section 9.17 (4)
By setting "Automatic CSV file deletion" to "Enable", CSV files are automatically
deleted after the time set to "CSV file storage period (days)" has passed (The
execution time (hour and minute) setting is available). This function is applied to
the files stored in the corresponding automatic CSV file export target folder.
For automatic CSV file deletion, automatic detection execution time can also be
set.
For details of setting procedure of the automatic CSV file deletion, refer to Section
8.7 (3).
POINT
When the automatic CSV file export target folder is changed during CSV files
delete, the previous folder is excluded from the deletion target at the time of next
deletion.
[Before change]
C:\Melsec\Fbdq\Userdata\Csvdata1
Automatic CSV file
export target folder
Automatic CSV file
export target folder
is ch anged.
[After change]
C:\Melsec\Fbdq\Userdata\Csvdata2
Automatic CSV file
export target folder
Previous folder is excluded
from the target of automatic
CSV file deletion.
Even though trend group names can be included in automatic trend CSV file
names in accordance with the setting of "Automatic trend CSV file export target
folder" in the option setting (trend graph) (
Section 9.17 (4)), this function
deletes files of both formats: ‘Include Group Name’ format and ‘Do not include
Group Name’ format.
However, a file whose name includes trend group name is deleted only when a
combination of a group name and a group number in the file name matches the
contents of the trend setting.
8-33
8-33
8 OTHER FUNCTION
MELSOFT
8.7.5 Disk free space check
PURPOSE
Set the low limit value of the disk free space, in order that an alarm will occur
when the disk drive runs short of space due to automatic CSV file export.
BASIC OPERATION
The following table shows the setting item related to the disk free space check.
Setting item
Option setting (general)
Setting position
Reference
Disk free space check size (MB)
Section 9.17 (1)
For details of setting procedure of the disk free space check size, refer to Section
8.7.
(1) When disk is short of free space
When the free space of the disk drive decreases to or below the "Disk free space
check size (MB)" in the option setting (general), the alarm for the disk free space
error occurs.
For details of the alarm, refer to Section 7.3.1.
(2) Target disk drive of disk free space check
This function checks the disk drives that include the storage folders of PX
Developer installation destination, trend binary data files, automatic trend CSV
file, automatic alarm CSV file and automatic event CSV file. (for each partition)
The alarm is occurrence and recovery for each disk drive.
When storage folders of data exist in two disk drives, Drive C and Drive D
Folder of PX
Developer
installation
destination
Storage folder of
trend binary data
Automatic alarm
CSV file export
target folder
Automatic trend
CSV file export
target folder
Automatic event
CSV file export
target folder
Drive C
Drive D
Drive C and Drive D are the target of disk free space check!
8-34
8-34
8 OTHER FUNCTION
MELSOFT
POINT
If the folders within the disk drive become unused after storage folder setting is
changed, errors in the disk drive will be cleared.
At the same time, the disk drive will be excluded from the target of the disk free
space check.
Folder of PX
Developer
installation
destination
Automatic trend
CSV file export
target folder
Storage folder of
trend binary data
Automatic alarm
CSV file export
target folder
Automatic event
CSV file export
target folder
Drive C
Drive D
Storage folders are changed.
Folder of PX
Developer
installation
destination
Storage folder of
trend binary data
Automatic alarm
CSV file export
target folder
Automatic event
CSV file export
target folder
Automatic trend
CSV file export
target folder
Drive C
The disk free space error within Drive D is cleared.
Drive D is excluded from the target of disk free space check.
(3) Disk free space check period
A disk free space check is performed at intervals of 10 minutes.
8-35
8-35
8 OTHER FUNCTION
MELSOFT
MEMO
8-36
8-36
9 SETTING
MELSOFT
9 SETTING
Various functions of the monitor tool are executed according to the settings specified
previously.
These settings can only change the users who have been licensed by the user with
engineer authority. In order to avoid any change by common operators, the setting
window can only be displayed in the engineer mode.
For details, refer to "Chapter 4 MODE ADMINISTRATION".
9.1
Common Setting Window
This part explains the common operation on the setting window.
9.1.1
Displaying and operating the setting window
PURPOSE
Display the windows and conduct basic operations
BASIC OPERATION
Open the setting window with the following methods:
1. Click the "Change Mode" button on the monitor toolbar.
2. On the displayed Change Mode dialog box, input the user name and password
with engineer authority to change the mode to the engineer mode.
(If it is the engineer mode already, the operations mentioned above are
unnecessary.)
3. Click the "Setting window" button on the monitor toolbar.
4. Close the other windows to display the setting window.
DISPLAY/SETTING SCREEN
1) Menu
2) Title bar
7)
8)
9
4) Setting items selection area
3) Status bar
9-1
5) Setting contents display area
6) Data setting grid
9-1
9 SETTING
MELSOFT
See the following table for the display contents of each bar.
No.
1)
2)
3)
4)
Item
Menu
Title bar
Status bar
Setting items selection area
5)
Setting contents display area
6)
7)
Data setting grid
"Apply" button
8)
"Cancel" button
Description
Select various common functions and execute them.
Display the icon, title bar character string, and title bar buttons.
Display supplement.
Switch various setting items.
Display the contents of the specified items in the "Setting items
selection area"
Input the setting data to each lattice-like input to cell.
Make the set contents valid and displayed them on the monitor.
Cancel the setting data on the screen, and return to the former applied
setting data.
(1) Menu
See the following table for functions that can be executed from the menu.
Menu item
File
Edit
Function
Save the monitor setting information in the setting data
Save the setting data
file.
Export Setting Data to CSV File ... Export the monitor setting information to the CSV files.
Generate a GOT screen project for monitoring and
Generate GOT Screen ...
tuning tags.
Close
Close the monitor setting window.
Cut
Ctrl + X
Cut the selected character string to the clipboard.
Copy
Ctrl + C
Copy the selected character string to the clipboard.
Paste the character string of the clipboard in the input
Paste Ctrl + V
cell position.
Delete Del
Delete the selected character string.
Delete Row Shift + Del
Delete the selected line.
Reference
Section 9.1.3 (3)
Section 9.1.3 (4)
Section 9.1.3 (5)
-------------------
Shortcut menu displayed when right-clicking the data setting grid, the same
functions can be executed as the [Edit] on the menu.
Data setting grid
Shortcut menu
(Displayed while right-clicked)
POINT
Targets of the copy and paste on the data setting grid are the basically-displayed
character string (things such as the user setting password and the color setting of
the lockout tag names displayed when setting lockout tag are not the copy targets).
(2) Title Bar
The display style of the title bar is in accordance with the normal windows.
What the title character string displays is the item name character string of the
final setting target.
After opening the monitor setting window, if the setting items have not been
selected, the setting item names will not be displayed.
Display the names of the
setting items
9-2
9-2
9
9 SETTING
MELSOFT
(3) Setting Items Selection Area
In this area, various setting items can be switched.
This can be done by clicking the corresponding positions in the selection area.
The following are selectable setting items.
Option Item
Reference
User authority setting
Section 9.2
User setting
Section 9.3
Monitor target project setting
Section 9.4
OPS setting
Section 9.5
Monitor variable setting
Section 9.6
Control panel setting
Section 9.7
Trend setting
Section 9.8
Alarm setting
Section 9.9
Event setting
Section 9.10
User–created screen setting
Section 9.11
Unit setting
Section 9.12
Faceplate display pattern setting
Section 9.13
Faceplate display scale setting
Section 9.14
Faceplate MV characters setting
Section 9.15
Lockout tag setting
Section 9.16
Option setting
Section 9.17
(4) Setting Contents Display Area
In this area, the contents of the specified items on "Setting items selection area"
are displayed.
Data setting of the contents can be done by inputting the data to the cell of the
data setting grid.
When the monitor setting window is just open (the initial status) and the setting
items have not been selected, the background is gray and no content is
displayed.
Display the selected setting
contents from the left list.
Setting items selection area
9-3
Setting contents display area
9-3
9 SETTING
9.1.2
MELSOFT
Inputting to data setting grid
(1) Input data to the cells
See the methods of inputting data to the cells of the data setting grid as below.
Input method
Display
Description
Text box
Select the cells directly input the setting data with the keyboard.
The following are 2 methods to change the character string of the cell to the
selection status.
Move the cursor to the target cell, then press Ctrl + Enter key.
Move the mouse cursor to the target cell, and then double click.
List box
Click the button on the right of the cell, list the list box, select from the list.
Button
Click the button on the right of the cell, display the dialog box, then execute
setting on the dialog box.
The same method with the one mentioned above in the text box can be used
to input directly for setting the items of names, file names, and folder names.
POINT
With the various functions in [Edit] of the menu, several operations can be done:
change the cell contents to the general file-creating software or paste the
contents to the form calculation software, or input in groups the creating contents
such as form calculation software to the cells.
The copy and paste targets of the data setting grid are the basically-displayed
character string (things such as the user-setting password and the color setting
of the lockout tag names displayed when setting lockout tag are not the copy
targets).
(2) Delete the data of the cells
There are 2 methods to delete data from the cells of the data setting grid:
Press the key Delete.
Select [Delete] under [Edit] of the menu or on the short-cut menu.
(3) Delete the Row data of the grid
There are 2 methods to delete a whole line of cells
Press the key Shift + Delete key.
Select [Delete Row] under the [Edit] of the menu or on the short-cut menu
Select "YES" on the confirm dialog box to delete the entire contents of one line.
When option setting, delete row cannot be used.
(4) Grid hierarchical display
Hierarchical lines according to groups are displayed with a + mark beside the
items.
Click the +, unbind the hierarchical lines.
Click the –, close the hierarchy.
9-4
9-4
9 SETTING
MELSOFT
(5) Set with the dialog box
The following part explains the common operations of various functions in the
dialog box for the setting displayed when clicking buttons.
(a) File selection dialog box
It is the dialog box used to set the folders or file names of the targets to be
specified.
BASIC OPERATION
1. Select the target folder by using the list box on the [Look in] bar or the "Up"
button( ).
2. Display the file type selected by the list box of [Files of type] and the list of
the next folders, and then clicks to select the target files/folders on it.
3. Input the file name to the [File name] if a new file is created.
4. Click the "Open" button.
DISPLAY/SETTING SCREEN
(b) Color selection dialog box
It is a dialog box used to set the specified display color.
BASIC OPERATION
1. Click the selected color display bar from [Basic colors].
2. Click the "Define Custom Colors" button to specify a color that does not exist
in the [Basic colors]. On the displayed color samples, click the position of
their favorite colors, or specify the [Hue], [Sat], [Lum] and the values of [Red],
[Green], [Blue] to determinate the created colors. If the "Add to Custom
Colors" button is clicked, the created color will be displayed in the bar under
[Basic colors].
3. When the specified color is selected, click the "OK" button.
DISPLAY/SETTING SCREEN
9-5
9-5
9 SETTING
9.1.3
MELSOFT
Registering and saving the settings
If only the contents of the data setting grid are changed, the monitor tool setting will not
change in the actual operation. It is necessary to click the "Apply" button to make the
change valid.
The applied setting is saved in the setting data file when closing the setting screen or
switching from the monitor target project setting to another setting item. It is still valid
when the monitor tool is restarted.
[Save the
The saving to the setting data file can also be done by operating "[Files]
setting data]" on the menu.
(1) Apply
Make the setting data valid.
When executing, the edited setting data will be checked.
If the setting data is not correct, the message box will be displayed.
1. Click the "Apply" button of the setting window.
2. Click the "OK" button in the confirmation dialog box.
(2) Cancel
Cancel the setting data on the screens to undo the previously applicable data.
1. Click the "Cancel" button on the setting window.
2. Click the "OK" button in the confirmation dialog box.
(3) Save the setting data
Write the present applicable setting data to the setting data file.
The setting data cannot be saved during the process of changing.
The changed setting can be applied or be saved again after being cancelled.
1. Execute "[File]
[Save the setting data]" on the
menu.
2. Click the "OK" button in the confirmation dialog box.
9-6
9-6
9 SETTING
MELSOFT
(4) Export Setting Data to CSV File
Write the present applicable setting data in the CSV form to the specified files.
The setting data cannot be saved during the process of changing. The changed
setting can be made to be applicable or be saved again after being cancelled.
1. Execute "[File]
[Export Setting
Data to CSV File…]" on the menu.
2. Specify the saving destination in the
Files Saving Destination
Confirmation Dialog Box.
3. Click the "OK" button
Files are saved in the CSV form to each setting item of the specified folder.
Files are automatically named in the form of "(Setting Item Name). csv".
The following are the examples of the Export forms.
(User Setting. csv)
No., User Name, Password, Authority
1,admin,*****, Enginner
2,user001,********, Operator1
(5) Generate GOT Screen
Start up the GOT screen generator function (Wizard style) and generate a GOT
screen project.
The GOT screen generator does not start while the setting data is being changed.
For details, refer to "PX Developer Operating Manual (GOT Screen Generator)".
1. Execute "[File]
[Generate GOT Screen…]" on the
menu.
2. GOT screen generator wizard is displayed.
9-7
9-7
9 SETTING
9.1.4
MELSOFT
Copying monitoring environment of monitor tool to other computers
To copy the monitoring environment of monitor tool that is constructed in one personal
computer to other ones, follow the procedures below.
However, the following operations are not necessary in the server/client system
configuration because the monitoring environment set in a server (primary server) is
automatically copied to clients (secondary server).
Copy and overwrite the Prjdata
folder from the copy source
personal computer to the copy
target folder.
Copy and overwrite M_SET.mdb
and M_USER.mdb in the Setdata
folder from the copy source
personal computer to the copy
target folder.
1. Close the monitor tool in the copy target personal
computers. Close the setting screen of the monitor
tool in the copy source personal computer when it
is opened.
2. Overwrite the data to the applicable folder in the
PX Developer installation destination folder in the
copy target personal computer. For the folder
configuration of monitor tool, refer to Section 2.3.
3. Start up the monitor tool in the copy target
personal computer.
4. When connecting to the PLC via Ethernet, call the
"Transfer Setup" dialog box from the monitor
target project setting and set a different station
number for copy source and copy target personal
computers in the PC side I/F Ethernet board
setting.
5. Start up the monitor tool in the copy source
personal computer.
6. When using the event notification function with
CC-Link IE Controller Network or
MELSECNET/10(H) connection, specify a group
number of the event notified personal computer in
the event notification setting of the programming
tool. Subsequently, compile again and execute
download so that both copy source and copy
target personal computers are enabled to receive
the event notification from the PLC. (Compilation
and download need to be executed using the
programming tool.)
For the event notification setting, refer to "PX
Developer Operating Manual (Programming
Tool)".
7. To change the transfer setup of the monitor
target project setting in the monitor tool and
perform "Apply"/"Reload", place the assignment
information database file of the project to the path
specified in the monitor target project setting.
9-8
9-8
9 SETTING
MELSOFT
POINT
Communication performance
When the number of personal computers connecting to the PLC increases, the
communication performance between the PLC and the personal computers
decreases. The following shows how to check the communication performance.
Display four control panel screens for each different group. Current value can
be checked in the collection period of high-speed current value collection on
the <<Collection Period for Each Communication Type>> tab of the PLC
Section 8.5). It is recommended that this
communication status screen (
value should be less than one second.
Display two pop-up faceplate screens. Current value can be checked in the
collection period of high-speed tag data collection on the <<Collection Period
for Each Communication Type>> tab of the communication status screen. It is
recommended that this value should be less than one second.
If the collection period mentioned above is longer than one second, it is
recommended to configure the server/client monitoring system.
Path for printers, folders and files
Monitor tool setting relating to the path for the following printers, folders and files
may have different configurations in each personal computer. Therefore, adjust
the configuration of the copy target personal computer to match with the
configuration of the copy source personal computer. Or, overwrite the setting into
the copy target personal computer and then set it again to match with the
configuration of the copy target personal computer.
Application of User-created screen setting
Printer of option setting (General)
Automatic alarm/event CSV file export of option setting (Alarm/Event general)
Major alarm, minor alarm and event sound file of option setting (Alarm/Event)
Trend binary data storage folder of option setting (trend graph)
Automatic trend CSV file export target folder of option setting (trend graph)
9-9
9-9
9 SETTING
9.2
MELSOFT
User Authority Setting
PURPOSE
Set the operation authority range for users to be specified on User Setting
(
Section 9.3).
BASIC OPERATION
Check the operations authority for Operator1 to 4.
DISPLAY/SETTING SCREEN
2)
1)
DISPLAY/SETTING DATA
1) Operation authority setting area
Setting item
Description
Input
method
Set the authority of operation for stopping the
Stop buzzer
buzzer.
General
Print screen
Set the authority of operation for printing the
whole hard copy of the displayed desktop.
Exit
monitor tool
Set the authority of operation for exiting the
monitor tool.
Initial setting
Operator1 Operator2 Operator3 Operator4 Engineer
1
*
Check
box
1
*
1
*
(To the next page)
9-10
9-10
9 SETTING
MELSOFT
Setting item
Change of
the values
of tag data
item
Trend
graph
Pop-up
tuning
Alarm/
Event
PLC
communication
status
Input
method
Description
Initial setting
Operator1 Operator2 Operator3 Operator4 Engineer
Set the authority of operation for changing tag
Process
data items which are to be process instruction
instruction
values/Mode values/mode such as SV, MV, and MODE.
*
Alarm
threshold
values
Set the authority of operation for changing tag
data item values which are to be alarm
threshold values such as PH, HH, and SH.
*
Tuning
parameter
values
Set the authority of operation for changing tag
data item values which are to be tuning
parameters such as P, I, D, and GG.
*
Process
design
values
Set the authority of operation for changing tag
data item values which are to be process
design values such as INH, CT, and RH.
*
Export to
CSV file
Set the authority of operation for exporting
trend data to CSV file.
*
Export to
CSV file
Set the authority of operation for exporting
tuning trend data to CSV file.
*
Tuning trend Set the authority of operation for
starting/stopping/clearing tuning trend data
collecting
collection.
instruction
*
1
1
1
1
1
1
1
Export to
CSV file
Set the authority of operation for exporting
data of alarm list/event list to CSV file.
Print
Set the authority of operation for printing the
alarm list/event list.
Confirm
Set the authority of operation for checking the
alarm list/event list.
*
Delete
Set the authority of operation for deleting the
alarm list/event list.
*
Reset
Set the authority of operation for resetting the
maximum value/number of times.
*
Operator1
Level
Set the authority of operation for setting/
removing lockout tag for Operator1 level tag.
*
Operator2
Level
Set the authority of operation for setting/
removing lockout tag for Operator2 level tag.
*
Set the authority of operation for setting/
removing lockout tag for Operator3 level tag.
*
Set the authority of operation for setting/
removing lockout tag for Operator4 level tag.
*
Set the authority of operation for setting/
removing lockout tag for engineer level tag.
*
Setting/
Operator3
Removing
Level
lockout tag
Operator4
Level
Engineer
Level
1
*
Check
box
1
*
1
1
1
1
1
*
1
*
1
*
1
*
1
*
Checked: Permitted,
1
1
*
1
*
1
1
*
1
*
1
*
1
*
1
*
1
1
*
1
*
1
Uncheck: Prohibited
*1: Items for read-only.
2) "Restore default" button
Return setting content to the initial setting.
POINT
For details of operation authority for changing tag data items, refer to Appendix 4.
9-11
9-11
9 SETTING
9.3
MELSOFT
User Setting
PURPOSE
To register the users who use the monitor tools, to set the passwords and
engineer/operator1 to 4 authority for each user.
The operation authority range is set on User Authority Setting (
Section 9.2).
Monitor tools execute the mode administration according to the user's authority.
For details of the mode administration, refer to Chapter 4.
BASIC OPERATION
1. Input the user's (operator) name in the [User Name] cell.
2. Input the password that is only known by the user to the [Password] cell.
3. Select the user's authority in the list box of the [Authority] cell.
DISPLAY/SETTING SCREEN
DISPLAY/SETTING DATA
Setting item
Description
Input method
Input restriction
User Name
Set the user name
Text box
8 characters
Password
Set user's password
On the screen, characters of the password are displayed as "*".
Password
dialog box
8 characters
Authority
User's authority is selected to be engineer/operator1 to 4.
List box
Engineer/Operator4/
Operator3/Operator2/
Operator1
Maximum 50 users can be registered.
The current user authority cannot be changed, and the current user cannot be deleted,
either.
In the server/client monitoring system, users being used currently in clients cannot be
changed. However, when clients connect to a secondary server in a redundant server
system, users being used in the clients can be changed from a primary server. In this
case, the setting data of the primary server are copied to the clients via the secondary
server.
The same user name cannot be duplicated. Click the "apply" button to check whether
user names are duplicated.
POINT
If the user name is not registered, the password and authority cannot be set.
First, make user setting.
When starting the monitor tool in the mode that matches the authority of the
Appendix 3.3), do not use a "/" (slash) or "-" (hyphen) in the
specified user (
first character of the user name and password.
9-12
9-12
9 SETTING
9.4
MELSOFT
Monitor Target Project Setting
PURPOSE
Set project (Assignment information database file) as monitor targets on the
monitor tool.
BASIC OPERATION
1. Click the [Assignment information database file] button to open the project,
and display the dialog box.
If setting the assignment information database file that needs to be opened,
click the "Open" button, the assignment information database file name and
the path will be displayed in the grid.
2. Click the button in the transfer setup field to display "Transfer Setup" dialog
box according to the PLC type.
Specify the PLC transfer setup, click the "OK" button, close the dialog box,
thus, connection path types are displayed on PLC transfer setup.
3. If there are any tags with the same name in different setting assignment
information database file, when "Apply" or "Reload" button is clicked, the
duplicated tag name will be displayed.
DISPLAY/SETTING SCREEN
4)
3)
1)
2)
Maximum of 16 projects can be referred to
<For standalone, server (non-redundant server system) and
client (non-redundant server system)>
9-13
<For primary/secondary server and
client (redundant server system)>
9-13
9 SETTING
MELSOFT
DISPLAY/SETTING DATA
1) Data setting area
Specify the connection method between PX Developer project as the monitor
target on the monitor tool and CPU module which is written to the program.
See below for the setting items.
Setting item
Description
Project Name
Display the project name of the file set to the
assignment information database file.
Assignment
Information Database
File
Display the dialog box and the selection
assignment information database file item of the
opened assignment information database file.
PLC type
Display the PLC type stored in the above
assignment information database file.
Input method
Input restriction
Non-editable
File selection dialog
box
(1) in this section
Files with mdb as
extension name
Non-editable
Specify the PLC transfer setup in the PLC
Transfer Setup dialog box.
Transfer Setup
When more than one simulator connection is
selected, a line will be drawn on the connection
transfer.
Primary Server
Transfer Setup
In the redundant server system, specify the
transfer setup with a primary server.
Secondary Server
Transfer Setup
Simulator Connection
In the redundant server system, specify the
transfer setup of a secondary server with a
primary server.
Transfer Setup dialog
box
(2) in this section
When executing the connection test, do it with a
secondary server.
Select when connecting to simulator.
When GX project type is GX Works2 project, the
monitor tool will be connected to GX Simulator2.
For GX Developer, the monitor tool will be
connected to GX Simulator. For GX Simulator2,
the maximum of 4 projects can be connected.
For GX Simulator, only one project can be
connected.
Check box
Can be selected
when standalone,
server (nonredundant server
system), or
primary server is
set.
POINT
When the transfer setup is specified with a primary server, the transfer setup of
the other server can automatically be set by setting the transfer setup of either a
primary or secondary server. In this case, when the PC side I/F is ‘Ethernet
board’, the PC side station numbers of both a primary server and secondary
server are automatically set avoiding the duplication.
When connecting to a simulator, perform the simulation following the procedure
shown below.
1) Start the programming tool.
[Open Project] under the Menu to open a project (file with
2) Select [Project]
fpj extension) which connects to Simulator.
[Start Simulation] on the menu to start Simulator.
3) Select [Debug]
9-14
9-14
9 SETTING
MELSOFT
POINT
When connecting to simulator which is not started up, the communication error
will occur.
Do not connect a simulator using monitor tool which is operating as a monitoring
system. When more than one project to be connected to simulator is set, the data
will not be sampled from PLC CPU.
Clearing all the settings to be connected to simulator and clicking “Apply” button
restart data sampling from PLC CPU. In order to not restart, clear the transfer
setup and click the “Apply” button.
For the project connected to simulator, change of operation mode and notification
of warning/event occurrence will be delayed because event notification is not
received.
2) Duplicated tags display area
Check the tag information of each item when displaying the screen or clicking
the "Apply" button or "Reload" button. If there are any duplicated tag names,
they will be displayed.
See as below for the setting items.
Setting item
Content
Input method
Duplicated Tag Name
If there are any tags with the same name on the
different project the tag name will be displayed.
Non-editable
Duplicated Project
Name
The projects names with duplicated tag names
will be displayed.
Non-editable
Input restriction
3) Apply button, Reload button
Read the setting tag data assignment information to the assignment
information database file.
POINT
All data collection operations (including tuning trend collection) are stopped
during registration of assignment information database file.
Reading all tag data may take time until start is completed.
Use the "Reload" button to re-register the assignment information database file
that was recompiled by the programming tool and then written to the PLC.
Also make the following checks.
Check that the same project does not exist.
Check that there is no contradiction between the PLC type of the assignment
information database and that of the Transfer Setup.
Be sure to re-register Assignment information database files when changing the
start of file register (ZR) in the <<System Resource>> tab in the project
parameter setting of the programming tool and performing PLC download.
9-15
9-15
9 SETTING
MELSOFT
4) Supportability icon
Indicates whether the assignment information database file specified in "1)
Data setting area" can be used with the monitor tool.
This icon is displayed when the assignment information database is ensured.
The display definition is as described below.
Icon
Definition
The specified assignment information database can be used.
Tag data can be monitored/controlled with the monitor tool.
The specified assignment information database cannot be used.
Confirm the displayed error message before taking the action.
An error message is displayed in the message box or the status bar (when the relevant cell (s)
is (are) selected).
POINT
If the support possibility icon displays "Transfer Setup" dialog box will not appear by
clicking "Transfer Setup" button.
REMARK
When searching with the find function through the specified tag names, if there are
any same tag names on different project, the project tags with a higher priority will
be found. When setting the monitor target project, the smaller of the [No.] is, the
higher its priority is. If there are several duplicated project tag names, the tag name
should be specified in the form of (project name):: (tag name) when searching and
displaying the only tag by the tag of the monitor tool.
9-16
9-16
9 SETTING
MELSOFT
(1) Set assignment information database file
Specify the PX Developer project selected as monitor target on the monitor tool.
The current specified assignment information database file refers to the files with
mdb as extension name. These files were made beforehand when being
compiled by the programming tool.
The files can be set by 2 methods. One is to directly input the character string to
the cell of [Assignment Information Database File], the other one is to click the
cell button to select in the displayed file selection dialog box.
For details, refer to "Section 9.1.2 Inputting to data setting grid".
POINT
The assignment information database indicates the "*.mdb" file created by
compile of the programming tool.
This file stores the variable assignment information, which stores tag data, etc.,
and the device information of the CPU module.
The monitor tool performs monitoring, etc. of tag data on the basis of this
assignment information database.
Do not specify the same project name.
Even if they have different path names of the assignment information database
file, the projects will be recognized as the same project, when the same name
has been assigned to them.
When changing a project name, save the project as different name using the
programming tool, and then re-set the project name using monitor tool.
When the project has been re-compiled with the programming tool and
downloaded to the PLC, it is necessary to click the "Reload" button to re-register
the assignment information database file.
9-17
9-17
9 SETTING
MELSOFT
(2) Set transfer setup
Specify the connecting to methods CPU module of the writing program.
By clicking the cell button of [Transfer setup], the connection methods can be set
on the displayed transfer setup specified window.
Please refer to the "PX Developer Operating Manual (Programming Tool)" for
details.
< Process CPU >
< Redundant CPU>
See as below for the transfer setup that can be set by the monitor tool and the
specified contents on the "Transfer Setup" dialog box.
(a) Connecting to Process CPU
PLC Transfer
Setup
PC side I/F
PLC side I/F
Other station
Network
route
Co-existence
network route
2
No specification *
1
Serial
USB
Serial *
1
USB *
PLC module
C24
MNET/10(H)
remote
Other station (Single network)
Other station (Co-existence network)
C24
CC-Link
NET/10(H)
Ethernet
C24
CC-Link
NET/10(H)
Ethernet
Other station (Single network)
CC-Link
Other station (Co-existence network)
CC-Link
G4 module
CC IE Cont
MNET/10
MNET/H
CC IE Cont
NET/10(H)
board
CC IE Cont
NET/10(H)
module
Ethernet
Ethernet
board
Ethernet module
CC-Link
board
CC-Link module
1
CC-Link *
Other station (Single network)
Other station (Co-existence network)
CC IE Cont
NET/10(H)
NET/10(H)
Ethernet
C24
CC-Link
NET/10(H)
Ethernet
C24
CC-Link
Other station (Single network)
Ethernet
Other station (Co-existence network)
C24
CC-Link
Other station (Single network)
CC-Link
Other station (Co-existence network)
NET/10(H)
Ethernet
*1: Serial, USB and CC-Link connection are allowed for adjusting the CPU.
*2: Cannot select when PLC side I/F is MNET/10 (H) remote.
9-18
9-18
9 SETTING
MELSOFT
(b) Connecting to Redundant CPU
PLC Transfer
Setup
PC side I/F
PLC side I/F
Other station
Network
route
Co-existence
network route
4
Target system *
2
No specification *
1
Serial *
1
USB *
PLC module
C24
MNET/10(H)
remote
Serial
USB
Other station
(Co-existence network)
G4 module
CC IE Cont
MNET/10
MNET/H
CC IE Cont
NET/10(H)
3
board *
CC IE Cont
NET/10(H)
module
Ethernet
Ethernet
board
Ethernet
module
CC-Link
board
CC-Link
module
1
CC-Link *
Other station
(Single network)
Other station
(Single network)
Other station
(Co-existence network)
Other station
(Single network)
Other station
(Co-existence network)
Other station
(Single network)
Other station
(Co-existence network)
Other station
(Single network)
Other station
(Co-existence network)
C24
CC-Link
NET/10(H)
Ethernet
C24
CC-Link
NET/10(H)
Ethernet
NET/10(H)
Ethernet
C24
CC-Link
CC-Link
CC-Link
CC IE Cont
NET/10(H)
Ethernet
CC-Link
NET/10(H)
Ethernet
Control System
Standby System
System A
System B
Not specified
C24
CC-Link
C24
CC-Link
NET/10(H)
Ethernet
*1: Serial, USB and CC-Link connection are allowed for adjusting the CPU.
*2: Cannot select when PLC side I/F is MNET/10 (H) remote.
*3: The MELSECNET/10 board is inapplicable, as the driver (SW DNFMNET10) is incompatible with Redundant CPU. Use the
MELSECNET/H board compatible with Redundant CPU.
*4: The connection target specified in Target system is as shown in the
following table.
Options
Connection target
Not specified
CPU direction connection:
The CPU module directly connected to personal computer
Via a module mounted to the main base unit:
The CPU module of station in which the network module corresponding to the station No.
specified in Network communication path is mounted.
Via a module mounted to the redundant type extension base unit:
The CPU module in the control system
Control System
The CPU module in the control system
Standby System
The CPU module in the standby system
System A
The CPU module to which the A side connector of tracking cable is connected.
System B
The CPU module to which the B side connector of tracking cable is connected.
In the initial setting, "Control system" is set. If this setting causes an error
when the system is switched in Redundant CPU, the control system is
always monitored.
9-19
9-19
9 SETTING
MELSOFT
POINT
If the assignment information database file is not registered, PLC connection
target cannot be set.
For communication route, refer to Section 2.1.2.
If connecting through the network, the network parameter must be set through
transfer setup.
For a method for setting the network parameter, refer to the following manuals:
GX Works2 Version 1 Operating Manual (Common)
GX Developer Version 8 Operating Manual
When connecting to the Redundant CPU in the debug mode, make sure to
specify it as "Not Specified", "System A" or "Control system".
Otherwise, a communication error may occur, or monitoring may not be
performed properly.
Set the number of retry times on the Host station Detailed setting /Other station
Detailed setting dialog box selected in Other station to retry (reopen + read) for
the number of times being set when the processing which reads device data
from CPU module fails. The communication read error does not occur when the
read processing succeeds during retry.
"CC-Link IE Field Network board" cannot be specified as PC side I/F. In addition,
it cannot be specified to network communication route.
9-20
9-20
9 SETTING
9.5
MELSOFT
OPS Setting
PURPOSE
To display the monitor tool execution type setting dialog box and set a monitor tool
to be executed as either of Standalone/Server/Client.
Additionally in a server, to manage the communication information and OPS
names for communicating to all clients.
BASIC OPERATION
1. Start up a monitor tool and display this setting screen.
2. Click the "Setting..." button to display the monitor tool execution type setting
dialog box. Select the execution type and click the "OK" button.
3. In a server, select the address type from the list box and enter IP addresses or
1
host names* of clients at [Communication Setting] cells of the OPS setting
screen.
4. Enter desired OPS names at the [OPS Name] cells.
*1: The network setting of personal computers must be done in advance.
(1) Standalone
DISPLAY/SETTING SCREEN
<OPS Setting screen>
<Monitor Tool Execution Type Setting dialog box>
DISPLAY/SETTING DATA
Setting item
Execution
type
9-21
Description
Select the execution type of a monitor tool
from Standalone/Server/Client.
Input method
List box
Input restriction
Standalone/
Server/Client
Initial setting
Standalone
9-21
9 SETTING
MELSOFT
(2) Server
DISPLAY/SETTING SCREEN
<OPS Setting screen>
<Monitor Tool Execution Type Setting dialog box>
DISPLAY/SETTING DATA
Setting item
Description
Input method
Select the execution type of a monitor tool
List box
from Standalone/Server/Client.
Select IP Address or Host Name with
Address
which specifying a server address to be
List box
Type
started.
Execution type
Address
1
Server
Specify an IP address* or Host name,
Address depending on the choice at the list box.
Port No.
Redundant Server
Text box
Specify a port number used by a server
Text box
as the server/client communication.
Select whether to configure the redundant
server system.
Check box
Checked .......Redundant
Unchecked ...Non-redundant
Execution type
In the redundant system, select whether
in the redundant server to start as Primary Server or Secondary
system
Server.
List box
In a primary server, select whether to
acquire the setting data from a secondary
server at the next startup.
Acquiring setting data Checked .......Acquire the setting data
from Secondary Server
from a secondary server at Check box
the next startup.
next start time
This option is reset at the
next start up.
Unchecked ...Not acquire the setting data.
Input
restriction
Standalone/
Server/Client
Initial setting
Standalone
IP Address/
Host Name
IP Address
IP Address:
15 characters
Host Name:
63 characters
IP address of own
personal computer
(Depending on the
OS specification if
multiple network
cards are mounted.)
It remains blank if the
network setting is not
done.
1024 to 65535 5113
---Start as
Primary
Server/Start
as Secondary
Server
----
Unchecked
Start as Primary
Server
Unchecked
(To the next page)
9-22
9-22
9 SETTING
MELSOFT
Setting item
Description
For the redundant server system
Address configuration, select IP Address or Host
Type
Name with which specifying another
server address to be installed.
Another
Server
Another
*1
Specify an IP address or Host name,
Server
depending on the choice at the list box.
Address
"Test"
button
Overwriting of setting
data
Attempt to Reconnect
Input
restriction
Input method
List box
IP Address/
Host Name
Text box
IP Address:
15 characters
Host Name:
63 characters
Initial setting
IP Address
----
Test to connect to another server using
---the specified server address and port.
The Detail setting of overwriting the
setting data dialog box is displayed by
button.
clicking the
Contents set in the dialog box are
displayed.
In a secondary server, select whether to
try to reconnect to a primary server when
a communication error occurs with the
Never/
primary server.
Once/
Never: Not try to reconnect.
List box
Once
Twice/
Once to Three times:
Three times
Try to reconnect for the specified
number of times until it succeeds
to connect.
*1: Enter an IP address in dotted-decimal format - 4 sets of numbers from 0 to 255 separated by
periods.
The following shows the OPS setting screen when the execution type is Server.
Not displayed when
the execution type is
not Server.
<OPS Setting screen (Server (non-redundant server system))>
Setting item
<OPS Setting screen (Server (redundant server system))>
Description
Execution Type
Display the execution type specified in the monitor tool
execution type setting dialog box.
"Setting…" button
Display the monitor tool execution type setting dialog box.
Address
Type
Input method
Select IP Address or Host Name with which specifying the
List box
1
communication setting of each OPS. *
Input restriction
IP Address/
Host Name
Communication
setting
OPS
Address
Specify an IP address* or host name, depending on the
1
choice at the list box.*
Text box
IP Address:
15 characters
Host Name:
63 characters
OPS Name
Specify an OPS name.
Text box
32 characters
2
*1: In the line of Server, settings specified in "Server" of the monitor tool execution type setting
are displayed and cannot be changed.
*2: Enter an IP address in dotted-decimal format - 4 sets of numbers from 0 to 255 separated by
periods.
9-23
9-23
9 SETTING
MELSOFT
(3) Client
DISPLAY/SETTING SCREEN
<OPS Setting screen>
<Monitor Tool Execution Type Setting dialog box>
DISPLAY/SETTING DATA
Setting item
Execution type
Address
Type
Server
Server
Address
"Test"
button
Port No.
Redundant Server
Address
Type
Description
Select the execution type of a monitor tool
from Standalone/Server/Client.
Select IP Address or Host Name with
which specifying a server address to be
connected.
1
Specify an IP address* or Host name,
depending on the choice at the list box.
When connecting to the redundant server
system, specify an IP address of a
primary server.
Test to connect to a server using the
specified server address and port.
Specify a port number used by a client as
the server/client communication.
Select whether to connect to the
redundant server system and switch
servers automatically when a server error
occurs.
When connecting to the redundant server
system, select IP Address or Host Name
with which specifying a secondary server
address to be connected.
Secondary
Secondary
*1
Specify an IP address or Host name,
Server
Server
depending on the choice at the list box.
Address
"Test"
button
Test to connect to secondary server using
the specified server address and port.
Input method
Input
restriction
Initial setting
List box
Standalone/
Server/Client
Standalone
List box
IP Address/
Host Name
IP Address
Text box
IP Address:
15 characters
Host Name:
63 characters
----
---Text box
Check box
1024 to 65535 5113
----
List box
IP Address/
Host Name
Text box
IP Address:
15 characters
Host Name:
63 characters
Unchecked
IP Address
----
----
(To the next page)
*1: Enter an IP address in dotted-decimal format - 4 sets of numbers from 0 to 255 separated by
periods.
9-24
9-24
9 SETTING
Setting item
Address
Type
Client
Client
Address
MELSOFT
Description
Select IP Address or Host Name with
which specifying a client address.
Input method
List box
1
Specify an IP address* or host name,
depending on the choice at the list box.
Text box
Input
restriction
IP Address/
Host Name
IP Address:
15 characters
Host Name:
63 characters
Initial setting
IP Address
IP address of own
personal computer
(Depending on the
OS specification if
multiple network
cards are mounted.)
It remains blank if the
network setting is not
done.
The Detail setting of overwriting the setting
data dialog box is displayed by clicking the
button.
Contents set in the dialog box are displayed.
In a secondary server, select whether to try
to reconnect to a primary server when a
communication error occurs with the
Never/
primary server.
Once/
List box
Once
Attempt to Reconnect Never: Not try to reconnect.
Twice/
Once to Three times:
Three times
Try to reconnect for the specified
number of times until it succeeds to
connect.
*1: Enter an IP address in dotted-decimal format - 4 sets of numbers from 0 to 255 separated by
periods.
Overwriting of setting
data
POINT
When being started as Primary server, the OPS can be started using the setting
data of a secondary server.
In the redundant server system, even after a primary server is replaced due to
its failure, it can be started up using the same setting data as before the failure
by acquiring the setting data from a secondary server. To enable this function,
select "Start as Primary Server" in the monitor tool execution type setting and
check "Acquiring setting data from Secondary Server next start time".
Specify the same port number for one used by a server and ones used by
clients.
Make the port number setting not to overlap on well-known port numbers and
port numbers used by software other than the monitor tool.
In a monitor tool running as Client, if ‘Overwrite all’ is selected in "Overwriting of
setting data", customizable settings changed in a client are overlapped with the
setting data of a server when the client is started up or the setting data are
Section 8.6.1)
acquired from the server. (
The settings changed in the monitor tool execution type setting become valid at
the next start up of the monitor tool.
In a monitor tool running as Secondary Server in the server redundant system, if
‘Overwrite all’ is selected in "Overwriting of setting data", customizable settings
changed in the secondary server are overlapped with the setting data of a
primary server when the secondary server is started up or the setting data are
acquired from the primary server.
In addition, the same thing happens when a primary server is started up using
the setting data of a secondary server.
Even though the communication with a server temporarily fails due to reasons
such as bad cable connection and heavy network load, it may be reconnected
to the server automatically by setting the number of times of retry in "Attempt to
Reconnect".
9-25
9-25
9 SETTING
MELSOFT
(4) Detail setting of overwriting the setting data dialog box
PURPOSE
To specify whether to leave the setting inherent in the OPS when the setting data
are acquired from a primary server to a secondary server or a server to a client.
DISPLAY/SETTING SCREEN
DISPLAY/SETTING DATA
Setting item
Description
Input method
Initial setting
Overwrite all
Select this to overwrite all settings in the OPS when
acquiring the setting data. However, even if the
"overwrite all" setting is enabled, the data is not
overwritten if monitor tool execution type setting is done.
Radio button
ON
Leave settings inherent in this
OPS
Select this not to overwrite the setting items in the OPS
selected in the following check boxes when acquiring
the setting data.
Radio button
OFF
Select this not to overwrite each setting.
Check box
Checked
Time Adjustment among
1
OPSs*
Select this not to overwrite setting.
Check box
Unchecked
Switch/Reconnect server
2
during screens are displayed*
Select this not to overwrite setting.
Check box
Checked
User-created Screen Setting
Printer
Disk and Folder path
Related Buzzer
Related Display
*1: When the "Time Adjustment among OPSs" setting is disabled in setting data acquisition,
"Time Adjustment among OPSs" on Option Setting is switched to "Yes" when acquiring
setting data from a server.
*2: When the "Switch/Reconnect server during screens are displayed" setting is disabled in
setting data acquisition, "Switch/Reconnect server during screens are displayed" on Option
Setting is switched to "No" when acquiring setting data from a server.
9-26
9-26
9 SETTING
9.6
MELSOFT
Monitor Variable Setting
PURPOSE
Register global variables and devices as monitor variable beforehand when
monitoring process data other than tag variable.
BASIC OPERATION
1. Input the global variable or device name in the content cell of [Variable
Name/Device].
2. When specifying device name directly, select data type from the list box.
3. Set upper/lower limit as monitor variable, select digits after decimal point and
unit from the list box.
4. Setting on [Variable Name/Device] verifies project variables which are
registered on the monitor target project setting (global variables) with setting
data being input, and displays existence or nonexistence of global variables,
valid/invalid device name automatically.
5. When clicking the "Apply" button, checks whether [Variable Name/Device]
are duplicated or not, Low Limit < High Limit or not. When an error is found,
error message will be displayed.
DISPLAY/SETTING SCREEN
The icon indicates that
the variable is unusable.
Error message
display area
DISPLAY/SETTING DATA
Setting item
Description
Variable
Name/Device
Set the global variables of which elementary data type
(except ADR_REAL, STRING) are declared in
*1
programming tool or device name (Example: D100).
Input method
Input restriction
Initial setting
Text box
213 characters
----
(To the next page)
9-27
9-27
9 SETTING
Setting item
Data Type
MELSOFT
Input
method
Description
Editable only for
Select data type for direct specification of device
direct
List box
specification of
name.
device name.
Low Limit
Display a variable type (global variable/device
variable) of monitor variable.
Set the low limit as monitor variable.
High Limit
Set the high limit as monitor variable.
Variable Type
Input restriction
Text box
Text box
REAL (Single
Data type Low limit
High limit
precision floating INT/DINT/
0
100
decimal fraction) REAL
BOOL
------Editable only for
WORD
H0000
HFFFF
the data type is
INT/DINT/REAL. DWORD H00000000 HFFFFFFFF
Selectable from 0
to 4 only when
When data type is REAL : 1
the data type is
Other than the above
: --REAL.
Items set in the
unit setting (
---Section 9.12)
64 characters
----
List box
Unit
Select a unit for monitor variable.
List box
Comment
Set a comment of monitor variable.
Text box
When clicking the "Apply" button, check the
following description, and if an error is found in
the setting, the error message will be displayed.
• Whether [Variable Name/Device] are
duplicated or not.
• Whether upper/lower limit value is proper or not
Double-click an error line to display the
corresponding line of data setting grid.
*1: Device range that can be specified is as follows.
Category
• Global variable
Display the description
set on the Global
Variable Declaration
window in programming
tool
• Device
Bit device: BOOL
(Ex: M1000, D1000.1)
Word device: INT
----
Digits after
Set the digits after decimal point of monitor
Decimal Point variable.
Error
message
display area
Initial setting
Device name
Input range
Input
X0 to X1FFF
Output
Y0 to Y1FFF
Internal relay
M0 to M32767
Bit device
Latch relay
L0 to L32767
Internal user device
Annunciator
F0 to F32767
Link relay
B0 to B7FFF
Data register
D0 to D25983
Word device*
Link register
W0 to W657F
Special relay
SM0 to SM2047
Bit device
Link special relay
SB0 to SB7FF
Internal system device
Special register
SD0 to SD2047
Word device*
Link special register
SW0 to SW7FF
Direct input
DX0 to DXFFF
Direct device
Bit device
Direct output
DY0 to DYFFF
File register
Word device*
File register
ZR0 to ZR1042431
* Bit specification for word devices (After inputting period (.), specify a bit position in hexadecimal
digit with 0 to F following word device.)
The following cannot be specified.
Digit specification for bit devices (Example: K4M0)
Indirectly specified devices (@)
Index setting
9-28
Device type
9-28
9 SETTING
MELSOFT
POINT
Only registering a monitor variable will not be a communication target with PLC
for monitor tool. Registering a monitor variable in the trend setting becomes a
communication target.
For device range which can be specified, set global variable/device to monitor
1
variable within the number of device points* range registered in monitoring
target PLC.
*1: To specify, [PLC Parameter]
[Device] in GX application.
If
icon is displayed, confirm the error message to be displayed before taking
the action.
When the relevant cell (s) is (are) selected, an error message is displayed in the
status bar.
REMARK
When the variable name (global variable/direct specification of device) is specified, if
the same variable name exists in different projects, the project variable with higher
priority level will be found.
As project is concerned, the smaller [No.] is, the higher the priority will be in the
monitor target project setting. If the variable name is duplicated in duplicated project,
the form of (project name): : (variable name) should be specified to indicate the
exclusive variable.
9-29
9-29
9 SETTING
9.7
MELSOFT
Control Panel Setting
PURPOSE
To distribute the tag displayed on the control panel screen.
BASIC OPERATION
1. Input optional group name in the content cell of [Group Name].
2. Input the tag name that is assigned to the faceplate which belongs to the
group in the content cell of [Faceplate].
3. When setting the tag name, compare the device data with the tag Information
of the projects registered by monitor target project setting, and then the icon
that indicates tag existence/inexistence will be displayed automatically.
Click the "Delete" key under the condition that there is the input cell on the group
name line (multiple lines can be selected), and then all the tag including the
group-affiliated tag name will be deleted.
DISPLAY/SETTING SCREEN
The icon indicates that
the tag is unusable.
At most 500 groups can be registered
Maximum 8 tags can be registered in each group (total 8
500 = 4000 tags)
DISPLAY/SETTING DATA
Setting item
Description
Input method
Input restriction
Group name
Set the name of each group.
Text box
32 characters
Faceplate 1 to 8
Set the tag name distributed to each group affiliated faceplate.
Text box
180 characters
9-30
9-30
9 SETTING
MELSOFT
POINT
The tag name of the corresponding group cannot be set without the group name
registration.
When the settings beyond the group name without the group name registration,
error message will be displayed and the input cell will be moved to the position
of group name.
If
icon is displayed, confirm the error message to be displayed before taking
the action.
When the relevant cell (s) is (are) selected, an error message is displayed in the
status bar.
REMARK
When the tag name is specified, if the same tag name exists in different projects, the
project tag with higher priority level will be found.
As project is concerned, the smaller [No.] is, the higher the priority will be in the
monitor target project setting. If the tag name is duplicated in duplicated project, the
form of (project name): (tag name) should be specified to indicate the exclusive tag.
9-31
9-31
9 SETTING
9.8
MELSOFT
Trend Setting
PURPOSE
To set the process data item and the sampling period that are displayed on the
trend graph screen.
BASIC OPERATION
1. Input any group name in the content cell of [Group Name].
2. Select the period from the List box in the content cell of [Sampling Period].
3. Select whether the CSV files export of trend data will be executed
Section 8.7)
automatically or not. (
4. Input the assigned trend items distributed to the affiliated trend graph in the
form of (tag name). (tag data item name) for tag data item, (monitor variable
name) for monitor variable in the content cell of [Trend Graph No. *].
5. When setting the data item, compare the input set data with the tag
information of item that is registered by the monitor target project setting and
monitor variable that is validated in monitor variable setting. The icon that
indicates the existent/inexistent data item will be displayed automatically.
6. When clicking the "Apply" button, check whether the bottom limit of the Yaxis scale is lower than the top limit or not. Error message will be displayed
when error occurs. (Except for the condition that bottom limit=top limit=0)
Click the "Delete" button under the condition that there is the input cell on the
group name line (multiple lines can be selected), and then the group-affiliated
sampling period, automatic CSV files export, together with item will be deleted.
DISPLAY/SETTING SCREEN
The maximum group number to be registered is 125
At most 8 items can be registered in each group
(All together 8 125 = 1000 items)
Within the sampling period of 1s or 10s, at most 100
items can be collected.
9-32
The
icon indicates that the item is unusable.
9-32
9 SETTING
MELSOFT
DISPLAY/SETTING DATA
Setting item
Description
Input
method
Input restriction
Initial
setting
Group Name
Set the name of each group.
Text box
32 characters
Invalid characters: /,:;*?\"<>|
----
Sampling Period
Set the sampling period of the trend
data.
List box
1s/10s/1min/5min/10min
1s
Automatic CSV File
Export
Set whether the CSV file export of
trend data will be executed
automatically or not.
List box
Disable/Enable
Disable
Graph No.1 to 8
Set the item which is assigned to
the trend graph.
Text box
213 characters
----
Y-axis Scale Bottom
1
Limit *
Set the bottom limit of the Y-axis
scale which is displayed on the
trend graph.
Text box
REAL (Single precision floating
decimal fraction)
0
Y-axis Scale Top
1
Limit *
Set the top limit of the Y-axis scale
which is displayed on the trend
graph.
Text box
REAL (Single precision floating
decimal fraction)
0
*1 When the bottom limit of the Y-axis scale=0, the top limit of the Y-axis scale=0, the
bottom/top limit which is defined by the tag data item or monitor variable settings
should be used.
POINT
Make the "automatic CSV file export" setting after setting the items related to
Section 8.7 (3))
other automatic CSV file export. (
The tag data item of the corresponding group cannot be set without the group
name registration.
When the settings beyond the group name without the group name registration,
the error message will be displayed and the input cell will be moved to group
name.
For registering global variables and devices on the trend, register them on the
Section 9.6)
monitor variable setting beforehand. (
The Y-axis scale of the corresponding item cannot be set without the item
registration.
When setting the Y-axis scale without the item registration, the error message
will be displayed and the input cell will be moved to the item name.
If
icon is displayed, confirm the error message to be displayed before taking
the action.
When the relevant cell (s) is (are) selected, an error message is displayed in the
status bar.
REMARK
When the tag name is specified, if the same tag name exists in different project, the
project tag of higher priority will be found.
As project is concerned, the smaller [No.] is, the higher the priority will be in the
monitor target project setting .If the tag name is duplicated in multiple projects, the
form of (project name): :(tag name). (tag data item name) should be specified to
indicate the exclusive tag.
9-33
9-33
9 SETTING
9.9
MELSOFT
Alarm Setting
PURPOSE
To set the alarm content assigned to the alarm tag.
To display the set character string on the alarm list screen.
BASIC OPERATION
Input optional character string in the cell of [Alarm Contents].
DISPLAY/SETTING SCREEN
Maximum 10000 pieces of alarm content can be set.
DISPLAY/SETTING DATA
Setting item
Description
Input method
Input restriction
It equals to the alarm name number corresponding to
No.
the tag data (the value saved in ALM1NO to ALM8NO).
(
Alarm Contents
9-34
Input not allowed
Section 10.7)
Set the character string that displays the alarm
contents on the alarm tag faceplate.
Text box
64 characters
9-34
9 SETTING
MELSOFT
9.10 Event Setting
PURPOSE
To set the message content that is assigned to the message tag.
To display the set character string on the event list screen.
BASIC OPERATION
Input optional character string in the cell of [Message Contents].
DISPLAY/SETTING SCREEN
Maximum 10000 pieces of message content can be set.
DISPLAY/SETTING DATA
Setting item
Description
Input method
Input restriction
It equals to the message name number corresponding to
No.
the tag data (the value saved in MSG1NO to MSG8NO).
(
Message Contents
9-35
Input not allowed
Section 10.8)
Set the displayed message content on the message tag
faceplate.
Text box
64 characters
9-35
9 SETTING
MELSOFT
9.11 User-created Screen Setting
PURPOSE
Assign monitoring applications to user-created screen buttons on the monitor
toolbar.
Section 11.1) or Microsoft Visual
Programs created with GT SoftGOT (
Section 11.2) can be assigned as applications.
Basic (
R
R
BASIC OPERATION
1. Click the button of [Application] cell and the file selection dialog box will be
displayed.
2. Select "Application" on the file of file selection dialog box. Click the "Open"
button and then the application program path will be input in the cell.
3. Set the starting argument in the cell of [Argument] according to the need of
the application program.
DISPLAY/SETTING SCREEN
Error message
display area
There are 4 execution application programs that can be registered.
They are assigned to the display button 1 to 4 of the user application which is affiliated to
the monitor toolbar in turn. The assignment starts from No.1.
9-36
9-36
9 SETTING
MELSOFT
DISPLAY/SETTING DATA
Setting item
Description
Input method
No.
It equals to the number 1 to 4 of the user-created screen
Input not allowed
button.
Application
Set the path of the application program that is assigned
to the user-created screen display button of the monitor
toolbar.
Argument
Detail
Input restriction
File Selection
Dialog Box
The maximum
character number of
the path is 255
Set the argument number given to the application. *
Text box
255 characters
Displays the Detail setting of the user-created screen
2
dialog box by clicking the "Setting…" button. *
(
(1), (2) in this Section)
Dialog Box
1
----
When clicking the "Apply" button, check the following
description, and if an error is found in the setting, the
error message will be displayed.
• Whether the settings of "Changes the security level"
are different when GT SoftGOT1000 where the same
module number is specified is registered to multiple
rows.
Error message
display area
• Whether the settings of "Changes the security level"
are different when GT SoftGOT2000 where the same
module number is specified is registered to multiple
rows.
• Whether the content of Detail setting of the security
level is different when GT SoftGOT1000 where the
same module number is specified is registered to
multiple rows.
• Whether the content of Detail setting of the security
level is different when GT SoftGOT2000 where the
same module number is specified is registered to
multiple rows.
Double-click an error line to display the corresponding
line of user-created screen setting grid.
*1: When the file path of GT SoftGOT is set to Application, specifies the module
number of GT SoftGOT to be started.
Default of the argument is "-SGT1".
For details, refer to the following manuals.
• GT SoftGOT2000 Version1 Operating Manual
• GT SoftGOT1000 Version 3 Operating Manual for GT Works3
• GT SoftGOT1000 Version 2 Operating Manual
*2: When the file path of GT SoftGOT is set to Application, the <<GT SoftGOT>> tab
is added in the detail setting dialog box of the user-created screen.
9-37
9-37
9 SETTING
MELSOFT
(1) Detail setting for GT SoftGOT
The following shows the Detail setting dialog box for GT SoftGOT.
(a) Setting in the <<General>> tab
Description
Input
restriction
Initial setting
Does not close
when switching
Monitor Window.
Does not close GT SoftGOT assigned to the user-created screen button
when switching the monitor screen in single-window mode.
Note, however, that GT SoftGOT1000 closes regardless of this setting
when the setting window is displayed or the monitor tool is exited.
----
Checked
Time-out Setting
(Seconds)
Set the time that the Monitor tool waits for GT SoftGOT to be closed
1
when closing GT SoftGOT. *
1 to 99
30 seconds
Item
*1: GT SoftGOT is closed automatically in the following cases:
• when the monitor screen is switched in single-window mode
• when the setting window is displayed
• when the Monitor tool is exited
9-38
9-38
9 SETTING
MELSOFT
(b) Setting in the <<Display>> tab
Item
Description
Input method Input restriction
Set the path of icon file for the user-created screen display button of the monitor
toolbar.
The following are the format of graphics file that can be used as an icon.
Icon file
File format
Extension
Bitmap
.bmp
1
Icon *
.ico
The maximum
File Selection character
Dialog Box
number of the
path is 255
When the file path is blank or incorrect, the icon of application registered to the
user-created screen is displayed as a user-created screen button.
Set the character strings of tooltip displayed when placing the mouse on the
user-created screen button.
The following character strings are displayed when a text box is blank.
Button
Tooltip
Tooltip
User-created screen button1
User-created Screen1
User-created screen button2
User-created Screen2
User-created screen button3
User-created Screen3
User-created screen button4
User-created Screen4
Text box
64 characters
*1: For Microsoft Windows NT Workstation 4.0 Operating System, only
2-color (black and white), 16-color and 256-color icon files are
supported.
R
R
POINT
The icon size is enlarged/reduced in accordance with range of resolution (pixel) of
display as shown in the table below.
Range of resolution
9-39
Icon size (pixel)
1280 pixel or more
48 48
Less than 1280 pixel
32 32
9-39
9 SETTING
MELSOFT
(c) Setting in the <<GT SoftGOT>> tab
Item
Description
Switches the base
screen
Set whether to switch the base screen to the specified one when GT
SoftGOT is started or activated.
Base screen No.
Set the base screen number to be displayed when GT SoftGOT is
started or activated.
Input restriction Initial setting
----
Checked
1 to 32767
1
----
Unchecked
Changes the security Select whether to change the security level of GT SoftGOT in
level
accordance with user authority of the monitor tool operation.
"Detail setting" button Displays the Detail Setting of the security level dialog box.
(d) Detail Setting of the security level dialog box
Item
GT SoftGOT security
level
Description
Set the security levels of GT SoftGOT that correspond user
authority.
Input restriction
0 to 15
The following
user authority is
read-only items.
• Engineer
• Lock
Initial setting
Engineer
15
Operator4 12
Operator3
9
Operator2
6
Operator1
3
Lock
0
"Restore default" button Return setting content to the initial setting.
9-40
9-40
9 SETTING
MELSOFT
(2) Detail setting for other than GT SoftGOT
The following shows the Detail setting dialog box for applications other than GT
SoftGOT.
Item
Description
Does not close
when switching
Monitor Window.
Does not close an application assigned to the user-created screen
button when switching the monitor screen in single-window mode.
Note, however, that GT SoftGOT closes regardless of this setting when
the setting window is displayed or the monitor tool is exited.
Time-out Setting
(Seconds)
Set the time that the Monitor tool waits for an application to be closed
1
when closing the application. *
Input
restriction
Initial setting
----
Unchecked
1 to 99
5 seconds
*1: An application is closed automatically in the following cases:
• when the monitor screen is switched in single-window mode
• when the setting window is displayed
• when the Monitor tool is exited
POINT
The argument cannot be set without the application registration.
When setting argument without the application registration, error message will
be displayed and the input cell will be moved to the application program.
In the exe form, the application program sold in the market can be registered
even if the user does not user-created screen. But the maximum number
restriction limitation displayed on the screen will not change even if the
Section 6.4.2)
registered application is not related to the monitor. (
When the application is changed or deleted, the argument and initial setting are
initialized.
When "Privilege Level" of the application is specified to "Run this program as an
administrator", "Privilege Level" of the monitor tool also needs to be specified to
"Run this program as an administrator".
For the method to execute programs as an administrator, refer to Section 5.1.
The following are the range of module number that can be specified for
argument of GT SoftGOT.
GT SoftGOT1000 Version 2.47X to 3.18U earlier : 1 to 99
GT SoftGOT1000 Version 3.19V or later
: 1 to 32767
GT SoftGOT2000 Version 1.105K or later
: 1 to 32767
9-41
9-41
9 SETTING
MELSOFT
9.12 Unit Setting
PURPOSE
Set the unit name that indicates the tag data item.
BASIC OPERATION
Input optional unit character string in the cell of [Unit].
DISPLAY/SETTING SCREEN
127 units can be set.
DISPLAY/SETTING DATA
Setting item
Description
Input method
No.
It equals to the unit number specified by the tag data.
Input not allowed
Unit
Set the unit used.
Text box
9-42
Input restriction
8 characters
9-42
9 SETTING
MELSOFT
9.13 Faceplate Display Pattern Setting
PURPOSE
To set the status button, as well as the character string and background color
pattern of the status display (indicator), which are displayed on the loop tag
faceplate and status tag faceplate.
To set the pattern number for the display name pattern (FPNO, FPNO1 to
FPNO5) which is affiliated to the tag data item by using the FB property of the
programming tool. The pattern of the displayed character string and background
color corresponding to the set pattern number can be displayed on the status tag
faceplate.
Furthermore, the character string is recorded as the operation record character
Section 7.4).
string on the event list (
BASIC OPERATION
1. Select the tag type in the list box 1) and then the bit map corresponding to
the tag type will be displayed on the tag type faceplate image 2).
The item displayed in the grid is switched according to the tag type.
2. Input the character string that is assigned to the status button and indicator of
the faceplate in each cell.
3. Click the button to the right of the cell and then the "Change Background
Color/Text Color" dialog box will be displayed. If the color is selected, click
the "OK" button and then the background color and text color of the set cell
will be displayed. (Trip display and time-out display are displayed by the
faceplate alarm graph color, so they cannot be set)
DISPLAY/SETTING SCREEN
1)
Click the button and then the color
dialog box will be displayed
2)
<The Change Backgroud Color
/Text Color dialog box>
9-43
9-43
9 SETTING
MELSOFT
1) The list box of the tag type selection
Select the tag type of the set name pattern (PVAL, HTCL, NREV, REV,
MVAL1, MVAL2, PB).
For the details of relating display content, refer to the following.
Display content
Status operation
Command button operation
PVAL
HTCL
NREV, REV, MVAL1, MVAL2
PB
Reference
Section 10.3.13
Section 10.3.14
Section 10.5.13
Section 10.5.14
Section 10.6.1
Section 10.6.3
2) Tag type faceplate image
Display the screen display image of the tag type that is affiliated to the set
name pattern.
Each tag type can set maximum 50 pieces of name patterns.
The tag type PB can be set maximum 10000 pieces of button patterns.
DISPLAY/SETTING DATA
The set item and initial set of each tag type are shown as the following chart.
Tag
type
PVAL
HTCL
9-44
Initial setting
Setting item
Description
Character
Text color
Background
color
Open Button
Set the Button name and status display color.
Open
Black
Red
Close Button
Set the Button name and status display color.
Close
Black
Red
Stop Button
Set the Button name and status display color.
Stop
Black
Remote Display
Set the indicator name and status display color.
Remote
Black
Green
Local Display
Set the indicator name and status display color.
Local
Black
Green
Trip Display
Set the indicator name.
Trip
Black
Time-out Display
Set the indicator name.
Time-out
Black
Open/Close
Status History
Select whether to always leave the open/close
status history or leave it only in the MAN mode.
Always
Using the PID
Cooling
Set the indicator name and status display color.
COOL
Black
Light blue
Using the PID
Heating
Set the indicator name and status display color.
HEAT
Black
Red
Cooling Close
Direction
Set the character string for cooling close
direction.
Blank
Cooling Open
Direction
Set the character string for cooling open
direction.
Blank
Heating Close
Direction
Set the character string for heating close
direction
Blank
Heating Open
Direction
Set the character string for heating open
direction
Blank
Input method
Input
restriction
Character:
Text box
Color:
the Change
Background
Color/Text Color
dialog box (color
dialog box)
8 characters
List box
Always/
Only MAN
Mode
Character:
Text box
8 characters
Color:
the Change
Background
Color/Text Color
dialog box (color
dialog box)
2 characters
9-44
9 SETTING
Tag
type
NREV
Initial setting
Setting item
MVAL2
Character
Text color
Background
color
Set the Button name and status display color.
Start
Black
Red
Stop Button
Set the Button name and status display color.
Stop
Black
Red
Remote Display
Set the indicator name and status display color.
Remote
Black
Green
Local Display
Set the indicator name and status display color.
Local
Black
Green
Trip Display
Set the indicator name.
Trip
Black
Time-out Display
Set the indicator name.
Time-out
Black
Set the Button name and status display color.
FWD Run
Black
Red
Set the Button name and status display color.
Stop
Black
Red
Set the Button name and status display color.
REV Run
Black
Red
Remote Display
Set the indicator name and status display color.
Remote
Black
Green
Local Display
Set the indicator name and status display color.
Local
Black
Green
Trip Display
Set the indicator name.
Trip
Black
Black
Stop Button
MVAL1
Description
Operation Button
Forward Run
Button
REV
MELSOFT
Reverse Run
Button
Time-out Display
Set the indicator name.
Time-out
Open Button
Set the Button name and status display color.
Open
Black
Red
Close Button
Set the Button name and status display color.
Close
Black
Red
Semi-open
Display
Set the indicator name and status display color.
Semiopen
Black
Red
Remote Display
Set the indicator name and status display color.
Remote
Black
Green
Local Display
Set the indicator name and status display color.
Local
Black
Green
Trip Display
Set the indicator name.
Trip
Black
Time-out Display
Set the indicator name.
Time-out
Black
Open Button
Set the Button name and status display color.
Open
Black
Red
Close Button
Set the Button name and status display color.
Close
Black
Red
Stop Button
Set the Button name and status display color.
Stop
Black
Semi-open
Display
Set the indicator name and status display color.
Semiopen
Black
Red
Remote Display
Set the indicator name and status display color.
Remote
Black
Green
Local Display
Set the indicator name and status display color.
Local
Black
Green
Trip Display
Set the indicator name.
Trip
Black
Time-out Display
Set the indicator name.
Time-out
Black
ON Name
Set the ON status name and display color.
ON
Black
Red
OFF Name
Set the OFF status name and display color.
ON
Black
Gray
ON/OFF History
Type
Select whether to store only ON history or both
ON and OFF history at time of button operation
and status change of the status answer (DIM),
against each button.
Only ON
PB
Input method
Input
restriction
Character:
Text box
Color:
the Change
Background
Color/Text Color
dialog box (color
dialog box)
List box
8 characters
Only ON/
Both ON and
OFF
Trip display and time-out display are displayed with the alarm color of the
faceplate, so the color does not need to be set. According to the alarm level of
trip and time-out, major alarm color is displayed when major alarm occurs and
minor alarm color is displayed when minor alarm occurs.
For details of setting of alarm display color, refer to "Section 9.17 Option Setting".
POINT
The background color/text color which equals to those of the first line (No.1) will
all be set automatically if new character string is input in certain line.
Only character string can be cut/copied/pasted.
(The color setting is excluded)
9-45
9-45
9 SETTING
MELSOFT
9.14 Faceplate Display Scale Setting
PURPOSE
To set the display scale, division number, display direction and both direction
base point of the PV graph that are displayed on the faceplate.
To set when the initial set content changed.
BASIC OPERATION
1. Set optional tag name in [Tag Name].
2. When setting the tag name, the tag information of the item that is registered
by the monitor target project setting will be compared with the input set data.
And then the mark that indicates tag existent/inexistent will be displayed
automatically.
3. Input the display scale top/bottom limit, division number, display direction and
base point when both direction is set of the set tag.
4. Click the "Apply" Button and check whether the bottom limit of the display
scale is less than the top limit. The error message will be displayed when
error occurs.
When the tag name is deleted, the display scale top/bottom limit, division
number, display direction and base point when both direction is set are also
deleted simultaneously.
DISPLAY/SETTING SCREEN
The icon indicates
that the tag is unusable.
Maximum 3840 pieces of tag can be registered
Setting !
Display on faceplate
Display
scale
Base point
when both
direction
is set
When display direction is
set to "Positive direction"
9-46
When display direction is
set to "Negative direction"
When display direction is
set to "Both direction"
9-46
9 SETTING
MELSOFT
DISPLAY/SETTING DATA
Setting item
Description
Input
method
Input restriction
Initial
setting
Tag Name
Set the tag name of the display scale.
Text box
180 characters
----
Display Scale Bottom
Limit
Set the display scale bottom limit of the PV
graph which is displayed on the faceplate.
Text box
REAL (Single precision
floating decimal)
0
Display Scale Top Limit
Set the display scale top limit of the PV
graph which is displayed on the faceplate.
Text box
REAL (Single precision
floating decimal)
100
Division Number
Set the division number of the PV graph
which is displayed on the faceplate.
Text box
1 to 10
10
Display Direction
Set the display direction of the PV graph
bar to be displayed on the faceplate.
List box
Positive direction/
Negative direction/
Both direction
Base Point when Both
Direction is set
When setting "Both direction" as the display
direction, set the base point of the PV
graph bar to be displayed on the faceplate.
This setting is available only when "Both
direction" is set as the display direction.
Text box
REAL (Single precision
floating decimal)
Positive
direction
0
POINT
The display scale top/bottom limit, division number, display direction and "base
point when both direction is set" cannot be set without registering the tag name.
When "Both direction" is set as the display direction, set the both direction base
point within the range indicated below.
Display scale bottom limit ≤ base point when both direction is set ≤ display scale
top limit
If
icon is displayed, confirm the error message to be displayed before taking
the action.
When the relevant cell (s) is (are) selected, an error message is displayed in the
status bar.
9-47
9-47
9 SETTING
MELSOFT
9.15 Faceplate MV Characters Setting
PURPOSE
To set the MV characters of the MV graph which is displayed on the faceplate.
BASIC OPERATION
1. Set optional tag name in the cell of [Tag Name].
2. When setting the tag name, the tag information of the project that is
registered by the monitor target project setting will be compared with the
input setting data. And then the mark that indicates tag existence/inexistence
will be displayed automatically.
3. Input the displayed character string of the set tag.
The displayed character string will be deleted when the tag name is deleted.
DISPLAY/SETTING SCREEN
The icon indicates
that the tag is unusable.
Maximum 3840 pieces of tag can be registered
Display character
string
<MV graph>
DISPLAY/SETTING DATA
Setting item
Input method
Input restriction
Tag name
Set the tag name of the open/close direction display
character.
Description
Text box
180 characters
Displayed character
string (0%)
Set the display character on the 0% position of the MV graph
which is displayed on the faceplate.
Text box
2 characters
Displayed character
string (100%)
Set the display character on the 100% position of the MV
graph which is displayed on the faceplate.
Text box
2 characters
POINT
The displayed character strings cannot be set without the tag name registration.
When doing setting beyond the tag name without tag name registration, error
message will be displayed and the input cell will be moved to the position of tag
name.
If
icon is displayed, confirm the error message to be displayed before taking
the action.
When the relevant cell (s) is (are) selected, an error message is displayed in the
status bar.
9-48
9-48
9 SETTING
MELSOFT
9.16 Lockout Tag Setting
PURPOSE
Set the lockout tag types which are used on the faceplate of the monitor window.
Lockout tag is used when operation limit is put on the control device. As the
monitor tool is concerned, operation limit is added by the operation of lockout tag
on the faceplate.
Lockout tag has levels of engineer and operator1 to 4.
The lockout tag where the operation of setting/removing is authorized can be
operated.
The authority of operation for setting/removing lockout tag can be set on User
Section 9.2).
Authority Setting (
BASIC OPERATION
1. Input the character string that indicates the lockout tag name in the cell of
[Lockout Tag Name].
2. Click the Button right to the cell and then the "Change Background Color/Text
Color" dialog box will be displayed. Select the color and click the "OK" Button,
then the background color and text color of the cell will be displayed as the
set color.
3. Set the authority of user who can operate the lockout tag on the list box of
the [Level] cell.
Graph color, background color and level will be deleted when the Lockout tag
name is deleted.
DISPLAY/SETTING SCREEN
The color dialog box will be displayed
after clicking the button
<The Change Background Color
/Text Color dialog box>
Maximum 32 kinds of tags can be set
Lockout Tag
The lockout tag is displayed in the
lockout tag area at the top of the
faceplate.
POINT
When inputting the new character string to the lockout tag name, the background
color which is the same as that of the first line (No. 1) will be set automatically.
9-49
9-49
9 SETTING
MELSOFT
DISPLAY/SETTING DATA
Setting items of each lockout tag is shown as the following chart.
Setting item
Description
Set the character string that is displayed on
the lockout tag.
Lockout
Tag
Name
Text color
Set the displayed text color of the lockout tag.
Background color
Set the background color of the lockout tag.
Input method
Text box
Input restriction
8 characters
Change Background
Color/Text Color
—
dialog box
Engineer/
Set the authority of user who can operate the
Level
lockout tag.
(User authority is defined by the user setting)
Operator4/
List box
Operator3/
Operator2/
Operator1
POINT
Text color, background color and level cannot be set without the lockout tag
name registration.
When doing setting beyond lockout tag name without the lockout tag name
registration, error message will be displayed and the input cell will be moved to
the position of lockout tag name.
REMARK
The lockout tag setting can be operated on the faceplate.
Click the display area of lockout tag on the faceplate without the lockout tag setting;
the "Select Lockout Tag" dialog box and the set ticket list will be displayed.
The lockout tag that can be set/removed with the current user authority is displayed.
9-50
9-50
9 SETTING
MELSOFT
9.17 Option Setting
PURPOSE
Option setting refers to all the setting of the displayed text font, the buzzer sound
of alarm, the graph color of faceplate and other items that can be set on the
monitor tool.
Items that can be set by the option setting function are shown in the following
chart.
Classification item
Setting item
Setting window font
Monitor window font
Printer
Window mode
Minor alarm color
Major alarm color
General
Return check interval (S)
Return check time-out (S)
PLC status check interval(s)
Write tag data (even if the PC's and PLC's project ID codes are different)
Automatic CSV file deletion time (0 to 23)
Disk free space check size (MB)
Exit monitor tool when windows logoff or shutdown
Server/Client
Time Adjustment among OPSs
Alarm/Event display on 2nd line of monitor toolbar
Alarm/Event display format of monitor toolbar
Highlighted display while alarms occur
Event notification UDP port No.(HEX)
Automatic alarm CSV file export
Automatic alarm CSV file deletion
Alarm CSV file storage period (days)
General
Automatic alarm CSV file export target folder
Tag Data Item Display of Alarm
Unconfirmed Alarms Deletion at Delete Recovered Alarms
Automatic event CSV file export
Alarm/Event
Automatic event CSV file deletion
Event CSV file storage period (days)
Automatic event CSV file export target folder
Tag Data Item Display of Event
Unconfirmed Events Deletion at Delete All
Buzzer type
Minor alarm
Beep sound time interval
Beep sound frequency
Sound file
Major alarm
(The items same as those of the minor alarm)
Event
(The items same as those of the minor alarm)
(To the next page)
9-51
9-51
9 SETTING
MELSOFT
Classification item
Setting item
SV limit excess setting
Background color
Text color
Alarm area color (No alarm)
Button text color
Button background color
PV bar positive direction color
PV bar negative direction color
Faceplate
PV bar both direction color (Positive)
PV bar both direction color (Negative)
PV High/Low limit value bar color
PV High High/ Low Low limit value bar color
SV/MV limit value bar color
SV/MV pointer color
SV (target) pointer color
MV status color
Frame color (No lockout tag)
Item name display
Gridline
Gridline color
Background color
Graph 1 to 8 colors
Trend Graph
Trend binary data storage folder
Automatic trend CSV file export target folder
Automatic trend CSV file export file name
Automatic trend CSV file export time (0 to 23)
Automatic trend CSV file deletion
Trend CSV file storage period (days)
9-52
9-52
9 SETTING
MELSOFT
(1) General
Set the common items of the monitor tool general function and set the items that
cannot be particularly classified by monitor tool general function.
DISPLAY/SETTING SCREEN
DISPLAY/SETTING DATA
Setting item
Description
Input method
Input limit
Initial setting
Setting Window
1
Font*
Set the font used on the monitor
setting window.
List box
The font list of the
personal computer
Arial
Monitor Window
1
Font*
Set the font used on the monitor
window.
List box
The font list of the
personal computer
Arial
Printer*
Set the printer used in printing.
List box
The printer list of the
personal computer
(Default Printer)
Window Mode
Select window mode.
List box
Multi-window/Single
window
Multi-window
Minor Alarm Color
Set the graph color of Minor alarm.
Color dialog box
—
Green
Major Alarm Color
Set the graph color of Major alarm.
Color dialog box
—
Red
Return Check
Interval (s)
When communication open error
occurs, set the interval seconds
return check communication return
check of the CPU module with
error. (
Appendix 1.8)
Text box
10 to 3600
60
Return Check
time-out (s)
Set the time-out seconds of
communication return check.
(
Appendix 1.8)
Text box
1 to 60
2
PLC Status Check
Interval (s)
Set the interval (s) for making PLC
status check, such as PLC CPU
error. (
Appendix 1.9)
Text box
1 to 10
2
Write tag data
(even if the PC's
and PLC's project
ID codes are
different)
Set whether tag data write will be
made valid or not at occurrence of
the alarm for project ID code
inconsistency. (
Section 7.3)
List box
Invalid/Valid
Valid
1
(To the next page)
9-53
9-53
9 SETTING
MELSOFT
Setting item
Description
Input
method
Input limit
Initial setting
Automatic CSV File Set the time when the CSV files output by
automatic CSV file export will be deleted (0 minutes Text box 0 to 23
Deletion Time
every hour). (
(0 to 23)
Section 8.7)
0
Disk Free Space
Check Size (MB)
Set the disk free space check size of the disk drive
that stores CSV files output by the PX Developer
installation destination, trend data and automatic
CSV file export.
When the free space of the disk drive decreases to
or below the setting, the alarm for disk free space
error occurs. (
Section 7.3)
50
Exit monitor tool
when windows
logoff or shutdown
For the end operation of monitor tool when logging
R
off or shutting down Windows , set whether to
operate according to the user authorization of the
current user.
Text box 50 to 1024
List box
Follow the user
authority setting/
Not follow the
user authority
setting
Follow the user
authority setting
*1: The content set in the personal computer is displayed in the font list and the
printer list. The detailed setting of the printer is set on the setting window of
personal computer. (Except the tag monitor display area of pop-up tuning)
The font size will be selected automatically according to the window size.
The character string of the button, the tab title and the list is change by the
monitor window font. The displayed character string on the faceplate cannot
change the font.
The font name of 33 characters or more cannot be selected.
POINT
Write tag data (even if the PC's and PLC's project ID codes are different)
(
Appendix 1.9) is "Enable" (write enabled status) in the initial setting.
If tag data write is performed when the project ID code inconsistency, the system
may malfunction.
Change this setting of write tag data (even if the PC's and PLC's project ID codes
are different) to "Disable" (write disabled status) when operation has been started
after completion of system adjustment.
9-54
9-54
9 SETTING
MELSOFT
(2) Server/Client
DISPLAY/SETTING SCREEN
DISPLAY/SETTING DATA
Setting item
Content
Input method
Input limit
Initial setting
Time Adjustment
among OPSs
Set whether to adjust the time of client/secondary
server to that of connecting server (primary server) in
1
the server/client configuration.*
List box
No/Yes
Yes
Switch/Reconnect
server during
screens are
displayed
In the server/client configuration, set whether to
switch/reconnect the server if the monitor screen or
1
the setting screen is being displayed.*
List box
No/Yes
No
*1:When Monitor Tool Execution Type Setting is standalone/server (primary server),
"------" is displayed, and cannot be edited.
POINT
Setting "Time Adjustment among OPSs" to "Yes" on Option Setting is
recommended. Set to "No" only when another time adjustment system such as
SNTP is applied. Note when setting to "No" on "Time Adjustment among OPSs"
of Option Setting, setting to enable on Detail setting of overwriting the setting
data of Monitor Tool Execution Type Setting is required.
When setting to "Yes" on "Switch/Reconnect server during screens are
displayed" of Option Setting, setting to enable on Detail setting of overwriting
the setting data of Monitor Tool Execution Type Setting is required.
9-55
9-55
9 SETTING
MELSOFT
(3) Alarm/Event
Set the items that is related to display or beep sound when alarm or event occurs.
The setting of "Event Notification UDP Port No.(HEX)" must be confirmed.
DISPLAY/SETTING SCREEN
DISPLAY/SETTING DATA
Setting item
General
Alarm/Event Display
on 2nd Line of
Monitor Toolbar Bar
Alarm/Event Display
Format of Monitor
Toolbar Bar
Highlighted display
while alarms occur
Description
Input
method
Input restriction
Initial
setting
Set the display of alarm or event on the
second line of alarm/event display area
in the monitor toolbar.
List box Alarm/event
Set the display format of the alarm/event
display area of the monitor toolbar.
Tag Name/Tag
List box Comment/Tag Name + Tag Name
Tag Comment
Set whether the tag name of alarm list is
displayed in a high- lighted way or not
while alarm occurs.
List box
None/
Available
Alarm
None
(To the next page)
9-56
9-56
9 SETTING
MELSOFT
Setting item
Description
Event Notification
Set the UDP port number of Change
UDP Port No.(HEX) notification on the CPU module which is
*1
connected with Ethernet.
Automatic Alarm
Set whether automatic alarm CSV file export
CSV File Export
will be executed or not.
Automatic Alarm
Set whether alarm CSV file will be deleted
CSV File Deletion
automatically or not.
Set the storage period of CSV files output by
Alarm CSV File
automatic alarm CSV file export.
Storage Period
When "Automatic alarm CSV file deletion" is
"Enable", files that have passed the storage
(days)
period are automatically deleted.
Input
method
H0401 to
HFFFF
H1000
List box
No/Yes
No
List box
No/Yes
No
Text box
1 to 2000
2000
Set the destination folder to which the CSV
files will be output by automatic alarm CSV
file export.
Folder
selection
dialog box
General
Tag Data Item
(Continued) Display of Alarm
Set the display format of tag data items
displayed on the alarm contents field of the
Alarm List screen and the alarm/event
display area of the monitor toolbar.
List box
Set whether to delete the unchecked rows
when deleting the alarm data.
List box
Event CSV File
Storage Period
(days).
Automatic Event
CSV File Export
2
Target Folder *
Set whether automatic event CSV file export
List box
will be executed or not.
Set whether event CSV file will be deleted
List box
automatically or not.
Set the storage period of CSV files output by
automatic event CSV file export.
When "Automatic event CSV file deletion" is Text box
"Enable", files stored longer than the set
period are automatically deleted.
Set the destination folder to which the CSV
files will be output by automatic event CSV
file export.
Initial
setting
Text box
Automatic Alarm
CSV File Export
2
Target Folder *
Unconfirmed Alarms
Deletion at Delete
Recovered Alarms
Automatic Event
CSV File Export
Automatic Event
CSV File Deletion
Input
restriction
Folder
selection
dialog box
200
3
characters*
Invalid
characters:
/,:;*?\"<>|
Item Name/
Detailed
Name/
Item Name
(Detailed
Name)
(No
setting)
Item
Name
No/Yes
Yes
No/Yes
No
No/Yes
No
1 to 2000
2000
200
3
characters*
Invalid
characters:
/,:;*?\"<>|
(No
setting)
*1: "Open Setting" of Ethernet by the network parameter of GX application, "Event
Notification UDP Port No.(HEX) " becomes the setting value of "Destination Port
No.".
If Microsoft Windows XP cannot receive event notification, it may be caused
by the setting of Windows firewall.
For details, refer to the POINT in Appendix 1.2.2.
*2: When no folder is set to this item, CSV files are export to the "AlarmCSV" or
"EventCSV" folder given in Section 2.3.
*3: Up to 255 characters with the monitor tool of PX Developer Version 1.04E or
earlier and up to 225 characters with the monitor tool of PX Developer Version
1.06G to 1.20W. Data can be read with PX Developer Version 1.23Z or later
even if the number of input characters exceed the limit.
(To the next page)
R
R
R
9-57
9-57
9 SETTING
MELSOFT
Setting item
General
(Continued)
Input
method
Description
Tag Data Item
Display of Event
Set the display format of tag data items
displayed on the event message, status, set List box
value field of the Event List screen.
Unconfirmed
Events Deletion
at Delete All
Set whether to delete the unchecked rows
when deleting the event data.
Set whether the buzzer buzzes or not when
alarm occurs. (Beep/Sound)
Set the beep sound timer interval. In the
Beep Sound
case of "sound", repeat play the content of
Time Interval
specified sound file in the set time.
Set the beep sound frequency when alarm
Beep Sound
occurs. (Unit: Hz)
Frequency
Set when the buzzer type is <Beep>.
Set the sound file to be played when alarm
occurs.
Sound File
Set when the buzzer type is <sound>.
(The items same as those of the minor alarm)
(The items same as those of the minor alarm)
Buzzer Type
4
Minor alarm*
4
Major alarm*
4
Event*
Input
restriction
Item Name/
Detailed
Name/
Item Name
(Detailed
Name)
Initial
setting
Item
Name
List box
No/Yes
Yes
List box
None/Beep/
Sound
None
Text box
1 to 99999
10
Text box
50 to 10000
2000
File
selection
dialog box
The file whose
(No
extension is
setting)
WAV
*4: The buzzer alarm sound is set according to minor alarm, major alarm and event.
Types of the buzzer sound can be selected from the beep sound and sound file.
If the "Beep" sound is selected, [Beep Sound Timer Interval] and [Beep Sound
Frequency] should be specified. If the sound file is selected, [Beep Sound Timer
Interval] and [Sound File] should be specified.
Item which needs to be set (classified in terms of buzzer type)
Buzzer type
Setting item
None
Beep
Sound
Beep Sound Timer Interval
Beep sound frequency
Sound file
( : Need to be set,
: Cannot be set)
POINT
Make the "Event notification UDP Port No.(HEX)" setting not to overlap on wellknown port numbers and any port numbers used by software other than the
monitor tool.
Make the "automatic CSV file export" setting after setting the items related to
Section 8.7 (3))
other automatic CSV file export. (
9-58
9-58
9 SETTING
MELSOFT
(4) Faceplate
Set the graph color of the faceplate. The initial setting of it can be usual as it was.
DISPLAY/SETTING SCREEN
Text
No alarm
PV High High/Low
Low limit value Bar
Background
PV High/Low
limit value Bar
PV value bar
SV (target) pointer
SV pointer
SV limit value bar
Button text
Button background
MV status text
MV pointer
MV limit value bar
Background color : black
Text color
: gray
(Initial setting)
9-59
Background color : gray
Text color
: black
9-59
9 SETTING
MELSOFT
DISPLAY/SETTING DATA
Setting item
Description
Input
method
Input
restriction
Initial
setting
SV Limit Excess Setting
When SV value is set in a faceplate, set input
availability (Enable/Disable) of the value exceeding
SL and SH.
List box
Background Color
Set the whole background color of the faceplate.
Color
dialog box
—
Black
Text Color
Set the text color of the faceplate.
Color
dialog box
—
White
Alarm Area Color
(No Alarm)
Set the text color of the alarm display area when no
alarm occurs.
Color
dialog box
—
Dark gray
Button Text Color
Set the text color of the button.
Color
dialog box
—
Black
Button Background Color
Set the background color of the button.
Color
dialog box
—
Gray
PV Bar Positive Direction
Color
Set the PV bar display color when the display
direction of the faceplate display scale setting is
"positive direction".
Color
dialog box
—
Green
PV Bar Negative Direction
Color
Set the PV bar display color when the display
direction of the faceplate display scale setting is
"negative direction".
Color
dialog box
—
Green
PV Bar Both Direction
Color (Positive)
Set the PV bar display color when the display
direction of the faceplate display scale setting is
Color
"both direction". (Display color when the PV is equal
dialog box
to or greater than the "Base point when both
direction is set".)
—
Green
PV Bar Both Direction
Color (Negative)
Set the PV bar display color when the display
direction of the faceplate display scale setting is
"both direction". (Display color when the PV is less
than the "Base point when both direction is set".)
Color
dialog box
—
Green
PV High/Low Limit Value
Bar Color
Set the graph color of PV high/low limit value
display bar range.
Color
dialog box
—
Yellow
PV High High/Low Low
Limit Value Bar Color
Set the graph color of PV high high/low low limit
value display bar range.
Color
dialog box
—
Red
SV/MV Limit Value Bar
Color
Set the display color of SV/MV limit value range.
Color
dialog box
—
Dark green
SV/MV Pointer Color
Set the graph color of pointer the SV/MV graph.
Color
dialog box
—
Yellow
SV (Target) Pointer Color
Set the display color for SV (target) pointer of a
faceplate (used only for the tag type 2PIDH).
Color
dialog box
—
Light blue
MV Status Color
Set the background color for MV status display of a
faceplate.
Color
dialog box
—
Light blue
Frame Color
(No Lockout Tag)
Set the frame color of the faceplate.
Color
dialog box
—
Gray
9-60
Valid/Invalid Valid
9-60
9 SETTING
MELSOFT
REMARK
When the I/O mode display area of the faceplate is NOR, the graph color is the
same as that of normal button. When the area is SIM/OVR/TSTP, the different
specified color will be displayed.
NOR
SIM
OVR
TSTP
Text color
Button text color
White
Black
Black
Background color
Button background color
Blue
Light blue
White
The graph color of the alarm display area is shown as the following chart according
to whether alarm occurs or not.
Minor alarm color and major alarm color are set by the Option Setting (General).
No alarm
Minor alarm
Major alarm
Text color
No alarm color
Black
Black
Background color
Background color
Minor alarm color
Major alarm color
I/O display area
Alarm display area
9-61
9-61
9 SETTING
MELSOFT
(5) Trend Graph
Set the graph color of the trend graph or use the initial set color.
DISPLAY/SETTING SCREEN
DISPLAY/SETTING DATA
Setting item
Description
When the trend graph is displayed, select the
Item Name Display column to be displayed on the Cursor position
data display grid.
Input method
Input limit
Initial setting
List box
Item Column/
Comment
Column/
Item +
Comment
Column
Available/None Available
Item Column
Gridline
Set whether the gridline is added to the trend
graph.
List box
Gridline Color
Set the color of the gridline.
Color dialog box
—
Dark gray
Background Color
Set the background color of the graph.
Color dialog box
—
Black
Graph 1 to 8 Color
Set the line color of the graph.
Color dialog box
—
1
Green
2
Red
3
Yellow
4
Light blue
5
Blue
6
Magenta
7
White
8
Orange
(To the next page)
9-62
9-62
9 SETTING
MELSOFT
Setting item
Description
Input method
Input limit
200
2 3
characters* ,*
Invalid
characters:
/,:;*?\"<>|
Initial setting
Trend Binary Data
Storage Folder
Set the folder path that saves the trend
binary data collection file.
Folder
selection
dialog box
Automatic Trend CSV
File Export Target
Folder
Set the destination folder to which the
CSV files will be output by automatic
trend CSV file export.
Folder
selection
dialog box
200 characters*
Invalid
characters:
/,:;*?\"<>|
(No setting) *
Automatic Trend CSV
File Export File Name
Set whether the group name will be
included in the name of the automatic
export file.
List box
Do not include
Group Name/
Include Group
Name
Do not include
Group Name
Automatic Trend CSV
File Export Time
(0 to 23)
Set the time when the CSV files output by
automatic trend CSV file export will be
stored (0 minute every hour).
Text box
0 to 23
0
Automatic Trend CSV
File Deletion
Set whether trend CSV file will be deleted
automatically or not.
List box
No/Yes
No
Trend CSV File
Storage Period (days)
Set the storage period of CSV file output
by automatic trend CSV file export.
When "Automatic trend CSV file deletion"
is "Enable", files stored longer than the
set
period are automatically deleted.
Text box
1 to 2000
2000
1
(No setting) *
2
1
*1: If the output destination folder is not set to the output folder, the file is output to
the "Trenddata" or "TrendCSV" folder given in Section 2.3.
*2: Up to 255 characters with the monitor tool of PX Developer Version 1.04E or
earlier and up to 225 characters with the monitor tool of PX Developer Version
1.06G to 1.20W. Data can be read with PX Developer Version 1.23Z or later
even if the number of input characters exceed the limit.
*3: The total number of characters of both trend binary data storage folder name
and trend binary file name must be within 259.
POINT
With the setting to include a group name in a name of an automatic export file,
invalid characters (/,:;*?\"<>|) are restricted in a trend group name.
When automatic trend CSV files are saved including group names, if the trend
group name is changed, CSV files that were output before the change cannot
be displayed on the trend graph.
9-63
9-63
9 SETTING
MELSOFT
9.18 Setting under This Condition
The set items and operating procedure that are necessary for the following conditions
are explained here.
For details of setting window and operation method, refer to the following sections.
Section
Section 9.18.1
Section 9.18.2
Section 9.18.3
Section 9.18.4
Section 9.18.5
Section 9.18.6
Section 9.18.7
Section 9.18.8
Section 9.18.9
Section 9.18.10
Section 9.18.11
Section 9.18.12
Section 9.18.13
Section 9.18.14
Section 9.18.15
9.18.1
Title
Changing the mode
Displaying the control panel
Displaying a trend graph
Displaying an alarm
Displaying an event
Setting character string displayed on faceplate
Design lockout tag
Specifying a font
Specifying a display color
Specifying a beep sound
Changing the transfer setup
Connecting to Simulator
Specifying a printer
Changing the window mode
Using automatic CSV file export
Changing the mode
The user authority that is corresponding to the user name and password must be
specified by user setting for changing at first.
Related setting items
Setting Item
Reference
User Authority Setting
Section 9.2
User Setting
Section 9.3
BASIC OPERATION
1. Click the "Change Mode" button on the monitor toolbar.
The "Change Mode" screen is displayed.
2. Input the user name and password with engineer authority to
change to the engineer mode.
(In the default status, enter user name: admin, password:
admin.)
3. Click the "Setting window" button on the monitor toolbar.
The setting window is displayed.
4. Select [User Authority Setting].
Set the operation authority range for users to be specified.
Click the "Apply" button.
5. Select [User Setting].
Set at optional on the user setting window.
Click the "Apply" button.
6. Close the setting window.
7. Click the "Change Mode" button on the monitor toolbar.
The "Change Mode" screen is displayed.
8. Input the user name and password.
It will be changed to the setting authority mode.
(When setting the lock mode, the "Lock" button can be clicked)
9-64
(Section 4.5)
(Section 4.7)
(Section 6.3.8)
(Section 9.2)
(Section 9.3)
(Section 4.5)
9-64
9 SETTING
9.18.2
MELSOFT
Displaying the control panel
In order to display the faceplate of optional tag data on the control panel, the projects
of monitor target and the writing method of connecting monitor target must be specified.
Meanwhile the tags to be displayed should be set by groups.
Related setting item
Setting Item
Reference
Monitor Target Project Setting
Section 9.4
Control Panel Setting
Section 9.7
For details of the setting that is related to the display content of the faceplate on the
control panel, refer to Section 9.18.6.
BASIC OPERATION
1. Click the "Change Mode" button on the monitor toolbar.
The "Change Mode" screen is displayed.
2. Input the user name and password with engineer authority to
change to the engineer mode.
3. Click the "Setting window" button on the monitor toolbar.
The setting window is displayed.
4. Select [Monitor Target Project Setting].
Set the assignment information database file on the screen of
the monitor target project.
Click the "Apply" button.
5. Select [Control Panel Setting].
Specify the display tag on the screen of control panel setting
window.
Click the "Apply" button.
6. Close the setting window.
7. Click the "Control Panel" button on the monitor toolbar and
then the control panel will be displayed.
(Section 4.5)
(Section 6.3.8)
(Section 9.4)
(Section 9.7)
(Section 6.3.2)
(Section 7.1)
DISPLAY/SETTING SCREEN
9-65
9-65
9 SETTING
9.18.3
MELSOFT
Displaying a trend graph
In order to display the value of optional process data on the trend graph, the monitor
target projects and the connection method to the monitor target must be specified.
Meanwhile, the tags to be displayed need to be set by groups. In addition, the
existence of the gridline and the graph color can be changed by the option setting.
Related setting items
Setting Item
Monitor Target Project Setting
Reference
Section 9.4
Monitor Variable Setting
Section 9.6
Trend Setting
Section 9.8
Option Setting (Trend Graph)
Section 9.17 (4)
BASIC OPERATION
1. Click the "Change Mode" button on the monitor toolbar.
The "Change Mode" screen is displayed.
2. Input the user name and password with engineer authority to
change to the engineer mode.
3. Click the "Setting Window" button on the monitor toolbar.
The setting window is displayed.
4. Select [Monitor Target Project Setting].
Set the assignment information database file on the screen of
the monitor target project.
Click the "Apply" button.
5. Select [Trend Setting].
When displaying global variables or devices on the trend graph,
register monitor variables on the monitor variable setting.
6. Specify the display tag data item and monitor variable on the
trend setting window.
Click the "Apply" button.
7. Select [Option Setting].
Set [Trend Graph] on the option setting screen.
Click the "Apply" button.
8. Close the setting window.
9. Click the "Trend Graph" button on the monitor toolbar and then
the trend graph will be displayed.
(Section 4.5)
(Section 6.3.8)
(Section 9.4)
(Section 9.6)
(Section 9.8)
(Section 9.17)
(Section 6.3.2)
(Section 7.2)
DISPLAY/SETTING SCREEN
9-66
9-66
9 SETTING
9.18.4
MELSOFT
Displaying an alarm
Two methods can be used to display the events of alarm occurrence on the screen:
One is to display one line or two lines of the latest alarm on the monitor toolbar and the
other is to display the alarm records on the alarm list screen.
With regard to the alarms of alarm tags or some of status tags (NREV, REV, MVAL1,
MVAL2, PB), preset the character string which displays the alarm content is required.
The option setting can change the graph color and display method of the alarm.
Set the UDP port number that is used for monitor tool to receive communication from
CPU module by the option setting when connecting Ethernet.
Related setting items
Setting Item
Monitor Target Project Setting
Alarm Setting
Faceplate Display Pattern Setting
Option Setting (General): minor alarm color, major alarm color
Option Setting (Alarm/Event)
Reference
Section 9.4
Section 9.9
Section 9.13
Section 9.17 (1)
Section 9.17 (2)
BASIC OPERATION
(1) Two lines of alarm are displayed on the monitor toolbar
1. Click the "Change Mode" button on the monitor toolbar.
The "Change Mode" screen is displayed.
2. Input the user name and password with engineer authority
to change to the engineer mode.
3. Click the "Setting Window" button on the monitor toolbar.
The setting window is displayed.
4. Select [Monitor Target Project Setting].
Set the assignment information database file on the
monitor target project screen.
Click the "Apply" button.
5. Select [Alarm Setting].
Specify the alarm content which is assigned to the alarm
tag on the alarm setting window.
Click the "Apply" button.
(It does not need to be set if the alarm tag has not been
set)
6. Select [Faceplate Display Pattern Setting].
Set the content which is assigned to the status tag (NREV,
REV, MVAL1, MVAL2, PB) on the setting window of the
faceplate display pattern.
Click the "Apply" button.
(It does not need to be set if the status tag has not been
set)
7. Select [Option Setting].
Set [Event Notification UDP Port No.(HEX)] of
[Alarm/Event]-[General] on the option setting screen.
8. If necessary, [Minor Alarm Color] and [Major Alarm Color]
of [General] can be changed to optional color on the option
setting screen.
9. [Alarm/Event Display on 2nd Line of Monitor Tool Bar] of
[Alarm/Event]-[General] is set to [Alarm] on the option
setting screen.
Click the "Apply" button.
10. Close the setting window.
9-67
(Section 4.5)
(Section 6.3.8)
(Section 9.4)
(Section 9.9)
(Section 9.13)
(Section 9.17)
9-67
9 SETTING
MELSOFT
(2) Display Alarm List
1 to 8. Operating steps are the same as those of (1)
9.
If necessary, the setting of [Highlighted Display while
alarms Occur] of [Alarm/Event]-[General] can be
changed on the option setting screen.
Click the "Apply" button.
10. Close the setting window.
11. Click the "Alarm List" button of the monitor toolbar.
The alarm list is displayed.
(Section 9.17)
(Section 6.3.2)
(Section 7.3)
DISPLAY/SETTING SCREEN
<Alarm/event display area on the monitor toolbar>
<Alarm list screen>
9-68
9-68
9 SETTING
9.18.5
MELSOFT
Displaying an event
Two methods are used to display the event on the screen.
One is to display one line of the latest event on the monitor toolbar and the other is to
display the list of event record on the event list screen.
With regard to the event of the message tag or status tag (NREV, REV, MVAL1,
MVAL2, PB), preset the character string of the event content that is displayed is
required.
Set the UDP port number that is used for monitor tool to receive communication from
CPU module by the option setting when connecting Ethernet.
Related setting items
Setting item
Reference
Monitor Target Project Setting
Section 9.4
Event Setting
Section 9.10
Faceplate Display Pattern Setting
Section 9.13
Option Setting (Alarm/Event): General
Section 9.17 (2)
BASIC OPERATION
(1) Display the latest event on the monitor toolbar
1. Click the "Change Mode" button on the monitor toolbar.
The change mode screen is displayed.
2. Input the user name and password with engineer authority
to change to the engineer mode.
3. Click the "Setting Window" button on the monitor toolbar.
The setting window is displayed.
4. Select [Monitor Target Project Setting].
Set the assignment information database file on the screen
of the monitor target project.
Click the "Apply" button.
5. Select [Event Setting].
Specify the alarm content which is assigned to the alarm
tag on the event setting window.
Click the "Apply" button. (It does not need to be set if the
alarm tag has not been set)
6. Select [Faceplate Display Pattern Setting].
Set the content which is assigned to the status tag (NREV,
REV, MVAL1, MVAL2, PB) on the setting screen of the
faceplate display pattern.
Click the "Apply" button. (It does not need to be set if the
status tag has not been set)
7. Select [Option Setting].
Set [Event Notification UDP Port No.(HEX)] of
[Alarm/Event]-[General] on the option setting screen.
8. [Alarm/Event Display on 2nd Line of Monitor Tool Bar] of
[Alarm/Event] - [General] is set to [Event] on the option
setting screen.
Click the "Apply" button.
9. Close the setting screen.
9-69
(Section 4.5)
(Section 6.3.8)
(Section 9.4)
(Section 9.10)
(Section 9.13)
(Section 9.17)
9-69
9 SETTING
MELSOFT
(2) Display Event List
1. to 7. Operating steps are the same as those of (1)
Click the "Apply" button.
8. Close the setting window.
9. Click the "Event List" button on the monitor toolbar.
The event list is displayed.
(Section 6.3.2)
(Section 7.4)
DISPLAY/SETTING SCREEN
<Alarm/event display area on the monitor toolbar>
<Event list screen>
9-70
9-70
9 SETTING
9.18.6
MELSOFT
Setting character string displayed on faceplate
Among the character strings displayed on the faceplate, the character string which is
assigned to the operation button and indicator is set by the faceplate display pattern
setting. The character string which is assigned to the alarm tag and message tag is set
by the alarm setting and event setting.
In addition, the character string that can be defined by the monitor tool includes unit,
MV characters of MV graph and lockout tag name. The display high/low limit of PV
graph can be set by setting the faceplate display scale. The character string (set by the
alarm setting, event setting and faceplate display pattern setting) is also displayed on
the alarm list screen or event list screen.
Related setting items
Setting item
Monitor Target Project Setting
Reference
Section 9.4
Alarm Setting
Section 9.9
Event Setting
Section 9.10
Unit Setting
Section 9.12
Faceplate Display Pattern Setting
Section 9.13
Faceplate Display Scale Setting
Section 9.14
Faceplate MV Characters Setting
Section 9.15
For details of setting method as for displaying content of lockout tag which is displayed
on the faceplate, refer to "Section 9.18.7 Design lockout tag".
For details of setting method as for graph color setting of the faceplate, refer to
"Section 9.18.9 Specifying a display color".
BASIC OPERATION
1. Click the "Change Mode" button on the monitor toolbar.
The "Change Mode" screen is displayed.
2. Input the user name and password with engineer authority to
change to the engineer mode.
3. Click the "Setting Window" button on the monitor toolbar.
The setting window is displayed.
4. Select [Monitor Target Project Setting].
Set the assignment information database file on the screen of
the monitor target project.
Click the "Apply" button.
5. Select the item to be set.
Set the character string that is assigned to the tag on the
setting window.
Click the "Apply" button.
(It does not need to be set if the corresponding tag has not
been set on the project)
6. Close the setting window.
Click the "Find" button of the monitor toolbar and search by tag
name.
The pop-up faceplate is displayed.
9-71
(Section 4.5)
(Section 6.3.8)
(Section 9.4)
(Section 9.9,
Section 9.10,
Section 9.12 to
Section 9.15)
(Section 6.3.6)
(Section 7.6)
9-71
9 SETTING
9.18.7
MELSOFT
Design lockout tag
The user authority needs to be set for the lockout tag to restrict the operation. The
name and color of lockout tag can be set freely.
Related setting items
Setting item
User Authority Setting
Reference
Section 9.2
User Setting
Section 9.3
Lockout Tag Setting
Section 9.16
BASIC OPERATION
1. Click the "Change Mode" button on the monitor toolbar.
The "Change Mode" screen is displayed.
2. Input the user name and password with engineer authority
to change to the engineer mode.
3. Click the "Setting Window" button on the monitor toolbar.
The setting window is displayed.
4. Select [User Authority Setting].
Set the operation authority range for users to be specified.
Click the "Apply" button.
5. Select [User Setting].
Set optionally on the user setting window.
Click the "Apply" button.
6. Select [Lockout Tag Setting].
Set optionally on the Lockout Tag setting window.
Click the "Apply" button.
7. Close the setting window.
8. Click the "Find" button of the monitor toolbar and search by
tag name.
The pop-up faceplate is displayed.
9. Click the lockout tag display area on the faceplate.
The "Select Lockout Tag" dialog box is displayed.
10. Select the lockout tag and click the "OK" button.
The lockout tag is displayed in the "Lockout Tag Display
Area".
(Section 4.5)
(Section 6.3.8)
(Section 9.2)
(Section 9.3)
(Section 9.16)
(Section 6.3.6)
(Section 7.6)
(Section 10.2)
DISPLAY/SETTING SCREEN
Lockout tag
9-72
9-72
9 SETTING
9.18.8
MELSOFT
Specifying a font
The display character font of the setting window and the monitor screen can be
changed.
Related setting items
Setting item
Option Setting (General): Setting Window Font and Monitor Window Font
Reference
Section 9.17 (1)
BASIC OPERATION
1. Click the "Change Mode" button on the monitor toolbar.
The "Change Mode" screen is displayed.
2. Input the user name and password with engineer authority
to change to the engineer mode.
3. Click the "Setting Window" button on the monitor toolbar.
The setting window is displayed.
4. Select [Option Setting].
Change [Setting Window Font] and [Monitor Window Font]
of [General] optionally on the option setting screen.
Click the "Apply" button.
5. Close the setting window.
(Section 4.5)
(Section 6.3.8)
(Section 9.17)
REMARK
The font can be selected from the font set in the personal computer.
The size of the font is automatically selected by the screen size. (Except the tag
monitor display area of pop-up tuning.)
The change of the monitor window font is to change the button, tab title and
character string of the list. The font of the displayed character string of on the
faceplate cannot be changed.
9-73
9-73
9 SETTING
9.18.9
MELSOFT
Specifying a display color
The display color of the faceplate, lockout tag, alarm display and trend graph can be
changed.
Related setting items
Setting item
Reference
Faceplate Display Pattern Setting
Section 9.13
Lockout Tag Setting: Text Color and Background Color
Section 9.16
Option Setting (General): Minor Alarm Color and Major Alarm Color
Section 9.17 (1)
Option Setting (Faceplate)
Section 9.17 (3)
Option Setting (Trend Graph): Gridline Color, Background Color and
Graph 1 to 8 Color
Section 9.17 (4)
BASIC OPERATION
1. Click the "Change Mode" button on the monitor toolbar.
The "Change Mode" screen is displayed.
2. Input the user name and password with engineer authority
to change to the engineer mode.
3. Click the "Setting Window" button on the monitor toolbar.
The setting window is displayed.
4. Select the item to be set.
Select the display color in the color dialog box.
Click the "OK" button.
5. Confirm that the color displayed in the cell is the selected
color.
Click the "Apply" button.
6. Close the setting window.
(Section 4.5)
(Section 6.3.8)
(Section 9.1.2)
The items whose color can be set and their initial color settings are listed in the follow
table.
Initial setting
Setting item
PVAL
Faceplate
Display
Pattern
Setting
HTCL
9-74
Text
Text color
Background
color
Open Button
Open
Black
Red
Close Button
Close
Black
Red
Stop Button
Stop
Black
Remote Display
Remote
Black
Green
Local Display
Local
Black
Green
Trip Display
Trip
Black
Time-out Display
Time-out
Black
Open/Close Status History
Always
Using the PID cooling
COOL
Black
Light blue
Using the PID Heating
HEAT
Black
Red
Cooling Close Direction
Blank
Cooling Open Direction
Blank
Heating Close Direction
Blank
Heating Open Direction
Blank
9-74
9 SETTING
MELSOFT
Initial setting
Setting item
NREV
REV
Faceplate
Display
Pattern
Setting
(continued)
MVAL1
MVAL2
PB
9-75
Text
Text color
Background
color
Operation Button
Start
Black
Red
Stop Button
Stop
Black
Red
Remote Display
Remote
Black
Green
Local Display
Local
Black
Green
Trip Display
Trip
Black
Time-out Display
Time-out
Black
Forward Run Button
FWD Run
Black
Red
Stop Button
Stop
Black
Red
Reverse Run Button
REV Run
Black
Red
Remote Display
Remote
Black
Green
Local Display
Local
Black
Green
Trip Display
Trip
Black
Time-out Display
Time-out
Black
Open Button
Open
Black
Red
Close Button
Close
Black
Red
Semi-open Display
Semiopen
Black
Red
Remote Display
Remote
Black
Green
Local Display
Local
Black
Green
Trip Display
Trip
Black
Time-out Display
Time-out
Black
Open Button
Open
Black
Red
Close Button
Close
Black
Red
Stop Button
Stop
Black
Semi-open Display
Semiopen
Black
Red
Remote Display
Remote
Black
Green
Local Display
Local
Black
Green
Trip Display
Trip
Black
Time-out Display
Time-out
Black
ON Name
ON
Black
Red
OFF Name
ON
Black
Gray
ON/OFF History Type
Only ON
9-75
9 SETTING
MELSOFT
Setting item
Lockout Tag
setting
Text color
Background color
General
Faceplate
Option Setting
Trend Graph
9-76
Initial setting
Minor alarm color
Green
Major alarm color
Red
Background color
Black
Text color
White
Alarm area color (No alarm)
Dark-gray
Button text color
Black
Button background color
Gray
PV Bar positive direction color
Green
PV Bar negative direction color
Green
PV Bar both direction color (Positive)
Green
PV Bar both direction color (Negative)
Green
PV High/ Low Limit Value Bar color
Yellow
PV High High/Low Low Limit Value Bar Color
Red
SV/MV Limit Value Bar Color
Dark-green
SV/MV pointer color
Yellow
SV (target) pointer color for 2PIDH
Light blue
MV status color
Light blue
Frame color
Gray
Gridline color
Gray
Background color
Black
Graph 1 color
Green
Graph 2 color
Red
Graph 3 color
Yellow
Graph 4 color
Light blue
Graph 5 color
Blue
Graph 6 color
Magenta
Graph 7 color
White
Graph 8 color
Orange
9-76
9 SETTING
MELSOFT
9.18.10 Specifying a beep sound
In order to beep when alarm or event occurs, it is necessary to set buzzer in option
setting. Buzzer type and beep time can be specified.
Related setting items
Setting item
Reference
Option Setting (Alarm/Event)
Section 9.17 (2)
BASIC OPERATION
1. Click the "Change Mode" button on the monitor toolbar.
The "Change Mode" screen is displayed.
2. Input the user name and password with engineer authority
to change to the engineer mode.
3. Click the "Setting Window" button on the monitor toolbar.
The setting window is displayed.
4. Select [Option Setting].
Set the buzzer-related projects as [Alarm/Event] on the
option setting screen.
Click the "Apply" button.
5. Close the setting window.
(Section 4.5)
(Section 6.3.8)
(Section 9.17)
The beep sound is set according to Minor alarm/Major alarm/event when alarm occurs.
There are two types of beep sound: Beep sound or sound in the sound file.
Setting item
Initial setting
None
Buzzer Type
Beep Sound Time Interval
Beep Sound Frequency
Sound File
(The same as that of minor alarm)
(The same as that of minor alarm)
Minor alarm
Major alarm
Event
(10)
(2000)
(No setting)
When beep sound occurs, [Beep Sound Time Interval] and [Beep Sound
Frequency] should be specified. When file sound happens, [Beep Sound Time
Interval] and [Sound File] should be specified.
Items to be set (according to the buzzer type)
Setting item
None
Buzzer type
Beep
Sound
Beep sound time interval
Beep sound frequency
Sound file
( : Need to be set,
: Setting not allowed)
REMARK
The beep sound can be stopped by clicking the "Stop Buzzer" button of the monitor
Section 8.1)
toolbar. (
9-77
9-77
9 SETTING
MELSOFT
9.18.11 Changing the transfer setup
The screen that is the same as that of GX Developer will be displayed by selecting
[Transfer Setup] of [Monitor Target Project Setting] on the monitor toolbar. In order to
change transfer setup of PLC, it should be set on the specified screen of the connected
target.
For details of basic operation method of transfer setup screen, refer to "GX Developer
Version 8 Operating Manual". But the connection of the monitor tool cannot be the
relay station's connection of the network with the different network number. (It cannot
be connected by blend network of MELSECNET/10(H) and Ethernet which are
permitted in GX application)
Related setting items
Setting item
Reference
Monitor Target Project Setting
Section 9.3
Option Setting (Alarm/Event)
Section 9.17 (2)
BASIC OPERATION
1. Click the "Change Mode" button on the monitor toolbar.
The "Change Mode" screen is displayed.
2. Input the user name and password with engineer authority to
change to the engineer mode.
3. Click the "Setting Window" button on the monitor toolbar.
The setting window is displayed.
4. Select [Monitor Target Project Setting].
Set assignment information database file to the target on
monitor target project screen.
5. Click [Transfer Setup] on the monitor target project screen to
display the transfer setup screen.
6. Select [PC Side I/F], [PLC Side I/F] and [Network route] in
turn on the specified screen of the connected target.
7. Click the "Connection Test" button to confirm the normal
communication.
8. Click the "OK" button to activate transfer setup and close the
window.
9. Specify the path and the transfer setup of projects.
Click the "Apply" button.
When setting the connection of <Ethernet>:
10. Select [Option Setting].
Confirm that the value of [Alarm/Event]-[General]-[Event
Notification UDP Port No.(HEX)] is in accordance with the
[Destination Port Number] value of the destination network
parameter setting (set by GX application which started from
programming tool) on the option setting screen.
Click the "Apply" button.
11. Close the setting window.
9-78
(Section 4.5)
(Section 6.3.8)
(Section 9.4)
(Section 9.17)
9-78
9 SETTING
MELSOFT
9.18.12 Connecting to Simulator
Start Simulator in the programming tool, execute the simulation of monitoring screen of
monitor tool.
Related setting items
Setting item
Monitor Target Project Setting
Reference
Section 9.4
BASIC OPERATION
9-79
1. Start the programming tool.
[Open Project] under the Menu to open a
2. Select [Project]
project which executes the simulation.
3. Select [Debug]
[Start Simulation] under the Menu to start
Simulator.
PX Developer
Operating
Manual
(Programming
Tool)
4. Click the "Change Mode" button on the monitor toolbar.
The "Change Mode" screen is displayed.
5. Input the user name and password with engineer authority
to change to the engineer mode.
6. Click the "Setting Window" button on the monitor toolbar.
The setting window is displayed.
7. Select [Monitor Target Project Setting].
Set assignment information database file to the target on the
monitor target project screen.
8. Select [Simulator Connection] of the project to be connected
to simulator on the monitor target project screen.
Click the "Apply" button.
9. Close the setting window.
(Section 4.5)
(Section 6.3.8)
(Section 9.4)
9-79
9 SETTING
MELSOFT
9.18.13 Specifying a printer
When clicking the "Print Screen" button on the monitor toolbar or the "Print" button on
the alarm/event list, the output printer will be selected among the printers that have
been registered in the printer setting of the personal computer. The printer cannot be
set in detail (such as print paper setting) by the monitor tool. It is printed by the setting
that is specified by the printer setting of the personal computer. When specifying the
printer without the monitor tool setting, the printer that is set as the "Default printer" will
be output.
Related setting items
Setting item
Option Setting (General): Printer
Reference
Section 9.17 (1)
BASIC OPERATION
1. Click the "Change Mode" button on the monitor toolbar.
The "Change Mode" screen is displayed.
2. Input the user name and password with engineer authority to
change to the engineer mode.
3. Click the "Setting Window" button on the monitor toolbar.
The setting window is displayed.
4. Select [Option Setting].
Select [Printer] of [General] on the option setting screen.
Select the printer name from the list.
Click the "Apply" button.
5. Close the setting window.
9-80
(Section 4.5)
(Section 6.3.8)
(Section 9.17)
9-80
9 SETTING
MELSOFT
9.18.14 Changing the window mode
Window mode is to select multi-screen or maximum display mode of single screen
Section 6.4.2). Set the mode in option setting.
(
Related setting items
Setting Item
Option Setting (General): Window Mode
Reference
Section 9.17 (1)
BASIC OPERATION
1. Click the "Change Mode" button of the monitor toolbar.
The "Change Mode" screen is displayed.
2. Input the user name and password with engineer authority to
change to the engineer mode.
3. Click the "Setting Window" button on the monitor toolbar.
The setting window is displayed.
4. Select [Option Setting].
Set the [Window Mode] of [General] by selecting Multiwindow or Single window in option setting screen.
Click the "Apply" button.
5. Close the setting window.
9-81
(Section 4.5)
(Section 6.3.8)
(Section 9.17)
9-81
9 SETTING
MELSOFT
9.18.15 Using automatic CSV file export
Automatic CSV file export is a function that saves trend, alarm and event data in CSV
files automatically as histories.
To use automatic CSV file export, set whether automatic CSV file export will be
executed or not for each data (trend, alarm, event).
Related setting items
Setting item
Reference
Trend Setting
Section 9.8
Option Setting (General)
Section 9.17 (1)
Option Setting (Alarm/Event)
Section 9.17 (2)
Option Setting (Trend Graph)
Section 9.17 (4)
BASIC OPERATION
1. Click the "Change Mode" button on the monitor toolbar.
The "Change Mode" screen is displayed.
2. Input the user name and password with engineer authority
to change to the engineer mode.
3. Click the "Setting" button on the monitor toolbar
The setting screen is displayed.
4. Set the automatic CSV file export target folder, whether to
include a group name in an export file name, automatic
CSV file deletion (Enable/Disable), automatic CSV file
export time (automatic trend CSV file export only) and
storage period (only when automatic deletion is made).
The setting positions are as follows.
After setting, click the "Apply" button.
Setting item
(Section 6.3.8)
Setting position
Option Setting
(Trend Graph)
Automatic trend CSV file export target folder
Automatic trend CSV file export file name
Automatic trend CSV file export time (0 to 23)
Automatic trend CSV file deletion
Trend CSV file storage period (days)
Option Setting
(Alarm/Event)
Automatic alarm CSV file deletion
Alarm CSV file storage period (days)
Automatic alarm CSV file export target folder
Option Setting
(Alarm/Event)
Automatic event CSV file deletion
Event CSV file storage period (days)
Automatic event CSV file export target folder
5. When automatic CSV file deletion is set to "Enable" in
above 4., set the time for automatically deleting CSV files.
In the option setting (general), set the "Automatic CSV file
deletion time (0 to 23).
Click the "Apply" button.
6. In the option setting (general), set the "Disk free space
check size (MB)".
Click the "Apply" button.
9-82
(Section 4.5)
(Section 9.17 (4))
(Section 9.17 (2))
(Section 9.17 (2))
(Section 9.17 (1))
(Section 9.17 (1))
9-82
9 SETTING
MELSOFT
7. Set automatic CSV file export to "Enable".
The setting positions are as follows.
After setting, click the "Apply" button.
Automatic CSV file export starts.
Setting item
9-83
Setting position
Trend Setting
Automatic CSV file export
(set for each group)
Option Setting
(Alarm/Event)
Automatic alarm CSV file export
Option Setting
(Alarm/Event)
Automatic event CSV file export
(Section 9.8)
(Section 9.17 (2))
(Section 9.17 (2))
9-83
9 SETTING
MELSOFT
MEMO
9-84
9-84
10 FACEPLATE
MELSOFT
10 FACEPLATE
The so-called faceplate is the graphic screen displaying tag data content to simulate
controller.
Accessing to the tag data, execute corresponding process status observation and
condition setting. For details of tag types, refer to Section 10.4.
Tag data value cannot only be displayed but also be changed on the faceplate.
Term
Description
Originally, it indicates certain measurement for process control or JIS
definition identifier on hardware; as for the computer control system, it
Tag
indicates the identifier of various DDC processing.
A generic name of the data (process condition data/process status data)
Tag data
Tag data item
from DDC processing indicating tag.
Items for value setting in tag data.
10.1 Faceplate Display
PURPOSE
To display the graphic screen the simulating controller.
To monitor the current PID control status as well as to execute ON/OFF control
with the bar graph in each faceplate.
BASIC OPERATION
The faceplate can be displayed in the following monitor screen.
For details of each screen and its displaying method, refer to Section 6.3.2 and
Chapter 7.
Control panel
(
Pop-up faceplate (
Pop-up tuning
(
Section 7.1)
Section 7.6)
Section 7.7)
10
<Control panel>
10-1
<Pop-up faceplate>
<Pop-up tuning >
10-1
10 FACEPLATE
MELSOFT
DISPLAY/SETTING SCREEN
The basic display contents of the faceplate are as follows:
1)Lockout tag
display area
2) I/O mode display area
3) Tag name display area
4) Tag comment display area
5) Alarm display area
6) Tag type display area
7) Details button
DISPLAY/SETTING DATA
No.
Item
Description
1)
Lockout tag
name
display area
Display Lockout tag name.
(For details, refer to Section
10.2)
I/O mode
display area
Display I/O mode.
Click the button to change
the I/O mode. (For details,
refer to Section 10.3.2)
2)
3)
Tag name
display area
Display tag names. (For
details, refer to (1) in this
section)
4)
Tag
comment
display area
Display tag comment in two
lines.
Set the tag comment in the
tag FB declaration window
of the programming tool.
5)
Alarm
display area
Display tag alarm. (For
details, refer to (2) in this
section)
6)
Tag type
display area
7)
Details
button
Display the tag type of the
tag.
Click the "Details" button to
display the pop-up tuning
screen. (For details, refer to
Section 7.7)
Background color
Number of
characters
Without lockout tag:
Button text color
With tag: Setting color
Without lockout tag:
Button background color
With lockout tag: Setting color
8 characters
NOR
SIM
OVR
TSTP
NOR: Button background color
SIM: Blue
OVR: Light blue
TSTP: White
4 characters
Text color
: Button text color
: White
: Black
: Black
Generally:
Text color
When tag data
cannot be written: Black
In setting operation: White
Normal connection:
Background color
Abnormal communication: Red
When tag data
cannot be written: Light blue
In setting operation: Blue
12 characters
(depends on
the width of
faceplate)
Text color
Background color
28 characters
(depends on
the width of
faceplate)
Without alarm: No alarm
color
No alarm:
Background color
Minor alarm: Minor alarm color
Major alarm: Major alarm color
3 characters
Text color
Background color
8 characters
Button text color
Button background color
Details/<</>>
With alarm:
Black
10
Employ the ellipsis ".." at the end of a long character string in the tag name display
area or tag comment display area.
10-2
10-2
10 FACEPLATE
MELSOFT
POINT
Click the button at the bottom of the faceplate to change the window of the display
faceplate as shown below.
<Control panel>
Open new pop-up tuning screen
Change display
<Pop-up tuning>
10-3
<Pop-up faceplate>
10-3
10 FACEPLATE
MELSOFT
(1) Display data of tag name display area
Status
Description
Faceplate
When the SV/MV setting dialog box, etc. is opened from the faceplate,
operation
the background color turns blue.
When the tag data cannot be read/written, the background color turns red.
The tag data cannot be read/written in the following cases.
• A communication error with a PLC has occurred.
• "Incorrect PLC type" error has occurred.
• A communication error with a server has occurred in a client.
In either of the above cases, the displayed value will not be updated.
In the case of redundant system, the status is relevant to the Redundant CPU
that has been selected in the "Transfer Setup" dialog box.
When tag data
cannot be
read/written
When tag data cannot be written, the background color turns light blue.
The tag data cannot be read/written in the following cases.
• The project ID code inconsistent error has occurred, and "Write tag data
(even if the PC’s and PLC’s project ID codes are different)" has been set
as "Enable" in the Option setting (General).
• The redundant system A/B identification error has occurred.
• The redundant control/standby system status error has occurred.
As the data can be read from the PLC CPU, the displayed value will be
updated.
In the case of redundant system, the status is relevant to the Redundant CPU
that has been selected in the "Transfer Setup" dialog box.
When tag data
cannot be
written
POINT
When tag data cannot be read/written, check the following points.
Connection status of the communication cable.
Section 9.4).
PLC connection target in the monitor target project setting (
Section 7.3), double-click the corresponding alarm item
In the alarm list (
to display the system alarm details dialog box.
Confirm the displayed error definition and take corrective action.
When tag data cannot be written, observe the following instructions.
Reload the monitor target instructions.
When PLC download has not been performed after execution of compile with
the programming tool, perform PLC download and then reload the monitor
target project with the monitor tool.
10-4
10-4
10 FACEPLATE
MELSOFT
(2) The displayed contents of the alarm display are as follows:
(a) PVA, DVA, MVA display area
Tag type
Loop tag
Status tag
Other tags
Displayed
1
characters *
Description
PVA
PV-related
Positive/negative variation rate
Input high high/high/low/low low limit over
DVA
DV-related
Large deviation
MVA
MV-related
Output variation rate limit
Output high/low limit
SVA
SV-related
SV variation rate limit
SV high/low limit
AL1
Time-out-related
Time-out over
AL2
Trip-related
Current and overloaded trip over
(Nothing displayed)
*1: The alarm that has not occurred in the corresponding tag type is not
displayed.
(b) SPA, SEA (or HBOA), OOA display area
Tag type
Displayed
characters
SPA
Loop tag
Other tag
Description
Stop alarm
When SPA turns ON, the "SPA" part changes to a button.
Clicking this button resets SPA.
However, a user who has the authority of operation for changing
tag data of process design values can reset SPA.
2
SPA status
Operation display type *
ON
PB-C
OFF
PL
Indication
SEA
or
1
HBO *
Sensor error (SEA)
SEA turns ON when the sensor is abnormal.
Heater failure (HBOA)
HBOA turns ON in heater failure.
OOA
Output open alarm
Turns ON when the output disconnection is detected in the user
program.
(No indication)
*1: HBOA is displayed as "HBO".
*2: For details, refer to Section 10.3.1.
For details of tag types, refer to Section 10.4.
10-5
10-5
10 FACEPLATE
MELSOFT
(3) Display on modeless dialog box
The dialog boxes to operate the tag data can be displayed simultaneously
from the multiple faceplates on the control panel.
When the dialog box which is started up from faceplate is displayed, other
dialog boxes can be opened without closing the displayed dialog box.
The following shows the modeless dialog boxes which can be displayed by
clicking the parts on the faceplate.
Parts
10-6
Dialog box
Lockout tag display area
Select Lockout Tag dialog box
I/O mode display button
Change I/O Mode dialog box
Control mode display button
Change Control Mode dialog box
Motion type setting button
Change Motion Type dialog button box
PV value setting button
PV value setting dialog box
SV value setting button
SV value setting dialog box
MV value setting button
MV value setting dialog box
Count value setting button
Count value setting dialog box
Executing step No. setting button
Executing step No. setting dialog box
Time in the step setting button
Time in the step setting dialog box
10-6
10 FACEPLATE
MELSOFT
10.2 Lockout Tag
PURPOSE
Limit the tag data operation on the faceplate by the authority-specified
lockout tag.
BASIC OPERATION
(Setting Lockout tag)
1. Click the lockout tag display area of the faceplate without lockout tag.
2. The "Select Lockout Tag" dialog box is displayed.
3. Select the lockout tag in the "Select Lockout Tag" dialog box then click
the "OK" button.
4. The Confirmation dialog box is displayed and the lockout tag is set on
the faceplate.
(Removing lockout tag)
1. Click the lockout tag display area of the faceplate with lockout tag.
2. If the set tag can be removed within the authority of current mode, a
confirmation dialog box for removing the tag is displayed and the Lockout
Tag can be removed.
3. If the lockout tag cannot be removed within the authority of current mode,
the Corresponding message is displayed: The tag cannot be removed.
Section 4.5).
Execute again after changing mode (
DISPLAY/SETTING SCREEN
The display color of the frame is the same with the
background color of lockout tags display area.
Lockout tag display area
<Select Lockout Tag dialog box>
The lockout tag list available in current mode is displayed "Select Lockout Tag"
dialog box. In the lockout tag list display the tags set according to "Section 9.16
Lockout Tag Setting". The corresponding lockout tag classes available in the mode
are as follows:
Current mode
Available lockout tag level
Engineer Mode
Operator1 to 4, engineer
Operator Mode
Operator1 to 4 who have the authority of operation for setting/removing lockout tag on User Authority Setting
Section 9.2)
(
Example (initial setting): when the current user authority is operator3, lockout tag of operator1 to 3 level can be
used.
Lock Mode
Lockout tag operation cannot be executed.
10-7
10-7
10 FACEPLATE
MELSOFT
10.3 Displaying Parts on Faceplate
Display parts simulated to display lamp and push button according to the display tag
data contents on the faceplate.
10.3.1
Operation display types
The following list shows the parts names and abbreviations displayed on the faceplate:
For operating the buttons, the user authority in accordance with the tag data items is
required.
For details of operation authority for tag data items, refer to Appendix 4.
Name
Push button
Push button with confirmation
Button with display
Push button with confirmation and
display
Push button with ON/OFF history
I/O mode display button
Push
Control mode display button
Button
Motion type setting button
PV value setting button
SV value setting button
MV value setting button
Count value setting button
Executing step No. setting button
Time in the step setting button
Value display
Character display
Bar display
Pointer display
Graph display
Pattern graph display
Split graph display
Status, alarm display
10-8
Abbreviation
PB
PB-C
PB-L
PB-LC
PB-ONF
PB-SIM
PB-MODE
PB-TYPE
PB-PV
PB-SV
PB-MV
PB-CNT
PB-STC
PB-T
NUM
STR
BAR
IND
PGS
PGS2
SPLT
PL
Description
Display the general push buttons
Display the confirmed message before execution
Flick display in 1 second interval in execution
Displaying the confirmed information before execution
Flick display every 1 second in execution
Display the confirmed message before execution
Display change I/O Mode dialog box
Display change Control Mode dialog box
Display change Motion Type dialog button box
Display PV value setting dialog box
Display SV value setting dialog box
Display MV value setting dialog box
Display count value setting dialog box
Displays the executing step No. setting dialog box
Displays the time in the step setting dialog box
Display value data with character and decimal point
Display ASCII character string
Display the value in bar pattern
Display the current value on the bar With the pointer
Display SV and MV pattern by graph
Displays the SV output values of the time set in advance
for each step as graphs
Display a heating/cooling graph.
Display at the time of status change and alarm
occurrence
10-8
10 FACEPLATE
MELSOFT
The faceplate display consists of the above parts.
The common display composition of the faceplate is introduced through the usage
samples of the components in following content. In every description, the operation
display types are stated in abbreviation.
Item
I/O mode change
Control mode change
Motion type change
Executing step No. setting
Time in the step setting
PV value setting
SV value setting
MV value setting
Count value setting
Batch Count operation
Count/timer operation
Status operation
Component mainly used
I/O mode display button
Control mode display button
Motion type setting button
Executing step No. setting button
Time in the step setting button
PV value setting button and bar display
SV value setting button, bar display and pointer display
MV value setting button, bar display and pointer display
Count value setting button
Button with confirmation and display
Button with confirmation and display
Button with confirmation and display and status/alarm display
Reference
Section 10.3.2
Section 10.3.3
Section 10.3.4
Section 10.3.5
Section 10.3.6
Section 10.3.7
Section 10.3.8
Section 10.3.9
Section 10.3.10
Section 10.3.11
Section 10.3.12
Section 10.3.13
REMARK
The background color of the displayed button changes with the change of the status
of the equipment.
Before operation, the button color is its background color. After operation, the set
color and button background color flicks (with the interval of 1 second).
During the flicking time, the flick status will not be kept when redisplayed owing to
page change. If time-out or trip alarm occurs, flicking will stop.
10-9
10-9
10 FACEPLATE
10.3.2
MELSOFT
Changing the I/O mode
PURPOSE
To change the connection status of the sequence I/O module during the
operation.
I/O mode can be classified as follows:
I/O mode
Abbreviation
Description
NORMAL
NOR
Mode for input/output module connection normal status.
SIMULATION
SIM
Mode for input/output module disconnection and executing simulation operation.
OVERRIDE
OVR
An operation mode only to cut off the signal from input module and hold output when
sensor fails. PV value can be input from the screen configuration.
TSTP
Mode for not performing the processing regarding a tag.
Stops input processing and loop control operation.
Set to the predefined tags and the currently stopped tags for future use.
Unnecessary alarm is not occurred as all the alarms to tags are recovered.
TAG STOP
DISPLAY/SETTING SCREEN
I/O mode
display button
<Change I/O Mode dialog box >
DISPLAY/SETTING DATA
Item
I/O mode
display button
Operation
display type
PB-SIM
Description
Text color
Display current I/O mode.
NOR: Button text color
Click button to display the
SIM: White
change I/O mode dialog box
OVR: Black
for changing I/O mode.
Background color
NOR: Button background color
SIM: Blue
OVR: Light blue
POINT
For tags without I/O mode (When the tag type PGS, MOUT, SEL, BC, PSUM, PB,
TIMER1, TIMER2, COUNT1 and COUNT2) the I/O mode display button will not be
displayed (button display area is covered by the background color).
The selectable I/O modes depend on the tag types.
In addition, some switches from one mode into another are limited because of the tag
types. For details of tag types, refer to Section 10.4.
10-10
10-10
10 FACEPLATE
MELSOFT
(1) Loop tag (PID, PIDP, SPI, IPD, BPI, R, 2PID) and status tag
(NREV, REV, MVAL1, MVAL2).
The following shows mode transition is possible.
OVERRIDE
NORMAL
*1
SIMULATION
*1: Can be switched only when the user authority (
mode.
Section 4.3) is engineer
(2) Loop tag (2PIDH, PFC_SF, PFC_SS, PFC_INT, PVAL)
The following shows mode transition is possible.
OVERRIDE
NORMAL
*1
TAG STOP
*1
SIMULATION
*1: Can be switched only when the user authority (
mode.
Section 4.3) is engineer
(3) Loop tag (ONF2, ONF3, MONI, MWM)
NORMAL and OVERRIDE modes can be set.
(4) Loop tag (PGS, MOUT, SEL, BC, PSUM) and status tag (TIMER1,
TIMER2, COUNT1, COUNT2)
I/0 mode display button is not displayed. (NORMAL mode always)
(5) Loop tag (PGS2, HTCL)
The following mode transition is possible.
NORMAL
*1
TAG STOP
*1: Can be switched only when the user authority (
mode.
Section 4.3) is engineer
(6) Loop tag (SWM)
The following shows mode transition is possible.
OVERRIDE
NORMAL
*1
TAG STOP
*1: Can be switched only when the user authority (
mode.
Section 4.3) is engineer
POINT
PV value can be changed when the I/O mode is OVERRIDE.
I/O mode can be changed only when the control mode (
Section 10.3.3) is
MANUAL.
Note that switching the mode from NORMAL to TAG STOP is possible even if
the control mode is not MANUAL.
If MDIH (Disable mode change) setting is executed by memory item
Section 10.5) of tag data, the disable mode cannot be selected.
(
10-11
10-11
10 FACEPLATE
MELSOFT
REMARK
If the improper value is set on DOM of the memory item for the tag data
Section 10.5), the button displayed will be blank. At this time, I/O mode should
(
be set again by "Change I/O Mode" dialog box. (The improper value will not be set
on DOM, if the user takes the normal operation with the monitor tool.)
10.3.3
Changing the Control mode
PURPOSE
Switch SV and MV value control method for PID control.
The types of control mode (Operation mode) are as follows.
Control mode
Abbreviation
MANUAL
MAN
AUTO
AUT
CASCADE
CAS
COMPUTER MV
CMV
COMPUTER SV
CSV
CASCADE DIRECT
CASDR
Description
The mode performs manual operation.
Output MV setting value.
The mode performs auto operation.
Control MV value based on SV setting value.
The mode performs cascade operation. Perform control by using output value
(MV) of upper loop as setting value (SV).
The mode performs manual operation from upper computer.
Output MV setting value from upper computer.
The mode performs automatic operation from upper computer.
Based on SV setting value, Control MV value from upper computer.
Directly outputs the output value of primary loop as the output value of
secondary loop in cascade connection.
DISPLAY/SETTING SCREEN
Control mode
display button
< Change Control Mode dialog box >
DISPLAY/SETTING DATA
Item
Control mode
display button
Operation
display type
PB-MODE
Description
Display current control mode.
Click button to display "Change Control Mode"
dialog box thus control mode can be changed
Text color
Background
color
Button
text color
Button background
Color
POINT
Control mode cannot be displayed when control mode does not exist (when tag
type is MONI, BC, PSUM, TIMER1, TIMER2, COUNT1 or COUNT2).
MIDH (disable mode change) setting is made to COMPUTER MV and
Section 10.5) of tag data.
COMPUTER SV in initial setting by memory item (
10-12
10-12
10 FACEPLATE
MELSOFT
Following table indicates whether mode is enabled/disabled for SV and MV operation.
Operation from faceplate
Mode
SV operation*
1
Operation from upper computer
2
MV operation*
SV operation
MV operation
MANUAL
Enable
Enable
Disable
Disable
AUTO
Enable
Disable
Disable
Disable
CASCADE
Disable
Disable
Disable
Disable
COMPUTER MV
Disable
Disable
Enable
Enable
COMPUTER SV
Disable
Disable
Enable
Disable
CASCADE DIRECT
Disable
Disable
Disable
Disable
*1: Indicates the operations of executing step number (STC) and time in the step (T)
for PGS2 when the tag type is PGS2.
*2: Indicates the operation of PGS2 setting value (SV) when the tag type is PGS2.
Control modes are different according to different tag types.
Besides, mode switching is restricted according to tag types. For details of tag types,
refer to Section 10.4
(1) Loop tag (PID, PIDP, SPI, IPD, BPI, R, ONF2, ONF3, SEL, 2 PID
PGS, PFC_SF, PFC_SS and PFC_INT, HTCL)
All modes except for CASCADE DIRECT can be set and no restrictions
regarding mode transition.
(2) Loop tag (2PIDH)
All modes can be set.
Switching to CASCADE DIRECT mode is only possible from CASCADE mode.
No restrictions regarding other modes.
MANUAL
AUTO
COMPUTER MV
COMPUTER SV
CASCADE
CASCADE DIRECT
(3) Loop tag (MOUT and MWM)
MANUAL and COMPUTER MV modes can be set for them. No restrictions
regarding other modes.
(4) Loop tag (PGS2) and Status tag (NREV, REV, MVAL1, MVAL2 and
PB)
MANUAL and AUTO modes can be set for them. No restrictions regarding other
modes.
(5) Loop tag (MONI, BC and PSUM) and status tag (TIMER1, TIMER2,
COUNT1 and COUNT2)
Control mode display button is not displayed.
(6) Loop tag (SWM, PVAL)
All modes except for COMPUTER MV and CASCADE DIRECT can be set and
no restrictions regarding mode transition.
10-13
10-13
10 FACEPLATE
MELSOFT
POINT
If the I/O mode (
Section 10.3.2) is either OVERRIDE or TAG STOP, the
control mode cannot be switched from MANUAL.
If MDIH (Disable mode change) setting is executed by memory item
Section 10.5) of tag data, the disable mode cannot be selected.
(
REMARK
If the improper value is set on MODE of the memory item for the tag data
Section 10.5), the button displayed will be blank. At this time, control mode
(
should be set again by "Change Control Mode" dialog box. (The improper value will
not be set on MODE, if the user takes the normal operation with the monitor tool.)
10-14
10-14
10 FACEPLATE
10.3.4
MELSOFT
Changing the PGS motion type
PURPOSE
Display and set motion type by loop tag (PGS, PGS2).
The motion types are as follows:
Motion type
Tag type
HOLD
Description
PGS
After processing SV1 to SVn, the SVn and MVn values are held by SV and MV
respectively and the program is stopped.
PGS2
After processing T1 to Tn, the SVn value is held by SV and the program is stopped.
PGS
After processing SV1 to SVn, the SV value is set to 0 and MVn value is held by MV
and the program is stopped.
PGS2
After processing T1 to Tn, the STC and T values are set to 0 and SVn value is held by
SV and the program is stopped.
PGS
Repeats the processing from SV1 to SVn.
PGS2
Repeats the processing from T1 to Tn.
RETURN
CYCLIC
DISPLAY/SETTING SCREEN
1) Motion type setting button
2) Motion type display
PGS
PGS2
<Change Motion Type dialog box>
DISPLAY/SETTING DATA
Operation
display type
No.
Item
Description
Display color
1)
Motion type
setting button
PB-TYPE
Valid: Button text color
Click the button to display
"Change Motion Type" dialog box. Invalid: White
Valid: Button background color
2)
Motion type
display *1
STR
Display motion type.
Black
White
Background color
Invalid: Black
*1: Left blank if the motion type is invalid.
The relation between control mode (
following table.
10-15
Section 10.3.3) and motion type is as
10-15
10 FACEPLATE
MELSOFT
(1) PGS
Control mode
Motion type setting button
Motion type display
Motion status
MAN
Enabled
HOLD/RETURN
Stop the motion by SV and MV value.
AUT
Enabled
HOLD/RETURN
Operate the selection motion type.
CAS
Disabled
CYCLIC
Operate by CYCLIC motion type.
CMV
Enabled
HOLD/RETURN
CSV
Disabled
CYCLIC
Stop the motion by current SV and MV value.
Operate by CYCLIC motion.
POINT
When it stops in HOLD/RETURN mode, change the control mode
(
Section 10.3.3) to MANUAL mode.
When the control mode (
Section 10.3.3) is set as CAS/CSV mode, operate
by CYCLIC type no matter what motion type is selected in the "Change Motion
Type" dialog box.
(2) PGS2
Control mode
Motion type setting button
Motion type display
Motion status
MAN
Enabled
HOLD/RETURN/CYCLIC
Operates with the current SV value.
AUT
Enabled
HOLD/RETURN/CYCLIC
Operates with the selected motion type.
POINT
When the motion is stopped at HOLD/RETURN mode, the control mode
Section 10.3.3) is switched to MANUAL mode.
(
10-16
10-16
10 FACEPLATE
10.3.5
MELSOFT
Executing step No. setting
PURPOSE
Displays/sets an executing step No. with loop tag (PGS2).
DISPLAY/SETTING SCREEN
1) Executing step No. setting button
2) Executing step No. display
3) Command type radio button
4) Edit box
5) Set button
6) Close button
<Executing step No. setting dialog box>
DISPLAY/SETTING DATA
No.
Item
Operation
display type
1)
Executing step No.
setting button
PB-STC
2)
Executing step No.
display
NUM
3)
Command type
radio button
Select the command type.
4)
Edit box
Enables to enter a jump destination step
No. when step jump is selected.
5)
Set button
Step jump is selected:
Sets the value in the edit box to the
executing step No. (Can be set within
the range of 0 to 32).
Advance is selected:
Turns ON the advance command bit
only when the control mode is AUTO.
6)
Close button
Closes the dialog box.
10-17
Description
Display color
Background color
Displays the executing step No. setting
dialog box.
Button text
color
Button background
color
Displays the executing step No.
White
Black
(Follows the display color setting of
the dialog box.)
10-17
10 FACEPLATE
10.3.6
MELSOFT
Time in the step setting
PURPOSE
Displays/sets the time in the step with loop tag (PGS2).
DISPLAY/SETTING SCREEN
2) Time in the step display
1) Time in the step setting button
3) Time unit display
4) Edit box
5) Set button
6) Close button
<Time in the step setting dialog box>
DISPLAY/SETTING DATA
No.
Item
Operation
display type
Description
Display color
Background color
1)
Time in the step
setting button
PB-T
Displays the Time in the step setting
dialog box.
Button text
color
Button background
color
2)
Time in the step
display
NUM
Displays the time in the step.
White
Black
3)
Time unit display
STR
Displays the unit of the time in the step
("s" or "min").
White
Black
4)
Edit box
Enter the time in the step.
5)
Set button
Sets the time in the step.
6)
Close button
Closes the dialog box.
10-18
(Follows the display color setting of
the dialog box.)
10-18
10 FACEPLATE
10.3.7
MELSOFT
PV value setting
PURPOSE
Display and set PV value with high high/high/low/low low limit by bar graph.
DISPLAY/SETTING SCREEN
(1) When the PV value bar is displayed in
the positive direction
(2) When the PV value bar is displayed
in the negative direction
1) Scale high/low
limit
4) PV value high high
limit (HH) alarm bar
5) PV value high limit
(PH) alarm bar
8)
8) PV value bar
6) PV value low limit
(PL) alarm bar
7) PV value low low
limit (LL) alarm bar
2) PV value
engineering unit
3) PV value
10) PV value
setting button
11) Edit box
13) Close button
12) Set button
< PV value setting dialog box>
(3) When the PV value bar is displayed both positive and negative
direction from the base point
8)
9) PV value bar
base point
9)
8)
When the PV value bar is
greater than the base point
When the PV value bar is
equal to the base point
When the PV value bar is
less than the base point
When the PV value is equal to the value of "Base Point when Both Direction is
Section 9.14), PV value bar is overlapped over the PV value bar base
set" (
point and is displayed.
10-19
10-19
10 FACEPLATE
MELSOFT
DISPLAY/SETTING DATA
No.
Item
Operation
display type
1)
Scale high/low
limit
NUM
2)
PV value
engineering
unit
STR
3)
PV value
NUM
4)
5)
6)
7)
PV value high
high limit (HH)
alarm bar
PV value high
limit (PH) alarm
bar
PV value low
limit (PL) alarm
bar
PV value low
low limit (LL)
alarm bar
BAR
BAR
BAR
BAR
8)
PV value bar
BAR
9)
PV value bar
base point
BAR
10)
PV value
setting button
PB-PV
10-20
Description
Display color
Display scale high/low Text color
limit.
Display engineering
unit of PV value.
(8 characters)
Display the PV value.
(A total number of 8
bits including symbols
and decimal point)
Display PV value high
high limit (HH) alarm
range by bar.
Display PV value high
limit (PH) alarm range
by bar.
Display PV value low
limit (PL) alarm range
by bar.
Display PV value
low/low limit (LL)
alarm range by bar.
Background color
PV RH:
Background color
High
limit PV>RH:
PV high high/low low
Limit value bar color
PV RL:
Background color
Low
PV<RL:
limit
PV high high/low low
Limit value bar color
Text color
Background color
White
Black
PV high high/low low limit value bar color
Black
PV high/low limit value bar color
Black
PV high/low limit value bar color
Black
PV high high/low low limit value bar color
Black
<Normal>
When the display direction is the positive
direction, the display color is the PV value
bar positive direction color.
When the display direction is the negative
Display the PV value
direction, the display color is the PV bar
as a bar.
negative direction color.
The PV value bar can
When the display direction is both
be displayed in the
directions, the display color is the PV bar
positive direction,
both direction color (positive) if the PV
negative direction or
Black
value is equal to or greater than the PV
both direction.
bar base point.
The input high high,
The display color is the PV bar both
high, low and low low
direction color (negative) if the PV value
limit alarms occur
is less than the PV bar base point.
according to the
< When input high high limit/low low limit
alarm bit status.
alarm occurs >
PV high high/low low limit value bar color
< When input high low limit alarm occurs >
PV value high limit value/low limit value
bar color
When the PV value
bar is displayed in
White
Background color
both directions, the
base point of the PV
value is displayed.
Click the button to
Valid:
display the PV value
Button background color
Valid: Button text color
setting dialog box.
Changes to the button Invalid: Text color
Invalid:
display when the I/O
Background color
mode is OVERRIDE.
10-20
10 FACEPLATE
No.
11)
Item
Edit box
12)
Set button
13)
Close button
MELSOFT
Operation
display type
Description
Key in the PV value
to be set directly.
Click the "Enter" key
or set button, Input
value is displayed in
device.
Set PV value of edit
box.
Display color
Change with the display color set of dialog box.
Close dialog box.
The display color can be set in the faceplate of option setting (
10-21
Background color
Section 9.17 (3)).
10-21
10 FACEPLATE
10.3.8
MELSOFT
SV value setting
PURPOSE
Display and set SV value.
DISPLAY/SETTING SCREEN
(1) When the tag type is other
(2) When the tag type is 2PIDH, SWM,
than 2PIDH, PGS2, SWM, PFC_SF,
PFC_SF, PFC_SS, PFC_INT, PVAL
PFC_SS, PFC_INT, PVAL, HTCL
3) SV limit display
5) SV (target) pointer
4) SV pointer
6) SV (current) pointer
1) SV value setting
button
2) SV value
display
7) SV value (current) display
(3) When the tag is PGS2, HTCL
9) Edit box
10) Set button
8) Up/Down
button
11) Close button
< SV value setting dialog box (when the tag type is other than HTCL) >
< SV value setting dialog box (when the tag type is HTCL) >
10-22
10-22
10 FACEPLATE
MELSOFT
DISPLAY/SETTING DATA
No.
Item
Operation
display type
Description
Display color
Background color
PB-SV
Click the button to display SV value
setting dialog box.
Valid:
Button text color
Invalid:
Text color
Valid:
Button background color
Invalid:
Background color
SV value display
NUM
Display and set SV value display a
string of 8 bits including characters
and decimal point.
White
Black
3)
SV limit display
BAR
Display the limit of SV value.
SV/MV limit value
bar color
Black
4)
SV pointer
IND
Indicate the position of SV value in
display bar.
SV/MV pointer
color
Background color
5)
SV (target) pointer
IND
Indicate the position of SV value
(target) in display bar.
SV (target) pointer
color
Background color
6)
SV (current) pointer
IND
Indicate the position of SV value
(current) in display bar.
SV/MV pointer
color
Background color
7)
SV value (current)
display
NUM
Display the SV value (current).
White
Black
8)
Up/Down button
Click the button; SV value is changed
in a fixed amount each time.
9)
Edit box
Key in the SV value to be set directly.
Click the "Enter" key or set button,
Input value is displayed in device.
10)
Set button
Set SV value of edit box.
11)
Close button
Close dialog box.
1)
SV value setting
button
2)
Change with the display color set of dialog box.
Section 9.17
The display color can be set in the [Faceplate] of option setting (
(3)).
SV value is changed when the up/down button is released. Operations in clicking the
up/down button are as follows.
Low speed Up/Down button
High speed Up/Down button
Increase/decrease SV value by using the lowest unit.
Increase/decrease SV value by using the bigger value between 10
times of minimum value and 1% of display scale.
Increase/decrease SV value by using 10 times of minimum value.
POINT
When setting the SV Limit Excess Setting (
Section 9.17) of the Option setting
(faceplate) to "Valid", the SV value can be set exceeding the SV high/low limit
value.
10-23
10-23
10 FACEPLATE
10.3.9
MELSOFT
MV value setting
PURPOSE
Display and set the value of MV.
DISPLAY/SETTING SCREEN
(1) When the tag type is other
than ONF2, ONF3, HTCL
(2) When the tag type is HTCL
DISPLAY/SETTING DATA
No.
Item
Operation
display type
1)
MV value
setting button
PB-MV
Description
Display color
Background color
Click the button, display MV value setting Valid: Button text color Valid: Button background color
dialog box.
Invalid: Text color
Invalid: Background color
2)
MV value
display
NUM
Display and set MV value. (Display a
string of 6 bits at most including symbols
and decimal point.)
Other than PFC_INT tag: -10.0 to 110.0
PFC_INT tag: -110.0 to 110.0
3)
MV limit
display
BAR
Display the limit of MV value.
SV/MV limit value bar
color
Black
4)
MV pointer
IND
Indicate the position of SV value
background in display bar.
SV/MV pointer color
Background color
5)
ON/OFF
direction
display
character
STR
Display the MV value character.
(
Section 9.15)
For MV_HT, MV_CL of HTCL tag, display
Text color
the content registered on Faceplate
Display Pattern Setting.
(
Section 9.13)
6)
Up/Down
button
Click the button to change MV value in a
constant amount.
7)
Edit box
Key in the tag item value to be set
directly. Click the "Enter" key or set
button Input value is displayed in device.
8)
Set button
Set the tag item value within edit box.
9)
Close button
Close dialog box.
10-24
White
Black
Background color
(Change with the display color setting of dialog box.)
10-24
10 FACEPLATE
MELSOFT
The display color can be set in the [Faceplate] of option setting (
Section
9.17 (3)).
The tag item value is changed when the up/down button is released.
Operations in clicking the up/down button are as follows.
Low speed
Up/Down button
Increase/decrease the tag item value by using minimum value.
High speed
Up/Down button
Increase/decrease the tag item value by using 10 times of minimum value.
(3) When tag type is ONF2, ONF3
MV can only be set as two values (100%, 0%) or three values (100%, 50%, 0%)
when loop tags are ONF2 and ONF3, so MV value setting button is designed as
a button with display. The value is set as a constant value; other values cannot
be set in setting dialog box.
DISPLAY/SETTING SCREEN
2) MV value
display
1) MV value
Setting button
<ONF2>
<ONF3>
DISPLAY/SETTING DATA
No.
Item
Operation
display type
Description
Display color
Background color
Click MV button to change MV value to the value within ( ).
1)
MV value
PB-CL
setting button
2)
MV value
display
10-25
NUM
For the ONF2 tag, a setting of 0%
or 100% is available.
MV<50% : 0% switch lights up.
MV 50%: 100% switch lights up.
For the ONF3 tag, a setting of 0%,
50% or 100% is available.
MV<25% : 0% switch lights up.
25% MV<75% : 50% switch
lights up.
MV 75% : 100% switch lights up.
Display and set MV value.
The displayed characters shall be no
more than 5 bits including symbols and
decimal points.
Lit: green
Button text color Not lit: Button
background color
White
Black
10-25
10 FACEPLATE
MELSOFT
10.3.10 Count value setting
PURPOSE
Display and set the count value by using loop tag (BC) and status tag (TIMER1,
TIMER2, COUNT1 and COUNT2).
DISPLAY/SETTING SCREEN
2) Count value
display
1) Count value
setting button
3) Pre-complete
display
4)Complete
display
<BC>
< TIMER, COUNTER >
5)Edit box
6)Set button
7) Close button
<Count value setting dialog box>
DISPLAY/SETTING DATA
Operation
display type
Description
Display color
Background color
No.
Item
1)
Count value
setting button
PB-CNT
Click the button to,
display count value
setting dialog box.
2)
Count value
display
NUM
Graph a count value with
White
8 bits.
Black
3)
Pre-complete
display
PL
Graph color is changed
Pre-complete: Black
when count reaches SV1,
Others: No alarm color
2 or PSV value.
Pre-complete: Green
Others: Background color
4)
Complete
display
PL
Display color is changed
when count up reaches
SV value.
Complete: Green
Others: Background color
5)
Edit box
Key in the count value to
be set directly. Click the
"Enter" key or set button
Input value is displayed
in device.
6)
Set button
Set count value of edit
box.
7)
Close button
Close dialog box.
Button text color
Complete: Black
Others: No alarm color
(Change with the graph color setting dialog box.)
The graph color can be set in [Faceplate] of option setting (
10-26
Button background color
Section 9.17 (3)).
10-26
10 FACEPLATE
MELSOFT
10.3.11 Batch count operation
PURPOSE
Start/Stop count and reset value by using loop tag (BC, PSUM)
DISPLAY/SETTING SCREEN
1) Run button
2) Hold button
3) STOP/RESET
button
4) RESET/START
button
DISPLAY/SETTING DATA
No
Item
Operation
display type
Description
Text color
Background color
1)
RUN button
PB-CL
Start the operation.
Button text color
2)
HOLD button
PB-CL
Hold the value and stop operation.
Button text color
3)
STOP/RESET
button
PB-CL
Stop operation and, reset value.
Button text color
4)
RESET/START
button
PB-C
Start operation after resetting value.
Button text color
Valid
Invalid
Valid
Invalid
Valid
Invalid
: Green
: Button background color
: Green
: Button background color
: Green
: Button Background color
Button Background color
The display color can be set in the [Faceplate] of option setting (
9.17 (3)).
The status change caused by clicking the button is as follows:
Section
RUN state
("RUN" button
displays green)
STOP/RESET state
("STOP/RESET"
button displays green)
HOLD state
("HOLD" button
displays green)
Reset process
count value 0
The RUN state with a click on "RESET/START" button is the same as
the state of performing "RUN" after a click on "STOP/RESET" button.
10-27
10-27
10 FACEPLATE
MELSOFT
10.3.12 Count/Timer operation
PURPOSE
Start/Stop counter/Timer and reset value by using status tag (TIMER1, TIMER2,
COUNT1 and COUNT2).
DISPLAY/SETTING SCREEN
1) RUN button
2) STOP button
3) RESET button
4) RESET/START
button
DISPLAY/SETTING DATA
No.
Item
Operation
display type
Description
Text color
Background color
Valid
Invalid
Valid
Invalid
: Green
: Button background color
: Green
: Button background color
1)
RUN button
PB-CL
Start operation
Button text color
2)
STOP button
PB-CL
Stop operation
Button text color
3)
RESET button
PB-C
Reset value
Button text color
Button background color
4)
RESET/START
button
PB-C
Start operation after resetting value
Button text color
Button background color
The display color can be set in the [Faceplate] of option setting (
9.17 (3)).
The status change caused by clicking the button is as follows:
Section
RUN status
Display "RUN"
Button in green
HOLD state
"HOLD" button
displays green
RESET processing
(Count value 0)
Clicking "RESET/START" button is equal to executing "RUN"
after "RESET"button.
10-28
10-28
10 FACEPLATE
MELSOFT
10.3.13 Status operation
PURPOSE
Display the control status of device operation by loop tag (PVAL), status tag
(NREV, REV, MVAL1 and MVAL2).
DISPLAY/SETTING SCREEN
1) Status
button
2) Status display
3)Time-out reset
button
DISPLAY/SETTING DATA
No.
1)
2)
3)
Item
Operation
display type
Description
Display color
Background color
Number of
characters
PB-LC
Change the status of device.
Display the change of color
between status of set.
(Open/Close/Start/FWD Run/
REV Run)
Valid: Set color
Invalid: Button text
color
Valid: Set color
Invalid: Button
background color
8 characters
PB-C
Change device status.
Display color does not change
(MVAL2 STOP)
Button text color
Button background color
8 characters
PL
Display device status
(Semiopen (not displayed for
PVAL.)/Remote/Local)
Valid: Set color
Invalid: Background
color
Valid: Set color
Invalid: Background color
8 characters
PL
Display abnormal status of
device. (Trip/Time-out)
Occurring: Black
Recovered: No alarm
color
Occurring: Alarm color
Recovered: Background
color
8 characters
Reset the time-out status
Button text color
Button background color
Status
button
Status
display
Time-out
PB-C
reset button
The display color (set color) and displayed string of status button and status
Section 9.13).
display can be set by faceplate display pattern setting (
Section 9.17 (1)) in option setting. No
Alarm color can be set by [General] (
alarm color, button text color and button background color can be set by
Section 9.17 (3)) in option setting
[Faceplate] (
10-29
10-29
10 FACEPLATE
MELSOFT
10.3.14 Command button operation
PURPOSE
To change the status of the device on the status tag (PB).
DISPLAY/SETTING SCREEN
1) Command button
DISPLAY/SETTING DATA
No.
1)
Item
Command
button
Operation
display type
PB-ONF
Description
Display color
Change the status of the device.
The display color and background Valid: ON set color
color change in accordance with
Invalid: OFF set color
the status being set.
Background color
Valid: ON set color
Invalid: OFF set color
Number of
characters
8 characters
The ON/OFF history type, display color (set color) and display string can be set
Section 9.13) against each button.
in the faceplate display pattern setting (
10-30
10-30
10 FACEPLATE
MELSOFT
10.4 Tag Types
The types of tag that can be displayed in a faceplate are listed in the following table.
As for the contents displayed in the faceplate of each tag, please refer to the sections
in "Reference".
Classification
Loop tag
Status tag
Alarm tag
Message tag
10-31
Tag type
Name
Reference
PID
PID control
Section 10.5.1
2PID
2-degree-of-freedom PID control
Section 10.5.1
2PIDH
2-degree-of-freedom Advanced PID control
Section 10.5.2
PIDP
Position type PID control
Section 10.5.1
SPI
Sample PI control
Section 10.5.1
IPD
I-PD control
Section 10.5.1
BPI
Blend PI control
Section 10.5.1
R
Ratio control
Section 10.5.1
ONF2
2 position ON/OFF control
Section 10.5.3
ONF3
3 position ON/OFF control
Section 10.5.3
PFC_SF
Predictive functional control (simple first order lag)
Section 10.5.12
PFC_SS
Predictive functional control (simple second order lag)
Section 10.5.12
PFC_INT
Predictive functional control (integral process)
Section 10.5.12
PGS
Program setter
Section 10.5.4
PGS2
Multi-point program setter
Section 10.5.5
MOUT
Manual output
Section 10.5.6
MONI
Monitor
Section 10.5.7
SWM
Manual setter with monitor
Section 10.5.8
MWM
Manual output with monitor
Section 10.5.9
SEL
Loop selector
Section 10.5.10
BC
Batch counter
Section 10.5.11
PSUM
Pulse integrator
Section 10.5.11
PVAL
Position-proportional output
Section 10.5.13
HTCL
Heating and cooling output
Section 10.5.14
NREV
Motor Irreversible Control
Section 10.6.1
REV
Motor reversible Control
Section 10.6.1
MVAL1
ON/OFF control 1 (without intermediate value)
Section 10.6.1
MVAL2
ON/OFF control 2 (with intermediate value)
Section 10.6.1
PB
Push button operation
Section 10.6.3
TIMER1
Timer1 (Timer stops when COMPLETE flag is on.)
Section 10.6.2
TIMER2
Timer2 (Timer continues when COMPLETE flag is on.)
Section 10.6.2
COUNT1
Count1 (Counter stops when COMPLETE flag is on.)
Section 10.6.2
COUNT2
Count2 (Counter continues when COMPLETE flag is on.)
Section 10.6.2
ALM
Alarm
Section 10.7.1
ALM_64PT
64-points alarm
Section 10.7.2
MSG
Message
Section 10.8.1
MSG_64PT
64-points message
Section 10.8.2
10-31
10 FACEPLATE
MELSOFT
These items in the following table are the example items of "Section 10.3 Displaying
Parts on Faceplate" displayed in the faceplate of each tag type. As for the display
contents and operations of the corresponding item in the following explanations of
each faceplate display, refer to sections in "Reference".
Part
Reference
Loop
Tag
type
Status
Alarm
Message
PID
2PID
2PIDH
PIDP
SPI
IPD
BPI
R
ONF2
ONF3
PFC_SF
PFC_SS
PFC_INT
PGS
PGS2
MOUT
MONI
SWM
MWM
SEL
BC
PSUM
PVAL
HTCL
NREV
REV
MVAL1
MVAL2
PB
TIMER1
TIMER2
COUNT1
COUNT2
ALM
ALM_64PT
MSG
MSG_64PT
I/O Control Motion STC Time in
the step
Mode mode type setting setting
Section Section Section Section Section
10.3.2 10.3.3 10.3.4 10.3.5 10.3.6
-------------------------------------------------------------------------------------------------------------------------------------
----------
----------------------------
-------
-------------------------
-------------------------------------------------------------------
-------------------------------------------------------------------
-------------------------------------------------------------------
PV
value
setting
Section
10.3.7
SV
value
setting
Section
10.3.8
MV
value
setting
Section
10.3.9
( )
( )
( )
---( )
----
( )
( )
( )
------------------(
(
(
(
)
)
)
)
-------------
----------------------
----------------------------------------
-------
-------------------------------------------------
BC
C/T STATUS
Count
setting opera- opera- operation
tion
tion
Section Section Section Section
10.3.10 10.3.11 10.3.12 10.3.13
-------------------------------------------------------------------------------------------------------------------------------------------------------------------------------------------------------------------------------------------------------------------------------------------------------------------------------------------------------------------------------------------------------------
: Display corresponding to faceplate, ( ): Only display a part of common pattern,
Command
button
operation
Section
10.3.14
-------------------------------------------------------------------------------------------------------------
: No display
REMARK
In SV value of R, bar is display by ratio to PV value.
In MV value setting of ONF2 and ONF3, bar is not displayed and the MV value
setting button can only be set as 2 position (0%, 100%) or 3 position (0%, 50%,
100%)
In SV value setting of PGS, bar is not displayed, display SV pointer on the
Section 10.3.1).
pattern graph (
10-32
10-32
10 FACEPLATE
MELSOFT
10.5 Loop Tag Faceplate
Loop tag is a tag used for loop control processing.
The types in the loop tag and reference section are as follows:
Tag type
Reference
PID, PIDP, SPI, IPD, BPI, R, 2PID
Section 10.5.1
2PIDH
Section 10.5.2
ONF2, ONF3
Section 10.5.3
PGS
Section 10.5.4
PGS2
Section 10.5.5
MOUT
Section 10.5.6
MONI
Section 10.5.7
SWM
Section 10.5.8
MWM
Section 10.5.9
SEL
Section 10.5.10
BC, PSUM
Section 10.5.11
PFC_SF, PFC_SS, PFC_INT
Section 10.5.12
PVAL
Section 10.5.13
HTCL
Section 10.5.14
The memory configurations of tag data generally used in loop tag are as follows:
For details of each tag data, refer to "PX Developer Programming Manual".
Offset
Tag data item
Description
Reference
1
+0
FUNC
Tag function code
A code represents tag type (System area * )
Section 10.4
+1
MODE
Control mode
Valid/invalid of each selection item of control mode
Section 10.3.3
+2
MDIH
Disable Mode Change
Valid/invalid of each selection item of I/O mode control
mode and auto tuning
Section 10.3.2
Section 10.3.3
Section 7.7.5
+3
ALM
Alarm
The occur/recovery status of each alarm
Section 7.3
+4
INH
Disable Alarm Detection
The valid/invalid of each alarm
Section 7.3
+5
ALML
Alarm level
The level of each alarm (major/minor alarm)
Section 7.3
Section 9.16
+6
CTNO
Lockout tag No.
0: no lockout tag, 1 to 32: lockout tag No in display
(System area *1)
+7
CTFN
Lockout tag function
The authority of using lockout tag (system area *1)
Section 10.2
+8
UNIT
Unit
Industrial unit No. (0 to 127)
Section 9.12
+9
N
No. of digits after decimal point
+ 10 to 93
Display digits after decimal point (0 to 4)
----
(The contents are different according to different tag types)
+ 94
DOM
Monitor output butter
+ 95
DIM
Monitor input butter
The information downloaded from personal computer to
CPU module such as valid/invalid setting in each
selection item of I/O mode. (System area *1)
Occur/recovery status of error read from CPU module to
personal computer (system area *1)
Section 10.3.2
Section 7.4.1
*1: Please do not perform writing by user in system area.
10-33
10-33
10 FACEPLATE
MELSOFT
POINT
In setting MDIH (disable mode change), the disabled mode on the faceplate
which displays tag data (or auto tuning function) cannot be selected.
In setting INH (disable alarm detection), the disabled alarm for tag data will not
occur.
If tag types are PID, 2PID, 2PIDH, set contents related to tuning function in
DOM/DIM (Monitor Input/Output Buffer).
If tag types are BC, PSUM, set contents related to batch counter operation in
DOM/DIM (Monitor Input/Output Buffer).
10-34
10-34
10 FACEPLATE
10.5.1
MELSOFT
PID, PIDP, SPI, IPD, BPI, R, 2PID
PURPOSE
Perform display and operation of PV, SV, MV values of loop tag in the faceplate of
basic PID control, position type PID control, sample PI control, I-PD control (IPD),
blend PI control (BPI), 2-degree-of-freedom PID control (2PID).
Set SV value using ratio (%) to PV value in the faceplate of ratio control.
DISPLAY/SETTING SCREEN
1) I/O mode
change
SV value display (Bar display)
Display the ratio corresponding
to PV value
4) PV value
display
(Bar display)
9) Ratio
high/low limit.
6) SV value display
(Bar display)
3) PV value setting
5) SV value setting
7) MV value setting
8) MV value display
(Bar display)
2) Control mode
change
<In PID,PIDP,SPI,IPD,BPI,2PID>
<R>
DISPLAY/SETTING DATA
No.
Item
Description
Reference
1)
I/O mode change
Display and set I/O mode.
Section 10.3.2
2)
Control mode change
Display and set control mode.
Section 10.3.3
3) 4)
PV value setting
Display and set PV value.
Section 10.3.7
5) 6)
SV value setting
Display and set SV value.
Section 10.3.8
7) 8)
MV value setting
Display and set MV value.
Section 10.3.9
Ratio high/low limit
Display ratio high/low limit (RMIN, RMAX) of SV value.
(Operation display type: NUM)
9)
10-35
10-35
10 FACEPLATE
MELSOFT
(1) Selectable I/O mode
The following mode transition is possible.
OVERRIDE
NORMAL
*1
SIMULATION
*1: Can be switched only when the user authority (
mode.
Section 4.3) is engineer
(2) Selectable control mode
All modes except for CASCADE DIRECT can be set and no restrictions
regarding mode transition.
Enabling/disabling SV, MV operations in different modes are as follow.
Mode
SV operation
MV operation
MANUAL
Enable
Enable
AUTO
Enable
Disable
CASCADE, COMPUTER MV, COMPUTER SV
Disable
Disable
POINT
PV value can be changed when the I/O mode (
OVERRIDE.
Section 10.3.2) is
I/O mode can be changed only when the control mode (
MANUAL.
Section 10.3.3) is
If the I/O mode (
Section 10.3.2) is OVERRIDE, the control mode cannot be
switched from MANUAL.
If the setting of MDIH (disable mode change) is performed in the memory item
Section 10.5) of tag data, disabled mode cannot be selected.
(
10-36
10-36
10 FACEPLATE
10.5.2
MELSOFT
2PIDH
PURPOSE
PV, SV and MV values of loop tag are displayed and operated in the faceplate of
2-degree-of-freedom Advanced PID control (2PIDH).
To avoid the sudden change of MV value in SV value change, SV value can
1
gradually be changed in 2-degree-of-freedom Advanced PID control. *
Therefore, the following two values are displayed in the faceplate.
• SV value (target) : SV value set by an user in SV value change
• SV value (current) : SV value gradually changes from the value before the
change to SV value (target)
Moreover, the processing status of MV output is displayed in a MV status.
*1: Set the SV value (current) variation in the SV variation rate high limit value
(DSVL) of tag data item.
If the SV variation rate high limit value is 100% (initial setting status), the SV
value (current) will become the same value with the SV value (target) and the
SV value (current) cannot gradually be changed.
DISPLAY/SETTING SCREEN
1) I/O mode change
7) SV value display
(Bar display)
4) PV value display
(Bar display)
8) SV (target) pointer
9) SV (current) pointer
3) PV value setting
6) SV value (target)
setting
5) SV value (current) display
10) MV value setting
12) MV status text
11) MV value display
(Bar display)
2) Control mode change
10-37
10-37
10 FACEPLATE
MELSOFT
DISPLAY/SETTING DATA
No.
Item
Description
Reference
1)
I/O mode change
Display and set I/O mode.
Section 10.3.2
2)
Control mode change
Display and set control mode.
Section 10.3.3
3) 4)
PV value setting
Display and set PV value.
Section 10.3.7
5) 6) 7) 8) 9)
SV value setting
Display and set SV value (target) and SV value (current).
Section 10.3.8
10) 11)
MV value setting
Display and set MV value.
Section 10.3.9
MV status text
Display processing status for MV output.
(Following table)
12)
The following shows the display contents of MV status.
MV status is stored in an input monitor buffer (DIM) of tag data.
Display item
Preset MV output
processing
MV hold processing
MV tracking processing
Display string
Text color
Background color
Stopped
Nothing displayed
Background color
Background color
Executing
"PRESET"
Black
MV status color
Stopped
Nothing displayed
Background color
Background color
Executing
"HOLD"
Black
MV status color
Stopped
Nothing displayed
Background color
Background color
Executing
"TRK"
Black
MV status color
(1) Selectable I/O mode
The following mode transition is possible.
OVERRIDE
NORMAL
*1
TAG STOP
*1
SIMULATION
*1: Can be switched only when the user authority (
mode.
10-38
Section 4.3) is engineer
10-38
10 FACEPLATE
MELSOFT
(2) Selectable control mode
All modes can be set.
Switching to CASCADE DIRECT mode is only possible from CASCADE mode.
No restrictions regarding other modes.
MANUAL
AUTO
COMPUTER MV
COMPUTER SV
CASCADE
CASCADE DIRECT
Following table indicates whether mode is enabled/disabled for SV and MV
operation.
Mode
MANUAL
AUTO
CASCADE, CASCADE DIRECT,
COMPUTER MV, COMPUTER SV
SV operation
MV operation
Enable
Enable
Enable
Disable
Disable
Disable
POINT
PV value can be changed when the I/O mode (
OVERRIDE.
Section 10.3.2) is
I/O mode can be changed only when the control mode (
Section 10.3.3) is
MANUAL.
Note that switching the mode from NORMAL to TAG STOP is possible even if
the control mode is not MANUAL.
If the I/O mode (
Section 10.3.2) is either OVERRIDE or TAG STOP, the
control mode cannot be switched from MANUAL.
If the setting of MDIH (disable mode change) is performed in the memory item
Section 10.5) of tag data, disabled mode cannot be selected.
(
10-39
10-39
10 FACEPLATE
10.5.3
MELSOFT
ONF2, ONF3
PURPOSE
To set loop tag, perform display and operation of PV, SV, MV values in the
faceplate of 2 position ON/OFF control (ONF2) and 3 position ON/OFF control
(ONF3).
MV value is set in two positions of 0%, 100%, (or three positions of 0%, 50%,
100%)
DISPLAY/SETTING SCREEN
1) I/O mode change
4) PV value
display
(Bar display)
6) SV value display
(Bar display)
3) PV value setting
5) SV value setting
7) MV value
setting
2) Control mode
change
<In ONE2>
<In ONE3>
DISPLAY/SETTING DATA
No.
Description
Reference
1)
I/O mode change
Display and set I/O mode.
Section 10.3.2
2)
Control mode change
Display and set control mode.
Section 10.3.3
PV value setting
Display and set PV value.
Section 10.3.7
3) 4)
10-40
Item
5) 6)
SV value setting
Display and set SV value.
Section 10.3.8
7)
MV value setting
Display and set MV value.
Section 10.3.9
10-40
10 FACEPLATE
MELSOFT
(1) Selectable I/O mode
It is possible set NORMAL and OVERRIDE mode.
(2) Selectable control mode
All modes except for CASCADE DIRECT can be set and no restrictions
regarding mode transition.
Enable/Disable SV, MV operations in different modes are shown as follows.
Mode
SV operation
MV operation
MANUAL
Enable
Enable
AUTO
Enable
Disable
CASCADE, COMPUTER MV,
COMPUTER SV
Disable
Disable
POINT
PV value can be changed when the I/O mode (
OVERRIDE.
Section 10.3.2) is
I/O mode can be changed only when the control mode (
MANUAL.
Section 10.3.3) is
If the I/O mode (
Section 10.3.2) is OVERRIDE, the control mode cannot
be switched from MANUAL.
If the setting of MDIH (disable mode change) is performed in the memory item
Section 10.5) of tag data, disabled mode cannot be selected.
(
10-41
10-41
10 FACEPLATE
10.5.4
MELSOFT
PGS
PURPOSE
To set loop tag, display the pattern of MV corresponding to SV (elapsed time)
using graph in the faceplate of program setting device (PGS), set motion type.
DISPLAY/SETTING SCREEN
6) Pattem graph
display
2) Motion type change
3) SV value setting
4) MV value setting
5) MV value display
(Bar display)
1) Control mode
change
DISPLAY/SETTING DATA
No.
Item
Description
Reference
1)
Control mode changes
Display and set control mode.
Section 10.3.3
2)
Motion type switch
Display and set motion type.
Section 10.3.4
3)
SV value setting
Display and set SV value.
Section 10.3.8
4) 5)
MV value setting
Display and set MV value.
Section 10.3.9
6)
10-42
Pattern graph display
Display the pattern of MV corresponding to SV using
graph. (Operation display type: PGS)
The display contents are
same as the one shown in
Section 7.7.1 (2)
10-42
10 FACEPLATE
MELSOFT
(1) Selectable control mode
It is possible to set all modes, no restrictions for mode change.
Enabling/disabling SV, MV operations in different modes are as the following
table.
Mode
SV operation
MV operation
MANUAL
Enable
Enable
AUTO
Enable
Disable
CASCADE, COMPUTER MV,
COMPUTER SV
Disable
Disable
POINT
If the setting of MDIH (disable mode change) is performed in the memory item
Section 10.5) of tag data, disabled mode cannot be selected.
(
10-43
10-43
10 FACEPLATE
10.5.5
MELSOFT
PGS2
PURPOSE
Displays the setting values to the predetermined time in every step on a graph in
the faceplate for Multi-point program setter (PGS2) of the loop tag.
DISPLAY/SETTING SCREEN
1) I/O mode change
8) Wait status display
9) Pattern graph display
3) Motion type change
6) PV value display
4) Executing step No. setting
5) Time in the step setting
7) SV value setting
2) Control mode change
DISPLAY/SETTING DATA
No.
Item
1)
2)
3)
4)
5)
6)
7)
8)
I/O mode change
Control mode change
Motion type change
Executing step No. setting
Time in the step setting
PV value display
SV value setting
Wait status display
9)
Pattern graph display
10-44
Description
Displays/sets the I/O mode.
Displays/sets the control mode.
Displays/sets the motion type.
Displays/sets the executing step No.
Displays/sets the time in the step.
Displays the PV value.
Displays/sets the SV value.
Displays the current wait status.
Displays the setting values to the predetermined
time in every step on a graph. (Operation display
type: PGS2)
Reference
Section 10.3.2
Section 10.3.3
Section 10.3.4
Section 10.3.5
Section 10.3.6
Section 10.3.7
Section 10.3.8
The next page
The display contents are
same as the one shown in
Section 7.7.1 (3).
10-44
10 FACEPLATE
MELSOFT
The display during wait status is as follows.
The wait status is stored at input monitor buffer (DIM) in the tag data.
Status
Display string
Text color
Background color
Normal
During WAIT
"WAIT"
"WAIT"
No alarm color
Black
Background color
Green
Multi-point program setter FB (PGS2) enables to set the optional points exceeding
32 to the program by connecting two or more FBs in multi-link.
For program examples, refer to "PX Developer Programming Manual".
The tag of Multi-point program setter FB (PGS2) in multi-link enables the following
operations on the faceplate.
The SV value changed on the SV setting
when the control mode is MANUAL is
reflected to other faceplates of the multilinked FBs in multistage connection.
Only one FB can be switched to AUTO
mode in the faceplates of the multi-linked
FBs in multistage connection.
If switched to AUTO mode on any of the
faceplates, the AUTO modes set on
other faceplates are automatically
switched to MANUAL mode.
10-45
10-45
10 FACEPLATE
MELSOFT
(1) Selectable I/O mode
The following mode transition is possible.
NORMAL
*1
TAG STOP
*1: Can be switched only when the user authority (
mode.
Section 4.3) is engineer
(2) Selectable I/O mode
MANUAL and AUTO modes can be set.
Mode transition is not restricted.
POINT
Clicking on the graph enables to switch between "All step display" and
"Executing step display".
Click
<All step display>
<Executing step display>
When a mouse cursor is on the graph, its shape varies depending on the
display status as follows:
All step display:
Executing step display:
SV value can be changed only when the control mode (
MANUAL.
Section 10.3.3) is
If the setting of MDIH (disable mode change) is performed in the memory item
Section 10.5) of tag data, disabled mode cannot be selected.
(
10-46
10-46
10 FACEPLATE
10.5.6
MELSOFT
MOUT
PURPOSE
The MV value of loop tag can be displayed and operated in the faceplate of
manual output (MOUT).
DISPLAY/SETTING SCREEN
2) MV value setting
3) MV value display
(Bar display)
1) Control mode
change
DISPLAY/SETTING DATA
No.
Item
1)
2) 3)
Description
Control mode change
MV value setting
Display and set control mode.
Display and set MV value.
Reference
Section 10.3.3
Section 10.3.9
(1) Selectable control mode
MANUAL and COMPUTER MV modes can be set.
Enabling/disabling MV operations in different modes are as the following table.
Mode
MANUAL
COMPUTER MV
MV operation
Enable
Disable
POINT
If the setting of MDIH (disable mode change) is performed in the memory item (
Section 10.5) of tag data, disabled mode cannot be selected.
10-47
10-47
10 FACEPLATE
10.5.7
MELSOFT
MONI
PURPOSE
The PV value of loop tag can be displayed and operated in the faceplate monitor
(MONI).
DISPLAY/SETTING SCREEN
1) I/O mode
change
3) PV value display
(Bar display)
2) PV value
setting
DISPLAY/SETTING DATA
No.
Item
Description
Reference
1)
I/O mode change
Display and set I/O mode.
Section 10.3.2
2) 3)
PV value setting
Display and set PV value.
Section 10.3.7
(1) Selectable I/O mode
It is possible to set NORMAL and OVERRIDE mode.
POINT
PV value can be changed when the I/O mode (
OVERRIDE.
Section 10.3.2) is
If the setting of MDIH (Disable mode change) is performed in the memory item
Section 10.5) of tag data, disabled mode cannot be selected.
(
10-48
10-48
10 FACEPLATE
10.5.8
MELSOFT
SWM
PURPOSE
PV and SV values of loop tag are displayed and operated in the faceplate of
manual setter with monitor (SWM).
To avoid the sudden change of MV value in SV value change, SV value can
1
gradually be changed in manual setter with monitor. *
Therefore, the following two values are displayed in the faceplate.
• SV value (target) : SV value set by an user in SV value change
• SV value (current) : SV value gradually changes from the value before the
change to SV value (target)
*1: Set the SV value (current) variation in the SV variation rate high limit value
(DSVL) of tag data item.
If the SV variation rate high limit value is 100% (initial setting status), the SV
value (current) will become the same value with the SV value (target) and the
SV value (current) cannot gradually be changed.
DISPLAY/SETTING SCREEN
1) I/O mode change
3) PV value display
(Bar display)
7) SV value display
(Bar display)
8) SV (target) pointer
9) SV (current) pointer
4) PV value setting
5) SV value (target)
setting
6) SV value (current) display
2) Control mode change
10-49
10-49
10 FACEPLATE
MELSOFT
DISPLAY/SETTING DATA
No.
Item
Description
Reference
1)
I/O mode change
Display and set I/O mode.
Section 10.3.2
2)
Control mode change
Display and set control mode.
Section 10.3.3
3) 4)
PV value setting
Display and set PV value.
Section 10.3.7
5) 6) 7) 8) 9)
SV value setting
Display and set SV value (target) and SV value (current).
Section 10.3.8
(1) Selectable I/O mode
The following mode transition is possible.
OVERRIDE
NORMAL
*1
TAG STOP
*1: Can be switched only when the user authority (
mode.
Section 4.3) is engineer
(2) Selectable control mode
All modes except for COMPUTER MV and CASCADE DIRECT can be set and
no restrictions regarding mode transition.
Enabling/Disabling SV operation in different modes is as following table.
Mode
SV operation
MANUAL
Enable
AUTO
Enable
CASCADE, COMPUTER SV
Disable
POINT
PV value can be changed when the I/O mode (
Section 10.3.2) is
OVERRIDE.
I/O mode can be changed only when the control mode (
Section 10.3.3) is
MANUAL.
Note that switching the mode from NORMAL to TAG STOP is possible even if
the control mode is not MANUAL.
If the I/O mode (
Section 10.3.2) is OVERRIDE, the control mode cannot
be switched from MANUAL.
10-50
10-50
10 FACEPLATE
10.5.9
MELSOFT
MWM
PURPOSE
PV and MV values of loop tag are displayed and operated in the faceplate of
manual output with monitor (MWM).
DISPLAY/SETTING SCREEN
1) I/O mode
change
4) PV value display
(Bar display)
3) PV value
setting
5) MV value
setting
6) MV value display
(Bar display)
2) Control mode
change
DISPLAY/SETTING DATA
No.
10-51
Item
Description
Reference
1)
I/O mode change
Display and set I/O mode.
Section 10.3.2
2)
Control mode change
Display and set control mode.
Section 10.3.3
3) 4)
PV value setting
Display and set PV value.
Section 10.3.7
5) 6)
MV value setting
Display and set MV value.
Section 10.3.9
10-51
10 FACEPLATE
MELSOFT
(1) Selectable I/O mode
It is possible to set NORMAL and OVERRIDE mode.
(2) Selectable control mode
MANUAL and COMPUTER MV modes can be set.
Enabling/Disabling MV operation in different modes is as following table.
Mode
MV operation
MANUAL
Enable
COMPUTER MV
Disable
POINT
PV value can be changed when the I/O mode (
OVERRIDE.
Section 10.3.2) is
I/O mode can be changed only when the control mode (
MANUAL.
Section 10.3.3) is
If the I/O mode (
Section 10.3.2) is OVERRIDE, the control mode cannot
be switched from MANUAL.
If the setting of MDIH (disabled mode change) is performed in the memory item
Section 10.5) of tag data, disabled mode cannot be selected.
(
10-52
10-52
10 FACEPLATE
MELSOFT
10.5.10 SEL
PURPOSE
PV and MV values of loop tag are displayed and operated in the faceplate of loop
selector (SEL). The selected No. can be displayed.
DISPLAY/SETTING SCREEN
3) PV value
display
(Bar display)
2) PV value
display
6) Display the
selection number
4) MV value
setting
5) MV value display
(Bar display)
1) Control mode
change
DISPLAY/SETTING DATA
No.
Item
1)
Control mode change
Display and set control mode.
2) 3)
PV value display
Display PV value.
Section 10.3.7
4) 5)
MV value setting
Display and set MV value.
Section 10.3.9
Display the selected
number
Display selected number of signal
(SLNO). (Operation display type: NUM)
Section 10.3.1
6)
10-53
Description
Reference
Section 10.3.3
10-53
10 FACEPLATE
MELSOFT
(1) Selectable control mode
All modes except for CASCADE DIRECT can be set and no restrictions
regarding mode transition.
Enabling/disabling MV operations of different modes are as the following table.
Mode
MV operation
MANUAL
Enable
AUTO
Disable
CASCADE, COMPUTER MV, COMPUTER SV
Disable
POINT
If the setting of MDIH (disable mode change) is performed in the memory item
Section 10.5) of tag data, disabled mode cannot be selected.
(
10-54
10-54
10 FACEPLATE
MELSOFT
10.5.11 BC, PSUM
PURPOSE
To display PV value of loop tag and set count/timer, one can operate RUN button
in the faceplate of batch counter (BC) and pulse integrator (PSUM).
Count value can be operated and displayed in the faceplate of batch counter (BC).
Display pre-complete and complete.
DISPLAY/SETTING SCREEN
1) PV value display
2) Count value
setting
4) Batch count
operation
(Button)
3) Count value
setting
(Pre-complete &
complete display)
< BC>
< PSUM>
DISPLAY/SETTING DATA
No.
1)
2) 3)
4)
Item
Description
Reference
PV value display
Display PV value.
Section 10.3.7
Count value setting
Display and set count value.
Section 10.3.10
Batch count operation
Perform such as start/stop operation count.
Section 10.3.11
Pre-complete and complete is displayed in green when PV value reaches the SV
value set.
The display of COMPLETE-1 is changed when PV value reaches SV1 value. The
display of COMPLETE-2 is changed when PV value finally reaches SV2 value.
Then the display of COMPLETE is changed when PV value finally reaches SV
value.
10-55
10-55
10 FACEPLATE
MELSOFT
The status change caused by clicking the button is as follows:
RUN status
("RUN" button
displayed in green)
STOP/RESET status
("STOP/RESET"
button displayed
in green)
HOLD status
("HOLD" button
displayed in green)
RESET process
(count value 0)
The run status with a click on "RESET/START" button is
the same as the status of performing "RUN" after a click
on "STOP/RESET" button.
The three status of: RUN, HOLD, STOP/RESET can be changed in the faceplate of
loop tag (BC, PSUM). The button corresponding to current status displays in green.
Count value reset to 0 in STOP/RESET status.
Count value cannot be reset to 0 by clicking button in RUN status.
<Button operation examples>
1. Click RUN button when STOP/RESET button is green.
2. Starts to count value when RUN button is displayed in green.
3. Click HOLD button when RUN button is green.
4. The count stops when HOLD button changes to green.
5. Click RESET/START button when HOLD button is green.
6. RUN button changes to green after count is reset to 0, and count value starts to
count value.
7. Click STOP/RESET button when RUN button is green.
8. Count value stops and resets when STOP/RESET button is changed to green.
10-56
10-56
10 FACEPLATE
MELSOFT
10.5.12 PFC_SF, PFC_SS, PFC_INT
PURPOSE
PV, SV and MV values of loop tag are displayed and operated in the faceplate of
predictive functional control (PFC_SF, PFC_SS, PFC_INT).
To avoid the sudden change of MV value in SV value change, SV value can
1
gradually be changed in predictive functional control. *
Therefore, the following two values are displayed in the faceplate.
• SV value (target) : SV value set by an user in SV value change
• SV value (current) : SV value gradually changes from the value before the
change to SV value (target)
*1: Set the SV value (current) variation in the SV variation rate high limit value
(DSVL) of tag data item.
If the SV variation rate high limit value is 100% (initial setting status), the SV
value (current) will become the same value with the SV value (target) and the
SV value (current) cannot gradually be changed.
DISPLAY/SETTING SCREEN
1) I/O mode change
3) PV value display
(Bar display)
7) SV value display
(Bar display)
8) SV (target) pointer
9) SV (current) pointer
4) PV value setting
5) SV value (target)
setting
6) SV value (current) display
7) MV value setting
8) MV value display
(Bar display)
2) Control mode change
10-57
10-57
10 FACEPLATE
MELSOFT
DISPLAY/SETTING DATA
No.
Item
Description
Reference
1)
I/O mode change
Display and set I/O mode.
Section 10.3.2
2)
Control mode change
Display and set control mode.
Section 10.3.3
3) 4)
PV value setting
Display and set PV value.
Section 10.3.7
5) 6) 7) 8) 9)
SV value setting
Display and set SV value (target) and SV value (current).
Section 10.3.8
10) 11)
MV value setting
Display and set MV value.
Section 10.3.9
(1) Selectable I/O mode
The following mode transition is possible.
OVERRIDE
NORMAL
*1
TAG STOP
*1
SIMULATION
*1: Can be switched only when the user authority (
mode.
Section 4.3) is engineer
(2) Selectable control mode
All modes except for CASCADE DIRECT can be set and no restrictions
regarding mode transition.
Enable/Disable SV, MV operations in different modes are shown as follows.
Mode
SV operation
MV operation
MANUAL
Enable
Enable
AUTO
Enable
Disable
CASCADE, COMPUTER MV,
COMPUTER SV
Disable
Disable
POINT
PV value can be changed when the I/O mode (
OVERRIDE.
Section 10.3.2) is
I/O mode can be changed only when the control mode (
Section 10.3.3) is
MANUAL.
Note that switching the mode from NORMAL to TAG STOP is possible even if
the control mode is not MANUAL.
If the I/O mode (
Section 10.3.2) is either OVERRIDE or TAG STOP, the
control mode cannot be switched from MANUAL.
If the setting of MDIH (disable mode change) is performed in the memory item
Section 10.5) of tag data, disabled mode cannot be selected.
(
10-58
10-58
10 FACEPLATE
MELSOFT
10.5.13 PVAL
PURPOSE
Display/operate the PV value, SV value and the open/close status of motor valve
on the faceplate of position-proportional output (PVAL) in loop tag.
To avoid the sudden change of MV value in SV value change, SV value can
1
gradually be changed in position-proportional output. *
Therefore, the following two values are displayed in the faceplate.
• SV value (target) : SV value set by an user in SV value change
• SV value (current) : SV value gradually changes from the value before the
change to SV value (target)
*1: Set the SV value (current) variation in the SV variation rate high limit value
(DSVL) of tag item.
If the SV variation rate high limit value is 100% (initial setting status), the SV
value (current) will become the same value with the SV value (target) and the
SV value (current) cannot gradually be changed.
DISPLAY/SETTING SCREEN
1) I/O mode change
3) PV value display
(Bar display)
7) SV value display
(Bar display)
8) SV (target) pointer
9) SV (current) pointer
4) PV value setting
5) SV value (target)
setting
6) SV value (current) display
10) Status operation
2) Control mode change
10-59
10-59
10 FACEPLATE
MELSOFT
DISPLAY/SETTING DATA
No.
Item
Description
Reference
1)
I/O mode change
Display and set I/O mode.
Section 10.3.2
2)
Control mode change
Display and set control mode.
Section 10.3.3
PV value setting
Display and set PV value.
Section 10.3.7
5) 6) 7) 8) 9)
SV value setting
Display and set SV value (target) and SV value (current).
Section 10.3.8
10)
Status operation
Using Open/Close/Stop status button to operate device.
Section 10.3.13
3) 4)
Status button
Description
Open/Close/Stop
Open/Close/Stop motor valve
Status display
Description
Remote/Local
Trip
Time-out
Light in set color in remote and local status
Light in alarm color in device trip status due to overloading
Light in alarm color when device time–out is exceeded
(1) Selectable I/O mode
The following mode transition is possible.
OVERRIDE
NORMAL
*1
TAG STOP
*1
SIMULATION
*1: Can be switched only when the user authority (
mode.
Section 4.3) is engineer
(2) Selectable control mode
All modes except for COMPUTER MV and CASCADE DIRECT can be set and
no restrictions regarding mode transition.
Enabling/Disabling SV operation in different modes is as following table.
Mode
MANUAL
AUTO
CASCADE, COMPUTER SV
SV operation
Enable
Enable
Disable
POINT
PV value can be changed when the I/O mode (
Section 10.3.2) is
OVERRIDE.
I/O mode can be changed only when the control mode (
Section 10.3.3)
is MANUAL.
Note that switching the mode from NORMAL to TAG STOP is possible even if
the control mode is not MANUAL.
If the I/O mode (
Section 10.3.2) is either OVERRIDE or TAG STOP, the
control mode cannot be switched from MANUAL.
If the setting of MDIH (disable mode change) is performed in the memory item
(
Section 10.5) of tag data, disabled mode cannot be selected.
10-60
10-60
10 FACEPLATE
MELSOFT
10.5.14 HTCL
PURPOSE
SV, MV_HT and MV_CL values of loop tag are displayed and operated in the
faceplate of heating and cooling output (HTCL).
DISPLAY/SETTING SCREEN
1) I/O mode change
3) Split graph
4) PID parameter tracking display
5) SV value setting
6) SV value display
(Bar display)
7) MV_HT value setting
8) MV_HT value setting
(Bar display)
9) MV_CL value setting
10) MV_CL value setting
(Bar display)
2) Control mode change
DISPLAY/SETTING DATA
No.
Item
Description
Reference
1)
I/O mode change
Display and set I/O mode.
Section 10.3.2
2)
Control mode change
Display and set control mode.
Section 10.3.3
3)
Split graph
Display the graphs.
4)
PID parameter tracking display
Display the PID parameter that is tracking the upper tag.
5) 6)
SV value setting
Display and set SV value.
Section 10.3.8
7) 8)
MV_HT value setting
Display and set MV_HT value.
Section 10.3.9
9) 10)
MV_CL value setting
Display and set MV_CL value.
Section 10.3.9
10-61
10-61
10 FACEPLATE
MELSOFT
[Display split graph]
X-axis
: SV value from the primary loop
Y-axis
: MV_CL, MV_HT
Line of heating side : Red (changeable depending on the background color of "Using
the PID Heating" on Faceplate Display Pattern Setting
Section 9.13))
(
Line for cooling side : Light blue (changeable depending on the background color of
"Using the PID Cooling" on Faceplate Display Pattern Setting
Section 9.13))
(
Intersection line of SV and MV_HT/MV_CL: White
Nothing is displayed when DBND value or SPLT value is out of
range.
The intersection line of SV and MV_HT/MV_CL is not displayed
when SV value is under 0 or over 100.
The horizontal line of MV_CL is displayed when DBND is
negative value, or SV value is under SPLT value.
The horizontal line of MV_HT is displayed when DBND is
negative value, or SV value is over SPLT value.
Background
: Black
The graph is displayed starting from SPLT, DBND toward 100% of heating, cooling.
The intersection lines which indicate the current SV value and MV value of
heating/cooling are displayed.
SPLT :
DBND :
50%
0%
SPLT :
DBND :
50%
10%
SPLT : 50%
DBND : -10%
Intersection
point of heating
SPLT
SV value
SPLT
SV value
SPLT
Intersection
point of cooling
SV value
DBND
DBND
[Display PID of heating /cooling]
Display which PID is used.
Display item
Display string
1
Using the PID Heating HEAT *
Using the PID Cooling
Text color
Normal
Background color
: No alarm color Normal
1
Executing : Black *
1
COOL *
Normal
1
Executing : Red *
: No alarm color Normal
1
Executing : Black *
: Background color
1
Executing : Light Blue *
*1: It can be switched on Faceplate Display Pattern Setting (
10-62
: Background color
Section 9.13).
10-62
10 FACEPLATE
MELSOFT
(1) Selectable I/O mode
The following mode transition is possible.
NORMAL
*1
TAG STOP
*1: Can be switched only when the user authority (
mode.
Section 4.3) is engineer
(2) Selectable control mode
All modes except for CASCADE DIRECT can be set and no restrictions
regarding mode transition.
Enable/Disable SV, MV operations in different modes are shown as follows.
Mode
SV operation
MV_HT/MV_CL operation
MANUAL
Enable
Enable
AUTO
Enable
Disable
CASCADE, COMPUTER MV,
COMPUTER SV
Disable
Disable
POINT
PV value can be changed when the I/O mode (
OVERRIDE.
Section 10.3.2) is
I/O mode can be changed only when the control mode (
Section 10.3.3)
is MANUAL.
Note that switching the mode from NORMAL to TAG STOP is possible even if
the control mode is not MANUAL.
If the I/O mode (
Section 10.3.2) is either OVERRIDE or TAG STOP, the
control mode cannot be switched from MANUAL.
If the setting of MDIH (disable mode change) is performed in the memory item
Section 10.5) of tag data, disabled mode cannot be selected.
(
10-63
10-63
10 FACEPLATE
MELSOFT
10.6 Status Tag Faceplate
Status tag is a tag used to monitor and control ON/OFF status.
The tag types in the status tag and reference sections are as follows.
Tag type
Reference
NREV, REV, MVAL1, MVAL2
Section 10.6.1
TIMER1, TIMER2, COUNT1, COUNT2
Section 10.6.2
PB
Section 10.6.3
The memory configurations of tag data generally used in status tag are as follows.
For details of each tag data, refer to "PX Developer Programming Manual".
Offset
Tag data item
Description
Reference
1
+0
FUNC
Tag function code
A code represents tag type (System area * )
Section 10.4
+1
MODE
Control mode
Valid/invalid of each selection item of control mode
Section 10.3.3
+2
MDIH
Disable mode change
Valid/invalid of each selection item of I/O mode, control
mode and auto tuning
Section 10.3.2
Section 10.3.3
Section 7.7.5
+3
ALM
Alarm
The Occur/Recovery status of each alarm
Section 7.3
+4
INH
Disable alarm detection
The Valid/Invalid of each alarm
Section 7.3
+5
ALML
Alarm level
The level of each alarm (Major/Minor alarm)
Section 7.3
CTNO
Lockout tag No.
0: No lockout tag, 1 to 32: lockout tag No in display.
(System area *1)
Section 9.16
CTFN
Lockout tag function
The authority of using lockout tag (system area *1)
Section 10.2
FPNO
Display name pattern
Display name pattern No. (1 to 50)
Section 9.13
Monitor output buffer
The information downloaded from personal computer to
CPU module such as valid/invalid setting in each selection
item of I/O mode.
Section 10.3.2
Section 10.6.1
Section 10.6.2
Section 10.6.3
Monitor input buffer
The information uploaded from CPU module to personal
computer such as Executing/Unexecuted. (System area *1)
Section 10.6.1
Section 10.6.2
Section 10.6.3
Section 7.4.1
+6
+7
+8
*2
+9
DOM
+ 10
DIM
+ 11 to +18
(The tag types are different according to contents.)
*2
FPNO1
Display name pattern 1
+ 20 *2
FPNO2
Display name pattern 2
+ 21 *2
FPNO3
Display name pattern 3
+ 22 *2
FPNO4
Display name pattern 4
+ 23 *2
FPNO5
Display name pattern 5
+ 19
Display name pattern No. (1 to 10,000)
Section 9.13
*1: Please do not perform writing by user in system area.
*2: +8 is only for tags other than PB tag, and +19 to +23 are only for PB tag.
POINT
In setting MDIH (disable mode change), the inhibited mode on the faceplate
which displays tag data cannot be selected.
In setting INH (disable alarm detection), the inhibited alarm related to the tag
data cannot occur.
DOM (Monitor output buffer) can be loaded from tag data access control
Appendix 5.1).
(
Please do not load it from user program.
10-64
10-64
10 FACEPLATE
10.6.1
MELSOFT
NREV, REV, MVAL1, MVAL2
PURPOSE
Open/Close/Start/Forward Run/Reverse Run status of motor and motor valve of
status tag are displayed and operated in the faceplate of motor irreversible control
(NREV), motor reversible (REV), ON/OFF control (MVAL1, MVAL2).
DISPLAY/SETTING SCREEN
1) I/O mode change
3) Status operation
2) Control mode
change
<In NREV>
<In REV>
<In MVAL1>
<In MVAL2>
DISPLAY/SETTING DATA
No.
Description
Reference
1)
I/O mode change
Display and set I/O mode.
Section 10.3.2
2)
Control mode change
Display and set control mode.
Section 10.3.3
Status operation
Using Open/Close/Start/FWD Run/
REV Run status button to operate
device.
Section 10.3.13
3)
10-65
Item
10-65
10 FACEPLATE
MELSOFT
Status button
Description
Start/Stop
Start or stop the run of motor
FWD Run/REV Run/
Stop
Start or stop the forward or reverse run of motor
Open/Close
Open or close motor valve
Status display
Description
Semiopen
Light in set color in semi open status
Remote/Local
Light in set color in remote and local status
Trip
Light in alarm color in device trip status due to overloading
Time-out
Light in alarm color when device time–out is exceeded
(1) Selectable I/O mode
The following mode transition is possible.
OVERRIDE
NORMAL
*1
SIMULATION
*1: Can be switched only when the user authority (
mode.
Section 4.3) is engineer
(2) Selectable control mode
MANUAL and AUTO modes can be set.
Enable/disable status operations in different modes are as following table.
Mode
Status operation
MANUAL
Enable
AUTO
Disable
POINT
I/O mode can be changed only when the control mode (
MANUAL.
Section 10.3.3) is
If the I/O mode (
Section 10.3.2) is OVERRIDE, the control mode cannot be
switched from MANUAL.
If the setting of MDIH (disable change mode) is performed in the memory item
Section 10.5) of tag data, disabled mode cannot be selected.
(
10-66
10-66
10 FACEPLATE
10.6.2
MELSOFT
TIMER1, TIMER2, COUNT1, COUNT2
PURPOSE
Timer/Count value of status tag is displayed and operated in the faceplate of timer
(TIMER1, TIMER2), counter (COUNT1, COUNT2).
DISPLAY/SETTING SCREEN
1) PV value
display
2) Count value
setting
4) Count/Timer
operation
3) Count value
setting
(Pre-complete &
complete display)
DISPLAY/SETTING DATA
No.
1)
2) 3)
4)
10-67
Item
Description
Reference
PV value display
Display PV value
Section 10.3.7
Count value setting
Display and set count value
Section 10.3.10
Count/Timer operation
Perform Run/Stop operation of Count/Timer
Section 10.3.12
10-67
10 FACEPLATE
MELSOFT
The status change caused by clicking the button is as follows:
RUN state
("RUN" button
displayed in green)
STOP status
("STOP" button
displayed in green)
RESET process
count value 0
The RUN status with a click on "RESET/START" button is
the same as the status of performing "RUN" after a click
on "START/RESET" button.
The two status of RUN, STOP can be changed in the faceplate of status tag (TIMER1,
TIMER2, COUNT1, COUNT2).
The button corresponding to current status is displayed in green color.
Count value is reset to low limit when clicking "Reset" button.
Count value itself can be reset in RUN status.
<Button operation examples>
1. Click RUN button when STOP button is green.
2. Count value starts to count-up when RUN button changes to green.
3. Click STOP button when RUN button is green.
4. The count stops when STOP button changes to green.
5. Click RESET/START button when STOP button is green.
6. RUN button changes to green after count value is reset, count value starts to
count-up.
7. Click RESET button when RUN button is green.
8. Count value is reset, RUN button keeps green, and count-up starts from the
initial status.
10-68
10-68
10 FACEPLATE
10.6.3
MELSOFT
PB
PURPOSE
The reset button and radio button are displayed and operated, and the status of
the process etc. is displayed in the faceplate of push button operation (PB).
DISPLAY/SETTING SCREEN
2) Command button operation
1) Control mode
change
DISPLAY/SETTING DATA
No.
10-69
Item
Description
Reference
1)
Control mode change
Display and set control mode
Section 10.3.3
2)
Command button operation
Operate the device with the command button.
Section 10.3.14
10-69
10 FACEPLATE
MELSOFT
(1) Selectable control mode
MANUAL and AUTO modes can be set.
Enable/disable command button operations in different modes are as following
table.
Mode
Status operation
MANUAL
Enable
AUTO
Disable
POINT
The following show the restrictions for making the setting in the memory item
Section 10.6) of tag data.
(
If the setting of MDIH (disable mode change) is made, disabled modes cannot
be selected.
If the setting of FPINH (disable display) is made, relevant buttons cannot be
displayed.
If the setting of BTNINH (disable button control) is made, relevant buttons
cannot be operated.
10-70
10-70
10 FACEPLATE
MELSOFT
10.7 Alarm Tag Faceplate
Alarm tag is a tag that indicates displays alarm occurrence.
The tag type in the alarm tag and reference section are show in the following table.
Tag type
Reference
ALM
Section 10.7.1
ALM_64PT
Section 10.7.2
The memory structure of alarm tag is as follows.
For details of each tag data, refer to "PX Developer Programming Manual".
(1) ALM tag
Offset
+0
Tag data item
FUNC
Tag function code
Description
Reference
1
A code represents tag type(System area * )
Section 10.4
1
+1
ALM
Alarm
The occur/recovery status of alarm 1 to 8 (System area * )
Section 7.3
+2
ALML
Alarm level
Alarm 1 to 8 level (Major/Minor alarm)
Section 7.3
+ 4 to
+ 11
ALM1NO to
ALM8NO
Alarm 1 Name No. to The number to specify displayed string at alarm occurrence
Alarm 8 Name No.
(1 to 10000)
Section 9.9
*1: Please do not perform writing by user in system area.
POINT
Set display string corresponding to each alarm (1 to 8) by alarm setting
Section 9.9).
(
(2) ALM_64PT tag
Offset
+0
Tag data item
FUNC
Tag function code
Description
Reference
1
A code represents tag type(System area * )
Section 10.4
1
+1
ALM_W1
Alarm 1 to 16
The occur/recovery status of alarm 1 to 16 (System area * )
+2
ALM_W2
Alarm 17 to 32
The occur/recovery status of alarm 17 to 32 (System area * )
+3
ALM_W3
Alarm 33 to 48
The occur/recovery status of alarm 33 to 48 (System area * )
+4
ALM_W4
Alarm 49 to 64
The occur/recovery status of alarm 49 to 64 (System area * )
+5
ALML_W1
Alarm 1 to 16 level
Alarm 1 to 16 level (Major/Minor alarm)
+6
ALML_W2
Alarm 17 to 32 level
Alarm 17 to 32 level (Major/Minor alarm)
+7
ALML_W3
Alarm 33 to 48 level
Alarm 33 to 48 level (Major/Minor alarm)
Alarm 49 to 64 level (Major/Minor alarm)
1
1
1
+8
ALML_W4
Alarm 49 to 64 level
+ 9 to
+ 72
ALM1NO to
ALM64NO
Alarm 1 Name No. to The number to specify displayed string at alarm occurrence
Alarm 64 Name No. (1 to 10000)
Alarm group 1 name
+ 73 to ALMG1NO to
No. to Alarm group8
+ 80
ALMG8NO
name No.
Section 7.3
Section 7.3
Section 9.9
The number to specify displayed group name at alarm
occurrence (1 to 10000)
----
*1: Please do not perform writing by user in system area.
POINT
Set display string corresponding to each alarm (1 to 64) and each alarm group
Section 9.9).
name by alarm setting (
10-71
10-71
10 FACEPLATE
10.7.1
MELSOFT
ALM
PURPOSE
Occurrence status of alarm is displayed in the faceplate of alarm tag for 8 points.
DISPLAY/SETTING SCREEN
1) Alarm display
DISPLAY/SETTING DATA
No.
1)
10-72
Item
Operation
display type
Alarm display PL
Description
Text color
Background color
Occurring: Black Occurring: Alarm color
Display occurred alarm.
Recovered:
Maximum display a string of 12 characters Recovered:
No alarm color
Background color
set by alarm setting (
Section 9.9).
10-72
10 FACEPLATE
10.7.2
MELSOFT
ALM_64PT
PURPOSE
Occurrence status of alarm is displayed in the faceplate of alarm tag for 64 points.
DISPLAY/SETTING SCREEN
1) Alarm group name display
2) Alarm display
DISPLAY/SETTING DATA
No.
1)
2)
10-73
Item
Operation
display type
Description
Text color
Background color
Alarm group
STR
name display
Display alarm group name.
Alarm display PL
Display occurred alarm.
Display the alarm separated in each alarm
group. The alarms are displayed in
ascending order from upper left in alarm
Occurring: Black Occurring: Alarm color
group.
Recovered:
Recovered:
The alarm content is displayed not with
No alarm color
Background color
alarm name, but with alarm number
(example: for ALM1, ‘1’). If the tag data
item (ALM1NO to ALM64NO) of the
corresponding alarm name No. is ‘0’, it will
be blank.
White
Black
10-73
10 FACEPLATE
MELSOFT
10.8 Message Tag Faceplate
Message tag is a tag that displays occurred event.
The tag types of message tag and reference chapters are as follows.
Tag type
Reference
MSG
Section 10.8.1
MSG_64PT
Section 10.8.2
The memory structure of message tag are as follows.
For details of each tag data, refer to "PX Developer Programming Manual".
(1) MSG tag
Offset
+0
Tag data item
FUNC
Description
Reference
Tag function code
A code represents tag type (System area *1)
Section 10.4
Section 7.4
Section 7.4
+1
MSG
Message
The occurred/recovered status of event 1 to 8
(System area *1)
+2
MSGCHK
Message confirm check
The confirmation check status of event 1 to 8 (Yes/No)
+ 4 to
+ 11
MSG1NO to
MSG8NO
Message 1 Name No. to The number to specify displayed string at event
Message 8 Name No.
occurrence (1 to 10000)
Section 9.10
*1: Please do not perform writing by user in system area.
POINT
Set display string corresponding to each event (1 to 8) by event setting
Section 9.10).
(
10-74
10-74
10 FACEPLATE
MELSOFT
(2) MSG_64PT tag
Offset
+0
Tag data item
FUNC
Description
Tag function code
A code represents tag type (System area *1)
+1
MSG_W1
Message 1 to 16
The occurred/recovered status of event 1 to 16
(System area *1)
+2
MSG_W2
Message 17 to 32
The occurred/recovered status of event 17 to 32
(System area *1)
+3
MSG_W3
Message 33 to 48
The occurred/recovered status of event 33 to 48
(System area *1)
+4
MSG_W4
Message 49 to 64
The occurred/recovered status of event 49 to 61
(System area *1)
+5
MSGCHK_W1
Message confirm check
1 to 16
The confirmation check status of event 1 to 16 (Yes/No)
+6
MSGCHK_W2
Message confirm check
17 to 32
The confirmation check status of event 17 to 32 (Yes/No)
+7
Message confirm check
MSGCHK_W3
33 to 48
The confirmation check status of event 33 to 48 (Yes/No)
+8
MSGCHK_W4
Message confirm check
49 to 64
The confirmation check status of event 49 to 64 (Yes/No)
+ 9 to
+ 72
MSG1NO to
MSG64NO
Message 1 Name No. to The number to specify displayed string at event
Message 64 Name No. occurrence (1 to 10000)
Message group 1 Name
+ 73 to MSGG1NO to
No. to Message group 8
+ 80
MSGG8NO
Name No.
Reference
Section 10.4
Section 7.4
Section 7.4
The number to specify displayed group name at event
occurrence (1 to 10000)
Section 9.10
----
*1: Please do not perform writing by user in system area.
POINT
Set display string corresponding to each event (1 to 64) and each message group
Section 9.10).
name by event setting (
10-75
10-75
10 FACEPLATE
10.8.1
MELSOFT
MSG
PURPOSE
Occurrence status of event is displayed in the faceplate of message tag for 8
points.
DISPLAY/SETTING SCREEN
1) Message display
DISPLAY/SETTING DATA
No.
1)
10-76
Item
Operation
display type
Message display PL
Description
Text color
Background color
Display occurred event.
Occurring: Black Occurring: Green
Maximum display a string of 12 characters
Section 9.10).
set by event setting (
Recovered:
Recovered:
No alarm color Background color
10-76
10 FACEPLATE
10.8.2
MELSOFT
MSG_64PT
PURPOSE
Occurrence status of event is displayed in the faceplate of message tag for 64
points.
DISPLAY/SETTING SCREEN
1) Message group name display
2) Message display
DISPLAY/SETTING DATA
No.
Item
1)
Message group
name display
2)
10-77
Operation
display type
STR
Message display PL
Description
Display event group name.
Text color
White
Background color
Black
Display occurred event.
Display the message separated in each
message group. The messages are
displayed in ascending order from upper
Occurring: Black Occurring: Green
left in message group.
The message content is displayed not with Recovered:
Recovered:
message name, but with message number
No alarm color Background color
(example: for MSG1, ‘1’).
If the tag data item (MSG1NO to
MSG64NO) of the corresponding message
name No. is ‘0’, it will be blank.
10-77
11 MONITORING WITH USER-CREATED SCREEN
MELSOFT
11 MONITORING WITH USER-CREATED SCREEN
The Monitor tool has the interaction function for utilizing the applications created in GT
SoftGOT1000 or Microsoft Visual Basic as the graphic screen.
R
R
(1) Utilizing GT SoftGOT
GT Designer2 or GT Designer3 enables to easily create the graphic screen. It
also enables to utilize edit data of the GOT for field monitoring.
(2) Utilizing Microsoft Visual Basic
R
R
The MonCtrl command and ActiveX control which controls the Monitor tool
enable to create a graphic screen application with great flexibility.
11.1 Utilizing GT SoftGOT
GT SoftGOT can call the PX Developer monitor tool function.
GT SoftGOT can be started by specifying a base screen with PX Developer Monitor
tool. The security level in accordance with the user authority can be specified when
starting GT SoftGOT.
Make the "PX Developer Function
Call Setting" to the touch switch.
<GT Designer3>
11-1
11-1
11
11 MONITORING WITH USER-CREATED SCREEN
11
MELSOFT
Monitor toolbar
Switches the GT SoftGOT base
screen.
GT SoftGOT base screen
A graphic screen that is displayed
full-screen on the desktop.
Faceplate screen
GT SoftGOT touch switch
Monitors or operates tags
and performs tuning.
Pops up each screen
for Monitor tool.
< Monitor tool and GT SoftGOT>
POINT
For compatible software package versions, refer to Section 2.2.
For using method of GT SoftGOT, GT Designer2 and GT Designer3, refer to the
following manuals.
• GT SoftGOT2000 Version 1 Operating Manual
• GT SoftGOT1000 Version 3 Operating Manual for GT Works3
• GT SoftGOT1000 Version 2 Operating Manual
• GT Designer3 (GOT2000) Screen Design Manual
• GT Designer3 Version 1 Screen Design Manual (Fundamentals)
• GT Designer3 Version 1 Screen Design Manual (Functions)
• GT Designer2 Version 2 Screen Design Manual (For GOT1000 Series)
11-2
11-2
11 MONITORING WITH USER-CREATED SCREEN
11.1.1
MELSOFT
Setting procedure to use the interaction function between the Monitor tool and
GT SoftGOT
The following flowchart shows the setting procedure to use the Monitor tool and
interaction function in GT SoftGOT.
Start the setting.
(1) Make the setting in the Monitor tool for interaction with
GT SoftGOT.
(2) Edit the screen with GT Designer2 or GT Designer3
(Make PX Developer Function Call Setting to the touch switch).
(3) Set the security with GT Designer2 or GT Designer3
(4) Using GT SoftGOT, read the project data created
on GT Designer2 or GT Designer3.
(5) Make setting for interaction using GT SoftGOT.
End
11-3
11-3
11 MONITORING WITH USER-CREATED SCREEN
MELSOFT
(1) Making the setting in the Monitor tool for interacting with GT
SoftGOT
Make the following settings in the Monitor tool.
1) Setting the monitor target project (
Section 9.4)
2) Setting the user-created
Specify the module number of GT SoftGOT to be started to the argument
Section 9.11).
(
3) Setting the control panel (
Section 9.7)
Set the control panel to display it on GT SoftGOT.
Section 9.8)
4) Setting the trend graph (
Set the trend graph to display it from GT SoftGOT.
POINT
To set Ethernet on the Transfer Setup screen of Monitor Target Project Setting,
specify TCP as the protocol.
(Since UDP is used for GT SoftGOT, avoid communications contention.)
11-4
11-4
11 MONITORING WITH USER-CREATED SCREEN
MELSOFT
(2) Editing with GT Designer2 or GT Designer3 (Making PX Developer
Function Call Setting to the touch switch)
• Positioning the base screen
Edit a screen for monitoring.
When displaying GT SoftGOT in full screen mode, make the margin by the
following areas.
Screen resolution (width)
[pixel]
Display area for the Monitor tool
(vertical length from the top of the screen) [pixel]
Less than 1280
86
1280 or more
102
The monitor toolbar is displayed here.
11-5
11-5
11 MONITORING WITH USER-CREATED SCREEN
MELSOFT
• Setting the touch switch
The following shows the method for the setting to start the faceplate with the
touch switch.
1) Double-click the touch switch.
11-6
11-6
11 MONITORING WITH USER-CREATED SCREEN
MELSOFT
2) Select "PX Developer Function Call" item in Switch Action, and click the
"Browse…" button.
3) Register the function to be called with "PX Developer Function Call Setting"
dialog box for specifying it.
11-7
11-7
11 MONITORING WITH USER-CREATED SCREEN
MELSOFT
(3) Setting the security with GT Designer2 or GT Designer3
The following shows the setting method for security level authentication with GT
Designer3.
For details of setting method with GT Designer2, refer to "GT Designer2 Version
2 Screen Design Manual".
1) Set the following on the Environmental Setting screen displayed with selecting
[Security…] under [Common] [GOT Environmental Setting] on the menu.
1
Authentication Method : Password *
Security Level Device
: desired device
2
Security Level Password : no setting *
*1: "Level" for GT Designer3 (GOT2000)
*2: When executing security interaction between PX Developer and GT SoftGOT, the
security level of GT SoftGOT is changed to that of the corresponding user authority
of the monitor tool. Therefore, do not set a password to avoid the security level
change with GT SoftGOT.
11-8
11-8
11 MONITORING WITH USER-CREATED SCREEN
MELSOFT
2) Set the security level (0 to 15) that is required to display or input on the screen
properties or advanced setting of objects.
3) Select "PX Developer Function Call" from "Switch Action" displayed by
double-clicking special function switch, and click the "Browse…" button.
11-9
11-9
11 MONITORING WITH USER-CREATED SCREEN
MELSOFT
4) Register "Change Mode" on the "PX Developer Function Call Setting" dialog
box being displayed.
(4) Using GT SoftGOT, read the project data created on GT Designer2
or GT Designer3.
(5) Making setting for interaction using GT SoftGOT.
1) Setting necessary items
The following table shows the required setting items for interaction with GT
SoftGOT.
Item
Description
Display dialog when starting GT SoftGOT1000 Has to be unchecked.
(2000), specified with the module that has been The dialog box is not displayed at base screen switching by unchecking
this item.
activated.
Display dialog when closing GT SoftGOT1000
(2000).
11-10
Has to be unchecked.
A time-out error when the monitor tool setting screen is displayed can be
avoided by unchecking this item.
11-10
11 MONITORING WITH USER-CREATED SCREEN
Item
Startup in Online Mode
MELSOFT
Description
Has to be checked.
A monitor starts immediately after GT SoftGOT start-up by checking this item.
2) Setting optional items
The following table shows the optional setting items for interaction with GT
SoftGOT.
Item
Description
Full Screen Mode
Displays GT SoftGOT in full screen mode.
Back Screen Mode
Always displays GT SoftGOT to the backmost.
*1
Authentication
Select a password.
Remarks
Also selecting Back Screen Mode is
recommended.
---The authentication "Security Level" of
GT Designer2 and the authentic
method "Password" of GT Designer3
are the same function, and both
perform with the authentic method
"Password" of GTSoftGOT1000.
*1: GT SoftGOT1000 only.
11-11
11-11
11 MONITORING WITH USER-CREATED SCREEN
11.1.2
MELSOFT
Monitoring procedure using the interaction function between the Monitor tool and
GT SoftGOT
The following flowchart shows the monitoring procedure using the interaction
function between the PX Developer monitor tool and GT SoftGOT.
Start monitoring.
(1) Start the PX Developer Monitor tool and
GT SoftGOT.
(2) Call the monitor tool functions from
GT SoftGOT.
(3) Switch the base screen on GT SoftGOT from
the monitor tool.
(4) Change the security level of GT SoftGOT when
changing the mode from the monitor tool.
(5) Change the monitor tool mode from GT
SoftGOT.
Terminate monitoring?
No
Yes
(6) Exit the monitor tool and GT SoftGOT.
End
(1) Starting the PX Developer Monitor tool and GT SoftGOT
(
Section 7.5)
1) Starting the Monitor tool
Start the Monitor tool from the Start menu.
2) Starting GT SoftGOT
Start GT SoftGOT with the user-created screen display button.
Click the user-created screen display button.
11-12
11-12
11 MONITORING WITH USER-CREATED SCREEN
MELSOFT
(2) Calling the monitor tool function from GT SoftGOT
Click the touch switch to which "PX Developer Function Call" has been set to call
the monitor tool function.
POINT
• A display position of the Monitor tool to be called can be adjusted as needed
(The position can be changed with PX Developer Function Call Setting).
11-13
11-13
11 MONITORING WITH USER-CREATED SCREEN
MELSOFT
(3) Switching the base screen of GT SoftGOT from the Monitor tool
Clicking the user-created screen display button switches
the base screen of GT SoftGOT to that of the specified
number.
(4) Changing mode from the Monitor tool
When changing a mode of the monitor tool, the security level of GT SoftGOT is
changed to that of corresponding user authority of PX Developer.
(5) Changing mode of the Monitor tool from GT SoftGOT
Display the "Change Mode" dialog box from a touch switch of PX Developer
Function Call, and input a user name and a password to change a mode.
For executing security interaction between the monitor tool and GT SoftGOT,
change the user authority with the Change Mode function.
Note that changing the security level by password authentication of GT SoftGOT
or changing security level device value cannot change a mode of the monitor tool.
(6) Exiting the Monitor tool and GT SoftGOT
Clicking the Exit button on the Monitor tool exits the Monitor tool and GT
SoftGOT started with the user-created screen display button on the Monitor tool.
Click the Exit button.
11-14
11-14
11 MONITORING WITH USER-CREATED SCREEN
MELSOFT
11.2 Utilizing Microsoft Visual Basic Application
R
R
When using Microsoft Visual Basic , MonCtrl command (
Appendix 5.2) and
ActiveX control (tag data access control and faceplate control) which externally
control the Monitor tool allow to create graphic screen applications with great
flexibility.
R
Function
R
Description
Measures
Reference
Tag data acquisition/
setting
Can obtain and set a tag data item value.
ActiveX control
(tag data access control)
Appendix 5.1.1
Faceplate display
Can display a pop-up faceplate.
Can embed a faceplate on the screen of external
application.
ActiveX control
(faceplate control)
Appendix 5.1.2
Monitor tool calling
Calls each function of the Monitor tool.
MonCtrl command
Appendix 5.2
Application created with Microsoft Visual Basic
Tag data display
Tag data change
Monitor tool window display
Data acquisition
PX Developer
Requesting data
acquisition
Requesting data
setting
ActiveX control
Display request
Window display
MonCtrl command
Monitor tool
POINT
Further, the interaction function with the following SCADA software is available in
PX Developer.
• Wonderware InTouch Version 10.0
• JoyWatcherSuite Version 6.0
For details, refer to the following manuals.
• PX Developer Operating Manual (InTouch Interaction)
• PX Developer Operating Manual (JoyWatcherSuite Interaction)
Note that the operations are not guaranteed when using the mixture of the SCADA
software other than mentioned above and ActiveX control provided by PX
Developer.
Check the system before the operations.
11-15
11-15
11 MONITORING WITH USER-CREATED SCREEN
11.2.1
MELSOFT
Using procedure for ActiveX control
The operation steps in using tag data access control and faceplate control in Visual
Basic are as follows.
For detailed operation methods, refer to manuals and help of Visual Basic .
R
R
(1) Setting method with Visual Basic 6.0
R
1. Click [Project]
on the menu.
[Components...]
2. Click the <<Insertable Objects>>
tab and select "MITSUBISHI
Faceplate Control" and
"MITSUBISHI Tag Access Control".
3. Click the "OK" button.
(To the next page)
11-16
11-16
11 MONITORING WITH USER-CREATED SCREEN
MELSOFT
(From the previous page)
4. "MITSUBISHI Tag Access Control"
and "MITSUBISHI Faceplate
Control" are added to the tool box.
5. Deploy "MITSUBISHI Tag Access
Control" and "MITSUBISHI
Faceplate Control" as the usual
command buttons on the form of the
user-created screen.
6. Display the control property dialog
box and specify tag name
(TagName).
Other programs related to screen
display such as color and character
display are executed in the case of
"MITSUBISHI Tag Access Control".
7. Create the exe format application
that are created by compiling, which
is displayed on user-created screen.
8. Start monitor tool and register the
above application to user-created
Section 9.11).
screen setting (
Display user-created screen.
11-17
11-17
11 MONITORING WITH USER-CREATED SCREEN
MELSOFT
(2) Setting method with Visual Basic .NET
R
1. Click [Tools] [Add/Remove Toolbox
*1
Items...] on the menu.
*1: The menu name differs depending on Visual
R
Basic version being used. The menu
names for versions are as follows.
Version
Menu name
R
Visual Basic .NET
Customize Toolbox
2002
R
Visual Basic .NET
Add/Remove Toolbox Items...
2003
Visual Studio 2005/
2008/2010
Choose Toolbox Items...
R
Visual Basic
2. Click the <<COM Components>> tab and
select "FBDQFP Control" and "FBDQTDA
Control".
3. Click the "OK" button.
(To the next page)
11-18
11-18
11 MONITORING WITH USER-CREATED SCREEN
MELSOFT
(From the previous page)
4. "MITSUBISHI Tag Access Control"
and "MITSUBISHI Faceplate
Control" are added to the tool box.
5. Deploy "MITSUBISHI Tag Access
Control" and "MITSUBISHI
Faceplate Control" as the usual
command buttons on the form of the
user-created screen.
6. Display the control property dialog
box and specify tag name
(TagName).
Other programs related to screen
display such as color and character
display are executed in the case of
"MITSUBISHI Tag Access Control".
7. Create the exe format application
that are created by compiling, which
is displayed on user-created screen.
8. Start monitor tool and register the
above application to user-created
Section 9.11).
screen setting (
Display user-created screen.
11-19
11-19
11 MONITORING WITH USER-CREATED SCREEN
MELSOFT
POINT
Please refer to contents in CD-ROM\SampleVB for sample data.
If a project created with a Visual Basic 6.0 is used in a Visual Basic .NET,
the project must be upgraded for a Visual Basic .NET according to the "Visual
Basic Upgrade Wizard" that is opened and displayed in a Visual Basic .NET.
Note that as for "tag data access control" offered by a monitor tool, the
following corrections may be required after upgrading.
R
R
R
R
Property
Case that the corrections are necessary
Correction method
Item
When acquiring or setting the Item property
value, the following notation appears and the
conversion is unsuccessful in upgrading,
therefore a compile error occurs.
TagAccess1!PV
TagAccess1 ("PV")
Refer to Appendix
5.1.1 [1] (2) and
correct the sentence
structure for a Visual
R
Basic .NET.
BackColor
BackColor property value of tag data access
control remains default (&H8000000F) and
turns black (&H00000000) after upgrading.
Correct the
BackColor property
to the default.
Note that if the Visual Basic project or SCADA application is edited and
saved after uninstalling PX Developer, the original setting contents (Tag name
etc.) of Active X (faceplate control, tag data access control) will be deleted
when PX Developer is reinstalled
For details of ActiveX control, refer to Appendix 5.1.
Precautions for using Visual Studio 2010 Visual Basic
For a project where .NET Framework Version 4 of Visual Basic project is
used, building a project causes 2 alarm errors of BC40059 when a tag access
control is set on a form of Visual Basic .
This alarm is not occurred by such as application operation.
R
R
R
R
Method for avoiding occurrence of BC40059 alarm:
1) Select "Show All Files" from Solution Explorer.
2) Select "FBDQTDALib", "stdole" from the items of "References" on the
displayed tree, and select "Properties" from the menu displayed by rightclicking.
3) Change "Embed Interop Types" from "True" to "False" on the displayed
Properties, and build.
11-20
11-20
11 MONITORING WITH USER-CREATED SCREEN
MELSOFT
POINT
Using Visual Studio 2005 Visual Basic or later in 64-bit OS
Setting solution platform of Visual Basic project to "x86" is required.
R
R
Method for setting solution platform of Visual Basic project to "x86":
1
1) Select [Configuration Manager] * on the [Build] menu.
2) Select [<New…>] from the list box of [Platform] on the displayed
"Configuration Manager" dialog box.
3) Select "x86" from the list box of [New Platform] on the displayed "New
Project Platform" dialog box, and click the "OK" button.
4) Click the "Close" button on the "Configuration Manager" dialog box.
R
*1: When the [Configuration Manager] menu is not displayed, display the menu by the
following operation.
1) Select [Options] on the [Tools] menu.
2) Select [General] under [Projects and Solutions] on a tree of displayed dialog box,
check [Show advanced build configurations], and click the "OK" button.
The sample program of Visual Basic is stored on the product (\SampleVB
folder). Following are the sample programs corresponding to versions.
R
Version
R
Visual Basic 6.0
Sample program
VB6.0
R
Visual Basic .NET 2002
VB.NET
R
Visual Basic .NET 2003
11-21
Visual Studio 2005 Visual Basic
R
Visual Studio 2008 Visual Basic
R
Visual Studio 2010 Visual Basic
R
VB2005
11-21
12 TROUBLE OCCURRENCE
MELSOFT
12 TROUBLE OCCURRENCE
12.1 Troubleshooting
This section explains the possible troubles caused by monitor tool execution, the
troubleshooting methods and reference section.
12
Trouble
Troubleshooting method
GX Developer Version 7.20W or later has not been installed when using
PX Developer Version 1.04E or earlier.
The monitor tool cannot be
Install the GX Developer and start the monitor tool again.
started
Insufficient memory.
Terminate other applications, and start the monitor tool again.
Reference
Section 5.1
-
The operation for exiting the monitor tool cannot be executed by a user
without the authority.
Chapter 4
The monitor tool cannot be Ask a user who has the authority of operation for exiting the monitor tool to
change the mode, and exit the monitor tool.
exited
Insufficient memory.
Terminate other applications, and start the monitor tool again.
The password is forgotten
Buttons do not appear on
the monitor toolbar
The corresponding screen
does not appear when a
button is clicked on the
monitor toolbar
The values are updated
slowly in the monitor tool
display
The faceplate does not
appear in the control panel
-
Ask the authorized personnel to register the password in the user setting
screen again.
Section 9.3
If the user name and password for the registered engineer-authority user
have been forgotten and the operation cannot be performed, set the
"product ID" in the "User Name" and "Password".
The mode can be changed using the first engineer-authority user
registered in the user setting.
(The product ID is given in the "License certificate" or "Software
registration card" packed with the product. Replace delimiters in the
product ID with "-".)
Section 4.7
Section 9.3
The incorrect mode has been selected.
Change the mode into the correct one.
Section 6.3.1
The number of displayed monitor screens has exceeded the maximum.
Close unnecessary screens and click the button again.
Section 6.4.2
A setting screen is being displayed.
Close the screen and click the button again.
Section 6.3.1
Section 9.1.1
Insufficient memory.
Terminate other applications, and start the monitor tool again.
-
The FBD program may be too many or too large.
Set "Communicates with peripherals after program execution" in Program
Execution Setting of the Programming tool.
Appendix 1.10
Programming
1
tool*
The displayed target has not been set. Set the target.
Section 9.18.2
The PLC connection target settings are wrong.
Use the monitor tool to set the correct PLC connection target.
Section 9.4
The communication with the monitor target cannot be done.
Check the communication status on the alarm list screen and PLC
communication status screen.
Section 7.3
Section 8.5
The monitor target project and the CPU module that monitors it are
different in the PLC type.
Check the PLC type and PLC connection target on the monitor target
project setting screen.
Section 9.4
*1: Indicates the PX Developer Operating Manual (Programming Tool).
12-1
12-1
12 TROUBLE OCCURRENCE
Trouble
MELSOFT
Troubleshooting method
Reference
In the case of PLC direct connection (RS-232, USB), CC-Link, Simulator,
GOT transparent, the event notification and alarm notification will not be Appendix 1.2.1
performed, as the event notification function is not available.
The occurred event and
alarm are not displayed
Or
The occurred event and
alarm are not immediately
displayed
The character string of the event or alarm has not been defined.
Set the character string of the event or alarm.
Section 9.18.4 to
Section 9.18.5
The PLC connection target settings are wrong.
Use the monitor tool to set the correct PLC connection target.
Section 9.4
The communication with the monitor target cannot be done.
Check the communication status on the alarm list screen and PLC
communication status screen.
Section 7.3
Section 8.5
12
The event notification target (event notification target within a CPU
module) settings made by the programming tool are wrong.
Use the programming tool to set the correct event notification target.
Also, carry out the following check and setting operations relevant to
event notification.
(Ethernet connection)
• Use GX application to check the "open setting" of network parameter
and set the IP address and port number of the communication target
for broadcasting.
• Use GX application to check the port number of communication target Appendix 1.2.2
set in "open setting" of network parameter. Then, set the same value Programming
1
as the port number of communication target to the "Event Notification tool*
UDP Port No.(HEX)" in the option setting of monitor tool.
(CC-Link IE Controller Network, MELSECNET/10(H) connection)
Set the same value to the network No. and station No./group No. for
the following :
The personal computer of event notification target set in the event
notification settings within the project parameter settings of the
programming tool, and the CC-Link IE Controller Network board and
MELSECNET/10(H) board of the personal computer that is executing
the monitor tool.
R
Due to the security enhancement function (Windows firewall) loaded to
R
R
Microsoft Windows XP Service Pack2, event notification from the PLC
Appendix 1.2.2
CPU in Ethernet connection is blocked.
R
Add the Monitor tool to the Exceptions setting of Windows Firewall.
The error message box of
"Failed in creating new
window" is displayed
Insufficient memory.
Terminate other applications, and start the monitor tool again.
The error message box on
the user-created screen is
displayed
Refer to the error list.
Appendix 5.1.1[4]
Appendix 5.1.2[2]
The current value of tag
data item cannot be
changed from tag monitor
The operation for changing the tag data items cannot be executed by a
user without the authority.
Ask a user who has the authority of operation for changing the tag data
items to change the mode, and change the current value.
Chapter 4
The error message dialog
box of "Communication
status is abnormal" during
tag data write, etc. is
displayed
Confirm that the communication cable has been correctly connected.
Check the PLC connection target set in the monitor target project setting. Section 2.1.3
Double-click the corresponding alarm item in the alarm list to display the Section 7.3
"System Alarm Details" dialog box.
Section 9.4
Take the corrective action according the displayed error.
-
*1: Indicates the PX Developer Operating Manual (Programming Tool).
12-2
12-2
12 TROUBLE OCCURRENCE
Trouble
MELSOFT
Troubleshooting method
Reference
The error message dialog
box of "The Project ID
Code of the Monitor Target
Project is different from that
in the PLC due to the
following causes:" is
displayed
The monitor target project set with the monitor tool and that within CPU
module are different.
Reload the monitor target project.
Also when the download to PLC is performed with the programming tool,
reload the monitor target project.
Section 9.4
Programming
1
tool*
Reinstalling the tool
initializes the user settings
Installing the monitor tool (Version 1.00A) initializes (i.e., makes it admin
settings only) the user settings (user name, password, authorization).
Make the settings in the user setting screen again.
Section 4.7
Section 9.3
Assignment information
database file of Version
1.01B or earlier cannot be
set as the monitor target
project.
This happens because the assignment information database file is the old
version.
Convert the assignment information database file by switching to the
monitor mode in the Programming tool of Version 1.02C or later.
Section 9.4
Appendix 8.2
Programming
1
tool*
*1: Indicates the PX Developer Operating Manual (Programming Tool).
12-3
12-3
12 TROUBLE OCCURRENCE
MELSOFT
The following flowcharts show the recovery procedures in case of server failure.
Non-redundant server system
Redundant server system
The server fails.
The server fails.
Use a client
personal computer as a server
personal computer?
NO
Set up a new server.
Start the monitor tool on the
new server.
YES
On one client personal computer,
change its monitor tool execution
type to Server and quit the
monitor tool.
(
Section 9.5)
Set up a new server.
*1
Which server fails?
Copy the monitoring
environment to the server.
*2
Mount a network card and install
its driver on the personal
computer which has been
changed to Server.
Configure the same network
settings as the failed server.
Start the monitor tool on the
new server.
Copy the assignment
information database file of
the monitor target project to
the personal computer which
has been changed to Server.
On the server, change its
monitor tool execution type
to Server and quit the monitor
Section 9.5)
tool. (
Start the monitor tool on the
personal computer which has
been changed to Server.
Start the monitor tool on the
server personal computer.
Set the path to the copied
assignment information
database file in the monitor
target project setting and set
the transfer setup.
Confirm and change the
settings on the server. *3
Connect all clients to the
new server.
*1
Secondary server
Primary server
On the primary server, change
its monitor tool execution type
to Primary Server and quit the
monitor tool.
At this time, check
"Acquiring setting data from
Secondary Server next start
Section 9.5)
time". (
Start the monitor tool on the
primary server.
The setting data are copied
from the secondary server at
the startup of the primary
server.*4
On the secondary server,
change its monitor tool execution
type to Secondary Server and
quit the monitor tool.
(
Section 9.5)
Start the monitor tool on the
secondary server.
The setting data are copied
from the primary server at the
startup of the secondary
server.*5
Confirm and change the
settings on the secondary
server.*3
Confirm and change the
settings on the primary server.*3
Switch the connection to the
primary server on all clients.
Completed
Completed
*1: Mount a network card and install its driver on the personal computer. Configure the same network settings as the failed
server.
Install PX Developer, and as necessary, install user-created applications and sound files for alarm/event.
*2: Copy the backup copy of the setting data.
Files need to be backed up in advance are all files in the Prjdata folder and 'M_SET.mdb' and 'M_USER.mdb' in the
Setdata folder in the installation destination folder.
As necessary, make a backup copy of the assignment information database file of the monitor target project and copy it.
For the method for copying the setting data, refer to Section 9.1.4.
*3: Confirm that the path of each folder/file is appropriate for the environment of the new server.
*4: Confirm that the secondary server is running.
*5: Confirm that the primary server is running.
12-4
12-4
12 TROUBLE OCCURRENCE
MELSOFT
12.2 Convenience Function
This section illustrates the functions that can be used in accordance with the "Such
things desired to do" requirements of the monitor tool. It also indicates the reference
chapters and sections about these functions.
Things desired to do
Methods
Reference
Use the "Print Screen" function to print a displayed screen
Section 8.2
Use the "Print" function to print the result.
Section 7.3.6
Section 7.4.5
Use the "Export to CSV File" function and use the EXCEL
(Software to edit an output file.)
Section 7.2.6
Section 7.3.7
Section 7.4.6
Section 7.7.7
Use the "Export to CSV File" function and use the EXCEL
Software to edit an output file.
Section 9.1.3
Use the "Edit" function (Cut/Paste) to directly paste the contents
of a grid into the Editor Software or the EXCEL Software.
Section 9.1.1
Save the set contents to the folder: Melsec\Fbdq\set data
Section 2.3
Section 9.1.3
Change the sizes of the screens freely.
Section 6.2.2
Section 6.2.5
Always keep the window in maximum size if it is a SingleWindow mode monitoring screen
Section 9.18.14
Change the display scale of a Trend Graph.
Section 7.2.5
Section 7.7.5
Set the display color of the faceplate freely.
Set the display colors of the title bar of the dialog box and the
screen according to the color settings of the personal computer.
Section 9.18.9
Display the latest alarm/event content specified in the monitor
toolbar.
Section 6.3.1
Make the beep sound when an alarm/event occurs.
Section 9.18.10
Section 8.1
To display tag data in a special
monitor screen
Use "ActiveX control" to produce user-created screens by
yourself
Chapter 11
Section 7.5
To use the entire computer screen
without displaying the monitor
toolbar
Hide the monitor toolbar to start.
Additionally, control application programs can be used for
external control to change the monitor toolbar between Display
and Hide.
Appendix 3.1
Appendix 3.2
To start the monitor tool by the
mode that matches the authority of
the specified user
The mode that matches the authority of the specified user can
start the monitor tool.
Appendix 3.3
Not to operate the "Exit" button but
use the software control executed
externally to close the monitor tool
Exit the monitor tool via the external control application
programs.
Appendix 5.1
To output the trend, alarm and
event data to CSV files
automatically
With the automatic CSV file export function, the trend, alarm
and event data can be saved in CSV files automatically as
histories.
Section 8.7
To make a file according to the
monitoring result.
To make a file according to the
setting contents
To make a backup of the setting
contents
To zoom out a screen display
To change the display colors
To find occurrence of
warnings/events immediately
12-5
12-5
12 TROUBLE OCCURRENCE
MELSOFT
MEMO
12-6
12-6
APPENDIX
MELSOFT
B
APPENDIX
Appendix 1 Communication of the Monitor Tool
For the monitor tool, multiple communication methods can be combined for monitoring
so as to maintain the communication performance when the amount of the monitored
targets increase. Here each communication method is targets respectively.
Appendix 1.1 Communication types
Communications between the monitor tool and CPU module can be generally
classified as follows.
APP
Communication type
Description
Purpose
Event notification*1
(alarm notification, event
notification)
The CPU module initiatively notifies the
monitor tool after it detects changes of the
alarm/event signal within each tag data.
Monitor the occurrence of alarms and events.
High-speed
current value
collection *1
Poll current value with given priorities and
execute collection within each about 1second interval.
Refresh current value at a high frequency in control panel
displaying, collection of tuning trend or trend graph
displaying (only when the sampling period is set to 1
second).
Collect current value of the tag data within
each about 10-second interval
Collect data if the current value has been entered in trend
setting (except 1-second sampling period).
Current
value
collection Low-speed
current value
collection *1
Poll the displayed tag data with given priority
High-speed tag
and execute collection with each about 1data collection *1
second interval.
Low-speed tag
Read all tag data in turn registered in the
Tag data
data collection *1 monitor tool.
collection
Batch read all tag data registered in the
Read all tags
monitor tool.
Read one-shot
tag
Tag data write
High-speed
process data
collection
Process
data
Low-speed
collection
process data
collection
Return check
PLC status check
Collect tag data displayed in the pop-up window at high
frequency.
Periodically acquire tag data expect the current value.
Full tag read during start-up or alteration of monitored target
items so as to correctly display the faceplate.
Read all specified tag data at once.
Read one-shot tag when writing tag data so as to read reply
data.
Write the value of a tag data item
Execute write operation when altering the value of a tag
data in the faceplate etc.
Collect monitor variables registered in
monitor tool with the interval of 1 second or
less.
Collect data if the monitor variable has been entered in
trend setting (1-second sampling period).
Collect monitor variables registered in
Collect data if the monitor variable has been entered in
monitor tool with the interval of 10 seconds or
trend setting (except 1-second sampling period).
less.
Check if the communication with CPU
module is in normal operation
Execute this check when a communication open error
occurs.
Check for CPU module error occurrence.
Whether a CPU module error has occurred or not can be
checked on the monitor tool.
Check whether the monitor target project set
with the monitor tool matches the project in
the CPU module.
If there is a mismatch between the monitor target project
and the project in the CPU module, write of illegal tag data
is prevented.
Monitors the Redundant CPU operation
Record the history of the operation mode change and
mode and system status when monitoring the
control system switching in the Redundant CPU.
Redundant CPU.
Read the PLC CPU type name from the PLC
CPU of the system specified in "Transfer
Setup" to compare with the PLC type of the
assignment information database file.
Issue the system alarm when the PLC type is incorrect.
*1: The current value and maximum value of collection period can be confirmed by PLC the communication
Section 8.5).
status screen (
B-1
B-1
APPENDIX
MELSOFT
POINT
In order to communicate via the network, the network parameters of the GX
application should be set. For details of the method of network parameter
setting, refer to the following manuals:
GX Works2 Version 1 Operating Manual (Common)
GX Developer Version 8 Operating Manual
Event notification adopts the communication among channels function over
the CC-Link IE Controller Network and MELSECNET/10(H), and the
broadcasting communication function over the Ethernet. In order to execute
event notification, the path for change notification should be set in the event
notification of the project parameter setting of the programming tool.
For details of the method of project parameter setting, refer to "PX Developer
Operating Manual (Programming Tool)".
B-2
B-2
APP
APPENDIX
MELSOFT
According to the display status of the screen, the communication methods adopted in
the monitor tool can be categorized as following.
Condition
During start-up
Communication type
Read the all tag
Change of monitored target project
Read the all tag
Normally
Low-speed tag data collection, PLC status check *1
Control panel in display
Low-speed tag data collection, high-speed current value collection
Pop-up window in display
High-speed tag data collection
Tuning trend
in execution
With screen display
High-speed tag data collection, high-speed current value collection
Without screen display
Low-speed tag data collection, high-speed current value collection
Being using tag to access control
collection values
Low-speed tag data collection, high-speed current value collection
Being collecting trend data in the trend
graph
Low-speed tag data collection, low-speed current value collection,
high-speed current value collection
Occurrence of alarm or events
Event notification
Setting lockout tag
Event notification
Change of tag data
Tag data write, one-shot tag read
Occurrence of communication open error
Return check
*1: The PLC status check is executed at intervals set to "PLC status check interval(s)"
Section 9.17)
in the option setting (general). (
At the time of start-up of the monitor tool or the alteration of the monitored target
project, updating of tag data is fundamentally executed with low-speed tag data
collection after batch reading all registered tag data.
Collection of current value or high-speed tag data collection will be executed in the
case of faceplate display etc which requires as real time updating of latest values as
possible.
The diagram shown below presents the time sequence of each communication
method.
During startup (read the all tag)
During the change of the monitored object item (read the all tag)
Normally (low-speed tag data collection)
Control panel in display (high-speed current value collection)
Lockout tag (event notification)
The change of tag data (tag data write, one-shot tag read)
A
pop-up window in display (high-speed tag data collection)
Lockout tag (event notification)
The change of tag data (tag data write, one-shot tag read)
Tuning trend in execution (high-speed current value collection)
Tag access control collection values in use(high-speed current value collection)
The collecting trends are being execated in the trend graph (low-speed current value collection,
high-speed current value collection)
The occurrence of alarm or events (event notification)
The occurrence of communication open errors (returm check)
End
At the time of displaying control panel on changing tag data (A), tag data write is in execution at
the high-speed current value collection, besides the normal low-speed tag data collection.
B-3
B-3
APPENDIX
MELSOFT
Appendix 1.2 Event notification
Monitor alarms and events with reduced network traffic.
The CPU module only emits a notice when an alarm or event occurs.
The CC-Link IE Controller Network and MELSECNET/10(H) apply the
communication among channels function, but the Ethernet applies the broadcasting
communication function.
Communication direction
Communication object
CPU module
monitor tool
Altered tag data (96 words per tag)
The items for detecting change of tag data are shown in the table as below.
Tag type
Tag data item
Memo
Mode
Control each selection item of the mode to be valid/invalid
MODE
PID, 2PID, NREV, REV,
MVAL1, MVAL2, PGS2,
HTCL
2PIDH, SWM, PFC_SF,
PFC_SS, PFC_INT,
PVAL
PIDP, SPI, IPD, BPI, R,
ONF2, ONF3, MWM,
SEL, MOUT, PGS
MONI
BC, PSUM, TIMER1,
TIMER2, COUNT1,
COUNT2
PB
ALM
ALM_64PT
MSG
MSG_64PT
B-4
ALM
Alarm
Occurrence/recovery status of each alarm
CTNO
Lookout tag No.
0: no lockout tags, 1 to 32: display lockout tag No.
DIM
Monitor input buffer
Occurrence/recovery status of each error,
in-execution/non-execution status of a operation
MODE
Mode
Control each selection item of the mode to be valid/invalid
ALM
Alarm
Occurrence/recovery status of each alarm
ALM2
Alarm 2
Occurrence/recovery status of each alarm
CTNO
Lookout tag No.
0: no lockout tags, 1 to 32: display lockout tag No.
DIM
Monitor input buffer
Occurrence/recovery status of each error,
in-execution/non-execution status of a operation
MODE
Mode
Control each selection item of the mode to be valid/invalid
ALM
Alarm
Occurrence/recovery status of each alarm
CTNO
Lookout tag No.
0: no lockout tags, 1 to 32: display lockout tag No.
ALM
Alarm
Occurrence/recovery status of each alarm
CTNO
Lookout tag No.
0: no lockout tags, 1 to 32: displayed lockout tag No.
ALM
Alarm
Occurrence/recovery status of each alarm
CTNO
Lookout tag No.
0: no lockout tags, 1 to 32: displayed lockout tag No.
DIM
Monitor input buffer
Occurrence/recovery status of each error,
in-execution/non-execution status of a operation
MODE
Mode
Control each selection item of the mode to be valid/invalid
CTNO
Lookout tag No.
0: no lockout tags, 1 to 32: displayed lockout tag No.
DIM
Monitor input buffer
Occurrence/recovery status of each error,
in-execution/non-execution status of a operation
ALM
Alarm
Occurrence/recovery status of alarm 1 to 8
ALM_W1
Alarm 1 to 16
Occurrence/recovery status of alarm 1 to 16
ALM_W2
Alarm 17 to 32
Occurrence/recovery status of alarm 17 to 32
ALM_W3
Alarm 33 to 48
Occurrence/recovery status of alarm 33 to 48
ALM_W4
Alarm 49 to 64
Occurrence/recovery status of alarm 49 to 64
MSG
Message
Occurrence/recovery status of event 1 to 8
MSG_W1
Message 1 to 16
Occurrence/recovery status of event 1 to16
MSG_W2
Message 17 to 32
Occurrence/recovery status of event 17 to 32
MSG_W3
Message 33 to 48
Occurrence/recovery status of event 33 to 48
MSG_W4
Message 49 to 64
Occurrence/recovery status of event 49 to 64
B-4
APPENDIX
MELSOFT
Appendix 1.2.1 System configuration that can receive event notification
(1) In case that transfer setup of a monitor tool is set to "CC IE Cont",
"MNET/10" or "MNET/H"
(a) Two-tier system
Station No. 1
Personal computer
CC-Link IE Controller Network or
MELSECNET/10(H)
(network No.1)
Station No. 2
Process CPU or Redundant CPU
(b) Multi-layer system
Event notification from the PLC can be received via up to eight of relaying
network systems, each of which is configured by the CC-Link IE Controller
Network, MELSECNET/10 (H) or Ethernet.
Station No. 1
Personal computer
CC-Link IE Controller Network or
MELSECNET/10(H)
(network No.1)
Station No. 2
Station No. 1
Relaying network is CC-Link IE Controller Network, MELSECNET/10(H) or Ethernet
(network No.2 to 7)
Station No. 2
Station No. 1
CC-Link IE Controller Network or
MELSECNET/10(H)
(network No.8)
In CC-Link IE Controller Network and
MELSECNET/10(H) connection, event notification
is receivable up to the eighth network system.
B-5
Station No. 2
Process CPU or Redundant CPU
B-5
APPENDIX
MELSOFT
(2) In case that transfer setup of a monitor tool is set to "Ethernet"
In Ethernet connection, event notification is receivable from a PLC CPU in the
same segment.
Station No.1
Personal computer
Ethernet
Station No.2
In Ethernet connection, event notification is
receivable in the same segment.
Process CPU or Redundant CPU
(3) In case that performing a monitor tool in a PC CPU
When the transfer setup of a monitor tool is set to "Ethernet", event notification is
receivable from a PLC CPU in the same segment.
Main base
QCPU
PC CPU
module
Ethernet
Station No.1
Ethernet
Station No.2
In Ethernet connection, event notification is
receivable in the same segment.
Process CPU or Redundant CPU
POINT
The event notification does not work when using serial interface (RS-232),
USB, CC-Link, Simulator, GOT transparent, to directly connect with the CPU
module.
To use the event notification function with the CC-Link IE Controller Network
connection, the driver (SW1DNC-MNETG-B) version 1.08J or later which
supports the event notification function is required.
The event notification does not work when the monitor tool is connected to the
Redundant CPU via the Ethernet module mounted to a redundant type
extension base unit.
The event notification does not work normally when using the project
parameter setting of the programming tool to specify the setting of No Event
Notification.
Even the event notification does not work normally; the occurrence of alarms
Appendix
and events is also notified via low-speed tag data collection (
1.4). During the low-speed tag data collection, the time consumed from the
occurrence of alarms or events till the notice to the monitor tool is directly
proportional to the numbers of registered tags.
Make sure to use PX Developer Version 1.06G or later monitor tool to monitor
the CPU module that includes the projects compiled using the PX Developer
Version 1.06G or later programming tool.
The PX Developer Version 1.04E or earlier monitor tool cannot receive the
event notification sent by the project compiled using the PX Developer Version
1.06G or later programming tool.
The Redundant CPU system receives the event notification when the
control/standby system status or operation mode is changed.
When the incorrect PLC Type system alarm has occurred, the received event
notification data is abandoned.
B-6
B-6
APPENDIX
MELSOFT
POINT
When connecting monitor tool to Redundant CPU using Ethernet connection
with Windows Vista or later, in case Ethernet modules of both system A and
system B are on the same segment, the normal operation will be guaranteed
because event notification can be received.
R
< Ethernet module of system A and
system B are not on the same segment>
Switching
hub
System A
B-7
Switching
hub
System B
< Ethernet module of system A and
system B are on the same segment>
Switching
hub
System A
System B
B-7
APPENDIX
MELSOFT
Appendix 1.2.2 Settings for executing event notification
(1) On the occasion of CC-Link IE Controller Network,
MELSECNET/10(H) connection
To execute notification by using the communication function among channels.
Set a channel number for sender side of CPU module on the programming tool.
POINT
Do not use the following channel number when using MELSEC data link library with
user-created application.
• Channel used by the host station No. : 1
(fixed channel number for the monitor tool)
• Target station used by the host station No. : channel number set with the
programming tool
For details of channel number, refer to "MELSEC Data Link Library Reference
Manual".
(2) On the occasion of Ethernet connection
The Ethernet uses the Broadcasting function to execute notification when it is
connected.
The following settings are required in the network parameter setting of the GX
application.
[Motion Setting]
[Communication Data Code Setting]: Binary code communication
[Initial timing]: Always waiting for OPEN (Communication possible at
STOP time)
[IP Address Setting]: (Assigned IP addresses)
[Transmission Frame Setting]: Ethernet (V2.0)
[Open Setting]
[Protocol]: UDP
[Fixed Buffer]: Send
[Fixed Buffer Communication]: No procedure
[Pairing Open]: No pairs
[Existence confirmation]: No pairs
[Local station port No.]: (The No. not used by other connection.)
[Destination IP Address]: Broadcasting ([IP Address] 255.255.255.255)
[Dest. Port No.]: (the same as [Event Notification UDP Port No.(HEX)]
*1
open setting of the monitor tool )
[Router Relay Parameter]
[Router relay function]
[Sub-net mask pattern]
: Use
: (Consult the network administrator before
*2
setting )
[Default router IP address]: (Consult the network administrator before
*3
setting )
*1: Set a port number not to overlap on well-known port numbers and port numbers used
by software other than the monitor tool.
*2: Set the same setting configuration with the receiver side personal computer.
*3: If there is no router, set the IP address that is not used in the system for the address of
router.
B-8
B-8
APPENDIX
MELSOFT
The open settings of the network parameter of the GX application have to be
specified when using TCP to connect a single CPU module with multiple
MELSOFT products (monitor tool, programming tool and GX application). (Not
particularly necessary when using UDP to connect)
When the number of connected personal computers increases, the following
settings in the network parameter should be added.
[Open Setting]
[Protocol]: TCP
[Open System]: MELSOFT connection
For details of the method of network parameter setting, refer to the following
manuals:
GX Works2 Version 1 Operating Manual (Common)
GX Developer Version 8 Operating Manual
*1
*1
Set the settings in the
connection number which
is set in the <<Event
Notification>> tab of the
project parameter setting
in the programming tool.
<Network parameter settings of GX Works2 (open setting)>
*1: In monitor tool, the input format of "Event Notification UDP Port No.(HEX)" in Option
Setting (Alarm/Event) is “HEX”. The input format of GX application port number can be
selected from “DEC” and “HEX”, but setting the same hexadecimal value as set to
monitor tool is required.
B-9
B-9
APPENDIX
MELSOFT
POINT
When the setting for blocking the access to the monitor tool via a network is made with
R
the security enhancement function (Windows firewall) loaded to
R
R
Microsoft Windows XP or later the monitor tool cannot receive event notification from
the PLC CPU in Ethernet connection.
In this case, allow communication with monitor tool via with either of the following
methods.
1) Allow communication with monitor tool on the "Windows Security Alert" screen
displayed when connecting to Ethernet for the first time.
R
R
<Windows XP Service Pack2, Windows Vista >
Allow communication with the
"Unblock" button
R
<Windows 7 or later>
Check the network and allow
communication with the "Allow
access" button.
B-10
B-10
APPENDIX
MELSOFT
POINT
2) Allow exceptional program communication with monitor tool on the Windows Firewall
*1
window .
R
R
<Windows XP Service Pack2, Windows Vista >
*2
Add monitor tool (C\:Melsec\fbdq\FBDQMon.exe ) to the exceptional program. Note
even when the monitor tool is already added as the exceptional program, selecting the
checkbox is required to enable the reception.
(Before adding an exceptional program)
Add an exceptional program with
the "Add Program…" button.
(After adding an exceptional program)
The exceptional program
has been added.
*1:
*2:
B-11
R
R
For Windows
XP, the Windows Firewall setting screen is displayed by selecting [Start]
[Control Panel]
[Security Center]
[Windows Firewall].
R
For Windows Vista , it is displayed by selecting [Start]
[Control Panel]
[Security]
[Allow a program through Windows Firewall]
To change Windows Firewall setting, logon as a user in administrators group, having authority
for controlling all operations of personal computer.
When an installation destination path is changed during PX Developer installation,
FBDQMon.exe will be in the path after change.
B-11
APPENDIX
MELSOFT
POINT
R
<Windows 7 or later>
2
Add monitor tool (C\:Melsec\fbdq\FBDQMon.exe* ) to a program or feature where the
1
Windows Firewall setting* is allowed.
Note even when the monitor tool is already added to a program or feature, check the
checkbox to validate and check the network.
(Before adding allowed programs and features)
Add allowed programs and features with
the "Allow another program..." button
which is validated with the "Change
settings" button.
(After adding allowed programs and features)
"Monitor tool" is added.
*1:
The Windows
R
Firewall setting screen is displayed by selecting [Start]
[Control Panel]
[Allow a program through Windows Firewall]
[Security]
(When using Windows R 8, right-click the left bottom corner of the screen, and select [Control
Panel].)
*2:
B-12
To change Windows Firewall setting, logon as a user in administrators group, having authority
for controlling all operations of personal computer.
When an installation destination path is changed during PX Developer installation,
FBDQMon.exe will be in the path after change.
B-12
APPENDIX
MELSOFT
Appendix 1.3 Collecting current value data
For such data as PV, SV and MV among the tag data items that need to be updated
at high frequency, they are generally collected as current value data in the buffer
area at the PLC side.
The current value data collection reads the current value data from the buffer area. It
can be categorized into two types as high-speed current value collection and lowspeed current value collection according to the length of read interval.
Communication direction
CPU module
Communication target
Current value data
Monitor tool
The tag data items of collected current values are listed in the table shown below.
Tag type
PV
PID, 2PID, PIDP, SPI, IPD, BPI, R,
MV
ONF2, ONF3
SV
PV
2PIDH, SWM, PFC_SF, PFC_SS, MV
PFC_INT
SVC
SV
SV
PGS
TYP
PV
SV
STC
T
PGS2
PV
TYP
SV0C
MOUT
MV
MONI
PV
PV
MWM
MV
PV
SEL
MV
SLNO
SV1
SV2
BC
SV
PV
PSUM
PV
NREV, REV, MVAL1, MVAL2, PB DIM
PSV
SV
TIMER1, TIMER2, COUNT1,
COUNT2
PV
DIM
PV
VOUT
PVAL
SVC
SV
DIM
MV_HT
HTCL
MV_CL
SV
B-13
Tag data item
Process variable
Manipulated variable
Setting value
Process variable
Manipulated variable
Setting value (Current)
Setting value (Target)
Setting value
Motion type
Process variable
Setting value
Executing step No.
Time in the step
Process variable
Operation type
Start point (Current)
Manipulated variable
Process variable
Process variable
Manipulated variable
Process variable
Manipulated variable
Selection No.
Setting value1
Setting value2
Setting value
Process variable
Process variable
Monitor input buffer
Setting value (Preset)
Setting value
Process variable
Monitor input buffer
Process variable
Command signal output status
Setting value (Current)
Setting value (Target)
Monitor input buffer
Manipulated variable of heating
Manipulated variable of cooling
Setting value
Remark
Motion type when control mode is AUT
Selected signal (0/1)
The 1st preset value when SV is reached
The 2nd preset value when SV is reached
The preset value when SV is reached
B-13
APPENDIX
MELSOFT
POINT
The current values and maximum values collected by this communication (highspeed current value collection, low-speed current value collection) can be confirmed
Section 8.5).
on the PLC communication status screen (
When the collection period is long, refer to Appendix 1.10 and take corrective
action.
(1) High-speed current value collection
It is the current value collection for use of control panel displaying, trend
collecting of trend graph (only when the sampling period is 1 second) and tuning
trend collection.
Read for the purpose of high frequency refreshing the current value monitoring
display on the control panel.
Read the current value data of tag at about 1-second intervals.
POINT
Based on the number of tag data items that is being monitored and CPU module
scanning execution conditions, the collection period may be longer than 1 second.
(2) Low-speed current value collection
Read the variance if the current value data has been entered to trend pen.
(However, read if the sampling period is set to 1 second, read via high-speed
current value collection.)
Read the current value data at about 10-second intervals.
B-14
B-14
APPENDIX
MELSOFT
Appendix 1.4 Collecting tag data
The tag data collection reads tag data. It can be categorized into 4 types according
to different read interval and targets.
(1) High-speed tag data collection
Read the tag data displayed in the pop-up window at about 1-second intervals.
Communication direction
CPU module
Monitor tool
Communication target
Tag data (96 words per tag) in display
(2) Low-speed tag data collection
Read 1 tag data every 5 seconds from all the tags registered in the monitor tool.
If the amount of tags reaches the maximum, it will take 7680 (16X480) seconds
to accomplish reading all the tags in one loop.
Communication direction
Communication target
CPU module
Monitor tool
All the tag data (one time every 5 seconds,
maximum 5 tags)
(3) Full tag read
Read all the tag data of the registered tags in the monitor tool during start-up or
change of object items.
Communication direction
CPU module
Communication target
All the tag data
Monitor tool
(4) One-shot tag read
After Tag data are written, read the object tag data so as to confirm the written
result.
Communication direction
CPU module
Monitor tool
Communication target
Write-in tag data (96 words per tag)
POINT
The current values and maximum values collected by this communication (highspeed tag data collection, low-speed tag data collection) can be confirmed on the
Section 8.5).
PLC communication status screen (
When the collection period is long, refer to Appendix 1.10 and take corrective
action.
B-15
B-15
APPENDIX
MELSOFT
Appendix 1.5 Writing tag data
The write tag data writes tag data. It can be categorized into 2 types according to
different tag data write-in targets.
(1) Word write
Directly write WORD, DWORD, INT, DINT, REAL type tag data items without any
conversion of the setting values.
Communication direction
Monitor tool
CPU module
Communication target
Changed tag data items
(2) Bit write
Write the setting value in bit unit to BOOL type tag data items.
Communication direction
Monitoring tool
Communication target
Changed tag data items
CPU module
(3) Bit write in radio button format
As for the tag data items in the radio button format where the other buttons turn
OFF when one of them is selected for ON, perform bit write that will turn ON the
selected bit item and turn OFF the other bit items.
Communication direction
Monitor tool
Communication target
The changed tag data items
CPU module
POINT
If the communication is abnormal, tag data cannot be written. (The
"Communication status is abnormal" error message dialog box is displayed.)
Check the connection status of the communication cable, the PLC connection
target or other to return the communication condition to normal, and then write
the tag data again.
In the initial setting, tag data can be written if the monitor target project set with
the monitor tool differs from the project in the CPU module (project ID code
inconsistency).
However, if tag data is written when the project ID code inconsistency, the
system may malfunction. Change the "Write tag data (even if the PC's and
PLC's project ID codes are different)" setting of the option setting (general) to
"Disable" when operation has been started after completion of system
adjustment.
If tag data cannot be written when the project ID code inconsistency, reload the
monitor target project or perform PLC download after execution of compile with
the programming tool, and then write the tag data again.
REMARK
If tag data write operation is executed, the event will be displayed in the operation
Section 7.4.1)
history. (
B-16
B-16
APPENDIX
MELSOFT
Appendix 1.6 Collecting process data
Read the process data of CPU module registered in the monitor variable settings.
It can be categorized into two types as high-speed process data collection and lowspeed process data collection according to the length of read interval.
Communication direction
CPU module
Communication target
Process data
Monitor tool
POINT
The current values and maximum values collected by this communication (highspeed process data collection, low-speed process data collection) can be confirmed
Section 8.5).
on the PLC communication status screen (
When the collection period is long, refer to Appendix 1.10 and take corrective
action.
(1) High-speed process data collection
When a monitor variable is registered to trend pen whose sampling period in the
trend setting is 1 second, read the current value of monitor variable with the
interval of approximately 1 second.
POINT
The collection period may be longer than 1 second due to the number of
monitoring process data and scan execution of CPU module.
(2) Low-speed process data collection
When a monitor variable is registered to trend pen whose sampling period in the
trend setting is 10 seconds or more, read the current value of monitor variable
with the interval of approximately 10 seconds.
B-17
B-17
APPENDIX
MELSOFT
Appendix 1.7 Communication error
1
The errors of communication processing (open, read* , write, close) occur in each
connection destination, and are displayed on the alarm screen. The recover of the
communication processing error is completed when the communication processing
1
Appendix 1.8) is
(open, read* , write, close) is succeeded after a return check (
completed successfully.
When the open processing succeeds, recover another communication error.
*1: When read processing from monitor tool to CPU module fails, retry (reopen + read)
the number of times being set on the "Transfer Setup" dialog box.
When the read processing succeeds during the retry, the communication read error
will not occur.
When the read processing fails for the number of retry times, the communication
read error and communication open error will occur.
POINT
Operation differences in read error between different versions
<Version 1.23Z or earlier monitor tool>
When a read error occurred, the system alarm of communication read error
occurs without retry.
If the communication error is not recovered, the system alarm of communication
open error will occur.
<Version 1.28E or later monitor tool>
The number of retry times when a read error occurs can be set.
(When the number of retry times is set to 0)
When a read error occurs, communication read error will occur without retry.
(When the number of retry times is set to 1 or larger)
When succeeded in reading by retry, the system alarm of communication read
error will not occur. If failed in reading by retry, a communication read error and
communication open error will occur.
The relation between the number of retry times and the system alarm which occurs
in communication error is as follows.
Monitor tool version
Number of reading retried
Occurrence of system alarm
Communication reading error occurs
1.02C to 1.23Z
Communication open error occurs
0 time (default)
1. 28E or later
Communication reading error occurs
Communication reading error occurs
*1
1 to 5 times
Communication open error occurs
*1: Alarm will not occur when succeeded by retry.
B-18
B-18
APPENDIX
MELSOFT
Appendix 1.8 Return check
PX Developer checks if the communication has returned to its normal operation
when a communication open error, communication reading error, or communication
writing error occurs because of malfunctions of CPU module etc.
This function is "Return check".
Return check will be executed repeatedly before normal communication is confirmed.
After the return check is normally finished and normal communication is confirmed, a
return processing operation will be executed for system reconnection.
The interval (*1) of the return check and the timeout (*2) of the return check itself can
be arbitrarily varied by unit of seconds. Please use the option setting (general) to set
Section 9.17).
[Return Check Interval (s)] and [Return Check Time-out (s)] (
Please use [Other stations] in the "Transfer Setup" dialog box of the monitored target
project setting to set [Check at communication time] of the timeout of the recovery
processing (*3) operation.
The diagram shown below illustrates the situation when the normal communication
has been confirmed during the 2nd return check.
Communication error occurs
Return check (*2)
Return check interval (*1)
(Interruption)
The communication with
other communication targets
The check is
normally completed
Restart
communication
Return process (*3)
(Interruption)
POINT
When Return check is working for the system including Redundant CPUs,
reconnection is performed for each route at the return check intervals (seconds), if a
communication error has occurred in the following routes.
The route specified in the Transfer Setup.
The route to connect to system A.
The route to connect to system B.
Maximum of 3 times the connection route timeout (seconds) is required to perform
Return check when all of the above connection routes have been disconnected
REMARK
If frequent accesses to the CPU module, which has communication errors, are
executed before the return of normal communication, the communication with
other communication targets will be delayed. In order to avoid this situation, please
adjust [Return Check Interval (s)] and [Return Check Time-out (s)] at high speed.
During [Return Check Interval (s)] ], the connected targets, which have no
communication errors, can communicate normally.
B-19
B-19
APPENDIX
MELSOFT
Appendix 1.9 PLC status check
The monitor tool checks for error occurrence in the CPU module and checks the
projects.
The PLC status check indicates the following checks.
Check for CPU module stop error
Check for CPU module operation continue error
Check of project ID code
CPU model name check
Redundant CPU operation mode check
Redundant CPU control/standby system status check
Redundant CPU system A/B identification flag check
(1) Check details and error display positions in PLC status check
This section explains the check details and error display positions in PLC
status check.
(a) Check for CPU module stop error
[Check details]
Whether a stop error has occurred in the CPU module or not is checked.
If a stop error has occurred in the CPU module, the "PLC CPU stopping
error" alarm occurs on the monitor tool.
[Error display position]
The alarm is displayed on the monitor toolbar and in the alarm list.
(b) Check for CPU module operation continue error
[Check details]
Whether an operation continue error has occurred in the CPU module or
not is checked.
If an operation continue error has occurred in the CPU module, the "PLC
CPU error" alarm occurs on the monitor tool.
[Error display position]
The alarm is displayed on the monitor toolbar and in the alarm list.
B-20
B-20
APPENDIX
MELSOFT
(c) Check of project ID code
[Check details]
Whether the monitor target project set with the monitor tool matches the
project in the CPU module or not is checked.
When the monitor target project does not match the project in the CPU
module, illegal tag data write is prevented.
If the project ID codes do not match, the "project ID code inconsistency"
alarm occurs on the monitor tool.
Monitor target
project
(Assignment
information
database*)
Consistency
check!
Project in
CPU module
*: The assignment information database indicates the "*.mdb" file created
at execution of compile with the programming tool.
This file contains the assignment information of variables that stores tag
data, etc. and the device information of the CPU module.
[Error display position]
The alarm is displayed on the monitor toolbar and in the alarm list.
(d) CPU model name check
[Check details]
Read the PLC CPU type name from the PLC CPU of the system specified
in "Transfer Setup" to compare with the PLC type of the assignment
information database file.
When PLC type is incorrect, issue the "Incorrect PLC Type" alarm.
[Error display area]
The alarm is displayed in the monitor toolbar and alarm list.
B-21
B-21
APPENDIX
MELSOFT
(e) Redundant CPU operation mode check
[Check details]
Check if the operation mode has been changed or not.
[Display area]
The operation mode is displayed in the operation mode area of the
communication status screen.
[Event record]
Record the operation mode switching event when the operation mode is
changed.
(f)
Redundant CPU control/standby system status check
[Check details]
Check the control/standby system status.
When an element of inconsistency is found in the control/standby system
status, "Redundant system: Control/Standby System Status Error" for each
system.
[Display area]
The control/standby system status is displayed in the Communication
Status system A/B area.
[Error display area]
The alarm is displayed in the monitor toolbar and alarm list.
[Event record]
Record the control system switching event when the standby system is
switched to control system.
(g) Redundant CPU system A/B identification flag check
[Check details]
When an element of inconsistency is found in the system A/B identification
flag, issue the redundant system A/B identification error for each system.
[Error display area]
The alarm is displayed in the monitor toolbar and alarm list.
POINT
If the "PLC CPU stopping error" or "PLC CPU error" occurs, download of data to the
CPU module can be performed.
When the error is caused due to the setting of illegal tag data, set the tag data
again.
The error definition can be checked by the FBD program diagnostics of the
programming tool.
REMARK
For details of monitor toolbar, refer to Section 6.3.
For details of alarm list, refer to Section 7.3.
B-22
B-22
APPENDIX
MELSOFT
(2) PLC status check timing
The PLC status check is performed at any of the following timings.
When the monitor tool starts
When the monitor target project is reloaded
At the "PLC status check interval (s)" set in the option setting (general)
(3) Recovery procedure and timing for alarm that has occurred due to
PLC status check
Use the following procedure to clear the alarm that has occurred due to PLC
status check.
(a) Recovery procedure
[CPU module stop error or CPU module operation continue error]
1) On the alarm list screen, double-click the line of the alarm that has
occurred due to PLC status check.
The system alarm details dialog box is displayed.
Section 7.3)
(
2) The error code is displayed in the system alarm details dialog box.
Click "PLC error" within the Help menu on the monitor toolbar to
Section 6.3.1 (5))
display the error code list. (
Observe the "corrective action" in the error code list.
[Project ID code inconsistency error]
Section 9.4).
Reload the monitor target project (
Observe this instruction as well when PLC download is performed with
the programming tool.
[When the PLC type is inconsistent]
The assignment information database file and the PLC CPU
connected to the file are different in the PLC type. Correct the PLC
connection target settings.
[When the redundant system control/standby status error has occurred]
The possible cause is that the tracking cable has not been connected
or broken when the CPU is started.
Check the tracking cable.
[When the redundant system A/B identification error has occurred]
1) Check the Redundant CPU settings of network parameter.
2) The possible cause is that the tracking cable has not been
connected or broken when the CPU is started.
Check the tracking cable.
(b) Recovery timing
To recover from the alarm that has occurred due to PLC status check,
resolve the cause of the alarm.
B-23
B-23
APPENDIX
MELSOFT
Appendix 1.10 Measures for delayed collection periods
Following table describes the reasons and measures for delayed high-speed current
value collection, high-speed process data collection and high-speeding tag data
collection.
Reasons
Measures (execute operations (a) to (c))
(a) Please make the program start frequency of scan lower
according to different period types of program.
The scan time of CPU module is long
(b) Divide this program into several small programs including
necessary operation. Set some of them as "Scan" type and
some of them as "normal" or "low" types also set their phase.
(c) Set "Communicates with peripherals after program execution" in
program execution setting of the programming tool.
(For details, refer to the Operating Manual (Programming Tool).)
Execute monitoring when multiple CPU module
is connected with a single OPS
(a) Please reduce the number of CPU modules being connected
and monitored with one OPS.
Execute monitoring when multiple CPU module
is connected with multiple OPS
(a) Please configure the server/client monitoring system.
(b) Please reduce the collection of trend data and tuning trend from
CPU module.
(a) When Ethernet is applied, please reduce other kinds of OPS
communication.
Network is crowded
(b) When MELSECNET/10 or MELSECNET/H is applied, please
reduce the number of station and total link station.
(c) Please set the communication speed at 25 Mbps.
Displaying control panel screen or pop-up
faceplate in OPS
(a) Please close the control panel screen or pop-up faceplate if it is
not necessary in each OPS.
Different project tags exist in a same group of
control panel screen
(a) Divide the control panel setting in several groups for each
project.
The range of assigned device of tag that
executes trend collection becomes wide
(a) Please narrow the range of assigned device of tag that executes
trend collection. Assignment device of tag is displayed in tag FB
declaration window of programming tool.
For example, if No.1, No.2 and No.100 (line number) tags in tag
FB declaration window of programming tool are monitored,
*1
please move No.100 tag to No.3 in tag FB declaration window.
The range of assigned device of monitor
variable that executes trend collection
becomes wider
(a) Gather the monitor variables which execute trend collection and
assign to the devices.
The assigned devices of monitor variable can be checked by the
methods shown below.
When a monitor variable is global variable, the Global Variable
Declaration window in programming tool
For global variable in which assigned device is not specified
cannot be checked.
When a monitor variable is device direct specification, the
Monitor variable setting screen
For example, assign 4 monitor variables to the close addresses
for each monitor variable such as D0, D1, D1000, D1001, do not
assign apart such as assigning to the addresses of D0, D100,
D1000, D5000.
*1: There are limits for moving (changing) tag FB line number in the tag FB declaration window of
programming tool. For details, refer to "PX Developer Operating Manual (Programming Tool)".
B-24
B-24
APPENDIX
MELSOFT
Appendix 1.11 Communication with Redundant CPU
This section explains the communication with Redundant CPU using the monitor tool.
Appendix 1.11.1 Communication route for monitoring
The monitor tool monitors the Redundant CPU in the following communication routes.
(1) The communication route specified in "Transfer Setup".
Reads/Writes the tag data in the communication route specified for the
Redundant CPU specified as the connection target.
(2) The communication route that the monitor tool uses in the system
Always monitors CPUs of both system A and B in the two communication routes
for both system A and B that the monitor tool use in the system.
Appendix 1.11.2 Monitor operation when the system is switched
This section explains the operation performed when Redundant CPU system switching
occurs.
(1) The communication route specified in "Transfer Setup".
Target system
Control system
Standby system
When the system is switched
The communication is continued according to system switching.
System A
The communication with system A is continued.
System B
The communication with system B is continued.
Not specified
• Via a module mounted to a main base unit or in CPU direct coupled connection:
The communication with the target CPU is continued.
• Via a module mounted to the redundant type extension base unit:
The communication is continued with following system switching.
<Example>
When system switching occurs during access to the Redundant CPU with
the "control system" selected as the target system, access is continued as
shown below.
<CPU direct coupled connection>
PX
Developer
PX
Developer
Connected to control system
via standby system
Control system
Standby system
Tracking cable
Standby system
Control system
Tracking cable
(2) Communication route used by monitor tool in system
B-25
The Redundant CPUs of System A and System B are monitored regardless of
whether system switching occurred or not.
B-25
APPENDIX
MELSOFT
Appendix 1.11.3 Monitor operation when a communication error has occurred
This section explains the operation performed when a communication error occurs
while the Redundant CPU is being monitored.
(1) The communication route specified in "Transfer Setup".
(a) In the backup mode or separate mode
Target system
Control system
Standby system
System A
System B
Not specified
When a communication error has occurred.
When the CPU module is connected via the MELSECNET/H module or an Ethernet module
mounted to a main base unit, the communication is continued by automatically switching the
connection route.
(Automatic switching of communication route is hereafter abbreviated to route switching.)
A communication error occurs without route switching being executed.*1
*1: A communication error message is displayed and monitor operation is
suspended.
The monitor operation is restarted when the normal communication of
monitor tool has been confirmed.
When a communication error occurs during access to the Redundant CPU with
"System B" selected as the target system, access is continued as shown below.
1) When network error occurs
PX
Developer
PX
Developer
Communication
error
System A
System B
System A
Tracking cable
System B
Tracking cable
2) When tracking cable error occurs
PX
Developer
PX
Developer
System A
System B
Tracking cable
System A
System B
Tracking cable
Communication
error
(b) In the debug mode
A communication error occurs without route switching being executed.
(Refer to (a)*1.)
(2) Communication route used by monitor tool in system
A communication error occurs without route switching being executed. (Refer to
(a)*1.)
B-26
B-26
APPENDIX
MELSOFT
POINT
If communication cannot be made with the Redundant CPU set in the transfer setup
at the first connection in the monitor of the Redundant CPU, the monitor of that
Redundant CPU is not started. The first connection indicates the following case.
When the monitor tool is started
When "Apply" or "Reload" button is clicked in the monitor target project setting.
In this case, restart communication after removing the communication disturbance
or changing the transfer setup to the station number of the other Redundant CPU.
<Example> When the control system is set as the target system and the station
number and IP address (host name) of the Ethernet module in
System A is set as the PLC side I/F on the transfer setup screen
If communication cannot be made with the Ethernet module of
System A at the first connection to the monitor tool, a communication
error occurs without route switching being executed.
To start communication in this case, set the station number and IP
address (host name) of the Ethernet module in System B as the PLC
side I/F.
PX
Developer
PX
Developer
System B station number
and IP address setting
Ethernet
Control system
(System A)
Communication
error
Standby system
(System B)
Tracking cable
B-27
Ethernet
Control system
(System A)
Standby system
(System B)
Tracking cable
B-27
APPENDIX
MELSOFT
Appendix 2 Refreshing the monitoring data in the server/client monitoring
system
Appendix 2.1 Refreshing the monitoring data in a secondary server
A secondary server starts up acquiring the setting data from a primary server.
The monitoring data are collected by the secondary server itself.
The secondary server treats the setting data differently depending on the status of
connection to the primary server.
The following table shows the refreshing of the setting/monitoring data.
Monitoring data
Setting data
Tag data
Trend data
Data refreshing
Status of connection to the primary server
Connected
Not connected
Acquisition
The secondary server acquires the setting
data and assignment information database file
from the primary server when the secondary
server connects to the primary server or the
setting data are changed in the primary
server.
The secondary server uses
the setting data and
assignment information
database file in the secondary
server.
Read
The secondary server communicates with the PLC and reads the tag data.
Write
The secondary server communicates with the PLC and writes the tag data.
Data collection
The secondary server collects the trend data.
Occurrence/recovery The secondary server monitors the occurrence/recovery of alarms and
of alarm
refreshes the alarm data in the secondary server.
Alarm data
Event data
‘Confirm’/
‘Confirm All’/
‘Delete Recovered
Alarms’ operation
The secondary server reflects each operation in the alarm data in the
secondary server.
Occurrence of event
The secondary server monitors the occurrence of events and refreshes the
event data in the secondary server.
‘Confirm’/
‘Confirm All’/
‘Delete All’ operation
The secondary server reflects each operation in the event data in the
secondary server.
Trend/Alarm/Event
Export/deletion
automatic CSV file
B-28
The secondary server performs the automatic export and automatic deletion.
B-28
APPENDIX
MELSOFT
Appendix 2.2 Refreshing the monitoring data in clients
In the server/client monitoring system, clients acquire the monitoring data from a server
periodically and display it on screens.
The refreshing period of each monitoring data is as follows.
Monitoring data
Setting data
Tag data
Trend data
Alarm data
Event data
PLC communication status
data
B-29
Refreshing period
A client acquires the setting data and assignment information database file from a server
when the monitor tool client starts up, when it connects to the server or when the setting
data is changed in the server.
A client acquires the tag data of all tags from a server when the monitor tool client starts
up, when it connects to the server or when it acquires the setting data.
After acquiring the tag data of all tags in a batch, a client acquires the tag data of the
following tags once every 0.5 second.
Tags displayed on the control panel.
Tags displayed on the pop-up faceplate/tuning.
Tags whose tuning trend data is currently collected.
Tags referred from the tag access control/faceplate control.
Tags whose data is read/written with process control tag names of PX Developer in
InTouch.
A client acquires the trend pen data of the groups concerned from a server when it
displays the trend graph screen or when it switches groups.
After acquiring the trend pen data in a batch, a client acquires the trend pen data from a
server depending on the sampling period of each pen.
Trend's sampling period is one second.
Getting the trend pen data once every five seconds.
Trend sampling period is ten or more seconds.
Getting the trend pen data once every ten seconds.
A client acquires all records of the alarm data from a server with the following timing.
When a client starts up.
When a client connects to a server.
When "Confirm All" is executed in a server/client.
When "Delete Recovered Alarms" is executed in a server/client.
When the monitor target project setting is changed in a server.
After acquiring all records of the alarm data in a batch, a client checks the change of the
alarm data in a server once a second, acquires the differential records, and refreshes the
data.
A client acquires all records of the event data from a server with the following timing.
When a client starts up.
When a client connects to a server.
When "Confirm All" is executed in a server/client.
When "Delete All" is executed in a server/client.
After acquiring all records of the event data in a batch, a client checks the change of the
event data in a server once a second, acquires the differential records, and refreshes the
data.
A client acquires the following PLC communication status data from a server once a
second.
Acquiring the PLC communication status data enables a client to display "tag data
cannot be read/written" / "tag data cannot be written" status on the faceplate.
B-29
APPENDIX
MELSOFT
Appendix 3 Monitor Tool Startup Option
The monitor tool can be started with the monitor toolbar/start-up screen hidden and
by the mode that matches the authority of the user.
Appendix 3.1 Starting under hiding status
When the monitor tool starts up, it can start up without displaying the monitor toolbar
and the start-up screen if the following arguments are specified.
Argument
/h or /H
/nologo or
/NOLOGO
Operation
Example
Starts up the Monitor tool without displaying the monitor
toolbar.
C:\Melsec\Fbdq\FBDQMon.exe /h
Start up without displaying the start-up screen
C:\Melsec\Fbdq\FBDQMon.exe /nologo
POINT
If starting up with specifying the arguments both /h and /nologo, the monitor
tool can be activated without any influence on the displayed screen.
If starting up without displaying the monitor toolbar (/h specified), the monitor
tool starts up in the mode corresponding to the user name and its authority
registered at the top of the user setting (
Section 9.3).
Example 1) User setting goes as follows:
No.
1
2
User name
User001
User002
Password
******
****
Authority
Operator1
Engineer
use the Operator Mode to activate the monitor tool.
Example 2) Initialized user settings (as shown below)
No.
1
2
User name
Admin
Password
*****
Authority
Engineer
use the Engineer Mode to activate the monitor tool.
(Normally the monitor tool is activated in the lock mode, refer to "Chapter 4
MODE ADMINISTRATION")
1
If starting up with specifying the user * (/u, /p specified) as well as the monitor
toolbar non-display (/h specified), the monitor tool starts up in the mode
corresponding to the authority of the specified user.
*1: Refer to Appendix 3.3.
B-30
B-30
APPENDIX
MELSOFT
Appendix 3.2 Switching between monitor toolbar show/hide after starting
The monitor toolbar can be changed between Show/Hide after start-up.
(1) Use the icon in the task tray
The monitor toolbar can be changed between show/hide via the icon in the task
tray.
The operation procedure goes as follows:
1. Start up the Monitor tool.
2. Display the icon of the monitor tool in the task tray.
[Show Monitor Toolbar]
1. If the monitor toolbar is hidden, right click the icon and
select [Show Monitor Toolbar] in the displayed menu.
2. Show the monitor toolbar.
[Hide Monitor Toolbar]
1. If the monitor toolbar is in show, right click the icon in
the task tray and select [Hide Monitor Toolbar] in the
displayed menu.
2. The monitor toolbar is hidden again.
POINT
If the monitor toolbar is displayed from hidden status after activation, it will not
occupy "Desktop" area, and the other windows can be overlapped over the
monitor toolbar and be displayed.
(When the monitor toolbar is switched from hidden status to displayed status
after normal start-up, the toolbar is always displayed in front of other windows.
Refer to "Section 6.1 Overview of Screen Configuration")
When the setting window is in display, the monitor toolbar cannot be hidden.
(2) Use the control application
Display status of the monitor toolbar can be switched using MonCtrl command
during the Monitor tool start-up.
Refer to Appendix 5.2.
B-31
B-31
APPENDIX
MELSOFT
Appendix 3.3 Starting the Monitor Tool by the Mode That Matches the Authority of the
Specified User
This section explains how to specify the user who starts the monitor tool by using
arguments.
Argument
Description
Example
Specify the user name to be used at the startup of the monitor
/u or /U
tool by the mode that matches the authority of the specified
user. (The user name is case sensitive.)
Enter the user name after the argument /u and a space.
Specify the password to be used at the startup of the monitor
tool by the mode that matches the authority of the specified
user. (The password is case sensitive.)
/p or /P
Refer to the
example
below.
Enter the password after the argument /p and a space.
When the password has not been specified for the user
(
Section 4.6), this argument specification is not needed.
This argument is always used with the argument /u.
[Example]
C:\Melsec\Fbdq\FBDQMon.exe /u username /p password
[Example (when space is included in user name or password)]
When a space is included in the user name or password, enclose the user name or
password in " " (double quotations).
C:\Melsec\Fbdq\FBDQMon.exe /u "PX Dev" /p "mon tool"
POINT
If the user name specified with the argument has not yet registered or the
password does not match the preset one, the monitor tool starts up in the lock
mode.
If the user is specified (/u, /p specified) as well as the monitor toolbar is set to be
hidden (/h specified), the monitor tool is started up in the mode that matches the
authority of the specified user.
When starting the monitor tool in the mode that matches the authority of the
specified user, do not use a "/" (slash) or "-" (hyphen) in the first character of
the user name and password.
B-32
B-32
APPENDIX
MELSOFT
Appendix 4 Operation authority for tag data items
Operation authority for tag data items is classified as shown below.
The authority of operation for changing can be set on User Authority Setting
Section 9.2) per unit of classified tag data items.
(
Classification
No.
Operation authority
1
Description
0
Inoperable *
Read-only item
1
Process instruction values/Mode
Items which are to be process instruction values/mode such as SV,
MV, and Mode
2
Alarm threshold values
Items which are to be alarm threshold values such as PH, HH, and
SH
3
Tuning parameter values
Items which are to be tuning parameters such as P, I, D, and GG
4
Process design values
Items which are to be process design values such as INH, CT, and
RH
Items which are to be simulation/tag stop such as SIM and TSTP
5
1
Simulation/ tag stop *
Only a user with the authority of engineer can operate the
simulation/tag stop since the control output to the system is changed.
*1: The authority of operation for changing cannot be set on User Authority Setting.
B-33
B-33
APPENDIX
MELSOFT
(1) Loop tag (when the tag type is other than PGS, PGS2, PVAL,
HTCL)
Tag data item
FUNC
MODE
MAN
AUT
CAS
CMV
CSV
CASDR
MDIH
MANI
AUTI
CASI
CMVI
CSVI
CASDRI
TSTPI
ATI
OVRI
SIMI
ALM
MLA
MHA
DVLA
DPNA
DPPA
PLA
PHA
LLA
HHA
SEA
OOA
DMLA
SPA
Classification
Classification
Classification
Tag data item
Tag data item
No.
No.
No.
0
0
1
1
1
1
1
1
1
5*
4
4
4
4
4
4
5
4
4
5
1
4*
0
0
0
0
0
0
0
0
0
0
4
0
4
INH
MLI
MHI
DVLI
DPNI
DPPI
PLI
PHI
LLI
HHI
SEI
DMLI
TRKF
ERRI
ALML
MLL
MHL
DVLL
DPNL
DPPL
PLL
PHL
LLL
HHL
SENL
OOL
DMLL
SPL
CTNO
CTFN
UNIT
N
PV
MV
SVC
SV
DV
BIAS
HS0
HS1
PV1
PV2
MH
ML
4
4
4
4
4
4
4
4
4
4
4
4
0
4
4
4
4
4
4
4
4
4
4
4
4
4
4
4
0
0
4
4
2
1*
3
1*
0
1
0
3
4
4
0
0
2
2
RH
RL
PH
PL
HH
LL
SH
SL
ALPHA
HS
CTIM
DPL
CT
ST
SLNO
DML
DVL
P
I
D
SDV
DR
RMAX
RMIN
GW
GG
DM
KM
TM
TM1
TM2
MVP
HORIZON
TRBF
ALPHA2
BETA2
CTDUTY
AT1STEPMV
AT1ST
AT1TOUT1
AT1TOUT2
AT2HS
AT2MVH
AT2MVL
ATTYPE
4
4
2
2
2
2
2
2
3
2
2
2
4
3
0
2
2
3
3
3
0
3
4
4
3
3
3
3
3
3
3
0
3
3
3
3
4
3
3
3
3
3
3
3
3
Tag data item
Classification
No.
ALM2
SVLA
SVHA
DSVLA
INH2
SVLL
SVHL
DSVLL
ALML2
SVLL
SVHL
DSVLL
DSVL
DOM
DOM_AT_START_SET
DOM_AT_STOP_SET
DOM_AT_TYPE
TSTP
OVR
SIM
NOR
DIM
DIM_AT_RUN
DIM_AT_PH
DIM_AT_PL
DIM_AT_MVH
DIM_AT_MVL
DIM_AT_TO
DIM_AT_MODE
DIM_AT_ID
DIM_PREMV
DIM_MVHLD
DIM_MVTRK
0
0
0
0
4
4
4
4
4
4
4
4
2
0
3
3
3
5
1
5
1
0
0
0
0
0
0
0
0
0
0
0
0
*1: The largest classified number in the tag data items of BOOL types that form the tag data items of WORD type
*2: For PV whose tag type is SEL, BC, or PSUM, classification number is 0.
*3: Only when the tag type is SWM, classification number is 0.
B-34
B-34
APPENDIX
MELSOFT
(2) Loop tag (when the tag type is PGS, PGS2)
Tag data item
FUNC
MODE
MAN
AUT
CAS
CMV
CSV
MDIH
MANI
AUTI
CASI
CMVI
CSVI
TSTPI
ALM
MLA
MHA
SVLA
SVHA
SPA
INH
MLI
MHI
SVLI
SVHI
ERRI
Classification
No.
Tag data item
Classification
No.
0
0
1
1
1
1
1
1
5*
4
4
4
4
4
5
4
0
0
0
0
4
4
4
4
4
4
4
ALML
MLL
MHL
SVLL
SVHL
SPL
CTNO
CTFN
UNIT
N
PTNO
STNO
PVSTART
MV
SV
TYP(PGS2)
TYP_HOLD
TYP_RETURN
TYP_CYCLIC
TUNIT
TYP(PGS)
STC
T
MH
ML
PV
4
4
4
4
4
4
0
0
4
4
1
1
1
1
1
0
1
1
1
1
1
1
1
2
2
0
Tag data item
Classification
No.
SH
SL
WAIT
RH
RL
SV0
SV0C
T1 to 32
SV1 to 32
MV1 to 16
DOM
DOM_ADV_START
TSTP
NOR
DIM
DIM_WAIT_MODE
2
2
1
4
4
1
0
1
1
1
0
1
5
1
0
0
*1: The largest classified number in the tag data items of BOOL types that form the tag
data items of WORD type.
B-35
B-35
APPENDIX
MELSOFT
(3) Loop tag (when the tag type is PVAL)
Tag data item
FUNC
MODE
MAN
AUT
CAS
CSV
MDIH
MANI
AUTI
CASI
CSVI
TSTPI
OVRI
SIMI
ALM
TOA
TRIPA
DVLA
DPNA
DPPA
PLA
PHA
LLA
HHA
SEA
SPA
INH
TOI
TRIPI
DVLI
DPNI
DPPI
PLI
PHI
LLI
HHI
SEI
ERRI
Classification
No.
Tag data item
Classification
No.
0
0
1
1
1
1
1
5*
4
4
4
4
5
4
5
1
4*
0
0
0
0
0
0
0
0
0
0
4
4
4
4
4
4
4
4
4
4
4
4
ALML
TOL
TRIPL
DVLL
DPNL
DPPL
PLL
PHL
LLL
HHL
SENL
SPL
CTNO
CTFN
FPNO
PV
VOUT
VOUT_OPEN
VOUT_CLOSE
SVC
DV
HS0
DBND
PH
PL
HH
LL
SH
SL
ALPHA
HS
CTIM
DPL
DVL
TOT
DOT
SIMT
4
4
4
4
4
4
4
4
4
4
4
4
0
0
4
1
0
0
0
0
0
4
4
2
2
2
2
2
2
3
2
2
2
2
2
4
1
Tag data item
Classification
No.
ALML
SVLA
SVHA
DSVLA
INH2
SVLI
SVHI
DSVLI
ALML2
SVLL
SVHL
DSVLL
SV
DSVL
DOM
DOM_OPEN_SET
DOM_CLOSE_SET
DOM_STOP_SET
DOM_TO_RESET
TSTP
OVR
SIM
NOR
DIM
DIM_OPEN
DIM_CLOSE
DIM_LOCAL
DIM_REMOTE
0
0
0
0
4
4
4
4
4
4
4
4
1
2
0
1
1
1
1
5
1
5
1
0
0
0
0
0
4
*1: The largest classified number in the tag data items of BOOL types that form the tag
data items of WORD type.
B-36
B-36
APPENDIX
MELSOFT
(4) Loop tag (when the tag type is HTCL)
Tag data item
Classification
No.
FUNC
MODE
MAN
AUT
CAS
CMV
CSV
MDIH
MANI
AUTI
CASI
CMVI
CSVI
TSTPI
ALM
MLA_HT
MHA_HT
DMLA_HT
MLA_CL
MHA_CL
DMLA_CL
OOA
HBOA
SPA
0
0
1
1
1
1
1
1
5*
4
4
4
4
4
5
1
4*
0
0
0
0
0
0
4
0
4
Tag data item
INH
MLI_HT
MHI_HT
DMLI_HT
MLI_CL
MHI_CL
DMLI_CL
HBOI
ERRI
ALML
MLL_HT
MHL_HT
DMLL_HT
MLL_CL
MHL_CL
DMLL_CL
OOL
HBOL
SPL
CTNO
CTFN
FPNO
PRM_TRK
MV_HT
MV_CL
SV
Classification
No.
4
4
4
4
4
4
4
4
4
4
4
4
4
4
4
4
4
4
4
0
0
4
3
1
1
1
Tag data item
MH_HT
ML_HT
MH_CL
ML_CL
SH
SL
DML_HT
DML_CL
P_HT
I_HT
D_HT
P_CL
I_CL
D_CL
DBND
HS
SPLT
PRM_SEL
DOM
TSTP
NOR
DIM
DIM_PID_HT
DIM_PID_CL
Classification
No.
2
2
2
2
2
2
2
2
3
3
3
3
3
3
3
4
3
3
0
5
1
0
0
0
*1: The largest classified number in the tag data items of BOOL types that form the tag
data items of WORD type.
B-37
B-37
APPENDIX
MELSOFT
(5) Alarm tag, Message tag (ALM tag type, MSG tag type)
Tag data item
Classification
No.
FUNC
ALM
ALM1 to 8
MSG
MSG1 to 8
ALML
ALML1 to 8
MSGCHK
MSGCHK1 to 8
ALM1 to 8NO
MSG1 to 8NO
0
0
0
0
0
4
4
4
4
4
4
(6) Alarm tag, Message tag (ALM_64PT tag type, MSG_64PT tag type)
Tag data item
FUNC
ALM_W1
ALM1 to 16
ALM_W2
ALM17 to 32
ALM_W3
ALM33 to 48
ALM_W4
ALM49 to 64
ALML_W1
ALML1 to 16
ALML_W2
ALML17 to 32
ALML_W3
ALML33 to 48
ALML_W4
ALML49 to 64
ALM1 to 64NO
ALMG1 to 8NO
B-38
Classification
No.
0
0
0
0
0
0
0
0
0
4
4
4
4
4
4
4
4
4
4
Tag data item
Classification
No.
MSG_W1
MSG 1 to 16
MSG_W2
MSG 17 to 32
MSG_W3
MSG 33 to 48
MSG_W4
MSG 49 to 64
MSGCHK_W1
MSGCHK1 to 16
MSGCHK_W2
MSGCHK17 to 32
MSGCHK_W3
MSGCHK33 to 48
MSGCHK_W4
MSGCHK49 to 64
MSG1 to 64NO
MSGG1 to 8NO
0
0
0
0
0
0
0
0
4
4
4
4
4
4
4
4
4
4
B-38
APPENDIX
MELSOFT
(7) Status tag
Tag data item
FUNC
MODE
MAN
AUT
MDIH
MANI
AUTI
OVRI
SIMI
ALM
DPPA
PLA
PHA
TOA
TRIPA
INH
DPPI
PHI
ERRI
TOI
TRIPI
ERRI
ALML
DPPL
PHL
TOL
TRIPL
CTNO
CTFN
UNIT
PV
PSV
SV
SUM2
SV1
SV2
MULT
Classification
No.
Tag data item
Classification
No.
0
0
1
1
1
5*
4
4
4
5
0
0
0
0
0
0
4
4
4
4
4
4
4
4
4
4
4
4
0
0
4
0
1
1
0
1
1
4
RH
RL
PH
CTIM
DPL
FPNO
DOM
DOM_OPEN_SET
DOM_CLOSE_SET
DOM_RUN_SET
DOM_HOLD_RESET
DOM_RESET_SET
DOM_RESET_START_SET
DOM_STOP_SET
DOM_TO_RESET
DOM_SET1 to 5
OVR
SIM
NOR
DIM
DIM_OPEN
DIM_SEMI_CLOSE
DIM_CLOSE
DIM_FWD_SET
DIM_RUN
DIM_STOP
DIM_HOLD
DIM_REV
DIM_LOCAL
DIM_REMOTE
DIM_STOP_RESET
DIM_RESET
DIM_PRE_COMP
DIM_PRE_COMP1
DIM_PRE_COMP2
DIM_COMP
DIM_ON1 to 5
4
4
2
2
2
4
0
1
1
1
1
1
1
1
1
1
1
5
1
0
0
0
0
0
0
0
0
0
0
0
0
0
0
0
0
0
0
Tag data item
Classification
No.
TOT
DOT
SIMT
FPINH
FPINH1 to 5
BTNINH
BTNINH1 to 5
FPNO1 to 5
2
4
1
0
4
0
4
4
*1: The largest classified number in the tag data items of BOOL types that form the tag
data items of WORD type.
B-39
B-39
APPENDIX
MELSOFT
Appendix 5 External Control of the Monitor Tool
Appendix 5.1 ActiveX control
The so-called ActiveX is a kind of compound technology offering service among
different software components. Because the standard method of the so-called COM
(Component Object Model) is adopted, different software can converse in the
network environment no matter what kind of languages used for different softwares.
If using ActiveX, the screens managed by other software can be embedded in the
pages of Microsoft Word , as embedded the tables created using Microsoft
Excel .
The so-called ActiveX control is a software component that executes particular
process. It itself is not an executable application program component. ActiveX control
needs to be plugged-in control containers like Visual Basic and Web browser
program. Designer can create a software with wide range of functions by combining
the exiting ActiveX controls without coding all of the necessary functions.
R
R
R
R
R
Control the whole
application program
Control vessel
(Visual Basic R )
The application
program screen
ActiveX
control
Management of
some graphic
screens
POINT
When creating a graphic screen application which is executed with Visual Basic
in 64-bit Windows , create as a 32-bit application since ActiveX control provided by
PX Developer is 32 bit.
R
R
B-40
B-40
APPENDIX
MELSOFT
Appendix 5.1.1 Tag Data Access Control
Tag data access control is the ActiveX control that acquires or sets tag data value.
For format such as appearance please refer to the command button control provided
by Visual Basic .
The tag data access control button can be placed on the created screen. Click the
Section 7.6) of tags. When using the
button to display pop-up faceplate screen (
tag data access control, tag data items can be specified individually regardless of the
button operation, and acquire or set the value.
R
The tag data access control can be used as the pop-up faceplate display button or
control to acquire/set tag data.
(1) When used as a display button of pop-up faceplate.
Please set the property dialog box to display faceplate at click event.
(ClickedShowFaceplate = True)
Click the tag data access control button in the screen, and the pop-up faceplate
screen of the specified tag appears.
(2) Used for acquiring or setting tag data value
Set the corresponding button hidden when required.
(Visible = False).
Use the item property of tag data access control to acquire/set tag-data item
value in the program.
If the acquired tag-data item value is set for display programming on other control
of the screen, such as text box, the tag item value will appear in the screen.
Or, the SV value can be set on user-created screen if programming by
substituting the Item property of tag data access control with input value in text
box.
POINT
The faceplate cannot be displayed when the monitor tool is not started.
And some value cannot be acquired/set according to the Item property.
After the faceplate is shown, even if the application program as a start-up
resource is closed, the faceplate screen cannot be closed.
The faceplate control is executed through the monitor tool, so when the
monitor tool is exit, the faceplate screen is closed too.
B-41
B-41
APPENDIX
MELSOFT
Appendix 5.1.1 [1] Custom Property
The custom property is an interface to the container provided by the controller.
The following is a custom property list of tag data access control.
Custom property
Description
TagName
Specify the name of target tag.
Additionally, properties can be acquired and set on the user-created screen.
ClickedShowFaceplate
Specify whether to show the faceplate by click event.
(TRUE: display/FALSE: not display)
Additionally, properties can be acquired and set on the user-created screen.
Item
Tag data item value can be acquired and set.
The <<General>> tab in the custom property dialog box can be used to set the
TagName and ClickedShowFaceplate of the custom property of TagDataAccess
control.
<Property dialog box>
Advanced setting
Item
Description
This setting is not applied to each control. This setting is applied as a common setting
in the ActiveX container application.
Default:
When this control communicates
with Monitor Tool
When this control is in communication with Monitor Tool, an ActiveX container
application follows the default processing. Normally, select this option.
Only update screen:
When this control is in communication with Monitor Tool, an ActiveX container
application only updates the screen. When an error occurs in the control, the error
may be resolved by using with this option.
B-42
B-42
APPENDIX
MELSOFT
Following paragraphs explain the custom properties of tag access data control itself.
(1) TagName property
Specify the name of the tag as access target.
TagName property
Syntax
Object. TagName
Argument
Object:
specify the name of tag data access control object.
TagName: specify the name of tag as access object to String type character string.
Data type
String type
Comment
Specify the name of tag as access object.
Additionally, tag name specified by TagName property can be acquired or set in execution.
If same tag name exist in different projects, the name shall be specified in format of (project
name): (tag name).
If the same tag name exist in different projects and the name is not specified in the above
format, the project tag whose priority is higher is taken as the access object.
<Acquire tag name>
<Set tag name>
Example
Val=TagDataAccess1.TagName
TagDataAccess1.TagName="LIC001"
or
TagDataAccess1.TagName="Project1: : LIC001"
(2) Item property
Acquire/set the value of tag data item of tag name that is specified by TagName
property of tag data access control.
Item property
Visual Basic 6.0:
object.Item("Name"),
Visual Basic R .NET: Acquire tag data: object.get_Item("Name"),
Set tag data: object.set_Item("Name",Value)
Object:
specify the name of tag data access control object.
R
Syntax
Name:
specify the tag data item name of acquire/setting value as String type
character string.
Specify the setting value to the tag data item name as a Variant type.
Argument
Value:
Data type
Variant type
Comment
Acquire/setting value of tag data item in the tag that is specified by TagName property of tag
data access control.
Value of tag data item specified by argument "Name" can be acquire/set in execution.
However, if the tag data item specified by argument "Name" does not exist, error will occur.
Error object will be created when error occurs.
Visual Basic R 6.0
Acquire
tag data
Debug.Print TagDataAccess1!PV
or
Debug.Print TagDataAccess1("PV")
or
Debug.Print
TagDataAccess1.Item("PV")
Debug.WriteLine (TagDataAccess1!PV)
or
Debug.WriteLine (TagDataAccess1("PV"))
or
Debug.WriteLine (TagDataAccess1.get_Item("PV"))
Set tag
data
TagDataAccess1!SV = 50.0
or
TagDataAccess1("SV") = 50.0
or
TagDataAccess1.Item("SV") = 50.0
TagDataAccess1!SV = 50.0
or
TagDataAccess1("SV") = 50.0
or
TagDataAccess1.set_Item("SV",50.0)
Example
B-43
Visual Basic R .NET
B-43
APPENDIX
MELSOFT
POINT
For details about the tag item of tag data that can be written and read by
users’ program, refer to "PX Developer Programming Manual".
I/O mode and control mode can be changing.
For details about mode changing conditions, refer to Section 10.3.2 and
Section 10.3.3.
There are limits in changing I/O mode and control mode according to different
tag types.
For details, refer to "PX Developer Programming Manual".
Tag data cannot be set in the following situations.
1) The mode is in the lock mode, or the user does not have authority of
operation for changing the tag data item on User Authority Setting
(
Section 9.2).
(When setting the tag data, switch to a user who has the authority of
operation for changing the tag data item.)
For details of operation authority, refer to Appendix 4.
2) Faceplate with lockout tag
(Please remove the lockout tag from the faceplate that is related to the
setting tag data)
(3) ClickedShowFaceplate property
To specify whether to display show faceplate by click event.
ClickedShowFaceplate property
Syntax
Object:
Argument
Object:
specify the name of tag data access control object.
ClickedShowFaceplate:
specify whether to display faceplate by click event.
Data type
Boolean type
Comments
Set whether to display faceplate by click event.
TRUE:
Display faceplate when click event occurs.
FAULSE: Does not display faceplate when click event occurs.
Additionally, contents specified by ClickedShowFaceplate property can be acquired or set in
execution.
Example
<Acquire whether display faceplate or not>
Val=TagDataAccess1.ClickedShowFaceplate
<Set whether display faceplate or not>
TagDataAccess1.ClickedShowFaceplate=True
or
TagDataAccess1.ClickedShowFaceplate=False
B-44
ClickedShowFaceplate
B-44
APPENDIX
MELSOFT
Appendix 5.1.1 [2] Method
Method is the processing available for turning to objects for execution. The methods
tag data access control are displayed.
ShowFaceplate method
Pop-up faceplate displayed.
The details are as follows:
Item
Description
Name
ShowFaceplate
Grammar
Object. ShowFaceplate
Argument
Object: Specifying the name of tag data access control objects.
Return value
Display the executing result with Boolean type. (True: Success/False: Error Occur)
Description
Pop-up faceplate screen is displayed in modeless status. In the screen, the displayed tag
data are specified by tag names set in the property of tag data access control.
Error objects are generated at the occurrence of error.
Example
Dim Ret As Boolean
Ret=TagDataAccess1.ShowFaceplate
Appendix 5.1.1 [3] Event
Event is a notification process about status change such as clicking control or
keyboard operation from control to container.
The following events can be used in tag data access control.
For details, refer to MSDN library through the help function of Visual Basic .
R
Event
Description
Click
When objects are pointed using mouse, the event occurs after releasing the button.
KeyDown
When objects are focused, the event occurs after pressing the button.
KeyUp
When objects are focused, the event occurs after releasing the button.
DragDrop
The event occurs after drag-drop operation completed.
DragOver
In the drag-drop operation, the event occurs when mouse pointer is dragged over the object.
GotFocus
The event occurs when the focus is set at the object.
LostFocus
The event occurs when the object looses the focus.
Validate
The event occurs before moving focus to the control set as True in CausesValidation Property.
B-45
B-45
APPENDIX
MELSOFT
Appendix 5.1.1 [4] Error list
Error detection will be executed by tag data access control in the following cases:
(1) Error objects are not created
Error message box will be listed which gives the error contents.
Occurrence timing
Message
PX Developer monitor tool not found.
The connection with PX Developer
monitor tool failed.
Failed in registering a tag name to the list
of tags collected at high speed.
Setting window is being displayed.
Failed in registering a tag name to the list
of tags collected at high speed.
Tag Name is incorrect.
Failed in registering a tag name to the list
of tags collected at high speed.
The communication with the server has
failed.
Click button when
ClickedShowFaceplate
=True
Failed in registering a tag name to the list
of tags collected at high speed.
The setting data has been modified in the
server.
Failed in registering a tag name to the list
of tags collected at high speed.
Monitor Tool is establishing a connection
from this client to the server.
Failed in registering a tag name to the list
of tags collected at high speed.
The tag name is incorrect.
Faceplate cannot be displayed.
Setting window is being displayed.
Faceplate cannot be displayed.
A message box is displayed. Or it is in the
state which cannot display a faceplate.
Faceplate cannot be displayed.
Please close the currently displayed
Faceplate, and try again.
Faceplate cannot be displayed.
The communication with the server has
failed.
Reasons
Monitor tool is not started.
Registry data has been
damaged.
Measures
Please start the monitor tool.
Please restart monitor tool.
The Setting window of
monitor tool is in display.
Please close the setting
window.
The name set by tag name
property is invalid.
Please check the tag name.
(a) The content of the OPS (a) Refer to the recovery
procedures in case of
list has been modified in
server failure in "Section
the server.
12.1 Troubleshooting" and
(b) The server does not
recover the server.
start.
(b) to (e)
(c) The server is
Resolve the reasons listed
breakdown.
in the left column, and from
(d) The Ethernet cable is
the help menu, execute
disconnected.
Swicth Server for the
(e) The Ethernet equipment
redundant server system or
such as HUB is
Connect Server for the nonbreakdown.
redundant server system.
Though the setting data has
Please execute Acquire Server
been modified in the server,
Setting Data from the help
the secondary server/client
menu in the monitor tool.
has not acquired it yet.
The request cannot be
Please wait until the connection
processed because the
monitor tool is establishing a to the server is completed.
connection to the server.
Tag name set by TagName
property is invalid.
Setting window of monitor
tool is in display.
(a) The message box is
being displayed.
(b) Waiting for the user
graphic screen to be
closed.
A new Faceplate cannot be
displayed because the
Faceplate being displayed is
in operation.
Please check tag name.
Please close the Setting
window.
(a) Close the message box.
(b) After the user graphic
screen has been closed,
display the faceplate.
Please close the Faceplate
being displayed.
(a) The content of the OPS (a) Refer to the recovery
procedures in case of
list has been modified in
server failure in "Section
the server.
12.1 Troubleshooting" and
(b) The server does not
recover the server.
start.
(b) to (e)
(c) The server is
Resolve the reasons listed
breakdown.
in the left column, and from
(d) The Ethernet cable is
the help menu, execute
disconnected.
Swicth Server for the
(e) The Ethernet equipment
redundant server system or
such as HUB is
Connect Server for the nonbreakdown.
redundant server system.
(To the next page)
B-46
B-46
APPENDIX
Occurrence timing
MELSOFT
Message
Faceplate cannot be displayed.
The setting data has been modified in the
server.
Faceplate cannot be displayed.
Monitor Tool is establishing a connection
from this client to the server.
Click button when
ClickedShowFaceplate
=True
The container application requires
administrative privileges to perform this
action.
Please close the application and run it
under an account that is an administrator
on this machine.
For information about how to run as an
administrator, see the application’s
manual or help.
Monitor Tool requires administrative
privileges to perform this action.
Please close Monitor Tool and run it under
an account that is an administrator on this
machine.
For information about how to run as an
administrator, see the following manual:
PX Developer Version 1 Operating
Manual (Monitor Tool)
Reasons
Though the setting data has
been modified in the server,
the secondary server/client
has not acquired it yet.
The request cannot be
processed because the
monitor tool is establishing a
connection to the server.
Measures
Please execute Acquire Server
Setting Data from the help
menu in the monitor tool.
Please wait until the
connection to the server is
completed.
Privilege level of the
Close the container application
container application is
and set it to run as an
lower than the privilege level
administrator.
of the monitor tool.
Privilege level of the monitor
Close the monitor tool and set
tool is lower than the
it to run as an administrator.
privilege level of the
container application.
REMARK
Control container is Visual Basic and Web browser that ActiveX controls are
inserted to and applied.
High-speed current value collection is a type of communication executed by
monitor tool. For details, refer to "Appendix 1.3 Collecting current value data".
High-speed current value collection of tag set by TagName property is executed
on tag data access control.
R
B-47
B-47
APPENDIX
MELSOFT
(2) Create error object
Error object will be created when error occurs. The "No." in the following table are
the code numbers of the created error object.
Occurrence
timing
No.
1001
1002
1003
Setting
TagName
property
1007
1010
1011
B-48
Message
PX Developer monitor tool not found.
The connection with PX Developer monitor
tool failed.
Failed in registering a tag name to the list of
tags collected of high speed.
Setting window is being displayed.
Failed in registering a tag name to the list of
tags collected of high speed.
The tag name is incorrect.
Reasons
Monitor tool is not started.
Registry data has been damaged.
Setting window of monitor tool is in
display.
Measures
Please start the monitor
tool.
Please restart monitor
tool.
Please close the setting
window.
The name set by tag name property Please check the tag
is invalid.
name.
(a) Refer to the recovery
procedures in case of
server failure in
"Section 12.1
Troubleshooting" and
(a) The content of the OPS list has
recover the server.
been modified in the server.
(b) to (e)
Failed in registering a tag name to the list of (b) The server does not start.
Resolve the reasons
tags collected at high speed.
(c) The server is breakdown.
listed in the left
The communication with the server has
(d) The Ethernet cable is
column, and from the
failed.
disconnected.
help menu, execute
(e) The Ethernet equipment such
Swicth Server for the
as HUB is breakdown.
redundant server
system or Connect
Server for the nonredundant server
system.
Failed in registering a tag name to the list of
Please execute Acquire
Though the setting data has been
tags collected at high speed.
Server Setting Data from
modified in the server, the client has
the help menu in the
The setting data has been modified in the
not acquired it yet.
monitor tool.
server.
Failed in registering a tag name to the list of The request cannot be processed
Please wait until the
tags collected at high speed.
because the monitor tool is
connection to the server
Monitor Tool is establishing a connection
establishing a connection to the
is completed.
from this client to the server.
server.
The pop-up menu of user-created
screen is displayed on the taskbar
R
R
of Microsoft Windows Operating Please add error
The processing failed because of the
System.
processing to Visual
interruption from the windows task bar.
R
R
This may occur only on Microsoft
Basic program.
R
Windows NT Workstation 4.0
Operating System.
The container application requires
administrative privileges to perform this
action.
Privilege level of the container
Close the container
Please close the application and run it
application and set it to
under an account that is an administrator on application is lower than the
privilege level of the monitor tool.
run as an administrator.
this machine.
For information about how to run as an
administrator, see the application’s manual
or help.
Monitor Tool requires administrative
privileges to perform this action.
Please close Monitor Tool and run it under
Privilege level of the monitor tool is Close the monitor tool
an account that is an administrator on this
lower than the privilege level of the and set it to run as an
machine.
container application.
administrator.
For information about how to run as an
administrator, see the following manual: PX
Developer Version 1 Operating Manual
(Monitor Tool)
B-48
APPENDIX
Occurrence
timing
MELSOFT
No.
1001
1002
1003
Executing
Item
property
1006 *1
1007
1008 *2
Message
PX Developer monitor tool not found.
The connection with PX Developer monitor
tool failed.
Failed in registering a tag name to the list of
tags collected of high speed.
Setting window is being displayed.
Failed in registering a tag name to the list of
tags collected of high speed.
The tag name is incorrect.
Reasons
Monitor tool is not started.
Registry data has been damaged.
Setting window of monitor tool is in
display.
The processing failed because of the
interruption from the windows task bar.
Failed in setting the tag data.
Setting window is being displayed.
Failed in setting the tag data.
The current user does not have an authority
to operate it.
Please operate it by the user who has its
operation authority.
Failed in setting the tag data.
Tag Item name is incorrect.
Failed in setting the tag data.
This item cannot be set.
Please start the monitor
tool.
Please restart monitor
tool.
Please close the setting
window.
The name set by tag name property Please check the tag
is invalid.
name.
(a) The content of the OPS list has
been modified in the server.
Failed in registering a tag name to the list of (b) The server does not start.
tags collected at high speed.
(c) The server is breakdown.
The communication with the server has
(d) The Ethernet cable is
failed.
disconnected.
(e) The Ethernet equipment such
as HUB is breakdown.
Failed in registering a tag name to the list of
tags collected at high speed.
The setting data has been modified in the
server.
Failed in registering a tag name to the list of
tags collected at high speed.
Monitor Tool is establishing a connection
from this client to the server.
Failed in acquiring the tag data.
Setting window is being displayed.
Failed in acquiring the tag data.
The tag Item name incorrect.
Measures
Though the setting data has been
modified in the server, the
secondary server/client has not
acquired it yet.
The request cannot be processed
because the monitor tool is
establishing a connection to the
server.
Setting window of monitor tool is in
display.
The set tag data item name is
invalid.
The pop-up menu of user-created
screen is displayed on the taskbar
R
R
of Microsoft Windows Operating
System.
R
This may occur only on Microsoft
R
Windows NT Workstation 4.0
Operating System.
Setting window of monitor tool is in
display.
The user is not authorized for
executing this operation.
The set tag data Item name is
invalid.
Setting value of tag data item
whose value is not allowed to be
set.
Set invalid data type to tag data
item.
Failed in setting the tag data.
The specified type is incorrect.
Failed in setting the tag data.
Set FALSE or 0 to this item.
Alternative bit items should be set to TRUE.
(a) Refer to the recovery
procedures in case of
server failure in
"Section 12.1
Troubleshooting" and
recover the server.
(b) to (e)
Resolve the reasons
listed in the left
column, and from the
help menu, execute
Swicth Server for the
redundant server
system or Connect
Server for the nonredundant server
system.
Please execute Acquire
Server Setting Data from
the help menu in the
monitor tool.
Please wait until the
connection to the server
is completed.
Please close the setting
window.
Please check tag data
item name.
Please add error
processing to Visual
R
Basic program.
Please close the setting
window.
Please operate it by the
user who has its
operation authority.
Please check the tag data
item name.
Please manage to acquire
the value not setting the
value of set tag data item.
Set valid data type to set
tag data item.
Please do not set FALSE
or 0 to this item.
*1: Occur only when tag data are acquired.
*2: Occur only when tag data are set.
(To the next page)
B-49
B-49
APPENDIX
Occurrence
timing
MELSOFT
No.
Message
Reasons
Failed in setting the tag data.
The state transition of Control mode
is invalid.
The state transition of control mode is
invalid.
Tried to change control mode by specifying
untransferable mode.
Specify valid mode
switch.
Failed in setting the tag data.
It is not changed by the specified
control mode in a present I/O mode.
Tried to change control mode when I/O
mode is OVERRIDE or TAG STOP.
Set I/O mode to the mode
other than OVRRIDE and
TAG STOP.
Failed in setting the tag data.
Please operate this after changing
control mode into MANUAL.
The operation that is not executable in the
control mode other than MANUAL is
performed (I/O mode change or command
bit setting in a status tag).
Set control mode to
MANUAL.
Illegal mode switch is executed in I/O mode
setting.
Please specify valid mode
switch.
For restrictions of I/O
mode switch, refer to
Section 10.3.2.
Failed in setting the tag data.
The state transition of I/O mode is
invalid.
Failed in setting the tag data.
The corresponding disable bit is
TRUE.
Executing
Item
property
1008 *2
Failed in setting the tag data.
The corresponding display disable
bit is TRUE.
Failed in setting the tag data.
A lockout tag is set, therefore data
cannot be written.
Failed in setting the tag data.
The specified item cannot be set in
the current mode. (I/O mode)
Failed in setting the tag data.
The specified item cannot be set in
the current mode. (Control mode)
Failed in setting the tag data.
The setting value is out of range.
(Range: xx <= xx <= xx)
Failed in setting the tag data.
Communication status is abnormal.
Failed in setting the tag data.
The Project ID Code of the Monitor
Target Project is different from that in
PLC CPU: *3
Failed in setting the tag data.
The following error is occurring.
(Redundant system: System A/B
identification error)
Failed in setting the tag data.
The following error is occurring.
(Redundant system: Control/ Standby
system status error)
Failed in setting the tag data.
The PLC type in the assignment
information database is different from
that of the connected PLC CPU.
Measures
The corresponding disabled bit is TRUE.
Please set the
Example: To execute mode change to the
corresponding inhibited bit
control mode whose corresponding bit of
to FALSE.
tag data mode inhibited (MDIH) is TRUE.
Please set the
The corresponding display disabled bit is
corresponding display
TRUE.
inhibited bit to FALSE.
As setting lockout tag on the faceplate, it is
not allowed to set value to tag data item.
To set value of items that cannot be set in
the current I/O mode.
To set value of items that cannot be set in
the current control mode.
Please remove the lockout
tag.
Please change to the I/O
mode in which value can
be set.
Please change to the
control mode in which
value can be set.
Value exceeding the range has been set.
Please set value within the
range.
Communication is not normally performed.
Set communication status
right.
(a) The PLC connection target in the monitor
(a) Specify the correct
target project setting is wrong.
connection target.
(b) PLC download has not been performed
(b) Perform PLC
after execution of compile with the
download with the
programming tool.
programming tool.
(c) Reload of the monitor target project with
(c) Perform reload of the
the monitor tool has not been performed
monitor target project
after execution of PLC download with the
with the monitor tool.
programming tool.
Correct the Redundant
The Redundant CPU settings of network
CPU settings of network
parameters are wrong, or the tracking cable
parameters or connect the
has not been connected or broken when the
tracking cable correctly to
Redundant CPU is started.
reset the Redundant CPU.
The tracking cable has not been connected
or broken when the Redundant CPU is
started.
Connect the tracking cable
correctly, and reset the
Redundant CPU.
The PLC connection target is wrong.
Set the correct PLC
connection target.
*2: Occur only when tag data are set.
*3: Occurs only when "Write tag data (even if the PC's and PLC's project ID codes are different)" is set to invalid in the
option setting (general).
(To the next page)
B-50
B-50
APPENDIX
Occurrence
timing
MELSOFT
No.
Message
Failed in setting the tag data.
Operate after changing the control
mode into AUTO.
Failed in setting the tag data.
The communication with the server
has failed.
1008 *2
Executing
Item
property
1010
1011
Failed in setting the tag data.
The setting data has been modified in
the server.
Failed in registering a tag name to the
list of tags collected at high speed.
Monitor Tool is establishing a
connection from this client to the
server.
The container application requires
administrative privileges to perform
this action.
Please close the application and run it
under an account that is an
administrator on this machine.
For information about how to run as an
administrator, see the application’s
manual or help.
Monitor Tool requires administrative
privileges to perform this action.
Please close Monitor Tool and run it
under an account that is an
administrator on this machine.
For information about how to run as an
administrator, see the following
manual: PX Developer Version 1
Operating Manual (Monitor Tool)
Reasons
Measures
The control mode is not in AUTO.
(at DOM_ADV_START command bit Set the control mode to AUTO.
setting for PGS2)
(a) Refer to the recovery
procedures in case of server
failure in "Section 12.1
(a) The content of the OPS list has
Troubleshooting" and
been modified in the server.
recover the server.
(b) The server does not start.
(b) to (e)
(c) The server is breakdown.
Resolve the reasons listed in
(d) The Ethernet cable is
the left column, and from the
disconnected.
help menu, execute Swicth
(e) The Ethernet equipment such as
Server for the redundant
HUB is breakdown.
server system or Connect
Server for the non-redundant
server system.
Though the setting data has been
Please execute Acquire Server
modified in the server, the secondary Setting Data from the help menu
server/client has not acquired it yet.
in the monitor tool.
The request cannot be processed
because the monitor tool is
establishing a connection to the
server.
Please wait until the connection
to the server is completed.
Privilege level of the container
Close the container application
application is lower than the privilege and set it to run as an
level of the monitor tool.
administrator.
Privilege level of the monitor tool is
lower than the privilege level of the
container application.
Close the monitor tool and set it
to run as an administrator.
*2: Occur only when tag data are set.
B-51
B-51
APPENDIX
Occurrence
timing
MELSOFT
No.
1001
1002
1003
Message
PX Developer monitor tool not found.
The connection with PX Developer
monitor tool failed.
Failed in registering a tag name to the
list of tags collected at high speed.
Setting window is being displayed.
Failed in registering a tag name to the
list of tags collected at high speed.
The tag name is incorrect.
Failed in registering a tag name to the
list of tags collected at high speed.
The communication with the server
has failed.
Failed in registering a tag name to the
list of tags collected at high speed.
The setting data has been modified in
the server.
Failed in registering a tag name to the
list of tags collected at high speed.
Monitor Tool is establishing a
connection from this client to the
server.
Faceplate cannot be displayed.
Setting window is being displayed.
Faceplate cannot be displayed.
A message box is displayed. Or it is
in the state which cannot display a
faceplate.
Faceplate cannot be displayed.
Please close the currently displayed
Faceplate, and try again.
Executing
ShowFaceplate
method
1005
Faceplate cannot be displayed.
The communication with the server
has failed.
Reasons
Measures
Monitor tool is not started.
Please start monitor tool.
Registry data has been damaged.
Please restart monitor tool.
The setting window of monitor tool
is in display.
Please close the setting
window.
Tag name set by TagName
property is invalid.
Please confirm tag name.
(a) The content of the OPS list has
been modified in the server.
(b) The server does not start.
(c) The server is breakdown.
(d) The Ethernet cable is
disconnected.
(e) The Ethernet equipment such
as HUB is breakdown.
Though the setting data has been
modified in the server, the
secondary server/client has not
acquired it yet.
The request cannot be processed
because the monitor tool is
establishing a connection to the
server.
The setting window of monitor tool
is in display.
(a) The message box is being
displayed.
(b) Waiting for the user graphic
screen to be closed.
A new Faceplate cannot be
displayed because the Faceplate
being displayed is in operation.
(a) The content of the OPS list has
been modified in the server.
(b) The server does not start.
(c) The server is breakdown.
(d) The Ethernet cable is
disconnected.
(e) The Ethernet equipment such
as HUB is breakdown.
Though the setting data has been
Faceplate cannot be displayed.
modified in the server, the
The setting data has been modified in
secondary server/client has not
the server.
acquired it yet.
(a) Refer to the recovery
procedures in case of
server failure in "Section
12.1 Troubleshooting"
and recover the server.
(b) to (e)
Resolve the reasons
listed in the left column,
and from the help menu,
execute Swicth Server
for the redundant server
system or Connect
Server for the nonredundant server
system.
Please execute Acquire
Server Setting Data from the
help menu in the monitor
tool.
Please wait until the
connection to the server is
completed.
Please close the setting
window.
(a) Close the message box.
(b) After the user graphic
screen has been closed,
display the faceplate.
Please close the Faceplate
being displayed.
(a) Refer to the recovery
procedures in case of
server failure in "Section
12.1 Troubleshooting"
and recover the server.
(b) to (e)
Resolve the reasons
listed in the left column,
and from the help menu,
execute Swicth Server
for the redundant server
system or Connect
Server for the nonredundant server
system.
Please execute Acquire
Server Setting Data from the
help menu in the monitor
tool.
(To the next page)
B-52
B-52
APPENDIX
Occurrence
timing
Executing
ShowFaceplate
method
MELSOFT
No.
Message
1005
Faceplate cannot be displayed.
Monitor Tool is establishing a
connection from this client to the
server.
1007
The processing failed because of the
interruption from the windows task
bar.
1010
1011
The container application requires
administrative privileges to perform
this action.
Please close the application and run
it under an account that is an
administrator on this machine.
For information about how to run as
an administrator, see the application’s
manual or help.
Monitor Tool requires administrative
privileges to perform this action.
Please close Monitor Tool and run it
under an account that is an
administrator on this machine.
For information about how to run as
an administrator, see the following
manual: PX Developer Version 1
Operating Manual (Monitor Tool)
Reasons
The request cannot be processed
because the monitor tool is
establishing a connection to the
server.
The pop-up menu of user-created
screen is displayed on the taskbar
R
R
of Microsoft Windows Operating
System.
R
This may occur only in Microsoft
R
Windows NT Workstation 4.0
Operating System.
Measures
Please wait until the
connection to the server is
completed.
Please add error processing
R
to Visual Basic program.
Privilege level of the container
application is lower than the
privilege level of the monitor tool.
Close the container
application and set it to run
as an administrator.
Privilege level of the monitor tool is
lower than the privilege level of the
container application.
Close the monitor tool and
set it to run as an
administrator.
REMARK
High-speed current value collection is a type of communication executed by
monitor tool. For details, refer to "Appendix 1.3 Collecting current value data".
High-speed current value collection of tag set by TagName property will be
executed on the tag data access control.
B-53
B-53
APPENDIX
MELSOFT
Appendix 5.1.2 Faceplate Control
Faceplate control is the ActiveX control that displays faceplate on user-created
screen.
The external appearance and function are as same as that of monitor tool faceplate.
The faceplate can be placed freely on the user-graphic screen to be created.
POINT
Faceplate cannot be displayed if monitor tool is not started.
Appendix 5.1.2 [1] Custom Property
The following is a list of custom properties of faceplate control.
Custom property
TagName
Description
Specify the target tag name.
Custom property TagName can be set through the <<General>> tab of property
dialog box.
Advanced setting
Refer to Appendix 5.1.1 [1]
Following table describes the contents related to the custom properties of faceplate
control.
TagName property
Comments
B-54
Specify the name of tag as access target.
If different projects have the same tag name, specify the name in (Project name): (tag name)
format.
If different projects have the same tag name which is not specified in the above format, the
tag which priority is higher will become access target.
If resetting the tag name in its execution, the display in a faceplate changes as well.
When the tag name is blank, the tag name display for faceplate is also blank.
B-54
APPENDIX
MELSOFT
Appendix 5.1.2 [2] Error list
(1) Error display by message box
When the faceplate control detects an error, the background color of tag name
display area turns yellow and the tag name turns black. If the faceplate is
clicked in this status, the following message will appear.
Occurrence
timing
Message
PX Developer monitor tool not found.
The connection with PX Developer
monitor tool failed.
Failed in registering a tag name to the
list of tags collected at high speed.
Setting window is being displayed.
Failed in registering a tag name to the
list of tags collected at high speed.
The tag name is incorrect.
Failed in registering a tag name to the
list of tags collected at high speed.
The communication with the server
has failed.
In executing
faceplate
controls
Failed in registering a tag name to the
list of tags collected at high speed.
The setting data has been modified in
the server.
Failed in registering a tag name to the
list of tags collected at high speed.
Monitor Tool is establishing a
connection from this client to the
server.
Failed in acquiring the tag data.
Setting window is being displayed.
Reasons
Monitor tool is not started.
Please start monitor tool.
Registry data has been damaged.
Please restart monitor tool.
Setting window of monitor tool is in
display.
Please close the setting window.
The name set by TagName property is
Please check the tag name.
invalid.
(a) The content of the OPS list has
been modified in the server.
(b) The server does not start.
(c) The server is breakdown.
(d) The Ethernet cable is
disconnected.
(e) The Ethernet equipment such as
HUB is breakdown.
(a) Refer to the recovery procedures
in case of server failure in
"Section 12.1 Troubleshooting"
and recover the server.
(b) to (e)
Resolve the reasons listed in the
left column, and from the help
menu, execute Swicth Server for
the redundant server system or
Connect Server for the nonredundant server system.
Though the setting data has been
modified in the server, the secondary
server/client has not acquired it yet.
Please execute Acquire Server Setting
Data from the help menu in the monitor
tool.
The request cannot be processed
Please wait until the connection to the
because the monitor tool is
server is completed.
establishing a connection to the server.
Setting window of monitor tool is in
display.
The pop-up menu of user-created
screen is displayed on the taskbar of
R
R
Microsoft
Windows
Operating
The processing failed because of the
System.
interruption from the windows task bar.
R
This may occur only in Microsoft
R
Windows NT Workstation 4.0
Operating System.
Failed in acquiring the faceplate setting
information.
Setting window is being displayed.
Setting window is being displayed.
Faceplate cannot be displayed.
The communication with the server
has failed.
Measures
(a) The content of the OPS list has
been modified in the server.
(b) The server does not start.
(c) The server is breakdown.
(d) The Ethernet cable is
disconnected.
(e) The Ethernet equipment such as
HUB is breakdown.
Please close the setting window.
Please close the pop-up menu.
Close the setting window.
(a) Refer to the recovery procedures
in case of server failure in
"Section 12.1 Troubleshooting"
and recover the server.
(b) to (e)
Resolve the reasons listed in the
left column, and from the help
menu, execute Swicth Server for
the redundant server system or
Connect Server for the nonredundant server system.
(To the next page)
B-55
B-55
APPENDIX
Occurrence
timing
MELSOFT
Message
Faceplate cannot be displayed.
The setting data has been modified in
the server.
Faceplate cannot be displayed.
Monitor Tool is establishing a
connection from this client to the
server.
Failed in setting the tag data.
The communication with the server
has failed.
In executing
faceplate
controls
B-56
Failed in setting the tag data.
The setting data has been modified in
the server.
Failed in setting the tag data.
Monitor Tool is establishing a
connection from this client to the
server.
The container application requires
administrative privileges to perform this
action.
Please close the application and run it
under an account that is an
administrator on this machine.
For information about how to run as an
administrator, see the application’s
manual or help.
Monitor Tool requires administrative
privileges to perform this action.
Please close Monitor Tool and run it
under an account that is an
administrator on this machine.
For information about how to run as an
administrator, see the following
manual: PX Developer Version 1
Operating Manual (Monitor Tool)
Reasons
Measures
Though the setting data has been
modified in the server, the secondary
server/client has not acquired it yet.
Please execute Acquire Server Setting
Data from the help menu in the monitor
tool.
The request cannot be processed
because the monitor tool is
establishing a connection to the
server.
Please wait until the connection to the
server is completed.
(a) The content of the OPS list has
been modified in the server.
(b) The server does not start.
(c) The server is breakdown.
(d) The Ethernet cable is
disconnected.
(e) The Ethernet equipment such as
HUB is breakdown.
Though the setting data has been
modified in the server, the secondary
server/client has not acquired it yet.
The request cannot be processed
because the monitor tool is
establishing a connection to the
server.
(a) Refer to the recovery procedures
in case of server failure in
"Section 12.1 Troubleshooting"
and recover the server.
(b) to (e)
Resolve the reasons listed in the
left column, and from the help
menu, execute Swicth Server for
the redundant server system or
Connect Server for the nonredundant server system.
Please execute Acquire Server Setting
Data from the help menu in the monitor
tool.
Please wait until the connection to the
server is completed.
Privilege level of the container
application is lower than the privilege
level of the monitor tool.
Close the container application and set
it to run as an administrator.
Privilege level of the monitor tool is
lower than the privilege level of the
container application.
Close the monitor tool and set it to run
as an administrator.
B-56
APPENDIX
MELSOFT
(2) Creation of error object
Error object will be created when an error occurs. The No.s in the following table
are the code numbers of the created error objects.
Occurrence
timing
No.
1001
1002
1003
Message
PX Developer monitor tool not found.
The connection with PX Developer
monitor tool failed.
Failed in registering a tag name to the
list of tags collected of high speed.
Setting window is being displayed.
Failed in registering a tag name to the
list of tags collected of high speed.
The tag name is incorrect.
Failed in registering a tag name to the
list of tags collected of high speed.
The communication with the server
has failed.
Calling or
Setting
TagName
property
Failed in registering a tag name to the
list of tags collected of high speed.
The setting data has been modified in
the server.
Failed in registering a tag name to the
list of tags collected at high speed.
Monitor Tool is establishing a
connection from this client to the
server.
1007
1009
1010
Calling or
Setting
TagName
property
1011
B-57
Reasons
Measures
Monitor tool is not started.
Please start the monitor tool.
Registry data has been damaged.
Please restart monitor tool.
Setting window of monitor tool is in
display.
Please close the setting
window.
The name set by tag name property
is invalid.
Please check the tag name.
(a) Refer to the recovery
procedures in case of
server failure in "Section
(a) The content of the OPS list has
12.1 Troubleshooting"
been modified in the server.
and recover the server.
(b) The server does not start.
(b) to (e)
(c) The server is breakdown.
Resolve the reasons
(d) The Ethernet cable is
listed in the left column,
disconnected.
and from the help menu,
execute Swicth Server for
(e) The Ethernet equipment such as
the redundant server
HUB is breakdown.
system or Connect
Server for the nonredundant server system.
Though the setting data has been
Please execute Acquire
modified in the server, the
Server Setting Data from the
secondary server/client has not
help menu in the monitor tool.
acquired it yet.
The request cannot be processed
because the monitor tool is
establishing a connection to the
server.
Please wait until the
connection to the server is
completed.
The pop-up menu of user-created
screen is displayed on the taskbar of
R
R
Microsoft
Windows Operating
Please add error processing
The processing failed because of the
System.
R
interruption from the windows task bar.
R
to Visual Basic
program.
This may occur only on Microsoft
R
Windows NT Workstation 4.0
Operating System.
Failed in acquiring the faceplate
Please close the setting
Setting window is being displayed.
setting information.
window.
The container application requires
administrative privileges to perform
this action.
Close the container
Please close the application and run it Privilege level of the container
application is lower than the privilege application and set it to run as
under an account that is an
an administrator.
level of the monitor tool.
administrator on this machine.
For information about how to run as an
administrator, see the application’s
manual or help.
Monitor Tool requires administrative
privileges to perform this action.
Please close Monitor Tool and run it
Privilege level of the monitor tool is
under an account that is an
Close the monitor tool and set
lower than the privilege level of the
administrator on this machine.
it to run as an administrator.
For information about how to run as an container application.
administrator, see the following
manual: PX Developer Version 1
Operating Manual (Monitor Tool)
B-57
APPENDIX
MELSOFT
REMARK
High-speed current value collection is one type of communication executed by
monitor tool.
For details, refer to "Appendix 1.3 Collecting current value data".
High-speed current value collection of tag set by TagName property will be executed
on the tag data access control.
B-58
B-58
APPENDIX
MELSOFT
Appendix 5.2 MonCtrl command
Functions of the monitor tool can be called from external applications, such as
Microsoft Visual Basic using the MonCtrl command (MonCtrl.exe).
R
R
(1) Restrictions on the MonCtrl command
The monitor tool cannot be called in the following cases:
• when the monitor tool is not started
• when the setting window is displayed
• when the "Change Mode" dialog box is displayed
• when the monitor toolbar is displaying modal dialog boxes (message box or
error message)
• when the monitor toolbar is closing an application opened from the usercreated screen buttons
• when the monitor screen is displayed additionally as the fifth screen in multiwindow mode
(2) Arguments of the MonCtrl command
The following shows arguments used for the MonCtrl command.
Only one function (argument) can be specified.
Item
1
2
Argument*
Description*
Hide monitor
Toolbar
/hide
or
/h
Hides the monitor toolbar.
MonCtrl.exe /hide
or
Format
MonCtrl.exe /h
Display
monitor
Toolbar
/show
or
/s
Displays the monitor toolbar.
MonCtrl.exe /show
or
Format
MonCtrl.exe /s
Exit monitor
tool
/exit
or
/e
Exits the monitor tool.
MonCtrl.exe /exit
or
Format
MonCtrl.exe /e
When the monitor toolbar is displayed, only a user who has the
Restrictions
authority of operation for exiting the monitor tool can exit.
Confirmation dialog box is not displayed.
Exits regardless of the mode (lock mode, operator mode or engineer
Point
mode) if the monitor toolbar is hidden.
Display
control panel
/controlpanel
Displays the control panel with the specified group name.
MonCtrl.exe /controlpanel [Group name] [/position left coordinate,
Format
top coordinate, right coordinate, bottom coordinate] [/maximize]
Display trend
graph
/trend
Displays the trend graph with the specified group name.
MonCtrl.exe /trend [Group name] [/position left coordinate, top
Format
coordinate, right coordinate, bottom coordinate] [/maximize]
When specifying trend graph display position, the Monitor tool
Restrictions adjusts height to three-quarters of width automatically if height
exceeds three-quarters of width.
Display alarm /alarm
list
B-59
Displays the Alarm list screen.
MonCtrl.exe /alarm [/position left coordinate, top coordinate, right
Format
coordinate, bottom coordinate] [/maximize]
B-59
APPENDIX
MELSOFT
1
Item
2
Argument*
Display event
list
/event
Description*
Displays the event list screen.
MonCtrl.exe /event [/position left coordinate, top coordinate, right
Format
coordinate, bottom coordinate] [/maximize]
Display pop-up /faceplate
faceplate
screen
Displays the pop-up faceplate screen with the specified tag name.
MonCtrl.exe /faceplate tag name [/position left coordinate, top
Format
coordinate, right coordinate, bottom coordinate]
When specifying faceplate display coordinates, the monitor tool
Restrictions
adjusts aspect ratio to 5:1 automatically.
Display find
screen
/find
Displays the find screen.
Format
MonCtrl.exe /find
Change mode
/changemode Displays the change mode screen.
When user name and password are specified for argument, the mode is changed
according to the registered user authority.
When "/lock" is specified for argument, the mode is changed to lock mode.
Note that user name, password, and lock are specified for argument, the change mode
screen is not displayed.
MonCtrl.exe /changemode [/user User name [/password Password]]
or
MonCtrl.exe /changemode [/u User name [/p Password]]
Format
or
MonCtrl.exe /changemode /lock
When the Change mode screen is displayed, mode cannot be
Restrictions
changed.
Display PLC
/comstatus
communication
status screen
Display
/cscomstatus
Server/Client
communication
status screen
Stop buzzer
/buzzeroff
Displays the PLC communication status screen.
Format
MonCtrl.exe /comstatus
Displays the Server/Client communication status screen.
Format
MonCtrl.exe /cscomstatus
Stops the buzzer of the monitor tool.
Format
MonCtrl.exe /buzzeroff
A user who has the authority of operation for stopping the buzzer
Restrictions
can stop.
*1: Arguments are not case-sensitive.
*2: Format is written without path. For actual use, describe with full path (refer to Application examples of the MonCtrl
command) according to the install destination of PX Developer.
The following shows regulations for notation of arguments.
Notation
Underline (
Description
)
Information that the user must specify
Bracket ( [ ] )
Omittable item
POINT
"/" (slash) and "-" (hyphen) cannot be used for the first character of group
names, user names or passwords.
Group names, user names or passwords are case-sensitive.
If group names, user names or passwords include any spaces, are included,
quote them using " ” " (double quotation).
When group names, user names or passwords include " ” " (double quotation),
specify them using three double quotations " ””” " for one double quotation " ” ".
Example) Specify "abc”””def" for the user name "abc”def".
B-60
B-60
APPENDIX
MELSOFT
(3) Display position and maximum display specification
The following explains the method for specifying display position and maximum
display.
The display position and maximum display can be specified using the following
arguments in combination with the arguments for display position and maximum
display.
/controlpanel, /trend, /alarm, /event, /faceplate
Item
1
Display position /position
Maximum
display
2
Argument*
/maximize
Description*
Specifies the display position of a window.
Format
/position left coordinate, top coordinate, right coordinate, bottom
coordinate
Point
• In single-window mode, this argument specification is ignored
because the window is always displayed at maximum on the
primary monitor. Note when displaying the pop-up faceplate
screen, the window is displayed at the specified coordinates
position.
• Specify the left, right, top, and bottom of coordinates within the
range of –32768 to 32767, without including spaces and tabs
between commas and numbers.
Displays a window in its maximum size.
Format
Point
/maximize
• Display coordinates at disabling maximum display can be set in
advance by specifying an argument"/maximize" after "/position".
• In single-window mode, this argument specification is ignored.
*1: Arguments are not case-sensitive.
*2: The following table shows regulations for notation of arguments.
Notation
Underline (
B-61
Description
)
Information must be specified by a user
B-61
APPENDIX
MELSOFT
Application examples of the MonCtrl command
The following shows the application examples of the MonCtrl command using
Microsoft Visual Basic application.
R
R
Calling the faceplate whose tag name is TIC001
Dim RetVal
RetVal = Shell ("C:\Melsec\fbdq\MonCtrl.exe /faceplate TIC001")
Calling the control panel whose group name is A tank by specifying the display position
Dim RetVal
RetVal = Shell ("C:Melsec\fbdq\MonCtrl.exe /controlpanel "A Tank" /position
110,150,1180,980")
Calling the Change Mode screen
Dim RetVal
RetVal = Shell ("C:Melsec\fbdq\MonCtrl.exe /changemode")
B-62
B-62
APPENDIX
MELSOFT
Appendix 6 Warning Message Appears on Windows Vista or later
R
Appendix 6.1 Overview of warning message
As a user account control function has been added to Windows Vista or later, a
warning message appears when you run the monitor tool.
Section 5.1)
(
R
< Windows Vista >
R
B-63
< Windows 7 or later >
R
B-63
APPENDIX
MELSOFT
Appendix 6.2 Methods for preventing the warning message
POINT
The user account control (UAC) function prevents a crash (e.g. prevention of startup of a program which executes unintended operation).
Before setting this function, grasp that the security function offered by UAC will be
disabled and fully understand the risk.
The following two methods are available for preventing a warning message.
(1) Disabling the user account control function
The following shows a procedure for disabling the user account control function.
(a) When using Windows Vista
R
1) Select [Start] – [Control Panel].
2) Select [User Accounts].
(To the next page)
B-64
B-64
APPENDIX
MELSOFT
(From the previous page)
3) Select [User Accounts].
4) Select [Turn User Account Control on or off].
5) Deselect [Turn on User Account Control (UAC) to
make your computer more secure] and click the "OK"
button.
(Setting completion)
B-65
B-65
APPENDIX
MELSOFT
(b) When using Windows 7 or later
R
1) Select [Start] – [Control Panel].
When using Windows 8, right-click the left bottom
corner of the screen, and select [Control Panel].
R
2) Select [System and Security].
3) Select [Change User Account Control settings].
(To the next page)
B-66
B-66
APPENDIX
MELSOFT
(From the previous page)
4) Set the slide bar "Never notify" and click the "OK"
button.
(Setting completion)
(2) Allowing the warning message without showing it
The following shows a procedure for allowing a warning message without
showing it.
1) Select [Start] – [Control Panel].
When using Windows 8, right-click the left bottom
corner of the screen, and select [Control Panel].
R
2) Select [System and Security].
When using Windows Vista , select [Classic View].
R
(To the next page)
B-67
B-67
APPENDIX
MELSOFT
(From the previous page)
3) Select [Administrative Tools].
4) Select [Local Security Policy].
* When user account control is enabled in
Windows Vista , the following screen appears.
Click the "Continue" button or the "Yes" button.
R
< Windows Vista >
R
< Windows 7 or later >
R
5) Select [Local Policies].
(To the next page)
B-68
B-68
APPENDIX
MELSOFT
(From the previous page)
6) Select [Security Options].
7) Select [User Account Control: Behavior of the
elevation prompt for administrators in Admin Approval
Mode Prompt for consent.
8) Select [Elevate without prompting] on the <<Local
Security Setting>> tab, and click the "OK" button.
(Setting completion)
B-69
B-69
APPENDIX
MELSOFT
Appendix 7 Functions Added to and Changed from Old Version
The following table indicates the functions added and changed with this upgrade.
Compatible
1
version*
Added/changed
function
R
Microsoft Windows
XP compatibility
Addition/change
R
R
Compatible with Microsoft Windows XP Professional
R
R
and Microsoft Windows XP Home Edition.
Section 2.2
Help menu
The error codes related to the CPU module error can be
displayed from the monitor tool.
Section 6.3.1 (5)
Pop-up window
If a new pop-up window is opened when two pop-up
windows have already displayed, the first opened one of
the two on-screen windows is closed automatically.
Section 6.5.2
Event list
The history of starting and exiting the monitor tool and the
history of loading the monitor target projects are left as
event history.
Section 7.4.1
Pop-up tuning window
Version
1.04E
R
Reference
In pop-up tuning, the BOOL type items are displayed in
a tree form. Also, BOOL type tag data can be changed.
The pop-up tuning window size can be changed
regardless of the aspect ratio.
Section 7.7
Number of event
notifications received
on communication
condition screen
The number of event notifications received on the
communication condition screen is changed to the
"
" at a communication error, etc.
Section 8.5
Automatic CSV file
export
The function that outputs trend, alarm and event data to
CSV files automatically is added.
Section 8.7
Monitor target project
setting
Whether the file specified in the monitor target project
setting can be used with the monitor tool or not is
displayed.
Section 9.4
Write tag data (even if
the PC's and PLC's
project ID codes are
different)
The setting can be made to disable tag data write at a
project ID code inconsistency.
Section 9.17 (1)
Disk free space check
The disk free space check size can be set.
Section 9.17 (1)
The "Close" button is added to the faceplate.
The display direction of the PV value bar on the
faceplate can be changed.
When a project ID code inconsistency is detected, the
background of the tag name is changed to light blue,
and tag data write can be disabled.
The stop alarm (SPA) can be reset from the faceplate.
Section 10.1
PLC status check
The error of the CPU module can be detected on the
monitor tool. (The error is displayed as an alarm.)
Also, the consistency between the monitor target project
set with the monitor tool and the project in the CPU module
is checked.
Appendix 1.9
Monitor tool startup
option
The monitor tool can be started up by the mode that
matches the authority of the user.
(The user name and password can be specified with the
arguments for monitor tool startup.)
Appendix 3.3
Faceplate
*1: The compatible version can be confirmed within About PX Developer.
For details, refer to "Section 6.3.1 (5) Display button of help menu".
B-70
B-70
APPENDIX
Compatible
1
version*
MELSOFT
Added/changed
function
Reference
Supported CPU
The Redundant CPU is supported.
Section 2.1.1
Monitor tool startup
The monitor tool can be started without GX Developer.
Section 5.1
Appendix 3.1
Alarm list
The following system alarms have been added.
Redundant system PLC parameter read error
Redundant system A/B identification error
Redundant system control/standby status error
PLC type inconsistency
Event notification source error
Event notification data receiving error
Section 7.3.1
Even list
The following system events have been added.
Redundant system control switching history
Redundant system operation mode switching history
Section 7.4.1
Version
1.06G
Communication
condition screen
The display of redundant system status has been added.
Section 8.5
Monitor target project
setting screen
"Transfer Setup" dialog box varies with the CPU type.
Section 9.4
Communication
function
In the redundant system, event notification is issued when
the operation status or operation mode is changed.
Appendix 1.2
Communication route
The following communication route are extended.
C24 connection, MELSECNET/H remote connection
and G4 module connection in serial/USB
CC-Link connection
Coexistence network connection of other station
Section 2.1.2
Section 9.4
Changing the I/O mode
Changing the control
mode
Version
1.10L
Addition/change
The mode selection in the change I/O mode dialog box is
changed to a toggle button.
The mode selection in the change control mode dialog
box is changed to a toggle button
No restrictions on control mode transition
Changing the motion
type
The mode selection in the change motion type dialog box
is changed to a toggle button.
Tag data access
control
The Visual Basic .NET is supported.
R
Section 10.3.2
Section 10.3.3
Section 10.5
Section 10.3.4
Appendix 5.1.1
R
Faceplate control
The Visual Basic .NET is supported
Tag name change during execution is enabled
Error contents of an error object have been added
Event notification
The unreceivable cases of event notification have been
added.
CC-Link connection
When connecting a PLC via MELSECNET/10(H) and
Ethernet in single network connection or connecting in
coexistence network connection
When performing a monitor tool in a PC CPU, a PLC
CPU is connected using MELSECNET/H module
Section 8.5.1
Alarm list
SVLA and SVHA of ALM2 item have been added
(changed with the addition of 2PIDH).
Section 7.3
Event list
Tag stop has been added to the status change history for
I/O mode (changed with the addition of 2PIDH).
Section 7.4
Appendix 5.1.2
*1: The compatible version can be confirmed within About PX Developer.
For details, refer to "Section 6.3.1 (5) Display button of help menu".
B-71
B-71
APPENDIX
Compatible
1
version*
MELSOFT
Added/changed
function
Pop-up tuning
Setting window
Option setting
(Faceplate)
Version
1.10L
Faceplate
Monitor toolbar
Event list
Pop-up tuning
Option setting
Version
1.14Q
Operation display type
Faceplate
Auto tuning
User-created
Addition/change
The tag monitor is changed to a tab display (Basic/All tab).
Only highly used tag items are displayed in the Basic tab.
Changed the specifications of the tuning trend collection
instructions button and the status display (enabled to
restart tuning trend without clearing the data).
2PIDH has been added to auto tuning target.
The status bar has been added.
If the icon is displayed in the setting item, an error
message will be displayed in the status bar.
SV limit excess setting, SV Pointer Color (2PIDH) and MV
status color have been added to the setting item.
2PIDH (2-degree-of-freedom Advanced PID control) has
been added to the tag type.
SVA has been added to the alarm display (changed with
the addition of 2PIDH).
Tag stop (TAG STOP) mode has been added to the I/O
mode (changed with the addition of 2PIDH).
The restriction on the I/O mode transition by operation
mode is added.
CASCADE DIRECT mode has been added to the control
mode (changed with the addition of 2PIDH).
The restriction on the control mode transition by I/O mode
has been added.
The PV setting button has been added to the operation
display type.
PV value can be set in a faceplate.
SV limit excess setting has been added to the SV setting.
Tag comment is added for alarm/event.
Event is added for the target of the faceplate screen
display button.
The alarm list screen/event list screen are changed to be
displayed by double-clicking.
Faceplate is changed to be displayed by double-clicking.
Status change record for PGS2 is added.
Descriptions for PGS2 are added.
Alarm/event display format of monitor toolbar is added.
The executing step No. setting button, time in the step
setting button, and pattern graph display have been added.
PGS2 (Multi-point program setter) has been added to the
tag type.
Limit Cycle method is added.
An existing method is defined as Step Response, the
method can be selected.
The detail setting for interacting with GT SoftGOT1000 has
been added.
The MonCtrl command option for controlling the monitor
R
R
tool from Microsoft Visual Basic application has been
added.
Reference
Section 7.7
Section 7.7.3
Section 7.7.5
Section 9.1.1
Section 9.4
Section 9.7
Section 9.8
Section 9.14
Section 9.17
Section 10.5
Section 10.5.2
Section 10.1
Section 10.3.2
Section 10.3.3
Section 10.3.3
Section 10.3.1
Section 10.3.7
Section 10.3.8
Section 6.3.1
Section 6.3.1
Section 6.3.1
Section 7.4.1
Section 7.4.1
Section 7.7.1
Section 9.17
Section 10.3.1
Section 10.3.12
Section 10.3.13
Section 10.5.5
Section 3.2
Section 7.7.5
Chapter 11
Appendix 5.2
*1: The compatible version can be confirmed within About PX Developer.
For details, refer to "Section 6.3.1 (5) Display button of help menu".
B-72
B-72
APPENDIX
Compatible
1
version*
MELSOFT
Added/changed
function
Communication route
Trend graph
Alarm list
Version
1.14Q
Event list
Automatic alarm CSV
file export
Automatic event CSV
file export
Option setting
Version
1.18U
Specifications of redundant type extension base unit are
added.
"Displays tag comment instead of tag name" checkbox
has been added and the display can be switched
between tag name and tag comment.
"Tag Comment" has been added to the display item.
"Tag Comment" has been added to Print and Export to
CSV file.
"Tag Comment" has been added to the display item.
"Tag Comment" has been added to Print and Export to
CSV file.
Reference
Section 2.1.2
Section 7.2
Section 7.3
Section 7.4
"Tag Comment" has been added to the export item.
Section 8.7.2
"Tag Comment" has been added to the export item.
Section 8.7.3
Item Name Display Format has been added to an item
in Trend Graph.
Section 9.17
SCADA interaction
Interaction function with InTouch has been added.
Communication route
CC-Link IE Controller Network is supported.
Supported CPU
Q02PHCPU and Q06PHCPU are supported.
Supported OS
Windows Vista
Generate GOT screen
GOT screen generator function has been added.
00A has been added to the alarm display.
The scale high/low limit display area illuminates when
the PV value is outside the range of engineering
high/low limit.
Faceplate
Version
1.20W
Addition/change
R
is supported.
PX Developer
Operating Manual
(InTouch
Interaction)
Chapter 2
Section 9.4
Section 2.1.1
Section 2.1.4
Section 2.2
Section 9.1
Section 10.1
Section 10.3.7
Monitoring system
configuration with
Monitor Tool
The server/client monitoring system can be
configured.
Up to 16 PLCs can be connected.
Compatible with the redundant server system
configuration.
Section 2.1.6
Section 5.1
Section 8.6
Section 8.7
Section 9.4
Section 9.5
Monitor toolbar
As substitute for tag names, tag comments can be
displayed in the alarm/event display area.
Display character counts in the alarm/event display
area have been flexible depending on the screen
resolution.
Section 6.3.1
Pop-up faceplate
Up to 4 screens can be displayed.
Section 6.5.2
Section 7.6
Alarm list
The following system alarms have been added.
Event notification execution error
Client Communication Error
Section 7.3.1
Faceplate
SWM (Manual setter with monitor) tag has been added
to the tag type.
Section 10.4
Section 10.5
Section 10.5.8
*1: The compatible version can be confirmed within About PX Developer.
For details, refer to "Section 6.3.1 (5) Display button of help menu".
B-73
B-73
APPENDIX
Compatible
1
version*
MELSOFT
Added/changed
function
Event notification
Server/client
monitoring system
Version
1.23Z
Trend graph
Faceplate
Addition/change
Event notification can be received in the CC-Link IE
Controller Network.
The setting data are synchronized between
primary/secondary servers.
In the non-redundant server system, clients can
reconnect to a server without quitting the monitor
tool.
System alarms: "Server Initialization Error" and
"Server Communication Error" have been added in
the alarm list.
CSV files output by the automatic trend CSV file export
function can be displayed.
PFC_SF (Predictive functional control (simple first order
lag)), PFC_SS (Predictive functional control (simple
second order lag)), and PFC_INT (Predictive functional
control (integral process)) tag have been added to the
tag type.
PB (Push button operation) tag has been added to the
tag type.
Automatic trend CSV
file export
Trend group names can be included in names of CSV
files to be output.
SCADA interaction
Interaction function with JoyWatcherSuite has been
added.
Supported OS
Trend graph
Version
1.28E
Alarm list
Communication error
R
Windows 7 is supported.
Global variables and devices ca be displayed.
The item name of trend pen and comments can be
displayed simultaneously and the displayed items
can be switched.
Zoom in/out of the graph area can be operated with
a mouse.
Double-clicking the graph area allows to switch
display/hide the Y-axis scale can be switched by
double-clicking the graph area.
The following system alarm has been added.
Invalid GX Simulator Version
The number of retry times can be set when a read error
occurs.
Reference
Section 2.1.2
Appendix 1.2
Section 2.1.6
Section 7.3.1
Section 8.6.4
Section 7.2
Section 10.5
Section 10.5.12
Section 10.6
Section 10.6.2
Section 8.7
Section 9.7
PX Developer
Operating Manual
(JoyWatcherSuite
Interaction)
Section 2.2
Section 7.2
Section 8.5.3
Section 9.6
Section 9.8
Section 7.3.1
Section 8.5.1
Appendix 1.7
Monitor target project
setting screen
GX Simulator connection is supported.
Section 9.4
ActiveX control
The option that updates the ActiveX container
application screen when this control is in communication
with Monitor Tool is added.
Appendix 5.1
*1: The compatible version can be confirmed within About PX Developer.
For details, refer to "Section 6.3.1 (5) Display button of help menu".
B-74
B-74
APPENDIX
Compatible
1
version*
MELSOFT
Added/changed
function
Supported OS
Mode administration
Exiting Monitor Tool
Monitor toolbar
Version
1.31H
Alarm list
Event list
Server/client
monitoring system
Faceplate
Communication route
Supported OS
Event list
Monitor target project
setting screen
Version
1.42U
Server/client
monitoring system
Option setting
Modeless dialog box
Version
1.44W
Addition/change
Windows 7 (64-bit edition) is supported.
The operator authority is segmented to limit the monitoring
operation in accordance with the authority.
Log off/shut down of Windows 7 is supported.
The icons of user-created screen button and the character
strings of tooltip can be changed.
The detailed name of tag data item can be displayed as the
alarm content/event message.
Only checked items can be deleted when deleting the alarm
list/event list.
Enable/disable the time adjustment among OPSs can be
selected.
R
R
PVAL (Position-proportional output) and HTCL (Heating and
cooling output) have been added to the tag type.
GOT transparent connection via GOT200 series is
supported.
Windows 8 is supported.
"Previous Value" has been added to the display item.
"Previous Value" has been added to Print and Export to
CSV file.
GX Works2 format project is supported.
GX Simulator2 connection is supported.
Switching server/reconnection/no reconnection can be
selected while displaying monitor screens or setting screen
on the client.
"Exit monitor tool when windows logoff or shutdown." is
added to “General”.
Multiple dialog box displayed from faceplate can be
displayed.
R
Faceplate
ALM_64PT (64-points alarm) and MSG_64PT (64-points
message) have been added to the tag type.
User-created screen
Supported OS
Interaction with GT SoftGOT2000 is supported.
Windows 8.1 is supported.
Monitoring system
configuration with
Monitor Tool
Up to eighteen OPSs (up to sixteen clients) can be
connected.
R
Reference
Section 2.2
Chapter 4
Section 9.2
Section 5.2
Section 6.3.1
Section 7.3
Section 7.4
Section 8.6.6
Section 9.5
Section 10.5
Section 10.5.13
Section 10.5.14
Section 2.1.2
Section 2.2
Section 7.4
Section 9.4
Section 9.5
Section 9.17
Section 10.1 (3)
Section 10.7
Section 10.7.2
Section 10.8
Section 10.8.2
Chapter 11
Section 2.2
Section 2.1.6
Section 8.6.7
Section 9.5
*1: The compatible version can be confirmed within About PX Developer.
For details, refer to "Section 6.3.1 (5) Display button of help menu".
B-75
B-75
APPENDIX
MELSOFT
Appendix 8 Version Compatibility
The following shows the monitor tool version compatibility, version compatibility
between the programming tool and monitor tool, and version compatibility between GX
application and monitor tool.
Appendix 8.1 Monitor tool version compatibility
(1) Setting data file
When an access is made to the setting data file of old version (when the monitor
tool is started), the following dialog box appears.
Clicking "Yes" button converts the setting data file.
Clicking "No" button closes the dialog box without converting the setting data file.
(The monitor tool is not started.)
If the setting data file contains settings that are not supported by the version being used in
the following table, the following dialog box appears and the monitor tool is not started.
Version with which the setting
data files were saved
Setting contents
1.00A to 1.43V
-
1.44W or later
Version with which the setting
data files are used
1.00A to 1.43V
1.44W or later
: Supported,
: Not supported
OPS setting/communication setting Not use
for client 8 or later
Use
If the setting data file includes the data of unsupported PLC CPU, the following
dialog box appears and the monitor tool is not started.
B-76
B-76
APPENDIX
MELSOFT
POINT
When using the Version 1.04E or earlier monitor tool to communicate the setting
data file created using the PX Developer Version 1.06G or later, set the PLC
connection target in the monitor target project setting screen again.
For details of setting data file, refer to Section 2.3.
(2) Alarm list data file
When an alarm list data file saved with the monitor tool version 1.30G or earlier is
accessed with the monitor tool version 1.31H or later, the detailed names are not
displayed on the alarm content even though "Tag Data Item Display of Alarm" on
Option Setting (Alarm/Event) is set other than [Item Name].
(3) Event list data file
When an event list data file saved with the monitor tool version 1.30G or earlier is
accessed with the monitor tool version 1.31H or later, the detailed names are not
displayed on the event message, status, or set value even though "Tag Data
Item Display of Event" on Option Setting (Alarm/Event) is set other than [Item
Name].
(4) Server/client monitoring system
For the server/client monitoring system, clients and a connection server must
have the same product language, and clients must satisfy the conditions of
versions.
For details, refer to POINT in Section 2.2.
For the redundant server system, a primary server and secondary server must
have the same product language and product version.
(5) ActiveX Control
This section explains the compatibility between the old version monitor tool and
ActiveX control.
If the user graphic screen that uses the ActiveX control provided by the monitor
tool is started using the old version monitor tool, the screen may not operate
correctly.
When the method that does not exist in the ActiveX control provided by the old
version monitor tool is called, the created user graphic will not operate correctly.
(6) Automatic CSV file export
Tag comment field is not output to Automatic alarm CSV file and Automatic event
CSV file when using Monitor tool version 1.10L or earlier.
When upgrading from Version 1.10L or earlier to Version 1.14Q or later, tag
comment field may not be output to Automatic alarm CSV file and Automatic
event CSV file on the day when upload is carried out.
When upgrading the monitor tool from version 1.30G or earlier to version 1.31H
or later, the detailed names of alarm content on the automatic alarm CSV files
and event message, status, and set value on the automatic event CSV files may
not output within the day.
B-77
B-77
APPENDIX
MELSOFT
Appendix 8.2 Version compatibility between monitor tool and programming tool
(1) Assignment information database file
The following table shows the version compatibility between the monitor tool and
the assignment information database file compiled using the programming tool.
Assignment information database file version compatibility
Monitor tool
version
Programming tool version used to compile
1.02C to
1.04E
1.05F to
1.09K
1.10L to
1.12N
1.13P to
1.18U
1.20W
1.23Z
1.28E to
1.34L
1.42U or later
1.02C to 1.03D
1.04E
1.05F to 1.09K
*1
*1
1.10L to 1.12N
3
1.13P to 1.18U
*
1.20W
*3
1.23Z
*3
1.28E to 1.34L
3
*
1.42U or later
*3
*1 *4
*1 *4
*1 *4 *5
*1 *4 *5 *6
*2 *4
*2 *4
*2 *4 *5
*2 *4 *5 *6
2 4
2 4
* *
2 4 5
* * *
*2 *4 *5 *6
*2
*2 *5
*2 *5 *6
*5
*5 *6
* *
*6
: Usable,
: Usable with restrictions,
: Not compatible
*1: Can be used if tags with tag type added in PX Developer Version 1.10L
or later are not set to assignment information database files.
The following shows the tag types added for each version.
Version
Tag type
1.10L
2PIDH
1.11M
PGS2
1.20W
SWM
1.22Y
PFC_SF, PFC_SS, PFC_INT, PB
1.31H
PVAL, HTCL
1.42U
ALM_64PT, MSG_64PT
*2: Cannot be used only tag type which cannot be recognized in monitor
tool of the versions concerned. For tag type added in the versions, refer
to *1 shown in the above table.
*3: Auto tuning by the Limit Cycle method cannot be used.
*4: Cannot be used if the start of file register (ZR) has been changed from
the default in the <<System Resource>> tab in the project parameter
setting of the programming tool.
*5: Can be used if the device variables added to Version 1.28E is not set to
assignment information database files.
*6: Cannot be used if GX project type is GX Works2 project.
(2) Event notification
When the Version 1.04E or earlier monitor tool is used to monitor the PLC CPU
that includes projects compiled with the Version 1.06G or later programming tool,
the event notification cannot be received.
To receive the event notification, use the Version 1.06G or later monitor tool.
B-78
B-78
APPENDIX
MELSOFT
Appendix 8.3 Combined use of monitor tool and GX application
The following table shows the combined use of the monitor tool and GX application.
Monitor tool version
Restrictions on monitor tool startup
1.02C to 1.04E
GX Developer Version 7.20W or later must be installed.
1.06G to 1.34L
GX Developer is not required.*
1.42U or later
Installation of GX Works2 or GX Developer is not required. *
1
2
*1: GX Developer must be installed only when displaying CPU error help.
The help details of the installed GX Developer will be displayed.
*2: GX Works2 or GX Developer must be installed only when displaying CPU
error help.
The help details of the installed GX Works2 or GX Developer will be
displayed.
B-79
B-79
APPENDIX
MELSOFT
MEMO
B-80
B-80
INDEX
Ind
[2]
2PID (2-degree-of-freedom PID control)
................................................................ 10-31,35
2PIDH (2-degree-of-freedom Advanced PID
control) .................................................... 10-31,37
[A]
Acquiring the server setting data .................. 8-18
ActiveX control .............................................. B-40
Admin.............................................................. 4- 4
Alarm
Alarm area color (No alarm)................. 9-60,76
Alarm/Event display area .............. 6- 4,9-68,70
Alarm/Event display on 2nd line of monitor
toolbar ........................................................ 9-55
Automatic CSV file export ......................... 8-29
Highlighted display while alarms occur
........................................................... 7-22,9-56
Major alarm color .................................. 9-53,76
Minor alarm color .................................. 9-53,76
Alarm display area ................................... 10- 2, 5
Alarm list ........................................................ 7-15
Alarm list screen display button .................... 6-10
Alarm setting.......................................... 7-17,9-34
Alarm tag ..................................................... 10-71
ALM (alarm)............................................ 10-31,72
ALM_64PT (64-points alarm) ................ 10-31,73
Application ..................................................... 9-37
Assignment information database ........9-14,B-21
AT reflection target ........................................ 7-66
Authorities ............................................... 4- 1,9-12
AUTO ........................................................... 10-12
Auto tuning .................................................... 7-54
Step Response method.....................A-22,7-55
Limit Cycle method ............................A-22,7-57
Automatic CSV file deletion .......................... 8-33
Automatic CSV file export ............................. 8-21
Alarm .......................................................... 8-29
Event .......................................................... 8-31
Trend.......................................................... 8-24
[B]
Background color
Faceplate ................................................... 9-60
Lockout tag ................................................ 9-50
Status operation button, indicator ............. 9-43
C-1
Trend graph ................................................ 9-62
Backup mode ................................................ A-22
Batch count operation ..................................10-27
BC (batch counter) ..................................10-31,55
Beep sound time interval ....................... 8- 1,9-58
Bit write .................................................. 7-29,B-15
Bit write in radio button format .............. 7-29,B-15
BPI (blend PI control)..............................10-31,35
Broadcasting communication .................... B- 2, 4
Button background color, text color..........9-60,76
Buzzer type ...............................................9-58,77
[C]
C24 ................................................................ A-21
CASCADE ....................................................10-12
CASCADE DIRECT .....................................10-12
CC-Link board ............................................... A-21
CC-Link connection ........................................ 2- 2
Change Background/Text color dialog box
...................................................................9-43,49
Change current value .................................... 7-53
Change mode button ..................................... 6-13
Close ....................................................... 6- 2,9- 2
Collected tag list ............................................. 7-64
Color selection dialog box .............................. 9- 5
Combined use of monitor tool and GX Developer
....................................................................... B-79
Communication among channel.................... B- 8
Communication error .................................... B-18
Communication route...................................... 2- 1
COMPLETE .................................................10-26
COMPUTER MV (CMV) ..............................10-12
COMPUTER SV (CSV) ...............................10-12
Confirm check
Alarm list ..................................................... 7-23
Event list ..................................................... 7-36
Confirm collectively
Alarm list ..................................................... 7-24
Event list ..................................................... 7-37
Collection period for each communication type
........................................................................ 8-12
Command button operation .........................10-30
Communication with Redundant CPU ......... B-25
Connecting to server...................................... 8-18
Connection cables for CPU serial/USB connection
........................................................................ 2-11
Control mode change .............................10-12,32
Control panel .......................................... 7- 1,9-65
Control panel screen display button .............. 6-10
C-1
Control panel setting ................................ 9-30,65
Control system .............................................. A-23
Control vessel ................................................ B-40
Copy ............................................................... 9- 2
Copying monitoring environment of monitor tool to
other computers ............................................. 9- 8
Count value setting ................................ 10-26,32
Count/Timer operation ........................... 10-28,32
COUNT1 (counter1) ............................... 10-31,67
COUNT2 (counter2) ............................... 10-31,67
CPU module .................................................. A-20
Current value collection ................................ B-13
Cut .................................................................. 9- 2
CYCLIC ....................................................... 10-15
[D]
Date/time display area ................................... 6- 4
DDC ........................................................A-21,1- 1
Debug mode .................................................. A-22
Delete
Data of cell in setting .................................. 9- 4
Delete all
Event list ............................................. 3- 3,7-36
Delete recovered alarms ............................... 7-24
Details button ............................................... 10- 2
Dialog box
Change Background/Text color ........... 9-43,49
Color selection ............................................ 9- 5
File selection ............................................... 9- 5
GX Simulator connection setting .............. 9-20
Select lockout tag ............................. 9-50,10- 7
DIM ................................................. 7-29,10-33,64
Disk free space.............................................. 8-34
Disk free space error ..................................... 7-18
Display
Tool bar ...................................................... B-31
Monitor window button .............................. 6-10
Pop-up faceplate display ........................... 7-44
Pop-up tuning display................................ 7-46
Display CSV file...................................... 3- 3,7-13
Display PLC communication status ............... 8- 7
Display help menu button .............................. 6- 8
Display pop-up faceplate
From alarm list .................................... 3- 3,7-15
From monitor toolbar alarm display ........... 6- 7
From pop-up tuning ................................... 7-42
Display pop-up tuning screen
From control panel .............................. 3- 3,7- 2
From pop-up faceplate .............................. 7-45
C-2
Display redundant system status .................. 8-10
Display scale top/bottom limit (PV graph) ..... 9-47
Displayed character string ............................. 9-48
Displaying the server/client communication status
........................................................................ 8-20
Division number ............................................. 9-47
DOM ........................................................10-33,64
Duplicated project name ................................ 9-14
Duplicated tag name ...................................... 9-14
DV.................................................................. A-22
[E]
Edit .................................................................. 9- 2
Engineer mode....................................... 4- 1,9-12
Error
Communication open ................................ B-18
Disk free space .......................................... 7-18
Exception .................................................... 7-18
File .............................................................. 7-18
Memory....................................................... 7-18
Message ............................................... B-46,55
Object ................................................... B-48,57
PLC CPU ........................................... 7-18,B-20
PLC CPU stopping ............................ 7-18,B-20
Ethernet board ...................................... A-21,2-14
Ethernet connection ........................................ 2- 2
Ethernet module..................................... A-21,2- 4
Event list ......................................................... 7-27
Event list screen display button ..................... 6-10
Event notification........................................ B- 1, 4
Event notification UDP port No.(HEX) .. 9-57,B- 8
Event setting .................................................. 9-35
Exception error ............................................... 7-18
Exit................................................................... 5- 7
Exit button ...................................................... 6-13
Export to CSV file
Alarm list ............................................. 3- 3,7-26
Event list ............................................. 3- 3,7-39
Pop-up tuning ..................................... 3- 4,7-65
Setting data ......................................... 3- 5,9- 7
Trend Graph ....................................... 3- 3,7-12
[F]
Faceplate.............................................. A-22,10- 1
Faceplate control .......................................... B-54
Faceplate display button ................................. 6- 6
Faceplate display pattern setting................... 9-43
Faceplate display pattern write...................... 7-29
Faceplate display scale setting ..................... 9-46
C-2
Ind
Faceplate MV characters setting .................. 9-48
FB ...........................................................A-21,1- 1
FBD .........................................................A-21,1- 1
File .......................................................... 2-21,9- 2
File error ........................................................ 7-18
File selection dialog box ................................. 9- 5
Find ................................................................. 8- 4
Find button..................................................... 6-13
Find with group names of the control panel .. 8- 5
Find with group names of the trend graph .... 8- 6
Find with tag names ............................... 7-42,8- 5
Frame color (No lockout tag) ................... 9-60,76
Full tag read................................................... B-15
[G]
G4 module ..............................................A-21,2- 2
Global variable .............................................. A-22
Graph 1 to 8 colors................................... 9-62,76
Gridline .......................................................... 9-62
Gridline color ............................................ 9-62,76
Gridline interval setting
Pop-up tuning ..................................... 3- 4,7-63
Trend graph ........................................ 3- 3,7-10
Group .......................................................... 7- 2, 9
Group name ............................................. 9-30,33
GX application ............................................... A-20
GX Developer ........................... A-20,2-18,19,5- 1
GX Simulator ........................................A-20, 2-20
GX Simulator2 ............................................... A-20
GX Works2 .................................................... A-20
[H]
High-speed current value collection ............. B-14
High-speed tag data collection ..................... B-15
HOLD (hold button) ..................................... 10-27
HOLD (motion type) .................................... 10-15
HTCL (heating and cooling output) ....... 10-31,61
[I]
I/O mode change.................................... 10-10,32
I/O mode display area .................................. 10- 2
IPD (I-PD control) ................................... 10-31,35
[L]
Latest value display........................................ 7- 9
Limit Cycle method................................A-22,7-57
List
Alarm .......................................................... 7-15
Error ...................................................... B-46,55
C-3
Event........................................................... 7-27
Function ....................................................... 3- 2
Menu ............................................................ 9- 2
System alarm ............................................. 7-18
Lock mode....................................................... 4- 1
Lockout tag.................................................... 10- 7
Lockout tag display area ...........................10- 2, 7
Loop tag .......................................................10-33
Low-speed current value collection .............. B-14
Low-speed tag data collection ...................... B-15
[M]
Major alarm .................................................... 9-58
MANUAL ......................................................10-12
MELSECNET/10 .................................... A-21,2- 1
MELSECNET/10 board ........................ A-21,2-13
MELSECNET/H ..................................... A-21,2- 1
MELSECNET/H board .......................... A-21,2-13
MELSECNET/H module ........................ A-21,2- 1
MELSECNET/H remote .................................. 2- 2
MELSOFT application program...................... 5- 1
Memory error.................................................. 7-18
Menu ............................................................... 9- 2
Message contents .......................................... 9-35
Message history ............................................. 7-31
Message tag.................................................10-74
Minor alarm .................................................... 9-58
Mode ............................................................... 4- 1
Mode change ......................................... 4- 2,9-64
Modeless dialog ............................................ A-23
MONI (monitor) .......................................10-31,48
Monitor function .............................................. 7- 1
Monitor target project setting ......................... 9-13
Monitor Tool .................................................. A-20
Monitor toolbar ................................................ 6- 4
Monitor Tool version compatibility ................ B-76
Monitor variable setting.................................. 9-27
Monitor window font ..................................9-53,73
MOUT (manual output) ...........................10-31,47
MSG (message) ......................................10-31,76
MSG (64-points message) .....................10-31,77
Multiple CPU system ..................................... 2-18
Multi-window mode ............................ 1- 4,6- 1,14
MV ................................................................. A-22
MV status .....................................................10-38
MV value setting .....................................10-24,32
MVAL1 (ON/OFF control1) .....................10-31,65
MVAL2 (ON/OFF control2) .....................10-31,65
MWM (manual output with monitor) .......10-31,51
C-3
[N]
Network board ............................................... 2-13
Network module ............................................ A-21
NORMAL ..................................................... 10-10
NREV (Motor Irreversible Control)......... 10-31,65
[O]
One-shot tag read ......................................... B-15
ONF2 (2 position ON/OFF control)
................................................................ 10-31,40
ONF3 (3 position ON/OFF control)
................................................................ 10-31,40
Open setting ................................................... B- 8
Operating environment ................................. 2-19
Operating Manual........................................... 6- 8
Operation display types ............................... 10- 8
Operation history ........................................... 7-29
Operation mode ............................................ A-22
Operation mode change ............................... A-22
Operator mode ....................................... 4- 1,9-12
Option setting ................................................ 9-51
(Alarm/Event) ............................................. 9-56
(Faceplate) ................................................. 9-59
(General) .................................................... 9-53
(Server/Client) ........................................... 9-54
(Trend graph) ............................................. 9-62
OPS setting ................................................... 9-21
OVERRIDE.................................................. 10-10
[P]
Password ............................................ 4- 2, 3,9-12
PB (Push button operation) ................... 10-31,69
PC CPU module ....................................A-21,2-10
PFC_INT (Predictive functional control (integral
process)) ................................................. 10-31,57
PFC_SF (Predictive functional control (simple first
order lag)) ............................................... 10-31,57
PFC_SS (Predictive functional control (simple
second order lag)) .................................. 10-31,57
PGS (Program Setting Device).............. 10-31,42
PID (PID control) .................................... 10-31,35
PID control ..................................................... A-22
PIDP (Position type PID control) ........... 10-31,35
PLC CPU error ....................................... 6- 8,7-18
PLC CPU stopping error .......................7-18,B-20
PLC status check .......................................... B-20
PLC transfer setup ................................... 9-17,78
Pop-up faceplate ........................................... 7-42
Pop-up tuning ................................................ 7-45
C-4
Pop-up window ..........................................6- 1,16
PRE-COMPLETE ........................................10-26
Print
Event list ............................................. 3- 3,7-38
Alarm list ............................................. 3- 3,7-25
Entire displayed desktop ............................. 8- 2
Print screen ..................................................... 8- 2
Print screen button ......................................... 6-12
Printer ............................................... 2-14,9-53,80
Process CPU ................................................ A-20
Process data collection ................................. B-17
Product information ......................................... 6- 8
Programming Tool ................................. A-20,1- 1
Project ID code ............................................. B-21
Project ID code inconsistency ....................... 7-18
PSUM (Pulse Integrator) ........................10-31,55
PV .................................................................. A-22
PV graph display direction ...........................10-19
PV high high/low low limit .............................. 9-60
PV high/low limit............................................. 9-60
PV value bar positive direction color ............. 9-60
PV value display ..........................................10-19
PVAL (position-proportional output) .......10-31,59
PX Developer ......................................... A-20,1- 1
[R]
R (Ratio control) ....................................10-31,35
Redundant CPU ............................................ A-20
Redundant parameter ................................... A-23
Redundant system ........................................ A-23
Refreshing the monitoring data .................. B-28
in clients ..................................................... B-29
in a secondary server ................................ B-28
RESET .........................................................10-28
RESET/START .......................................10-27,28
RETURN ......................................................10-15
Return check ......................................... 9-53,B-19
REV (motor reversible control) ...............10-31,65
RS-232 ............................................................ 2- 1
RUN .........................................................10-27,28
[S]
Sampling period ............................................. 9-33
Save the setting data ...................................... 9- 6
Screen alignment ............................................ 8- 3
SEL (loop selector) .................................10-31,53
Select display of alarm................................... 7-23
Select lockout tag dialog box ............... 9-50,10- 7
C-4
Separate mode .............................................. A-22
Serial ......................................................... 9-17,18
Setdata .......................................................... 2-24
Setting
Apply ........................................................... 9- 6
Cancel ......................................................... 9- 6
Data file ...................................................... 2-24
Export data to CSV file ............................... 9- 7
Save the setting data.................................. 9- 6
Setting data in the secondary server/clients
....................................................................... 8-14
Setting of display color .................................. 9-74
Setting window ............................................... 9- 1
Setting window button ................................... 6-13
Setting window font .................................. 9-51,73
Server/client monitoring system ........... 2-15,8-14
SIMULATION .............................................. 10-10
Simulator ....................................................... A-20
Simulator connection .................................... 9-79
Single-window mode ................................. 6- 1,14
SPA ............................................................... 10- 5
SPI (sample PI control) .......................... 10-31,35
ST .................................................................. A-21
Standalone configuration .............................. 2-18
Standby system ............................................. A-23
Start
as Client ...................................................... 5- 4
as Server .................................................... 5- 3
as Standalone............................................. 5- 2
Hiding status .............................................. B-30
Starting the Monitor Tool by the Mode That
Matches the Authority of the Specified User
................................................................... B-32
usual status................................................. 5- 1
Starting screen ............................................... 5- 1
Status bar ....................................................... 9- 2
Status change history ................................... 7-30
Status operation ..................................... 10-29,32
Status tag .................................................... 10-64
Step Response method ........................A-22,7-55
STOP ........................................................... 10-28
Stop buzzer .................................................... 8- 1
Stop buzzer button ........................................ 6-12
STOP/RESET ............................................. 10-27
SV .................................................................. A-22
SV limit excess setting .................................. 9-60
SV (Current) pointer .................................... 10-23
SV (Target) pointer...................................... 10-23
SV value setting ..................................... 10-22,32
C-5
SV/MV limit value bar color ........................... 9-60
SV/MV pointer color ....................................... 9-60
Switching server............................................. 8-17
Switching groups to be displayed ............... 7- 2, 9
SWM (manual setter with monitor) .........10-31,49
Sysdata .......................................................... 2-24
System A ....................................................... A-22
System B ....................................................... A-22
System alarm ................................................. 7-17
System alarm details dialog box ................... 7-15
[T]
Tab .............................................................. 7- 2, 9
Tag .................................................. A-22,10- 1,31
Tag data .................................. A-22,10- 1,B- 1,13
Tag data access control ............................... B-41
Tag data collection ........................................ B-15
Tag data item ............................... A-22,7- 3,10- 1
Tag FB.................................................... A-22,1- 2
Tag monitor .................................................... 7-47
TAG STOP (TSTP) ......................................10-10
Tag type
Alarm tag .............................................10-31,71
Loop tag...............................................10-31,33
Message tag ........................................10-31,74
Status tag ............................................10-31,64
Task tray icon ................................................. 6-17
Text box........................................................... 9- 4
Text color...................................................9-59,76
Faceplate .................................................... 9-59
Lockout tag ................................................. 9-50
Status operation button, indicator .............. 9-43
TIMER1 (timer1) .....................................10-31,67
TIMER2 (timer2) .....................................10-31,67
Title bar ........................................................... 6- 2
Toolbar ............................................................ 6- 1
Tracking transfer function ............................. A-23
Trend binary data file ............................. 2-24,7- 8
Trend graph..................................... 3- 3,7- 3,9-62
Trend graph screen display button................ 6-10
Trend setting .................................................. 9-32
Trouble shooting ........................................... 12- 1
Tuning trend ........................................... 3- 4,7-51
Tuning trend collection instruction ................. 7-52
Type
Alarm .......................................................... 7-17
communication ........................................... B- 1
Event........................................................... 7-29
Operation display type .............................. 10- 8
C-5
tag ............................................................ 10-31
[U]
Unit setting..................................................... 9-42
USB .......................................................... 9-17,18
User account control ..................... 2-23,5- 5,B-60
User authority setting .................................... 9-10
User name ......................................... 4- 2, 3, 9-12
User setting ........................................... 4- 3, 9-12
User-created screen...................................... 7-40
User-created screen setting.......................... 9-36
[V]
Version compatibility ..................................... B-76
Version compatibility between monitor tool and
programming tool .......................................... B-78
[W]
Window
Alarm list .................................................... 7-15
Cascade ................................................. 6- 4,12
Change size ................................................ 6- 3
Close ........................................................... 6- 2
Control panel .............................................. 7- 1
Event list .................................................... 7-27
Maximize, Minimize ........................... 6- 2, 3,15
Monitor ....................................................... 6-14
Pop-up ....................................................... 6-16
Pop-up faceplate ....................................... 7-42
Pop-up tuning ............................................ 7-45
Tile ......................................................... 6- 4,12
Trend graph ................................................ 7- 3
User-created screen .................................. 7-40
Window mode................................... 6-14,9-53,81
Word write .............................................7-29,B-16
Write tag data ................................................ B-16
[Y]
Y-axis scale setting
Pop-up tuning ..................................... 3- 4,7-63
Trend graph ........................................ 3- 3,7-11
Y-axis scale top, bottom limit ........................ 9-33
C-6
C-6
Microsoft, Windows, Windows NT and Visual Basic are trademarks or registered trademarks of Microsoft
Corporation in the United States and other countries.
Adobe and Acrobat are trademarks or registered trademarks of Adobe Systems Incorporation.
Pentium and Celeron are trademarks or registered trademarks of Intel Corporation in the United States and
other countries.
Ethernet is a trademark or a registered trademark of Xerox Corporation.
All other company names and product names used in this manual are trademarks or registered trademarks of
respective companies.
SH(NA)-080370E-M(1507)KWIX
MODEL:SW1D5C-FBDQ-O-MON-E
MODEL CODE: 13JU39
HEAD OFFICE : TOKYO BUILDING, 2-7-3 MARUNOUCHI, CHIYODA-KU, TOKYO 100-8310, JAPAN
NAGOYA WORKS : 1-14 , YADA-MINAMI 5-CHOME , HIGASHI-KU, NAGOYA , JAPAN
When exported from Japan, this manual does not require application to the
Ministry of Economy, Trade and Industry for service transaction permission.
Specifications subject to change without notice.