1
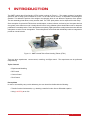
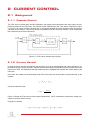
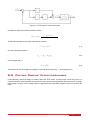
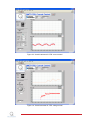
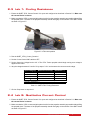
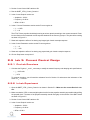
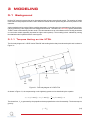
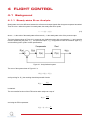
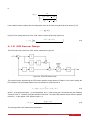
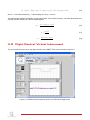
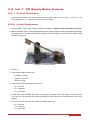
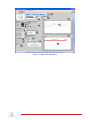
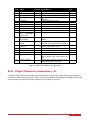
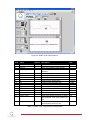
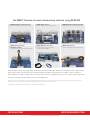
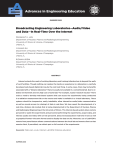
© 2011 Quanser Inc., All rights reserved. Quanser Inc. 119 Spy Court Markham, Ontario L3R 5H6 Canada [email protected] Phone: 1-905-940-3575 Fax: 1-905-940-3576 Printed in Markham, Ontario. For more information on the solutions Quanser Inc. offers, please visit the web site at: http://www.quanser.com This document and the software described in it are provided subject to a license agreement. Neither the software nor this document may be used or copied except as specified under the terms of that license agreement. All rights are reserved and no part may be reproduced, stored in a retrieval system or transmitted in any form or by any means, electronic, mechanical, photocopying, recording, or otherwise, without the prior written permission of Quanser Inc. Acknowledgements Quanser, Inc. would like to thank the following contributors: Dr. Hakan Gurocak, Washington State University Vancouver, USA, for his help to include embedded outcomes assessment, and Dr. K. J. Åström, Lund University, Lund, Sweden for his immense contributions to the curriculum content. QNET VTOL Workbook - Student Version 2 Contents 1 Introduction 2 Current Control 2.1 Background 2.2 Current Control Virtual Instrument 2.3 Lab 1: Finding Resistance 2.4 Lab 2: Qualitative Current Control 2.5 Lab 3: Current Control Design 2.6 Results 5 5 6 8 8 9 10 3 Modeling 3.1 Background 3.2 Modeling Virtual Instrument 3.3 Lab 1: Measure the Equilibrium Current 3.4 Lab 2: Find Natural Frequency 3.5 Lab 3: Model Validation 3.6 Lab 4: Using the System Identification Tool 3.7 Results 11 11 13 Flight Control 4.1 Background 4.2 Flight Control Virtual Instrument 4.3 Lab 1: PD Steady-State Analysis 4.4 Lab 2: PID Steady-State Error Analysis 4.5 Lab 3: PID Control Design 4.6 Results 17 17 19 20 5 System Requirements 5.1 Overview of Files 5.2 Current Control Laboratory VI 5.3 Modeling Laboratory VI 5.4 Flight Control Laboratory VI 24 24 24 26 28 6 Lab Report 6.1 Template for Content (Current Control) 6.2 Template for Content (Modeling) 6.3 Template for Content (Flight Control) 6.4 Tips for Report Format 30 4 QNET VTOL Workbook - Student Version 4 13 14 15 15 16 22 22 23 31 32 33 34 v 1.0 1 INTRODUCTION The QNET vertical take-off and landing (VTOL) trainer is shown in Figure 1.1. The system consists of a variablespeed fan with a safety guard mounted on an arm. At the other end of the arm, an adjustable counterweight is attached. This allows the position of the weight to be changed, which in turn affects the dynamics of the system. The arm assembly pivots about a rotary encoder shaft. The VTOL pitch position can be acquired from this setup. Some examples of real-world VTOL devices are helicopters, rockets, balloons, and harrier jets. Aerospace devices are typically more difficult to model. Usually this will involve using software system identification tools to determine parameters or actual dynamics. Due to their inherent complexity, flight systems are usually broken down into different subsystems to make it more manageable. These subsystems can be dealt with individually and then integrated to provide an overall solution. Figure 1.1: QNET Vertical Take-off and Landing Trainer (VTOL) There are three experiments: current control, modeling, and flight control. The experiments can be performed independently. Topics Covered • Experimental Modelling • PID Control • Current Control • Pitch Control Prerequisites In order to successfully carry out this laboratory, the user should be familiar with the following: • Transfer function fundamentals, e.g. obtaining a transfer function from a differential equation. • Using LabVIEWr to run VIs. QNET VTOL Workbook - Student Version 4 2 CURRENT CONTROL 2.1 Background 2.1.1 Cascade Control The VTOL device is broken down into two subsystems: the voltage-current dynamics of the motor and the currentposition dynamics of the VTOL body. The cascade control implemented in the VTOL trainer is depicted in Figure 2.1, below. A PI current controller, the inner loop, is designed to regulate the current inside the motor according to a desired current reference. This current reference is generated from the outer-loop controller: a PID compensator that controls the pitch of the VTOL trainer. Figure 2.1: VTOL trainer cascade control system 2.1.2 Current Control In cases where the actuator has relatively slow dynamics, such as an electromagnet with a large inductance, it is favorable to design a current controller. Typically a proportional-integral compensator is used to regulate the current flowing in the load. This basically makes the actuator dynamics negligible and simplifies the control design of the outer-loop. In this case, the voltage-current relationship of the VTOL trainer motor can be described, in the time-domain, by the equation ˙ vm = Rm im + Lm im and by the transfer function Im (s) = Vm (s) Rm + Lm s Figure 2.2 shows the VTOL current control system implemented. The PI compensator computes the voltage necessary to reach the desired current. Using the PI controller ∫ vm (t) = kp,c (iref (t) − im (t)) + ki,c QNET VTOL Workbook - Student Version iref (t) − im (t) dt v 1.0 Figure 2.2: VTOL motor PI current control loop we obtain the following closed-loop transfer function GIref ,Im (s) = s2 Lm kp,c s + ki,c + (kp,c + Rm )s + ki,c To match the standard second-order characteristic equation s2 + 2ζωn s + ωn2 (2.1) kp,c = −Rm + 2ζωn Lm (2.2) ki,c = ωn2 Lm (2.3) we need a proportional gain of and an integral gain of These gains can then be designed according to a desired natural frequency, ωn , and damping ratio, ζ. 2.2 Current Control Virtual Instrument In this laboratory, open-loop voltage or current is fed to the VTOL trainer. In current mode, shown in Figure 2.3, a current-controller is used to regulate the current in the motor and the user chooses the reference current. In voltage mode, shown in Figure 2.4, the voltage chosen is applied directly to the QNET amplifier, which in turn drives the motor. QNET VTOL Workbook - Student Version 6 Figure 2.3: Virtual Instrument for VTOL current control Figure 2.4: Virtual Instrument for VTOL voltage control QNET VTOL Workbook - Student Version v 1.0 2.3 Lab 1: Finding Resistance 1. Ensure the QNET VTOL Current Control VI is open and configured as described in Section 5.2. Make sure the correct Device is chosen. 2. Make sure that the VTOL counter-weight is placed as far from the propeller assembly as possible without lifting the propeller itself. The base of the propeller assembly should rest lightly on the surface of the QNET board as shown in Figure 2.5. Figure 2.5: VTOL initial position 3. Run the QNET_VTOL_Current_Control.vi. 4. Set the Current Control ON? switch to OFF. 5. Set the Open-loop Voltage knob to 4.0 V. The VTOL Trainer propeller should begin turning as a voltage is applied to the motor. 6. Vary the voltage between 4.0 and 8.0 V by steps of 1.0 V and measure the current at each voltage. Input Voltage (V) Measured Current (A) 4 5 6 7 8 Average Resistance: Rm,avg Resistance (ω) Table 2.1: QNET VTOL Finding Resistance 7. Click on Stop button to stop the VI. 2.4 Lab 2: Qualitative Current Control 1. Ensure the QNET VTOL Current Control VI is open and configured as described in Section 5.2. Make sure the correct Device is chosen. 2. Make sure that the VTOL counter-weight is placed as far from the propeller assembly as possible without lifting the propeller itself. The base of the propeller assembly should rest lightly on the surface of the QNET board as shown in Figure 2.5. QNET VTOL Workbook - Student Version 8 3. Set the Current Control ON? switch to ON. 4. Run the QNET_VTOL_Current_Control.vi. 5. In the Current Setpoint section set: • Amplitude = 0.20 A • Frequency = 0.40 Hz • Offset = 0.90 A 6. In the 6. Control Parameters section set the PI current gains to: • kp,c = 0.250 • ki,c = 10 The VTOL Trainer propeller should begin turning at various speeds according to the current command. Examine the reference and measured current response obtained in the Current (A) scope. They should be tracking as shown in Figure 2.3. 7. Show and explain the effect of not having any integral gain. Attach a sample response. 8. In the Control Parameters section set the PI current gains to: • kp , c = 0 • ki , c = 100 9. Show and explain the effect of not having any proportional gain. Attach a sample response. 10. Click on Stop button to stop the VI. 2.5 Lab 3: Current Control Design 2.5.1 Pre-Lab Exercises 1. Calculate the PI gains, kp and ki , necessary to satisfy the natural frequency and damping ratio specifications: • ωn = 42.5 rad/s • ζ = 0.70 To compute the gains, you will need the resistance found in Section 2.3 and assume the inductance of the motor is Lm = 53.8 mH. 2.5.2 In-Lab Experiment 1. Open the QNET_VTOL_Current_Control.vi as shown in Section 5.2. Make sure the correct Device is chosen. 2. Make sure that the VTOL counter-weight is placed as far from the propeller assembly as possible without lifting the propeller itself. The base of the propeller assembly should rest lightly on the surface of the QNET board as shown in Figure 2.5. 3. Set the Current Control ON? switch to ON. 4. In the Current Setpoint section set: • Amplitude = 0.20 A • Frequency = 0.40 Hz • Offset = 0.90 A QNET VTOL Workbook - Student Version v 1.0 5. In the Current Control Parameters section, set the PI current gains to those you found in Section 2.5.1. 6. Run the VI. The VTOL Trainer propeller should begin turning at various speeds according to the current command. Examine the reference and measured current response obtained in the Current (A) scope. They should be tracking. 7. Include a plot showing the current response with your designed PI gains. Compare the response to the qualitative responses in Section 2.4. 8. Click on Stop button to stop the VI. 2.6 Results Parameter Rm Lm ζ ωn kp,c ki,c Value Units ω mH rad/s V/A V/(A s) Table 2.2: PI current control design summary QNET VTOL Workbook - Student Version 10 3 MODELING 3.1 Background Unlike a DC motor, this system has to be characterized with at least a second-order model. The equation of motion is derived from first principles and then used to obtain the transfer function representing the current to position VTOL dynamics. Various methods can be used to find the modeling parameters. In the laboratory, the parameters are first found manually by performing a few experiments and taking measurements. Thereafter, the LabVIEWr System Identification Toolkit is used to automatically find the model. This demonstrates how to use software tools to identify parameters or even entire models (especially important for higher-order systems). The modeling is then validated by running the obtained model in parallel with the actual system. 3.1.1 Torques Acting on the VTOL The free-body diagram of a 1-DOF Vertical Take-Off and Landing device that pivots about the pitch axis is shown in Figure 3.1. Figure 3.1: Free-body diagram of 1-DOF VTOL As shown in Figure 3.1, the torques acting on the rigid body system can be described by the equation τt + m2 g l2 cos θ(t) − m1 g l1 cos θ(t) − 1 mh g Lh cos θ(t) = 0 2 (3.1) The thrust force, Ft , is generated by the propeller and acts perpendicular to the fan assembly. The thrust torque is given by τt = Ft l1 QNET VTOL Workbook - Student Version (3.2) v 1.0 where l1 is the length between the pivot and center of the propeller, as depicted in Figure 3.1. In terms of the current, the thrust torque equals (3.3) τt = Kt Im where Kt is the thrust current-torque constant. With respect to current, the torque equation becomes Kt Im + m2 g l2 cos θ(t) − m1 g l1 cos θ(t) − 1 mh g Lh cos θ(t) = 0 2 (3.4) The torque generated the propeller and the gravitational torque acting of the counter-weight act in the same direction and oppose the gravitational torques on the helicopter body and propeller assembly. We define the VTOL trainer as being in equilibrium when the thrust is adjusted until the VTOL is horizontal and parallel to the ground. At equilibrium, the torques acting on the system are described by the equation Kt Ie q + m2 g l2 − m1 g l1 − 1 mh g L h = 0 2 (3.5) where Ie q is the current required to reach equilibrium. 3.1.2 Equation of Motion The angular motions of the VTOL trainer with respect to a thrust torque, τt , can be expressed by the equation (3.6) J θ̈ + B θ̇ + K θ = τt where θ is the pitch angle, J is the equivalent moment of inertia acting about the pitch axis, B is the viscous damping, and K is the stiffness. With respect to current, this becomes (3.7) J θ̈ + B θ̇ + K θ = Kt Im As opposed to finding the moment of inertia by integrating over a continuous body, when finding the moment of inertia of a composite body with n point masses its easiest to use the formula J= n ∑ mi ri2 (3.8) i=1 3.1.3 Process Transfer Function Model The transfer function representing the current to position dynamics of the VTOL trainer is P (s) = Kt ) B K J s2 + s + J J ( (3.9) This is obtained by taking the Laplace transform of Equation 3.6 and solving for Ω(s)/Im (s). Notice that the denominator QNET VTOL Workbook - Student Version 12 s2 + B K s+ J J matches the characteristic second-order transfer function Equation 2.1. By determining the natural frequency of the system, one can find the stiffness using K = ωn2 J (3.10) 3.2 Modeling Virtual Instrument The virtual instrument used to validate a transfer function model on the QNET VTOL trainer is shown in Figure 3.2. This VI can also be used to find the VTOL device transfer function using the System Identification Toolkit. Figure 3.2: LabVIEW virtual instrument used to find and validate a model for the QNET VTOL trainer 3.3 Lab 1: Measure the Equilibrium Current 1. Ensure the QNET VTOL Current Control VI is open and configured as described in Section 5.2. Make sure the correct Device is chosen. 2. Make sure that the VTOL counter-weight is placed as far from the propeller assembly as possible without lifting the propeller itself. The base of the propeller assembly should rest lightly on the surface of the QNET board as shown in Figure 3.3. QNET VTOL Workbook - Student Version v 1.0 Figure 3.3: VTOL initial position 3. Set the Current Control ON? switch to ON. 4. Run the VI. 5. In the Current Control Parameters section, set the PI current gains found in the first part of Section 2.5. 6. In the Current Setpoint section set: • Amplitude = 0.00 A • Frequency = 0.40 Hz • Offset = 1.00 A 7. Gradually increase the offset current until the VTOL Trainer is horizontal. 8. The pitch should read 0 degrees when the VTOL Trainer is horizontal. You may need to adjust the pitch offset by varying the VTOL Offset control. By default this is set to 25.0 degrees. 9. The current required to make the VTOL Trainer horizontal is called the equilibrium current, Ieq . Capture the pitch and current response and record this current. 10. Click on Stop button to stop the VI. 3.4 Lab 2: Find Natural Frequency 1. Ensure the QNET VTOL Current Control VI is open and configured as described in Section 5.2. Make sure the correct Device is chosen. 2. Make sure that the VTOL counter-weight is placed as far from the propeller assembly as possible without lifting the propeller itself. The base of the propeller assembly should rest lightly on the surface of the QNET board as shown in Figure 3.3. 3. Set the Current Control ON? switch to ON. 4. In the Current Control Parameters section, set the PI current gains found in Section 2.5. 5. In the Current Setpoint section set: • Amplitude = 0.00 A • Frequency = 0.40 Hz • Offset = Ieq (equilibrium current found in Section 3.3) 6. Run the VI. QNET VTOL Workbook - Student Version 14 7. When the VI starts and the equilibrium current step is applied, the VTOL Trainer will shoot upwards quickly and then oscillate about its horizontal. Capture this response and measure the natural frequency. 8. Click on Stop button to stop the VI. 3.5 Lab 3: Model Validation 3.5.1 Pre-Lab Exercises 1. Using the VTOL Trainer model given in Section 3.1.2, and the specifications listed in the VTOL User Manual [1], compute the moment of inertia acting about the pitch axis. Enter the value in Table 3.1. 2. Based on the natural frequency found in Section 3.4 and the moment of inertia calculated above, find the stiffness of the VTOL Trainer. Enter the value in Table 3.1. 3. Using the equations presented in Section 3.1 and the equilibrium current found in Section 3.3, calculate the thrust current-torque constant Kt . Enter the value in Table 3.1. 4. Compute the VTOL Trainer transfer function coefficients based on the previously found parameters: Kt , J, B, and K. 3.5.2 In-Lab Experiment 1. Ensure the QNET VTOL Modelling VI is open and configured as described in Section 5.3. Make sure the correct Device is chosen. 2. Make sure that the VTOL counter-weight is placed as far from the propeller assembly as possible without lifting the propeller itself. The base of the propeller assembly should rest lightly on the surface of the QNET board as shown in Figure 3.3. 3. In the Current Control Parameters section, set the PI current gains found in Section 2.5. 4. In the Current Setpoint section set: • Amplitude = 0.00 A • Frequency = 0.20 Hz • Offset = Ieq (equilibrium current found in Section 3.3) 5. Run the VI. 6. Let the VTOL Trainer stabilizes about the horizontal. 7. In the Current Setpoint section set: • Amplitude =0.10 A 8. In the Transfer Function Simulation Parameters section, enter the parameters computed in Section 3.5.1. Is the simulation matching the measured signal? Capture the response. 9. Click on Stop button to stop the VI. 3.6 Lab 4: Using the System Identification Tool 1. Ensure the QNET VTOL Modelling VI is open and configured as described in Section 5.3. Make sure the correct Device is chosen. QNET VTOL Workbook - Student Version v 1.0 2. Make sure that the VTOL counter-weight is placed as far from the propeller assembly as possible without lifting the propeller itself. The base of the propeller assembly should rest lightly on the surface of the QNET board as shown in Figure 3.3. 3. in the Current Setpoint section set: • Amplitude = 0.10 A • Frequency = 0.20 Hz • Offset = Ieq (equilibrium current found in Section 3.3) which should perturb the VTOL Trainer is about its horizontal equilibrium point with a current amplitude of +/0.10 A, as described by steps 4-10 in Section 3.5. 4. Let the VI run for at least 20 seconds. 5. Click on Stop button to stop the VI. When the VI is stopped, the Estimated Transfer Function displays a newly identified transfer function of the VTOL system based on the last 20 seconds of current (i.e. stimulus signal) and pitch angle (i.e. response signal) data. 6. Enter the identified transfer function. 7. Enter the identified TF parameters into the Transfer Function Simulation Parameters section. 8. Go through steps 7-10 in Section 3.5. That is, bring the VTOL Trainer up to 0 degrees and then feed +/- 0.1 A. 9. In the Transfer Function Simulation Parameters section, enter the parameters computed using the System Identification Tool. How is the simulation matching the measured signal compared to the transfer function with the manually estimated parameters? Capture the response. 10. Click on Stop button to stop the VI. 11. Assume the moment of inertia is as calculated in Section 3.5. Then from the identified transfer function, find the stiffness (Ki d), the viscous damping (Bi d), and the current-torque constant (Kt,id ). How do they compare with the parameters you estimated manually? 3.7 Results Parameters Equilibrium current Torque-thrust constant Moment of inertia Viscous damping Natural frequency Stiffness Sys ID: Torque-thrust constant Sys ID: Viscous damping Sys ID: Stiffness Symbol Ieq Kt J B ωn K Kt,id Bid Kid Value Units A (N m)/A kg m2 (N m s)/rad rad (N m)/rad (N m)/A (N m s)/rad (N m)/rad Table 3.1: VTOL Trainer modeling results summary QNET VTOL Workbook - Student Version 16 4 FLIGHT CONTROL 4.1 Background 4.1.1 Steady-state Error Analysis Steady-state error is the difference between the reference and output signals after the system response has settled. Thus for a time t when the system is in steady-state, the steady-state error equals ess = rss (t) − yss (t) (4.1) where rss is the value of the steady-state reference and yss is the steady-state value of the process output. The block diagram shown in Figure 4.1 is a general unity feedback system with a compensator C(s) and a transfer function representing the plant, P (s). The measured output, Y (s), is supposed to track the reference signal R(s) and the tracking has to yield to certain specifications. Figure 4.1: Unity feedback system. The error of the system shown in Figure 4.1 is E(s) = R(s) − Y (s) and by solving for E(s) the resulting closed-loop transfer function E(s) = R(s) 1 + C(s)P (s) is obtained. The error transfer function of the VTOL trainer when subject to a step of R(s) = R(0) s and using the PID compensator C(s) = kp + kd s + QNET VTOL Workbook - Student Version ki s v 1.0 is E(s) = R0 ( ) ki Kt kp + kd s + s ( ) s 1 + B K 2 J s + s+ J J If the transfer function is stable, then the steady-state error can be found using the final-value theorem (FVT) ess = lim sE(s) s→0 Using FVT, the steady-state error of the VTOL trainer closed-loop PID step response is ( ess = R0 s(s2 J + Bs + K) lim 3 s→0 s J + Bs2 + Kt kd s2 + sK + Kt kp s + Kt ki ) (4.2) 4.1.2 PID Control Design The PID control loop used for the VTOL device is depicted in Figure 4.2 Figure 4.2: VTOL PID Control Loop The transfer function representing the VTOL trainer position-current relation in Equation 3.9 is used to design the PID controller. The input-output relation in the time-domain for a PID controller is ∫ u = kp (θd − θ) + ki (θd − θ) dt − kv θ̇ (4.3) where kp is the proportional gain, ki is the integral gain, and kv is the velocity gain. Remark that only the measured velocity is used, i.e. instead of using the derivative of the error. The closed loop transfer function from the position reference, r, to the angular VTOL position output, θ, is Gθ,r (s) = Kt (kp s + ki ) Js3 + (B + Kt kv )s2 + (K + Kt kp )s + Kt ki (4.4) The prototype third-order characteristic polynomial is QNET VTOL Workbook - Student Version 18 (s2 + 2ζωn s + ωn2 )(s + p0 ) = s3 + (2ζωn + p0 )s2 + (ωn2 + 2ζωn p0 )s + ωn2 p0 (4.5) where ωn is the natural frequency, ζ is the damping ratio, and p0 is a zero. The characteristic equation in Equation 4.4 (the denominator of the transfer function), can match the desired characteristic equation Equation 4.5 with the following gains kp = −K + 2p0 ζωn J + ωn2 J Kt (4.6) p0 ωn2 J Kt (4.7) −B + p0 J + 2ζωn J Kt (4.8) ki = kv = 4.2 Flight Control Virtual Instrument The virtual instrument used to run the flight controller on the QNET VTOL trainer is shown in Figure 4.3. Figure 4.3: LabVIEW virtual instrument used to run VTOL trainer flight control QNET VTOL Workbook - Student Version v 1.0 4.3 Lab 1: PD Steady-State Analysis 4.3.1 Pre-Lab Exercises 1. Calculate the theoretical VTOL Trainer steady-state error when using a PD control with kp = 2 and kd = 1 and a step amplitude of R0 = 4.0 degrees. Enter the value in Table 4.1. 4.3.2 In-Lab Experiment 1. Open the QNET_VTOL_Flight_Control.vi as shown in Section 5.4. Make sure the correct Device is chosen. 2. Make sure that the VTOL counter-weight is placed as far from the propeller assembly as possible without lifting the propeller itself. The base of the propeller assembly should rest lightly on the surface of the QNET board as shown in Figure 4.4. Figure 4.4: VTOL initial position 3. Run the VI 4. In the Position Setpoint section set: • Amplitude = 0.0 deg • Frequency = 0.15 Hz • Offset = 0.0 deg 5. In the Position Control Parameters section set: • kp = 1.0 A/rad • ki = 2 A/(rad·s) • kd = 1.0 A·s/rad 6. Let the VTOL system stabilize about the 0.0 rad setpoint. Examine if the VTOL Trainer body is horizontal. If not, then you can adjust the pitch offset by varying the VTOL Offset control. By default this is set to 25.0 degrees. 7. To use a PD control, in the Position Control Parameters section set: • kp = 2.0 A/rad • ki = 0 A/(rad.s) • kd = 1.0 A.s/rad QNET VTOL Workbook - Student Version 20 8. In the Position Setpoint section set: • Amplitude = 2.0 deg • Frequency = 0.40 Hz • Offset = 2.0 deg The VTOL Trainer should be going up and down and tracking the square wave setpoint. 9. Capture the VTOL device step response when using this PD controller and measure the steady-state error. Enter the measured PD steady-state error value in Table 4.1. How does it compare with the computed value in Section 4.3.1? 10. In the Signal Generator section set Amplitude (rad) to 0 rad and slowly decrement Offset (rad) to -8.0 rad. 11. Click on the Stop button to stop running the VI. QNET VTOL Workbook - Student Version v 1.0 4.4 Lab 2: PID Steady-State Error Analysis 4.4.1 Pre-Lab Exercises 1. Calculate the VTOL Trainer steady-state error when using a PID controller. Enter the value in Table 4.1. 4.4.2 In-Lab Experiment 1. Go through steps 1-8 in Section 4.3.2 to run the PD controller. 2. In the Position Control Parameters section, increment the integral gain until you reach ki = 4.0 A/(rad·s). 3. Capture the VTOL Trainer step response when using a PID controller and measure the steady-state error. Enter the measured PID steady-state error value in Table 4.1. How does it compare with the computed value in Section 4.4.1? 4. To stop the control, in the Signal Generator section set Amplitude (rad) to 0 rad and slowly decrement Offset (rad) to -8.0 rad. 5. Click on the Stop button to stop running the VI. 4.5 Lab 3: PID Control Design 4.5.1 Pre-Lab Exercises 1. Find the natural frequency, ωn , and damping ratio, ζ, required to meet a peak time of 1.0 seconds and a percent overshoot of 20%. Enter the value in Table 4.1. 2. Calculate the PID gains kp , ki , and kv , needed to meet the VTOL Trainer specifications. Enter the value in Table 4.1. 4.5.2 In-Lab Experiment 1. Open the QNET_VTOL_Flight_Control.vi as shown in Section 5.4. Make sure the correct Device is chosen. 2. Make sure that the VTOL counter-weight is placed as far from the propeller assembly as possible without lifting the propeller itself. The base of the propeller assembly should rest lightly on the surface of the QNET board as shown in Figure 4.4. 3. Run the VI 4. In the Position Setpoint section set: • Amplitude = 0.0 deg • Frequency = 0.15 Hz • Offset = 0.0 deg 5. In the Position Control Parameters section, enter the PID gains found in Section 4.5.1. 6. Let the VTOL system stabilize about the 0.0 rad setpoint. Examine if the VTOL Trainer body is horizontal. If not, then you can adjust the pitch offset by varying the VTOL Offset control. By default this is set to 25.0 degrees. 7. In the Position Setpoint section set: QNET VTOL Workbook - Student Version 22 • Amplitude = 2.0 deg • Frequency = 0.40 Hz • Offset = 2.0 deg The VTOL Trainer should be going up and down and tracking the square wave setpoint. 8. Capture the response of the VTOL system when using your designed PID controller. 9. Measure the peak time and percent overshoot of the measured response. Enter the values in Table 4.1. Are the VTOL Trainer response specifications satisfied? 10. If the specifications were not given, what could be done to improve the response? 11. To stop the control, in the Signal Generator section set Amplitude (rad) to 0 rad and slowly decrement Offset (rad) to -8.0 rad. 12. Click on the Stop button to stop running the VI. 4.6 Results Parameters PD steady-state error Measured PD steady-state error PID steady-state error Measured PID steady-state error Desired peak time Desired percentage overshoot Desired pole location Natural frequency Damping ratio Proportional gain Integral gain Derivative gain Measured peak time Measured percentage overshoot Symbol ess,pd ess,meas,pd ess,pid ess,meas,pid tp PO p0 ωn ζ kp kp kv tp PO Value Units deg deg deg deg s % rad/s rad/s 1.0 20.0 1.0 A/rad A/(rad s) (A s)/rad s % Table 4.1: VTOL Trainer control results summary QNET VTOL Workbook - Student Version v 1.0 5 SYSTEM REQUIREMENTS Required Hardware • NI ELVIS II • Quanser QNET Vertical Take-off and Landing (VTOL). See QNET VTOL User Manual ([1]). Required Software • NI LabVIEWr 2011 or later • NI DAQmx 9.3.5 or later • NI LabVIEW Control Design and Simulation Module 2011 or later • ELVIS II Users: ELVISmx 4.3 or later (installed from ELVIS II CD). Caution: If these are not all installed then the VI will not be able to run! Please make sure all the software and hardware components are installed. If an issue arises, then see the troubleshooting section in the QNET VTOL User Manual ([1]). 5.1 Overview of Files File Name QNET VTOL User Manual.pdf QNET VTOL Lab Manual (Student).pdf QNET_VTOL_Current_Control.vi QNET_VTOL_Modeling.vi QNET_VTOL_Flight_Control.vi Description This manual describes the hardware of the QNET Vertical Take-off and Landing system and how to setup the system on the ELVIS. This laboratory guide contains pre-lab questions and lab experiments demonstrating how to design and implement controllers on the QNET VTOL system LabVIEWr . Control the current in the propeller motor. Validate transfer function model and identify system parameters. Control the pitch of the VTOL device using PID. Table 5.1: Files supplied with the QNET VTOL Laboratory. 5.2 Current Control Laboratory VI The VTOL Current Control VI, shown in Figure 5.1 and Figure 5.2, is used to feed an open-loop voltage or current to the QNET-VTOL Trainer. The VI when in current mode is shown in Figure 5.1. In this mode, a current-controller is used to regulate the current in the motor and the user chooses the reference current. In voltage mode, shown in Figure 5.2, the voltage chosen is applied directly to the QNET amplifier, which in turn drives the motor. As a quick VI description, Table 5.2 lists and describes the main elements of the QNET VTOL Current Control VI. Every element is uniquely identified by an ID number located in Figure 5.1 and Figure 5.2, for both current and voltage mode. QNET VTOL Workbook - Student Version 24 Figure 5.1: QNET-VTOL Current Control VI when in open-loop current mode Figure 5.2: QNET-VTOL Current Control VI when in open-loop voltage mode QNET VTOL Workbook - Student Version v 1.0 ID # 1 2 3 4 5 6 Label Position Current Voltage Current Control ON? Open-loop Voltage Signal Type 7 8 9 10 11 12 13 14 15 16 Amplitude Frequency Offset kp_c ki_c VTOL Offset Device Sampling Rate Stop Scopes: Pitch 17 Scope: Current Symbol θ Im Vm K τ ωm Vm ωm Im Description Pitch position numeric display Motor armature current numeric display Motor input voltage numeric display Turns current control on and off Unit deg A V Input motor voltage to be fed Type of signal generated for current reference Current setpoint amplitude input box Current setpoint frequency input box Current setpoint offset input box Current control proportional gain Current control derivative gain Pitch calibration Selects the NI DAQ device Sets the sampling rate of the VI Stops the LabVIEW VI from running Scope with measured (in red) VTOL pitch position Scope with reference current (in blue) and measured current (in red) V A Hz A V/A V·s/A deg Hz deg A Table 5.2: Components of QNET-VTOL Current Control VI 5.3 Modeling Laboratory VI This VI is used for model validation and parameter identification and is shown in Figure 5.3. A transfer function is ran in parallel with the actual system and enables users to confirm whether their derived model is correct. Using the LabVIEW System Identification Toolkit, the VTOL Trainer transfer function model can be identified automatically by collecting the measured stimulus (i.e. current) and response (i.e. measured pitch angle) signals and specifying the order of the transfer function process model. The main components of the QNET VTOL Modeling VI front panel are listed and described in Table 5.3. Every element is given an ID number which is used to uniquely identify the VI components in Figure 5.3. QNET VTOL Workbook - Student Version 26 Figure 5.3: QNET-VTOL Modeling VI QNET VTOL Workbook - Student Version v 1.0 ID # 1 2 3 4 Label Position Current Voltage Signal Type 5 6 7 8 9 10 11 15 16 17 18 Amplitude Frequency Offset kp_c ki_c VTOL Offset Transfer Function Simulation Parameters Simulation Transfer Function Order of Estimated Model Estimated Transfer Function Device Sampling Rate Stop Scope: Pitch 19 Scope: Current 12 13 14 Symbol θ Im Vm kp,c ki,c θ Im Description Pitch position numeric display Motor armature current numeric display Motor input voltage numeric display Type of signal generated for the current reference Current setpoint input box Current setpoint frequency input box Current setpoint offset input box Current control proportional gain Current control integral gain Pitch calibration Transfer function used for simulation Displays the transfer function begin simulated Order of transfer function to be estimated using the System Identification Toolkit Transfer function estimated using the System Identification Toolkit Selects the NI DAQ device Sets the sampling rate of the VI Stops the LabVIEW VI from running Scope with simulated position (in blue) and measured VTOL pitch position (in red) Scope with reference current (in blue) and measured current (in red) Unit deg A V A Hz A V/A Vcdots/A deg Hz deg A Table 5.3: QNET VTOL Modeling VI Components 5.4 Flight Control Laboratory VI The QNET VTOL Flight Control VI runs the PID-based cascade control system, which is described in Section 2.1.1, to control the position of the VTOL pitch. Table 5.4 lists and describes the main elements of the QNET VTOL Flight Control VI and every element is uniquely identified by an ID number in Figure 5.4. QNET VTOL Workbook - Student Version 28 Figure 5.4: QNET VTOL Flight Control VI ID # 1 2 3 4 Label Position Current Voltage Signal Type 5 6 7 8 9 10 11 12 13 14 15 16 17 Amplitude Frequency Offset kp ki kd kp_c ki_c VTOL Offset Device Sampling Rate Stop Scope: Pitch 18 Scope: Current Symbol θ Im Vm kp ki kd kp,c ki,c θ Im Description Pitch position numeric display Motor armature current numeric display Motor input voltage numeric display Type of signal generated for the current reference Pitch setpoint input box Pitch setpoint frequency input box Pitch setpoint offset input box Position control proportional gain Position control integral gain Position control derivative gain Current control proportional gain Current control integral gain Pitch calibration Selects the NI DAQ device Sets the sampling rate of the VI Stops the LabVIEW VI from running Scope with reference position (in blue) and measured VTOL pitch position (in red) Scope with reference current (in blue) and measured current (in red) Unit deg A V A Hz A A/rad A/(rad·s) A·s/rad V/A Vcdots/A deg Hz deg A Table 5.4: QNET VTOL Flight Control VI Components QNET VTOL Workbook - Student Version v 1.0 6 LAB REPORT This laboratory contains three groups of experiments, namely, 1. Current Control, 2. Modeling, and 3. Flight Control. For each experiment, follow the outline corresponding to that experiment to build the content of your report. Also, in Section 6.4 you can find some basic tips for the format of your report. QNET VTOL Workbook - Student Version 30 6.1 Template for Content (Current Control) I. PROCEDURE 1. Finding Resistance • Briefly describe the main goal of the experiment. • Briefly describe the experimental procedure in Step 6 in Section 2.3. 2. Qualitative Current Control • Briefly describe the main goal of the experiment. • Briefly describe the experimental procedure in Step 7 in Section 2.4. • Effect of eliminating integral gain in Step 7 in Section 2.4. • Effect of eliminating proportional gain in Step 9 in Section 2.4. 3. Current Control Design • Briefly describe the main goal of this experiment. • Briefly describe the experimental procedure in Step 7 in Section 2.5.2. II. RESULTS Do not interpret or analyze the data in this section. Just provide the results. 1. Current response plot from step 7 in Section 2.4. 2. Current response plot from step 9 in Section 2.4. 3. Current response plot from step 7 in Section 2.5.2. 4. Provide applicable data collected in this laboratory from Table 2.2. IV. CONCLUSIONS Interpret your results to arrive at logical conclusions for the following: 1. How does the current response with tuned gains compare to the qualitative responses in Step 7 of Section 2.5.2? QNET VTOL Workbook - Student Version v 1.0 6.2 Template for Content (Modeling) I. PROCEDURE 1. Measure the Equilibrium Current • Briefly describe the main goal of the experiment. • Briefly describe the experiment procedure in Step 9 in Section 3.3. 2. Find Natural Frequency • Briefly describe the main goal of the experiment. • Briefly describe the experiment procedure in Step 7 in Section 3.4. 3. Model Validation • Briefly describe the main goal of the experiment. • Briefly describe creating the model in Step 8 in Section 3.5.2. 4. Using the System Identification Tool • Briefly describe the main goal of the experiment. • Briefly describe creating the model in Step 6 in Section 3.6. II. RESULTS Do not interpret or analyze the data in this section. Just provide the results. 1. Pitch and current response from step 9 in Section 3.3. 2. Equilibrium current step response from step 7 in Section 3.4. 3. Transfer function response from step 9 in Section 3.4. 4. Provide applicable data collected in this laboratory from Table 3.1. III. ANALYSIS Provide details of your calculations (methods used) for analysis for each of the following: 1. Natural frequency determination from Step 7 of Section 3.4. 2. How well does the simulation match the measured signal in Step 8 of Section 3.5.2? 3. Calculation of the model parameters from the identified transfer function in Step 11 of Section 3.6 IV. CONCLUSIONS Interpret your results to arrive at logical conclusions for the following: 1. How is the simulation matching the measured signal compared to the transfer function with manually estimated parameters in Step 9 of Section 3.4? 2. How do the generated parameters compare to the manually estimated parameters in Step 11 of Section 3.6? QNET VTOL Workbook - Student Version 32 6.3 Template for Content (Flight Control) I. PROCEDURE 1. PD Steady-State Analysis • Briefly describe the main goal of the experiment. • Briefly describe the experimental procedure in Step 9 in Section 4.3.2. 2. PID Steady-State Error Analysis • Briefly describe the main goal of the experiment. • Briefly describe the experimental procedure in Step 3 in Section 4.4.2. 3. PID Control Design • Briefly describe the main goal of this experiment. • Briefly describe the experimental procedure in Step 8 in Section 4.5.2. II. RESULTS Do not interpret or analyze the data in this section. Just provide the results. 1. Pitch response plot from Step 9 in Section 4.3.2. 2. PID response plot from Step 3 in Section 4.4.2. 3. PID response plot from Step 8 in Section 4.5.2. 4. Provide applicable data collected in this laboratory from Table 4.1 III. ANALYSIS Provide details of your calculations (methods used) for analysis for each of the following: 1. VTOL Trainer response characteristics in Step 9 in Section 4.5.2. 2. Improvements to the flight controller in Step 10 in Section 4.5.2. IV. CONCLUSIONS Interpret your results to arrive at logical conclusions for the following: 1. How does the measured steady state PD error compare to the computed value in 9 in Section 4.3.2? 2. How does the measured steady state PID error compare to the computed value in 3 in Section 4.4.2? 3. Are the VTOL Trainer response specifications satisfied in Step 9 of Section 4.5.2? QNET VTOL Workbook - Student Version v 1.0 6.4 Tips for Report Format PROFESSIONAL APPEARANCE • Has cover page with all necessary details (title, course, student name(s), etc.) • Each of the required sections is completed (Procedure, Results, Analysis and Conclusions). • Typed. • All grammar/spelling correct. • Report layout is neat. • Does not exceed specified maximum page limit, if any. • Pages are numbered. • Equations are consecutively numbered. • Figures are numbered, axes have labels, each figure has a descriptive caption. • Tables are numbered, they include labels, each table has a descriptive caption. • Data are presented in a useful format (graphs, numerical, table, charts, diagrams). • No hand drawn sketches/diagrams. • References are cited using correct format. QNET VTOL Workbook - Student Version 34 REFERENCES [1] Quanser Inc. QNET VTOL Control Trainer User Manual, 2011. QNET VTOL Workbook - Student Version v 1.0 Six QNET Trainers to teach introductory controls using NI ELVIS QNET DC Motor Control Trainer QNET HVAC Trainer QNET Mechatronic Sensors Trainer QNET Rotary Inverted Pendulum Trainer QNET Myoelectric Trainer QNET VTOL Trainer teaches fundamentals of DC motor control teaches classic pendulum control experiment teaches temperature (process) control teaches control using principles of electromyography (EMG) teaches functions of 10 different sensors teaches basic flight dynamics and control Quanser QNET Trainers are plug-in boards for NI ELVIS to teach introductory controls in undergraduate labs. Together they deliver added choice and cost-effective teaching solutions to engineering educators. All six QNET Trainers are offered with comprehensive, ABET*-aligned course materials that have been developed to enhance the student learning experience. To request a demonstration or quote, please email [email protected]. *ABET Inc., is the recognized accreditor for college and university programs in applied science, computing, engineering, and technology. Among the most respected accreditation organizations in the U.S., ABET has provided leadership and quality assurance in higher education for over 75 years. ©2013 Quanser Inc. All rights reserved. LabVIEW™ is a trademark of National Instruments. [email protected] Solutions for teaching and research. Made in Canada. [email protected]