1
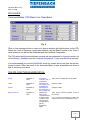
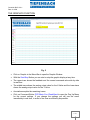
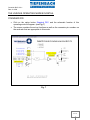
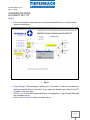
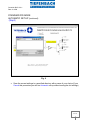
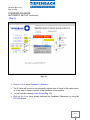
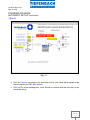
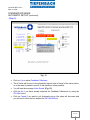
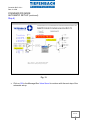
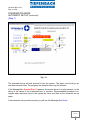
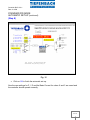
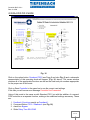
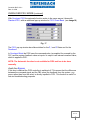
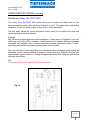
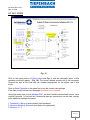
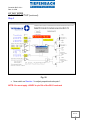
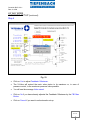
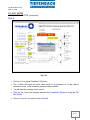
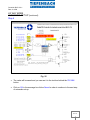
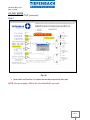
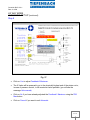
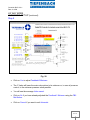
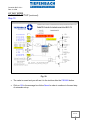
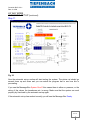
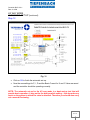
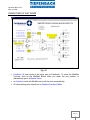
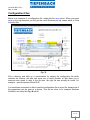
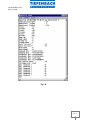
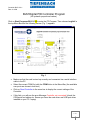
Controller BLS1 V 4.x Date 11-2009 THE GRAPHICS FUNCTION Fig. 5 Click on Graphic in the Menu-Bar to open the Graphic-Window. With the Start/Stop Button you can start or stop the graphic display at any time. The upper trace shows the feedback and the current command value side-by-side in real time. The middle trace shows the analog output value for the X-Valve and the lower trace shows the analog-output value for the Y-Valve. Annotations explain the remaining traces. Click on Command Button PID1/Basic-Curr./Dead-Band to open the Pop Up Menu for the current settings .If you change the settings you will see the result immediately in real time, in order to fine-tune as efficiently as possible. 7 / 38