1
PQM-701 Operating manual
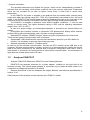
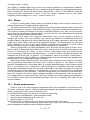
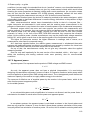
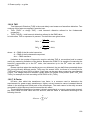
(additional uncertainty is omitted in case of energy measurements as much smaller than other
uncertainty types):
2
2
2
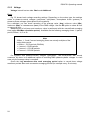
𝛿𝑃,𝑄 ≅ �𝛿𝑈ℎ
+ 𝛿𝐼ℎ
+ 𝛿𝑝ℎ
where: δP,Q – uncertainty of active or reactive power measurement,
δUh – total uncertainty of voltage harmonic amplitude measurement (analyzer,
transducers),
δIh – total uncertainty of current amplitude measurement (analyzer, transducers, clamps),
δph – additional uncertainty caused by the error of phase measurement between the
voltage and current harmonics.
The δph uncertainty can be determined if we know the phase shift angle for a given frequency
ranges. Table 9 presents the phase difference error between the voltage and current harmonics
for the PQM-701 analyzer (without clamps and transducers).
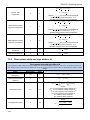
Phase difference error
Frequency range
0..200Hz
Error
≤1°
200..500Hz
≤2,5°
500Hz..1kHz
≤5°
1..2kHz
≤10°
2..3kHz
≤15°
Table 9. Phase error in the PQM-701 analyzer depending on the frequency
The phase error caused by used transducers and clamps can be usually found in their
technical documentation. Such being the case, we need to estimate the resultant phase error
between the voltage and the current for a given frequency caused by all elements of the
measuring circuit: current and voltage transducers, clamps, and the analyzer.
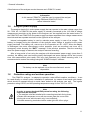
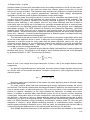
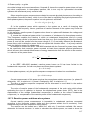
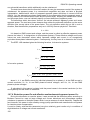
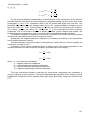
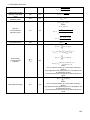
The uncertainty of the harmonics active power measurements can be calculated according to the
following formula:
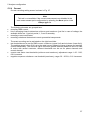
δph = 100 �1 −
cos(φ+Δφ)
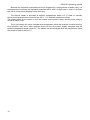
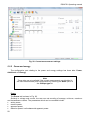
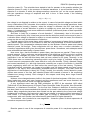
δph = 100 �1 −
sin(φ−Δφ)
cosφ
� [%], cos φ ≠ 0
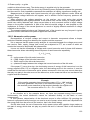
On the other hand, the uncertainty of the harmonics reactive power measurements can be
calculated according to the following formula:
sinφ
� [%], sin φ ≠ 0
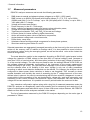
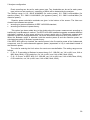
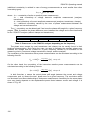
In both formulas, ϕ means the actual phase shift angle between the current and voltage
components, and ∆ϕ means the total phase error for a given frequency. The conclusion which
can be drawn from these relationships is that power measurement uncertainty for the same phase
error very clearly depends on the displacement power factor between current and voltage. It is
shown in Fig. 86.
126