1
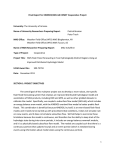
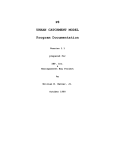
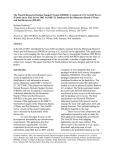
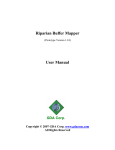
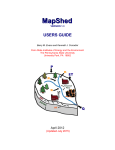
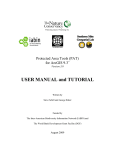
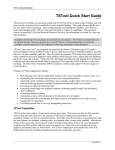
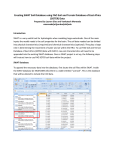
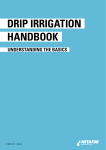
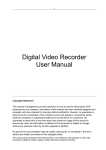
WaterFALL™
Watershed Flow and ALLocation Modeling System
Using NHDPlus
For more information contact Michele Cutrofello ([email protected]), or
Robert Dykes ([email protected])
RTI has built a new watershed modeling tool and decision-support platform to enable interactive quantitative investigation of water availability and allocation at multiple geographic
scales. The Watershed Flow and ALLocation (WaterFALL™) system employs a wellestablished hydrologic model, the Generalized Water Loading Function (GWLF) that has been
modified to run on EPA’s enhanced National Hydrography Dataset (NHDPlus) hydrologic
network. RTI has indexed extensive data layers onto each individual NHDPlus catchment to
provide all of the input data needed to parameterize and run the GWLF model within a
catchment. Routing routines are embedded to allow the cumulative water resource impacts
across any number of user-selected catchments to be quantified. Advantages of this distributed
model architecture include:
•
•
•
•
•
Scalability. The model, which is based on a physically delineated network of
catchments, can be run on a single catchment or any hydrologic unit upstream of a userselected catchment up to entire watersheds.
Portability. The model can be run anywhere on the NHDPlus network (i.e. the
contiguous U.S.) with minimal model set up, calibration, or additional data inputs.
Accessibility. The model is built on an advanced Oracle web-server delivery platform
and can be accessed from almost any internet connected computer.
Usability. The model employs simple graphical interfaces for spatial navigation and a
variety of other tools to facilitate “what if?” analyses in real time.
Granularity. The model is distributed across many very small NHDPlus catchments
providing heightened sensitivity to geographic variations in land cover and climate
variables across a selected study region.
Intended Uses
WaterFALL™ has been developed to address 5 primary needs:
1. Climate Change Adaptation. WaterFALL™ employs GWLF to calculate runoff based
on precipitation rate, ambient temperature, and ground cover/use. Down-scaled climate
modeling of future changes in precipitation and/or temperature, as well as possible
changes in land cover such as deforestation, can be easily accommodated by the model
and employed to determine how predicted climate changes may shift the availability of
water at any user-designated geographic location. The effectiveness of actions to adapt
to climate change, in terms of streamflow and runoff, can be quantified using
WaterFALL™.
RTI International©
Page 1
2. Water Allocation and Management. WaterFALL™ will enable water resource
planners and managers to systematically evaluate the impacts of proposed water
allocation strategies on water availability throughout an entire watershed. State and
regional water resources managers will be able to employ the model to quantify the
carrying capacity (i.e. “available daily yield”) of local watersheds, and to better
understand how calculated yields would likely be altered as a consequence of either
temporary or permanent changes in rainfall amounts (i.e. drought conditions), changes in
average air temperatures, changes in water withdrawal or consumptive use rates, or
changes in land use patterns.
3. Ecological Flow Development. WaterFALL™ provides enormous flexibility as a tool
for establishing ecological flow regimes. When applied to a watershed, or user-defined
sub-basin, the model produces a complete hydrograph for each NHDPlus catchment
included in the basin. As a result, flows are profiled for small stream reaches, often one
kilometer or less in length. The model performs independently of stream gage data,
eliminating the need for extensive statistical extrapolation of historical flow data.
WaterFALL™ is particularly well suited for implementation of the Ecological Limits of
Hydrologic Alteration (ELOHA) framework developed under the auspices of The Nature
Conservancy. It can easily model unaltered flow conditions and can also be set up to
reflect past land cover and land use characteristics. Relevant model output includes
stream velocity and depth in addition to total flow.
4. Water Supply Risk and Impact Assessment. WaterFALL™ is an efficient, easy to use
tool for large consumers of water to: a) assess site-specific vulnerability of water
supplies; b) support plant siting studies; c) better target water conservation investments;
or d) satisfy sustainability measurement and reporting requirements such as those
included within the Global Reporting Initiative (GRI) framework. Many States are also
in the process of developing and implementing new regulations that will require large
water users, typically those withdrawing in excess of 100,000 gallons/day, to apply for
water use permits. Under these rules, applications for a water use permit may need to
include modeling data on the impacts of the proposed withdrawals on downstream users
and on “hydrologically interconnected” water resources. WaterFALL™ is well-suited for
rapidly quantifying withdrawal impacts, at any user-define scale.
5. Reservoir Storage-Yield-Reliability Analysis. WaterFALL™ can be employed to
generate time-series of stream inflows to reservoirs under both historical and anticipated
future climate or hydrologic conditions. These data are critical in calculating the
likelihood that a reservoir will be able to satisfy demands (yields), especially under
changed, or “non-stationary”, fluctuations in inflow rates. A broad range of stream
inflow patterns can be modeled and subjected to statistical analysis to determine the
impact on storage-yield-reliability relationships. Model outputs can be provided in a
daily, weekly, monthly, or annual time-step, depending on the sensitivity of the statistical
procedure in use.
RTI International©
Page 2
System Architecture
WaterFALL™ is configured to overlay on the NHDPlus. The NHDPlus network provides high
resolution topographic representation of more than 2 million catchments (average size 2.5 km2
nationwide) that can be combined by the user to form hydrologic units of varying size ranging
from individual streams or stream reaches to entire multi-state river basins. This feature enables
the model to be fully portable to any user-defined region within the contiguous U.S. and to be
scaled to any user-defined hydrologic boundaries.
GWLF, first described by Haith and Shoemaker (1987), encompasses all major components of
the hydrologic cycle and is in widespread use. The main inputs to the model are daily
precipitation and temperature. Evapotranspiration rates are calculated based on temperature and
land use parameters. The lack of reliance on past historical data for purposes of calculating
streamflows, along with the ability to calculate evapotranspiration losses under alternative
climactic conditions, combine to make the model well-suited for purposes of evaluating
hydrologic impacts associated with climate change.
GWLF uses the Universal Soil Loss Equation (USLE) and SCS Curve Number methods for
runoff and sediment calculations. The NHDPlus catchment scale provides a reasonable
watershed size on which to develop individual, but networked GWLF applications. The
intermediate level data requirements of the model are met with geo-referenced national datasets
(SSURGO, NLCD, etc.) and regional datasets (evapotranspiration cover factors, etc.).
RTI International©
Page 3
GWLF
Source: GWLF User Manual Version, Haith et al., 1996
A variety of climate datasets are available to satisfy the precipitation and temperature inputs to
the model. Two highly utilized data sources include the network of COOP weather stations
available from the National Climatic Data Center (NCDC) and gridded monthly historical
climate records from the Parameter-elevation Regressions on Independent Slopes Model
(PRISM) (Di Luzio et al., 2008). WaterFALL™ utilizes a newly compiled dataset that combines
these two datasets to provide daily, 4-kilometer gridded climate data for the contiguous U.S.
from 1960 to 2006. Future climate scenarios can be met by indexing compiled climate model
output, such as that available from ClimateWizard (climatewizard.org) or state compilations, to
the NHDPlus catchments.
The streamflow gages indexed to the NHDPlus in the USGS National Water Information System
are accessed through the data structure to provide the actual flow measurements for calibration
and validation of the model. Calibration against field monitoring data for streamflow has been
performed to verify model performance in flow volume and timing within a series of test
watersheds within North Carolina. Calibration of other areas will be completed as testing and
validation continues.
Additional hydrologic parameters have been included from gridded datasets compiled by the
National Weather Service (NWS) at the 4-kilometer scale. These datasets were originally
compiled to parameterize the Sacramento Soil Moisture Accounting (SAC-SMA) model. While
some of the parameters match between GWLF and SAC-SMA model requirements, others have
been slightly modified for our use. These parameters serve as a base of calibration for
WaterFALL™.
RTI International©
Page 4
Web Interface
The web-based interface to the model begins with a map view of the contiguous U.S. Users can
select from among several different views within the map and navigate like any typical internet
map interface. The WaterFALL™ interface includes a variety of functions for navigating the
map and viewing and modifying the default model data. The model is run from this interface
and simple result summaries are also presented with the option to export the data. The following
screens provide a view of the editing and display screens contained within the interface.
WaterFALL™ Mapping Interface
WaterFALL™’s mapping interface uses ArcGIS server and displays maps from Microsoft’s
Bing interface. Users can navigate the mapping interface much in the way they navigate current
internet mapping sites like Bing and Google. The user has the ability to pan in any direction,
zoom in or out, and switch between Street, Topographic, and Satellite background map views.
Four- and 8-digit hydrologic unit boundaries are displayed when viewing the map at regional,
state, and national levels. At the local level, NHDPlus catchments are displayed over the map
background for easy identification and navigation of the stream network. Controls along the left
side of the interface allow the user to define their watershed of interest once a catchment on the
map is clicked or a latitude and longitude is entered. These functions are controlled through the
“Get Catchments” button. If the watershed highlighted on the map (as shown in the figure
above) is not the intended watershed, the user can use the “Clear All” button to start over. The
controls along the left also allow the user to select run dates (using the calendar icons) and run
the model once the watershed is defined. The user may also download the list of NHDPlus
catchments (shown in the list on the bottom left of the screen) within their selected watershed for
external use.
RTI International©
Page 5
Database Interface: Flow Form
Future enhancements to WaterFALL™ will allow users to add human withdrawals and returns to
the selected NHDPlus catchment to account for infrastructure such as drinking water intakes and
wastewater treatment plant or industrial discharges. On this screen users will also be able to
select to use monitored streamflow data in place of model generated data for this catchment. This
option is envisioned to be used below control structures where gaged data is more representative
of reality than estimated releases from the structure. The user may also select to add a time series
of releases from a control structure in place of model generated flow for the catchment on this
screen. Finally, the flow generated by the underlying hydrologic model within the catchment,
including effects of user-entered withdrawals or returns, is displayed in graph form on this
display for reference.
RTI International©
Page 6
Database Interface: Hydrologic Parameters Form
The hydrologic parameters displayed on this screen were culled from a variety of sources
including SSURGO, regional regressions, NWS datasets, and general look up tables. Therefore,
a user with more detailed knowledge of the local system may wish to modify the default
parameters to better represent the stream and watershed characteristics. In the future, users will
be able to modify model parameters by selecting the “Modify” box and entering a new value,
which will be checked for reasonableness before being accepted into the model. After making
modifications the user can also choose to go back to the default values within the database by
selecting the “Restore to Defaults” button.
RTI International©
Page 7
Database Interface: Meteorology Form
Displayed on the left side of the screen are summary statistics of the default temperature and
precipitation dataset. On the right side is a graphic summary of the data. A simple
representation of a “what if” scenario is allowed through this screen where users can globally
(meaning the entire time series) modify the climate dataset by an absolute degree value for
temperature or a relative percent precipitation using slider bars. The user can also select to
modify the data just for the local catchment or for the entire watershed area under analysis.
Finally, the user may choose to use their own time series of temperature and precipitation data,
indexed by NHDPlus catchment, rather than relying on any of the default datasets contained in
the database. Required format for the data will be provided.
RTI International©
Page 8
Database Interface: Land Use – Characterization Form
The land uses included in WaterFALL™ are listed in the menu along the left side of screen.
Clicking on each of the land uses listed will bring up the screen shown here specific to the land
use category. The area of the land use within the currently selected catchment is displayed along
with the parameters corresponding to the land use. The user may keep the default values or
modify the values as with the previous screens. Likewise, the user can return to using default
values after making modifications using the “Return to Defaults” button at the bottom. Also on
this screen (although not currently shown) the user has the option to chose to modify the area of
each land use within the catchment. These modifications are made on the AREAS screen
selected at the bottom left of the screen and described below.
RTI International©
Page 9
Database Interface: Land Use – Areas Form
The AREAS selection at the bottom of the left side of the screen brings up a tab where each of
the land uses selected for area modification will appear with their current area in the catchment.
The user then enters a new area for each land use until the total change in area displayed at the
bottom equals zero. A user will not be allowed to navigate off this screen until that total equals
zero. This feature allows a user to simulate land use changes within the catchment for a wide
range of scenarios ranging from a return to natural conditions to a fully developed urban area.
RTI International©
Page 10
Database Interface: Output Form
The outputs displayed on this screen are currently summaries of the streamflows and related data
(e.g. velocity, channel depth) for the entire simulation run for a selected catchment within the
modeled watershed. The graph on the right side of the screen allows the user to examine the
outflow from the catchment with a “zoom-in feature” to explore a selected period in detail
(shown as blue overlay). Additionally, in the future the user will have the option to display the
annual flow duration curves (FDC) for each year of the simulation. The user may also export an
Excel file of the model results for each catchment, the processed FDC data, or the actual graph
pictured using the buttons along the bottom right of this screen. Finally, an additional summary
of the annual average streamflows (mean annual, maximum annual, and minimum annual) over
the period of simulation for this catchment are displayed to reflect the range of streamflow
conditions expected for the catchment/upstream watershed.
RTI International©
Page 11
Database Interface: Performance Form
The various performance measures presented in the screen still under development and will
likely be modified in future versions. Currently there are three sections to evaluate streamflows:
(1) Comparison to streamflows from an external file uploaded by the user; (2) Comparison to
minimum and maximum flow values entered on the screen by the user; and (3) Parameterization
of the streamflows in the Water Use Regime framework described by Weiskel and others (2007).
Future enhancements/changes to this screen will likely incorporate flow duration curves and
percentiles.
RTI International©
Page 12