1
3.4 The Analyses Tab
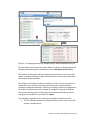
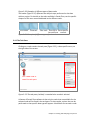
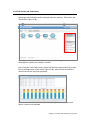
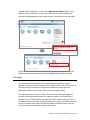
After samples have been added and associated with valid data files, a data node
will appear in the Analysis tab (Figure 3-19). The Analyses tab is where different
analysis tools and the corresponding reports are accessed.
Figure 3-19: The Analyses tab showing a data node of unaligned reads (an
example is shown)
3.4.1 Data and Task nodes
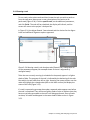
The Analyses tab contains two elements: data nodes (circles) and task nodes
(rounded rectangles) connected by lines and arrows. Collectively, they represent
a data analysis pipeline. Customized pipelines can be pre-built or created and is
the subject of Chapter 13.
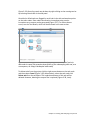
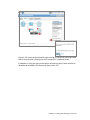
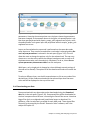
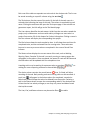
Data nodes (Figure 3-20) may represent a file imported into the project, or a file
generated by Partek Flow as an output of a task (e.g., alignment of FASTQ files
generates BAM files).
Chapter 3 : Creating and Analyzing a Project 21