1
HOME ENERGY
MANAGEMENT SYSTEM
END OF PROJECT
DOCUMENTATION
Created By:
TEAM 11
Logan Odell,
Va Banh,
Sean O'Hara,
Waleng Vang,
Billy Saetern
CPE 191/EEE 193B - Senior Design Project II
DUE: May 05, 2014
Abstract— the following document is a report on Team 11’s Home Energy Management System. With the
advancement of technology and its capabilities to simplify life, humans have become more dependent on energy
and its uses more than ever. In the residential sector of the United States, nearly half the energy used is wasted
which equates to 8% of the United States total energy consumption. Team 11 proposed the Home Energy
Management System (H.E.M.S) that would aim to provide data and energy controls to homeowners and
consumers. The goal of this report, the End of Project Document, is to provide an extensive, intertwined
document from fall 2013 to spring 2014 on Team’s project, activity, progression, and documentation. The
document will provide detailing on the societal problem, design idea, funding, testing, and work breakdown, as
well as blueprints for the entirety of the H.E.M.S, and a User Manual.
Keywords— AJAX(Asynchronous JavaScript and XML), Design idea, H.E.M.S ( Home Energy Management
System ), Home Controller, HTML(Hyper Text Markup Language), HVAC, JAVASCRIPT, jQuery Mobile
Libraries, Node Device, OTLWR, PHP(Hypertext preprocessor), Power Sensing Circuit, Relay Circuit, Societal
Problem, TEAM 11, Work Breakdown Structure, XBee Circuit
California State University Sacramento
Table of Contents
I. INTRODUCTION ....................................................................................................................... 1
II. SOCIETAL PROBLEM ............................................................................................................. 1
A. The Original Societal Problem ............................................................................................... 3
B. A New Perspective ................................................................................................................. 3
III. DESIGN IDEA ......................................................................................................................... 4
A. Feature List ............................................................................................................................. 4
B. Software Top Level Design .................................................................................................... 5
C. Hardware Top Level Design................................................................................................... 7
IV. FALL 2013 ............................................................................................................................... 8
V. FUNDING-FALL 2013 ............................................................................................................. 9
VI. MILESTONE-FALL 2013 ..................................................................................................... 10
VII. WORK BREAKDOWN STRUCTURE-FALL 2013 ........................................................... 11
A. Charts.................................................................................................................................... 11
B. Table ..................................................................................................................................... 13
C. First Semester WBS ~Allocation Overview ......................................................................... 16
VIII. RISK ASSESSMENT & MITIGATION-FALL 2013......................................................... 24
A. Summary .............................................................................................................................. 27
IX. SPRING 2014 ......................................................................................................................... 29
X. FUNDING-SPRING 2014 ....................................................................................................... 29
XI. MILESTONE-SPRING 2014 ................................................................................................. 29
XII. WORK BREAKDOWN STRUCTURE-SPRING 2014 ....................................................... 30
A. Charts.................................................................................................................................... 30
B. Tables.................................................................................................................................... 31
C. Second Semester WBS ~Allocation Overview .................................................................... 33
XIII. RISK ASSESSMENT & MITIGATION-SPRING 2014 .................................................... 39
XIV. MARKET REVIEW-SPRING 2014 ................................................................................... 39
A. Our Target Consumers ......................................................................................................... 40
B. Competition ......................................................................................................................... 41
XV. SYSTEM SETUP .................................................................................................................. 44
i
A. Laboratory Prototype Consumer Guide ............................................................................... 44
B. Technical User Guide Preface .............................................................................................. 45
C. Before Getting Started .......................................................................................................... 45
D. Hardware Components ......................................................................................................... 45
E. Software Components ........................................................................................................... 45
F. Software Assembly ............................................................................................................... 46
1) MySQL Database Setup ................................................................................................... 46
2) Mobile Website Setup ...................................................................................................... 47
3) Connecting the Website to the Database .......................................................................... 47
G. Hardware Assembly ............................................................................................................. 47
1) Individual Node Setup ...................................................................................................... 47
2) Base Station Setup ............................................................................................................ 48
3) Thermostat Setup .............................................................................................................. 48
H. Troubleshooting.................................................................................................................... 48
I. FAQ........................................................................................................................................ 48
XVI. USER MANUAL................................................................................................................. 49
A. Outlet Page ........................................................................................................................... 49
B. Thermostat Page ................................................................................................................... 50
C. Low Power Mode Page......................................................................................................... 50
XVII. HARDWARE ..................................................................................................................... 51
XVIII. SOFTWARE ..................................................................................................................... 57
A. Flowcharts ............................................................................................................................ 58
B. Database................................................................................................................................ 65
C. Website ................................................................................................................................. 66
D. Protocol ................................................................................................................................ 66
XIX. MECHANICAL ................................................................................................................... 67
XX. TEST PLAN-HARDWARE ................................................................................................. 67
A. Accuracy............................................................................................................................... 68
B. Precision ............................................................................................................................... 68
C. Resolution ............................................................................................................................. 68
D. Energy Measurement Testing ............................................................................................... 68
ii
E. Wireless Communication Testing ......................................................................................... 68
XXI. TEST PLAN-SOFTWARE.................................................................................................. 69
A. Black Box Testing ................................................................................................................ 69
B. White Box Testing ................................................................................................................ 69
C. Mobile Website: ................................................................................................................... 70
D. Database: .............................................................................................................................. 73
E. Results:.................................................................................................................................. 75
XXII. CONCLUSION .................................................................................................................. 80
REFERENCES ............................................................................................................................. 81
Glossary ........................................................................................................................................ 82
APPENDIX ...................................................................................................................................... i
Appendix A: Electrical Power Overview ..................................................................................... i
Appendix B: EMON Library....................................................................................................... ii
Emon.h .................................................................................................................................... ii
Emon.cpp ................................................................................................................................ ii
iii
List of Figures
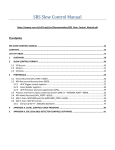
Figure 1: 2011-2040 Energy Chart Prediction .............................................................................. 2
Figure 2: Outlet Page ..................................................................................................................... 5
Figure 3: T-Stat Page ..................................................................................................................... 5
Figure 4: Low Power Mode Control .............................................................................................. 5
Figure 5: Low Power Mode Settings .............................................................................................. 6
Figure 6: Authentication Page........................................................................................................ 6
Figure 7: Registration Page ........................................................................................................... 6
Figure 8: Password Retrieval Page ................................................................................................ 6
Figure 9: Utility Login Page........................................................................................................... 6
Figure 10: Low Power Activation Page ......................................................................................... 7
Figure 11: Project Frame ............................................................................................................... 7
Figure 12: Separate Outlet ............................................................................................................. 7
Figure 13: Level 0 Tier and Its Corresponding Level 1 Structures .............................................. 11
Figure 14: Level 1 Tier “Wireless Nodes” and Its Corresponding Level 2 Structures ............... 11
Figure 15: Level 1 Tier “Base Station” and Its Corresponding Level 2 Structures .................... 11
Figure 16: 2 Tier “Database” and “Mobile Web Interface” and their Corresponding Level 3
Structures ...................................................................................................................................... 12
Figure 17: Level 1 Tier “Abnormal Usage Check” and “Node Communication” and their
Corresponding Level 1 Structures ................................................................................................ 12
Figure 18: Level 1 Tier “Utility Web Interface” and “Presentation Structure” and their
Corresponding Level 2 Structures ................................................................................................ 12
Figure 19: Level 1 Tier “Thermostat” and their Corresponding Level 2 Structures .................. 13
Figure 20: Level 1 Tier “Documents” and their Corresponding Level 2 Structures ................... 13
Figure 21: Level 0 Tier and Its Corresponding Level 1 Structures .............................................. 24
Figure 22: Level 1 Tier “Wireless Nodes” and Its Corresponding Level 2 Structures ............... 24
Figure 23: Level 1 Tier “Base Station” and Its Corresponding Level 2 Structures .................... 25
Figure 24: Level 2 Tier “Database” and “Mobile Web Interface” and their Corresponding
Level 3 Structures ......................................................................................................................... 26
Figure 25: Level 1 Tier “Abnormal Usage Check” and “Node Communication” and their
Corresponding Level 1 Structures ................................................................................................ 26
Figure 26: Level 1 Tier “Utility Web Interface” and “Presentation Structure” and their
Corresponding Level 2 Structures ................................................................................................ 27
Figure 27: Level 0 Tier “Home Energy Management” and their Corresponding Level 1
Structures ...................................................................................................................................... 28
Figure 28: Level 0 Tier and Its Corresponding Level 1 Structures.............................................. 30
Figure 29: Level 1 Tier “Wireless Nodes” and Its Corresponding Level 2 Structures ............... 30
Figure 30: Level 1 Tier “Base Station” and Its Corresponding Level 2 Structures .................... 30
iv
Figure 31: Level 1 Tier “MOW Page”, “Presentation Structure” and “Thermostat” and their
Corresponding Level 2 Structures ................................................................................................ 31
Figure 32: Level 1 Tier “Documents” and their Corresponding Level 2 Structures ................... 31
Figure 33: Home Page of the Mobile Website.............................................................................. 49
Figure 34: Outlet Page ................................................................................................................. 50
Figure 35 Thermostat Page .......................................................................................................... 50
Figure 36 Low Power Activate ..................................................................................................... 51
Figure 37: Low Power Configuration .......................................................................................... 51
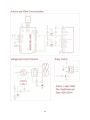
Figure 38: System Block Diagram ................................................................................................ 51
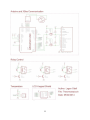
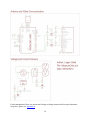
Figure 39: Base Station Block Diagram ....................................................................................... 52
Figure 40: Node Device Block Diagrams ..................................................................................... 53
Figure 41: Schematic For Wall Outlet Node Device .................................................................... 54
Figure 42: Schematic For Thermostat Node Device .................................................................... 55
Figure 43: Schematic For HVAC and Whole House Node Device .............................................. 56
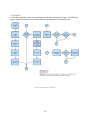
Figure 44: Flowchart For The Outlet Sketch ............................................................................... 58
Figure 45: Flowchart for the Thermostat Sketch ......................................................................... 59
Figure 46: Flowchart For HVAC and Whole House Sketch ........................................................ 60
Figure 47: Flowchart For Raspberry Pi Main Function.............................................................. 61
Figure 48: Flowchart for TTY Thread .......................................................................................... 62
Figure 49: Flowchart For Stat Update Thread ............................................................................ 63
Figure 50: Flowchart For Flex Alert Thread ............................................................................... 64
Figure 51: Project Frame ............................................................................................................. 67
Figure 52:Energy Measurement Circuit .......................................................................................... i
v
List of Tables
TABLE 1 2011-2040 ENERGY TABLE PREDICTION .............................................................. 2
TABLE 2 OVERVIEW FOR HOME ENERGY MANAGEMENT FIRST SEMESTER WORK
BREAKDOWN STRUCUTRE .................................................................................................... 13
TABLE 3 FALL ASSIGNMENTS .............................................................................................. 20
TABLE 4 HOME ENERGY MANAGEMENT SECOND SEMESTER WORK BREAKDOWN
STRUCUTRE OVERVIEW ......................................................................................................... 31
TABLE 5 SPRING ASSIGNMENTS ......................................................................................... 35
TABLE 6 DATABASE STRUCTURE FOR TEMPERATURE ................................................ 50
TABLE 7 COMPARISON OF NODE DEVICE FEATURES .................................................... 52
TABLE 8 COLUMN INFORMATION FOR DEVICE TABLE ................................................. 65
TABLE 9 COLUMN INFORMATION FOR MEASURE TABLE............................................. 65
TABLE 10 COLUMN INFORMATION FOR AUTHENTICATION ........................................ 65
TABLE 11 ZIGBEE RX PACKET DESCRIPTION .................................................................. 66
TABLE 12 DESCRIPTION OF HEMS PROTOCOL ARGUMENTS ....................................... 67
TABLE 13 LIGHT BULB TESTING RESULTS ........................................................................ 68
TABLE 14 FAN TESTING RESULTS ........................................................................................ 68
TABLE 15 ARDUINO TESTING RESULTS ............................................................................. 68
TABLE 16 SOFTWARE TESTING WEBSITE TO DATABASE--OUTLET ........................... 75
TABLE 17 MOBILE WEBSITE TO DATABASE -- TEMPERATURE.................................... 76
TABLE 18 CHECKING UPDATE BETWEEN WEBPAGE THERMOSTAT VALUE AND
DATABASE ................................................................................................................................. 76
TABLE 19 MOBILE WEBSITE TO DATABASE -- LOW POWER MODE ............................ 77
TABLE 20 MOBILE WEBSITE TO DATABASE -- AUTHENTICATION ............................. 77
TABLE 21 MOBILE WEBSITE TO DATABASE FLEX ALERT ............................................ 78
TABLE 22 US LATENCY SERVICE SPEED ............................................................................ 79
vi
Home Energy Management System that will
track and display homeowner’s energy
usage, and provide energy saving controls
to the consumers.” Initially designed for
management controls, the Home Energy
Management System has evolved to focus
primarily on automation, taking away the
consumers need to be alert and micromanage. It is designed for homeowners as
well as energy savers and environmentalist,
who desire to know of their energy
consumption and minimize their waste. It is
adaptable to the user's needs and wants and
the features will be explained in the
documentation.
This End of Project Document will
provide critical documents and blueprints of
the Home Energy Management System
(H.E.M.S) from August 2013 to May 2014,
comprising of 2 semesters of work. These
pieces include an in depth analysis of the
societal problem and its evolution, the initial
and final design of the H.E.M.S, a work
breakdown structures, project timelines,
analysis of all blueprints and components of
the system, all hardware and software
testing, as well as a market analysis of the
system. To begin the document, we will
discuss the societal problem of energy waste
in United States, and its relevancy on the
global scale.
I. INTRODUCTION
Engineering students commit to their
major to learn about how the devices in the
world operate, how to create them, and
advance them for the bettering of
humankind. In the United States, the average
timeframe it takes for an engineering student
to complete their program and receive their
degree takes five years or 10 semesters.
Through this process the student studies and
attempts to master all forms of subjects
ranging from Chemistry to computing
programs, all relevant to their major. And at
the end, their knowledge is tested with the
Senior Design course, a class meant to allow
the students to demonstrate their years of
forging and priming of their skills and
knowledge. It is here that they showcase
their abilities, and experience teamwork,
project building, project managing, all to
prepare them for the engineering industries
of the world, as well as their future careers.
The End of Project Document is the final
collective piece that documents all efforts
and components of a team in the Senior
Design Course for CPEs and EEEs at
Sacramento State University. This specific
document discusses the work and efforts of
Team 11 of year 2013-2014 comprising of
four CPEs (Logan Odell, Va Banh, Billy
Saeteurn, and Waleng Vang) and one EEE
(Sean O’Hara). Team 11 opted to deliver a
solution to the societal problem of rising
energy demands and a dwindling supply of
non-renewable sources of energy. As we
enter the infant of stages of the age of
automation, we can develop solutions to
help bridge the gap between a society that
exhausts its non-renewable coal and
petroleum, and a society that thrives on
smart and managed usage of renewable wind
and solar energy. Specifically, Team 11 is
tackling the concept of energy waste in the
United States’ residential sector by building
a Home Energy Management System. This
is their elevator pitch: “We are creating a
II. SOCIETAL PROBLEM
The revelation and impact of the Energy
Crisis in 1970 opened up a new view of the
potential shortage of energy the world would
one day arrive to. This had motivated
nations around the world to push engineers
and scientist alike to find other resources,
and cultivate current resources to better
maintain the longevity of their use. Fast
forward four decades, and the push for
renewable, as well as alternate, resources
have been mainstreamed with examples
including natural energy (wind, solar, water)
and nuclear plants. Even with these other
resources, the next energy crisis still seems
1
Team 11’s focus for this topic is to aid
the residential sector in maintaining a
respectable and valid use of their energy.
This is their elevator pitch: “We are
creating a Home Energy Management
System that will track and display
homeowner’s energy usage and provide
energy saving controls to the consumer.”
Originally, the belief was that the H.E.M.S
project would erratically help homeowners
with preserving energy; simple online
mobile controls and automation set up of the
house would cut the energy bill by a good
fraction. After a semester of researching
and prototyping the project with the
guidance of their advisor, Russ Tatro, the
belief was merely a belief. With the cost of
each node and the percentage of energy
saved realized, the erratic savings became
minor. Taking into account that vampire
devices such as Refrigerators and Freezers
(the largest electric consuming devices in
the average household) are on 24/7, being
able to turn off a light or the heater would
merely shave 10 to 20 dollars off the
electricity bill. Considering that each of
H.E.M.S nodes cost $20 to $30, the savings
are obviously not dramatic enough to
warrant a purchase.
This is where the angle of the problem
statement changes. We have come to accept
that people are inherently selfish and
careless, doing as they are please.
Persuading them to change their energy
consumption with the help of the H.E.M.S
would be ideal, but impractical. So instead,
we will focus our Problem Statement not
only on preserving energy in the residential
sector but also to provide a foundation for
future homes. The industry is headed
towards the ability to control home energy,
and the H.E.M.S is the core of the
movement. We are focusing on automating
the system so that homeowner’s will focus
less on the tedious task of micro managing.
This will aid homeowners in preserving
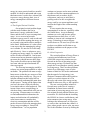
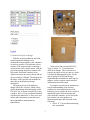
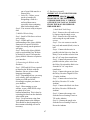
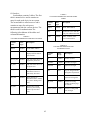
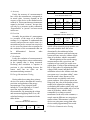
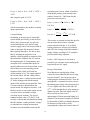
inevitable, seemingly visible within the
horizon. The problem lies with the abuse
and consumption of energy on all fronts
including residential, industrial, commercial,
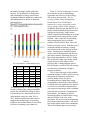
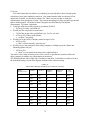
and transportation as shown in the charts
and table below:
Figure 1: 2011-2040 Energy Chart Prediction
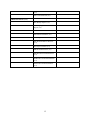
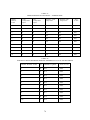
TABLE 1
2011-2040 ENERGY TABLE PREDICTION
Transportation Residential Commercial Industrial
2011
27.07915
21.61872
18.02055 30.59193
2015
27.18465
20.42446
17.90236 32.21262
2020
27.29584
20.61578
18.36953 34.75763
2025
26.75199
21.08274
19.03968 35.46427
2030
26.33264
21.6468
19.71522 35.11439
2035
26.53714
22.24838
20.37002 35.25559
2040
27.27158
23.07678 21.12988 36.15917
SOURCE [1]
The mainstreaming of renewable energy has
become a double edge; energy consumers
assume the world has the energy to abuse.
For immediate use, Americans have been
reducing their energy use from 2011 to
2015, but future projections and research
suggests that energy usage is increasing.
Engineers and scientist know for a fact that
resources are getting scarcer than ever.
2
energy in a more practical and less stressful
method. It is ideal to understand and accept
that homeowner’s need to have a home built
to preserve energy because their view of
energy consumption is different from an
engineers’.
continues to increase and as more residents
are able to afford the common appliances in
their homes such as washer, dryers,
refrigerators, and even ac unit, there is
growing need to be able to regulate the
energy used by our current appliances and
increase the length of the current standing
supply.
It is no surprise that our energy
consumption is on the rise, especially within
the United States. As our technology
continues to evolve and become greater
integrated into our daily lives, we will
continue to increase our consumption of
energy. Technology is not our biggest
worries however. We need a way to be able
to observe our habits and fix them as we
find them, and that was the purpose of the
H.E.M.S.
A. The Original Societal Problem
Our original societal problem began
with the need to address the rise in
homeowner’s energy within the United
States, and the lack of ways to manage their
usage. As we are moving towards
alternative energy sources, such as solar and
wind, we still need to manage the energy we
are currently using and be able to manage it
in the future. Maintenance of a solar system
is one aspect but also managing the energy
use is another. We need to do it efficiently
and effectively. Once we adopt new ways
of getting our energy supply, we would still
need to be able to maintain it. Just because
a homeowner has an alternative supply does
not mean, they should increase their usage.
They need to be able to turn on their lights
in a room when occupied and turned off
when unoccupied
The first step in managing would be
to know our current usage and how to adjust
our habits. The problem with most average
homeowners is that they are unaware of how
much energy they actually use. They see it
in dollar amounts on their utility bill but
don’t necessarily understand the main draw
of their power. Turning off the lights when
you leave the room is fairly obvious but
even simple tasks are often neglected. This
in turn creates excess wasted energy in
which our future cannot afford at the rate we
are growing. If homeowners were able to
see and understand this information, the
impact and realization will undoubtedly
cause homeowners to consider their
electricity consumption and thus will be
push to be more involved in managing their
energy usage according to “Smart Grid
Communications.” As our population
B. A New Perspective
The societal problem of Energy Waste is
a growing and troublesome issue in our
world. But our previous solution was too
focused on the idea of educating people
about energy savings. We know now that
people don’t care enough to actually commit
to saving energy. There are other problems
in their lives, and energy waste is at the
bottom of their list. We need to understand
that the appeal of saving energy is an
illusion to consumers that would vanish as
quickly as was their interest in it. The
advocacy and action of the energy saving
should be taken care of by us, the engineers.
The new societal problem solution is
focused more on the idea of creating a
foundation for future homes with the
motivation of preserving energy at its core.
Our original societal problem solution was
too narrow. We believed that the installing
the H.E.M.S in a house would educate, and
train consumers into saving energy. After
looking at the infrastructure of our project,
we came to the conclusion that a home is a
place where people come to relax, not stress.
We fix this dilemma of stress by shifting the
3
managing to the system, focusing on
automating. The energy saving solution will
be the responsibility of the H.E.M.S, not the
consumer.
According to an article titled “ 7 Trends in
Home Energy in 2013 and What They Mean
for 2014” [2], the ideal way to actively aid
homeowner’s in saving energy is to do it for
them. Homeowners want to come home, and
relax. By actively forcing consumers to
manage a system would only repel them
from wanting it. But if we appeal to the
consumers’ wallets and their simple nature,
it's a much more effective method. Instead
of focusing on a management system, we
should focus on a behavioral system; a
system that will adapt to the homeowner,
and their way of life, saving energy for
them.
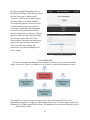
This is where our Design Idea comes in
with a feature list that luckily was able to
cater to the Societal Problem Shift. The
design of the H.E.M.S System stresses
automation, using at its forefront a mobile
website, accessible anywhere with internet
connection. From the mobile website,
consumers can initiate controls to the house
through a base station that communicates to
a mesh system of nodes. These nodes
contain current and voltage sensors that
calculate the power used by the devices, and
transfer it wirelessly back to the base station
using XBees. This information is then
displayed on the Mobile Website for the
consumer to see. The next section will
provide a much more extensive detailing of
the design idea, as well as its feature list.
consumer to actively engage in maintaining
a respectable energy consumption level. The
product of this would be educating the
consumers on how easy it is to waste
energy, and how their efforts can aid in its
reduction. With the shift in the societal
problem moving away from consumer
maintenance to an automated, simple
system, the team decided to focus on
pursuing the automation, levitating the
maintenance from the consumers to the
system (or ideally to the engineers.)
A. Feature List
Our feature list was design to
incorporate multiple capabilities to appeal to
the consumer. The concept of
interdependence applies little to our system
mainly because all parts are very dependent
on the base-station and the front and back
end to fully function.
Measure total house energy
consumption
Measure selective target device’s
energy consumption
Measure temperature inside the
home
Store historical energy measurement
data at a set interval
Send a text message to user when
individual device's energy
consumption is abnormally high or
low
Mobile Web Interface capable of
providing controls and data to the
homeowners:
o Displays total house energy
consumption
o Displays individual items as
percentage of total
consumption
o Displays temperature inside
and outside the house
o Allows user to turn on/off
individual devices
III. DESIGN IDEA
The design of the H.E.M.S. was based
originally on the concept of controlling
energy with substantial responsibility on the
consumer. It was to provide strict controls
and energy data that would allow the
4
o
Allows user to set
temperature for heating and
air conditioning
o Allows user to enter
“vacation” or “low power”
mode which will:
Set the thermostat to a
predefined amount
based on the outside
temperature
Turn off a
preconfigured set of
devices
o Authentication.
Utility control to send a "flex alert"
to put all houses into a low power
state.
The feature list can be broken down into two
sections; hardware and software.
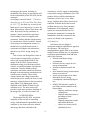
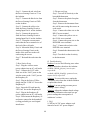
Website covers these features with their
corresponding page:
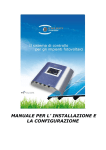
Figure 2: Outlet Page
1. Allowing users to turn on/off
individuals’ devices
2. Displaying individual items as a
percentage of total consumption
3. The display of total house energy
consumed
B. Software Top Level Design
The software portion consists of all
components relevant to the Mobile Website
Interface as well as the utility flex alert. The
team is using a mobile optimized website as
the user interface instead of an app for
several reasons. There are many different
mobile operating systems that one would
have to consider when designing an app.
Apple products have their operating system
known as the IOS, as well Google, which
uses the Android platform. These are the
two mobile operating systems that make up
the majority of the mobile market. The team
would have to design two separate apps with
different languages and functions to be
useable on both platforms resulting in
hundreds of more hours of research and
work. With a Mobile Optimized Website,
any operating system can access it as longs
as it can access the internet.
The Mobile Website is created using
jQuery Mobile libraries, HTML, PHP
scripts, and AJAX. The widgets use jQuery
mobile designated tools that allow easy to
implement and use controls. The Mobile
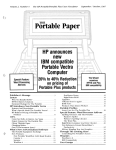
Figure 3: T-Stat Page
1. Allow users to set temperature for
heating and air conditioning
2. Display the temperature inside and
outside the house
Figure 4: Low Power Mode Control
5
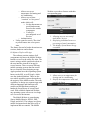
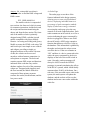
Figure 7: Registration Page
Figure 5: Low Power Mode Settings
1. Allow user to enter a "Low Power"
or "Vacation Mode" mode
The mobile website will be accessing a
database to store and take information from.
The website and MySQL database was
originally stored on a raspberry pi, but
thanks to our online integration, the database
and the website are both online and working
efficiently. In spring 2014, the team with
the help of the newest member Billy
Saeteurn implemented the authentication
system as well as a register system for new
users, and a password retrieval system.
Figure 8: Password Retrieval Page
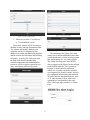
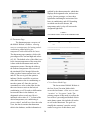
The inclusion of the Utility Flex Alert
control was to add an additional feature that
would demonstrate a critical warning system
that would initiate if it was vastly needed.
The Utility Flex Page uses basic HTML
code as oppose to the jQuery format utilized
on the Mobile Website. This is primarily
because we do not need to implement
mobile use, as utility companies primarily
use computers for security reasons. It uses a
pre-configured default setting that shuts off
all outlets and sets the thermostat to a value
of 78 when activated. These values and
operations are configurable in the code.
Here is the login page, and the Low Power
Page:
Figure 9: Utility Login Page
Figure 6: Authentication Page
6
Figure 11: Project Frame
Figure 10: Low Power Activation Page
C. Hardware Top Level Design
With the societal problem in mind, the
team designed the hardware to be
mainstreamed and relatable to the consumer
as much as possible. The hardware section
consists of the separate nodes containing a
current sensor and a voltage sensor, with the
goal of measuring the power consumed for
each outlet. Each node consisted of an
Arduino to run the necessary sketch, and are
all powered by a USB hub. The blueprint for
the nodes will be specified in the hardware
and software deployable prototype
description.
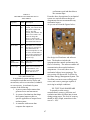
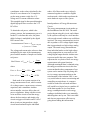
The primary focus of the hardware
design will be the A-Frame, which will be
used to demonstrate the functionality of the
H.E.M.S. The A-Frame from fall 2013 used
a single 4 feet by 3 feet wood board that had
a breaker box attached to it. There were two
outlets and a thermostat system that used
three light bulbs to demonstrate its
functionality.
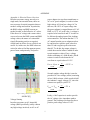
Figure 12: Separate Outlet
At the end of last semester/Fall 2013,
Team 11 had a 4’ x 3’ board that was
difficult to manage. This was because it
required an object to lean on, and as a result,
it would risk damaging the nodes. By the
end of spring 2014, the final design
implementation included two metal legs for
support, and two separate outlet boards to
demonstrate the mesh system.
To properly account for the adjustments
to their understanding of the societal
problem, the team adjusted some of the
hardware pieces to make the device easier to
install and require little knowledge and
effort from the consumer. At the end of the
last semester, the team produced a
laboratory prototype that consisted of the
following:
One 4’ X 3’ plywood board housing
the components
7
Breaker box containing four breakers
connected to the following:
o Whole house
o HVAC
o Two wall outlets
Two standard 120V AC wall outlets
Three 60 watt light bulbs to simulate
the heater, condenser and fan of an
HVAC system.
Arduino-based thermostat
One Arduino node device connected
to each outlet.
One XBee node device connected to
each outlet.
One Raspberry Pi with connected
XBee acting as the home controller.
To properly measure the voltage from
the wall outlets, the team simply plugged a
step-down transformer directly into the
outlet. To power the Arduino node devices,
the team connected a 120V AC to 5V DC
power adapter to lines available in the
breaker box and used a USB hub to spread
power to the various node devices The team
also wanted like to remove the USB hub
requirement for power (and thus, low
voltage wire running throughout the back)
and have each of the node devices be
powered through their local power source.
Unfortunately, the team attempted to "daisychain" and as a result the power system
failed. The team resorted back to the USB
hub. This semester the team also attempted
to implement stand-alone Arduino, but after
designing and creating them, it became a
dead end. This is due to several stand-alone
Arduinos burning out too quickly, resulting
in the return of the original Arduino Unos.
As of today, the design of the Home
Energy Management System is cater to the
consumers. The team has reduced the “wire
jungle” of the back by implementing a clean
PVC pipe system. The backend of the AFrame no longer has any wire risk. The team
also included a fan system to be
demonstrated as the blower, a red light bulb
to showcase the heater, and a blue one to
showcase A/C. The final product will be
showcased at the Trade Show Presentation
on May 12th, 2014. With the all different
devices and pieces used to create the AFrame and the H.E.M.S, it is vital to
document all purchases to total the final
cost.
The next section, Funding Proposals, will
discuss all the devices and hardware bought
to create the Home Energy Management
System. The total cost of the system as well
as the failed/unnecessary hardware that were
bought will be included.
IV. FALL 2013
In the fall semester, we started out with
only four members. The original 4 members
were Va Banh, Logan Odell, Waleng Vang,
and Sean O'Hara. When we first discussed
the concept of buying what devices and
hardware, we wanted to keep it as cheap as
possible. But we soon realize things never
go the way we expect. As time went by,
some devices failed to meet our
expectations, while others failed to operate
completely. For example, we initially had a
NEST Thermostat, but its API was neither
operational nor available to the public until
2014. We then bought a thermostat that
stated it had an operational API from EBay.
When we received it, we discovered that the
API module was separate. So we did the
most logical step from there; we bought that
API Module. Then it turned out that the API
module used an archaic and practically
unknown language, which led 2 of our
teammates spending hours attempting to
decipher it only to realize that the time
wasted could have been spent on creating an
Arduino based thermostat. And that they
did. So, the lesson here is to plan way ahead
for the unexpected, and plan intelligently
and economically. We had many other
purchases which we used to make our
laboratory prototype which will be discussed
next.
8
V. FUNDING-FALL 2013
This is the list of purchases the TEAM
has done in the fall 2013. Take into
consideration that this list has several pieces
of hardware that were used for trial-anderror purposes, and over time we found
better more efficient devices that would
allow our system to operate smoother.
Logan Odell:
4x Non-Invasive Current Sensor - 100A $56.40
TOTAL $85.26
Va Banh:
USB Keyboard for RPi $11.88
6' Grey Power Supply Cord
$8.37
Outlet Box
$0.39
3/8 Clamp connector
$1.55
4" Oct. Box COVER
$0.65
SD Card for RPi
$6.79
Oct Box Junction Box
$1.14
Power Adapter for RPi
$2.95
Plastic Keyless Lamp Holder
$1.28
3x XBee S2 $57.00
3/8 Clamp Connector x 2
$3.10
XBee breakouts and headers $18.54
White Switch Wall Plate
$0.28
Breaker Homeline 40A 2-Pole
$8.25
Breaker Homeline Tandem 15/20A
$8.48
Breaker Homeline Tadem 15A 1-P
$8.48
3-way toggle switch
$1.78
Outlet Box connect to Drywall x 3
$2.94
Wi-Fi USNAP module $54.00
VA GAVE LOGAN -$40.00
3x XBees $57.49
Thermostat Relays $41.59
TOTAL $210.24
100A 6/12 Circuit inducer Lug (BREAKER
PANEL) $17.64
Waleng Vang:
4'x8' Plywood $10.20
Radio Thermostat CT30 $47.00
Heavy Duty Binder $11.49
8 Section Dividers $5.00
TOTAL $63.49
16/2 6' White Cube Tap Ext Cord
$1.57
Female disconnect 75pk
$5.37
Porcelain Keyless Lamp Holder x 2
$2.98
18/24 VAC ADAPTER $25.99
Sean O’Hara:
HOBBY LEADS ASSY
$4.99
PK2 1N4003 DIODES
$1.49
PK2 1N4742 12V1W
$1.99
PK5 9V BAT CLIPS
$2.99
SPDT 7-9V 2L RELAY
$4.97
1x Non-Invasive Current Sensor - 30A $13.99
1x 9V AC-AC Power Adapter $10.80
6x Plastic Enclosures $4.07
9
9V 1PK ALKALINE ENERCELL (x4)
relevant information from the Mobile
Website and the XBees. When the
information is able to be stored, we can start
on the Mobile Optimized Web Page. We can
pass the data to the database which will lead
us to our next milestone. Node-Arduino
Sketch consists of the relay control, X-Bees,
and the measuring of devices. Those three
are the top main milestone because they
make up the entirety of our main project.
Without those three milestones our project
would not be possible. Now we move onto
the Features milestone which will help
enhance our project. First will be the
HVAC Simulation which is the least amount
of time spent because Va had already known
how to build it. In order to control the
HVAC simulation, the team needed a
thermostat that would be compatible with
the project. We would either buy one or
build one. As stated earlier we attempted to
buy one but the product was unusable and
not applicable to our prototype. In the end,
the team built their own.
Another milestone set was to implement
a weekly due date for certain tasks. Every
week meant that a piece of documentation
was completed. Tasks that were not done
this semester were continued onto the next
semester Work Breakdown Structure. But,
of course we are aiming to get everything
done this semester that we had planned. We
will get in more depth about our Work
Breakdown Structure in the next section.
$9.98
GAVE LOGAN $40.00
TOTAL $187.03
Complete Total Cost of Purchases at End of
Fall 2013: $546.02
The team has agreed to carry the purchases
through until the end of the semester. When
the semester ends, the total cost will be
averaged, and those who are above the
average will be compensated by those who
are below it. The next section will discuss
the milestones of Fall 2013.
VI. MILESTONE-FALL 2013
The idea of milestones is to function as a
checkpoint to visually and spiritually
applaud the team for completing a
significant piece of the prototype. It is also
meant to set goals and give focus to the
team. The following are milestones in the
Work Breakdown Structure for Fall 2013:
1. Database Creation
2. Mobile Optimized Web Page
3. Nodes-Arduino Sketch (relay
controls, XBee, Measure devices)
4. HVAC Simulation
5. Thermostat
6. SMS
7. Project Frame
8. Documentation
In Fall 2013, the team needed to have
the Database up and running to store the
10
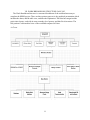
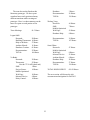
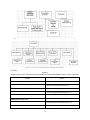
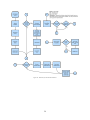
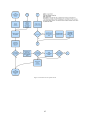
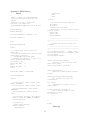
VII. WORK BREAKDOWN STRUCTURE-FALL 2013
The Work Breakdown Structure is a structural breakdown of the workload necessary to
complete the HEMS project. There are three primary parts to it; the graphical presentation which
includes the charts, and the table view, and then the explanation. The team has categorized the
project into 6 parts, each with its own secondary level spawns, and third level structures. The
first portion is a hierarchical view of the workload composed of chart.
A. Charts
Figure 13: Level 0 Tier and Its Corresponding Level 1 Structures
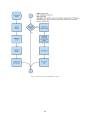
Figure 14: Level 1 Tier “Wireless Nodes” and Its Corresponding Level 2 Structures
Figure 15: Level 1 Tier “Base Station” and Its Corresponding Level 2 Structures
11
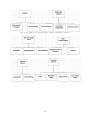
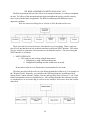
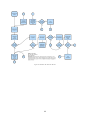
Figure 16: 2 Tier “Database” and “Mobile Web Interface” and their Corresponding Level 3 Structures
Figure 17: Level 1 Tier “Abnormal Usage Check” and “Node Communication” and their Corresponding Level 1 Structures
Figure 18: Level 1 Tier “Utility Web Interface” and “Presentation Structure” and their Corresponding Level 2 Structures
12
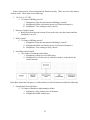
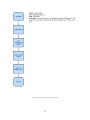
Figure 19: Level 1 Tier “Thermostat” and their Corresponding Level 2 Structures
Figure 20: Level 1 Tier “Documents” and their Corresponding Level 2 Structures
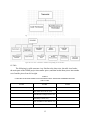
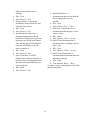
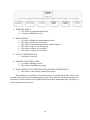
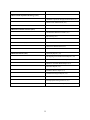
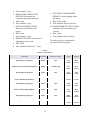
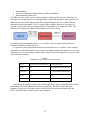
B. Table
The following is a table structure view. Similar to the chart view, the table view breaks
the main parts of the HEMS project into smaller pieces, and then breaks those pieces into another
set of smaller pieces from left to right.
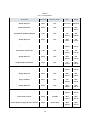
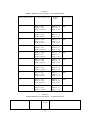
TABLE 2
OVERVIEW FOR HOME ENERGY MANAGEMENT FIRST SEMESTER WORK BREAKDOWN
STRUCUTRE
Level 1
Level 2
HEM1: Wireless Nodes (20%)
1.1: 120V AC to 9V AC (5%)
1.2: Measure Voltage/Current (5%)
1.3: Relay Control (5%)
1.4: Send Data to Base Station (5%)
HEM2: Base Station (40%)
13
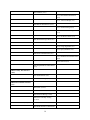
Level 3
2.1: Database (10%)
2.1.1: Data Insertion/Extraction
(5%)
2.1.2: Structure/Design (5%)
2.2: Mobile Web Interface (10%)
2.2.1: Structure/Design (4%)
2.2.2: “Low Power” Configuration
(3%)
2.2.3: Set Device Names (3%)
2.3: Abnormal Usage Check (8%)
2.3.1: Send SMS (2%)
2.3.2: Usage Algorithm (3%)
2.3.3: Query Database (3%)
2.4: Node Communication (8%)
2.4.1: Database Insertion/Extraction
(4%)
2.4.2: Protocol (4%)
2.5: Setup/Install OS and Software
(4%)
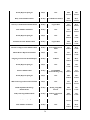
HEM3: Utility Web Interface
(10%)
3.1: Authentication (5%)
3.2: Structure/Design (5%)
HEM4: Presentation Structure
(9%)
4.1: Frame (2.25%)
4.2: Breaker Box/ Outlets (2.25%)
4.3: Electrical Wiring (2.25%)
4.4: Device Hookup/ Testing
(2.25%)
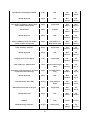
HEM5: Thermostat (10%)
5.1: Build Structure of Thermostat
14
(5%)
5.2: Code Thermostat (5%)
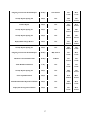
HEM6: Documents (11%)
6.1: Weekly Reports (1%)
6.2: Outgoing Team Leader Written
Report (1%)
6.3: Team Member Evaluation (1%)
6.4: Problem Statement (1%)
6.5: Design Idea Contract (1%)
6.6: Work Breakdown Structure
(1%)
6.7: Project Timeline (1%)
6.8: Bread Board Proof (1%)
6.9: Mid-Term Technical Review
(1%)
6.10: End of Term Documentation
(1%)
6.11: End of Term Presentation
(1%)
15
C. First Semester WBS ~Allocation
Overview
The following overview will explain the
details of each task, the designated person
who is responsible for its completion, and
the time frame in which the task is to be
completed.
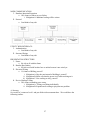
~ TOP LEVEL (Lvl.0)~
HOME ENERGY MANAGEMENT
SYSTEM
The highest level of the chart is the entirety
of the project. As stated before, “We are
creating a home energy management system
that will track and display homeowner’s
energy usage, and provide energy saving
controls to the consumer.”
Who: The Team
Time Allotted: 15 weeks
LEVEL 1 Component
a. WIRELESS NODES: The
component that collects the energy
data based on the device
LEVEL 2 COMPONENTS of Wireless Nodes
1. 120V AC TO 9V AC: A conversion
tool that will convert 120V AC to 9V
AC
Who: Sean O’Hara
Time Allotted: 3 days
2. MEASURE VOLTAGE/CURRENT:
A tool that will measure the
voltage/current of a device
Who: Sean O’Hara
Time Allotted: 3 Days
3. RELAY CONTROL: A tool that will
allow talking between a device and
webpage
Who: Va Banh
Time Allotted: 4 days
4. SEND DATA TO BASE STATION:
A software and hardware
implementation using XBees that
will allow communication between
the XBees and the Base Station.
Who: Logan Odell
Time Allotted: 6 days
LEVEL 1 Component
b. BASE STATION: One of the two
core presentable component of the
project, the base station is the front
end and back end of our software
LEVEL 2 COMPONENTS of Base Station
1. DATABASE: The software room
that will store the information
gathered from the XBees and Relay
controls
Who: Logan Odell
Time Allotted: 5 days
LEVEL 3 COMPONENTS of Database
1. DATABASE
INSERTION/EXTRACTION: The
Insertion and extraction of data from
and to the XBees to the database.
Who: Logan Odell
Time Allotted: 5 days
2. STRUCTURE/DESIGN: The design,
layout, and building of the database
Who: Waleng Vang, Logan Odell
Time Allotted: 4 days
3. MOBILE WEB INTERFACE: The
front end of the project, the Mobile
Web Interface bridges the user to
his/her device controls
LEVEL 3 COMPONENT of Mobile Web
Interface
1. STRUCTURE/DESIGN: The basic
layout, design, and building of the
Mobile Web Interface.
Who: Waleng Vang
Time Allotted: 5 days
16
2. “LOW POWER”
CONFIGURATION: An algorithm
that will set all devices to a low
power state
Who: Waleng Vang
Time Allotted: 3 days
3. SET DEVICE NAMES: A set of
code within the Mobile Website that
will allow the user to set up new
devices
Who: Waleng Vang
Time Allotted: 3 days
LEVEL 2 COMPONENT of Base Station
2. ABNORMAL USAGE CHECK: An
algorithm that will register the data
of a device and compare it in set
intervals in order to diagnose if the
device is damaged.
Who: Waleng Vang, Va Ban
Time Allotted: 4 days
LEVEL 3 COMPONENTS of Abnormal
Check
1. SEND SMS: An alert that will tell
the user if any devices are not
operating correctly or safely.
Who: Waleng Vang, Va Banh
Time Allotted: 4 days
2. USAGE ALGORITHM: An
algorithm that will read and store the
normal data of a device and compare
it to the device in set time intervals
to check if it is operating normally.
Who: Waleng Vang, Va Banh
Time Allotted: 8 days
3. QUERY DATABASE: An algorithm
that will read through the database to
grab specific information
Who: Waleng Vang
Time Allotted: 4 days
LEVEL 2 COMPONENT of Base station
4. NODE COMMUNICATION: The
building and communication
between XBees that will allow
communication between different
components of the project.
Who: Sean O’Hara, Logan Odell
Time Allotted: 20 days
LEVEL 3 COMPONENTS of Node
Communication
1. DATABASE
INSERTION/EXTRACTION: An
algorithm that will insert and extract
information between XBees and the
database.
Who: Logan Odell
Time Allotted: 3 days
2. PROTOCOL: A set of protocols that
will set up the TCP connection
Who: Logan Odell
Time Allotted: 2 days
3. SETUP/INSTALL OS AND
SOFTWARE: The Setup of the
XBees and its allied component, the
Raspberry Pi.
Who: Logan Odell
Time Allotted: 2 days
LEVEL 1 COMPONENT
c. UTILITY WEB INTERFACE: The web
page built exclusively for the utility
company that will have access to the flex
alert
~ LEVEL 2 COMPONENTS of the Utility
Web Interface ~
1. AUTHENTICATION: The security
system that will be implemented into
the Utility Web Page
Who: Sean O’Hara, Logan Odell
Time Allotted: 6 days
17
2. STRUCTURE/DESIGN: The basic
design and structure of the Utility
Web Page
Who: Sean O’Hara, Logan Odell
Time Allotted: 7 days
LEVEL 1 COMPONENT
d. PRESENTATION STRUCTURE: The
second presentable component of the
project, the Presentation Structure is
framework of the project’s hardware all
in one.
Who: The Team
Time Allotted: 10 days
LEVEL 2 COMPONENT of Presentation
Structure
1. FRAME: A wooden board that will
be comprised of the working
hardware components of the project
Who: Va Banh
Time Allotted: 7 days
2. BREAKER BOX/OUTLETS: The
installation of outlets and breaker
boxes into the Frame.
Who: The Team
Time Allotted: 5 days
3. ELECTRICAL WIRING: The
wiring of the frame to the breaker
boxes, outlets, and devices.
Who: The Team
Time Allotted: 6 days
4. DEVICE HOOKUP/TESTING: The
testing of the frame and the website.
This is done after all other
components are finished.
Who: The Team
Time Allotted: 4 days
LEVEL 1 COMPONENT
e. THERMOSTAT: Nest Thermostat did
not work, CT-30 Radio Thermostat did
not work, Ended up building a
thermostat to accommodate for our
database.
Who: Logan Odell
Time Allotted: 14 days
LEVEL 2 COMPONENT OF Thermostat
1. BUILD STRUCTURE OF
THERMOSTAT: Basic structure of
thermostat built used to control the
HVAC
Who: Logan Odell
Time Allotted: 7 days
2. CODE THERMOSTAT: Code that
will drive the thermostat to do
heating, cooling, auto fan or on.
Who: Logan Odell
Time Allotted: 7 days
LEVEL 1 COMPONENT
f. DOCUMENTS: Documentation of the
project regarding it purpose, design,
work breakdown, and more.
Who: TEAM
Time Allotted: 15 weeks
LEVEL 2 COMPONENTS
1. Weekly Reports: Weekly reports
designed to document the team’s
progression.
Who: Team
Time Allotted: Each Week ~ 7 days
2. Team Member Evaluation: Evaluate
each team member even yourself.
Who: Team
Time Allotted: half a semester
3. Outgoing Team Leader Written
Report: Leader outgoing report
document.
Who: Team Leader
Time Allotted: End of your Rule
4. Problem Statement: A document
entailing the scope of our project;
18
what societal problem we are
tackling.
Who: Team
Time Allotted: 7 days
5. Design Contract: A document
detailing the design, hardware, and
software of the project.
Who: Team
Time Allotted: 7 days
6. Work Breakdown Structure: A
document detailing the task and
breakdown of the project. It presents
the project in a Divide and Conquer
state, tasking specific individuals to
each task and allotting a specific
time to complete it.
Who: Team
Time Allotted: 7 days
7. Project Timeline: A GANTT
diagram showcasing the timeline of
how the project is being approached,
the entire task, and the date they are
to be completed.
Who: Team
Time Allotted: 7 days
8. Bread Board Proof: A
demonstration that you can build the
major component as soon as
possible.
Who: Team
Time Allotted: Week ~ 7 days
9. Mid-Term Technical Review: A
demonstration that majority of your
feature is done.
Who: Team
Time Allotted: 4 Week ~ 14 days
10. End of Term Documentation: A
document about everything you have
done so far.
Who: Team
Time Allotted: 2 Week ~ 14 days
11. End of Term Presentation: A
demonstration/Presentation about our
laboratory prototype.
Who: Team
Time Allotted: Week ~ 7 days
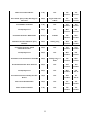
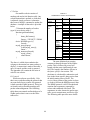
To make it easier to understand we provided
the following table:
19
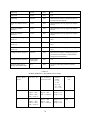
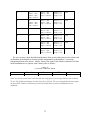
TABLE 3
FALL ASSIGNMENTS
Task Name
Duration
Resource Names
Start
Finish
Weekly Report #1
5 days
ALL
Tue 9/3/13
Sun 9/8/13
Problem Statement
5 days
ALL
Tue 9/3/13
Mon
9/9/13
Presentation :Problem Statement
1 day
ALL
Tue
9/10/13
Tue
9/10/13
Weekly Report #2
6 days
ALL
Mon
9/9/13
Sun
9/15/13
Design Idea Contract
5 days
ALL
Tue
9/10/13
Mon
9/16/13
Presentation: Feature List
1 day
ALL
Tue
9/17/13
Tue
9/17/13
Weekly Report #3
6 days
ALL
Mon
9/16/13
Sun
9/22/13
Work Breakdown Structure
5 days
ALL
Tue
9/17/13
Mon
9/23/13
Setup & Configure Raspberry Pi
6 days
Logan Odell
Mon
9/23/13
Sun
9/29/13
Weekly Report #4
6 days
ALL
Mon
9/23/13
Sun
9/29/13
Project Timeline
5 days
ALL
Tue
9/24/13
Mon
9/30/13
Weekly Report #5
6 days
ALL
Mon
9/30/13
Sun
10/6/13
Setup XBEE
6 days
Logan Odell
Mon
9/30/13
Mon
10/7/13
Nodes: Relay Control
6 days
Va Banh
Mon
9/30/13
Mon
10/7/13
Nodes: Measure Voltage, Measure Current
6 days
Sean O’Hara
Mon
9/30/13
Mon
10/7/13
20
Breadboard Proof Setup/Presentation
1 day
ALL
Tue
10/8/13
Tue
10/8/13
Weekly Report #6
6 days
ALL
Mon
10/7/13
Sun
10/13/13
Base Station: Send/Receive Data to/from
Nodes (Arduino Sketch Part2)
4 days
Logan Odell
Wed
10/9/13
Mon
10/14/13
Nest Interface
6 days
Va Banh
Tue
10/8/13
Tue
10/15/13
Weekly Report #7
6 days
ALL
Mon
10/14/13
Sun
10/20/13
Nodes: Send/Receive Data to/from Base
Station (Arduino Sketch Code)
9 days
Sean O’Hara, Va
Banh, Logan Odell
Wed
10/9/13
Mon
10/21/13
Utility Web Page: Structure
8 days
Logan Odell
Thu
10/17/13
Sun
10/27/13
Weekly Report #8
6 days
ALL
Mon
10/21/13
Sun
10/27/13
Outgoing Team Leader Report
1 day
Logan Odell
Tue
10/29/13
Tue
10/29/13
Utility Web Page: Authentication
7 days
Sean O’Hara, Logan
Odell
Sun
10/27/13
Sun
11/3/13
Abnormal Current Notification: Algorithm
to Determine Abnormal Usage
6 days
Va Banh, Waleng
Vang
Mon
10/28/13
Sun
11/3/13
Weekly Report #9
6 days
ALL
Mon
10/28/13
Sun
11/3/13
CT30-Thermostat API Coding
10 days
Logan Odell, Va
Banh
Tue
10/22/13
Mon
11/4/13
Built Thermostat (usable for Project)
6 days
Logan Odell
Mon
11/4/13
Sat
11/9/13
Weekly Report #10
6 days
ALL
Mon
11/4/13
Sun
11/10/13
Base Station: Insert/extract data to/from
database
5 days
Logan Odell, Waleng
Vang
Tue
11/5/13
Mon
11/11/13
Mobile Web Page: Structure
32 days
Waleng Vang
Mon
9/30/13
Tue
11/12/13
21
Mid Term Technical Review
1 day
ALL
Tue
11/12/13
Tue
11/12/13
Base Station: Query Utility Web Page for
Flex Alert
9 days
Logan Odell, Sean
O’Hara
Fri
11/1/13
Wed
11/13/13
Team Member Evaluation
1 day
ALL
Thu
11/14/13
Thu
11/14/13
Weekly Report #11
6 days
ALL
Mon
11/11/13
Sun
11/17/13
Presentation Structure: Build Frame
20 days
Va Banh
Tue
10/22/13
Mon
11/18/13
Abnormal Current Notification: Query
Database
4 days
Waleng Vang
Wed
11/13/13
Mon
11/18/13
Presentation Structure: Install
Outlets/Breaker Box
5 days
ALL
Thu
11/14/13
Wed
11/20/13
Weekly Report #12
6 days
ALL
Mon
11/18/13
Sun
11/24/13
Abnormal Current Notification: Send SMS
5 days
Waleng Vang, Va
Banh
Tue
11/19/13
Mon
11/25/13
Presentation Structure: Wire Electrical
6 days
ALL
Thu
11/21/13
Thu
11/28/13
Weekly Report #13
6 days
ALL
Mon
11/25/13
Sun
12/1/13
Presentation Structure: Hookup and Test
Devices
7 days
ALL
Thu
11/28/13
Fri
12/6/13
End of Term Documentation
3 days
ALL
Fri
12/6/13
Tue
12/10/13
End of Term Presentation
1 day
ALL
Tue
12/10/13
Tue
12/10/13
22
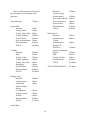
The team has worked hard on this
laboratory prototype. We have spent
countless hours and experienced many
different emotions while creating our
prototype. Here is a short summary on the
hours we spent on each portion of our
prototype.
Team Meetings:
81.5 Hours
Logan Odell:
Research:
Building Thermostat:
Help on Website:
Arduino Sketch:
Database Creation:
Documentation:
TOTAL:
20 Hours
16 Hours
27 Hours
11 Hours
61 Hours
25 Hours
160 Hours
Database:
Documentation:
TOTAL:
Waleng Vang:
Research:
SMS:
Mobile Optimized
Web Page:
Database Help:
Documentation:
TOTAL:
Sean O'Hara
Research:
Mobile Optimized
Web Page:
Measure Device:
Arduino Sketch:
Database Help:
Documentation:
TOTAL:
Va Banh:
Research:
38 Hours
Thermostat:
25 Hours
Nest & CT-30 API (dead end)
SMS:
1 Hour
Project Frame:
14 Hours
Mobile Optimized
Web Page:
10 Hours
Measure Device:
4 Hours
Relay Control:
14 Hours
TOTAL HOURS SPENT:
3 Hours
29 Hours
138 Hours
44 Hours
7 Hours
54 Hours
8 Hours
34 Hours
147 Hours
47 Hours
8 Hours
22 Hours
6 Hours
20 Hours
27 Hours
130 Hours
656.50 Hours
The next section will discuss the risk
assessment and mitigation for Fall 2013.
23
VIII. RISK ASSESSMENT & MITIGATION-FALL 2013
The Risk Assessment discusses the effects of an unwanted outcome, or a task not completed
on time. The effects of this uncompleted task ripple throughout the project, possibly causing
more issues with the future assignments. The Risk assessments present different ways to
approach a problem.
Risk Assessment and Mitigation in relation to Work Breakdown Structure
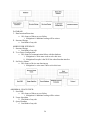
Figure 21: Level 0 Tier and Its Corresponding Level 1 Structures
There is no risk in level one because it is the broad view of everything. There is only one
part of level one that the team can scrutinize and that would be the NEST Interface. The reason
why we could do it at this time is because there are no branches under it. The risk of using the
NEST Interface is as follows:
1. NEST INTERFACE:
a. 50% chance in not working with the base station
i. Mitigation A: using a different thermostat
ii. Mitigation B: building one that would meet our needs
In the end we built our own Thermostat to accommodate for our needs.
The other part where all the risk is at is the following branches of that level. For example, in
the "Wireless Nodes” hierarchy, we would have the following branches: Send Data to Base
Station, Relay Control, Measure Voltage /Current, and step down from 120vac to 3.3 vdc. Each
branch is dependent on its own children leaves. After all those branches are taken into account,
we can then move on to see how big of a risk level one would be. So let move on to the wireless
nodes first.
Figure 22: Level 1 Tier “Wireless Nodes” and Its Corresponding Level 2 Structures
24
In the wireless nodes, I have mentioned four branches already. There are a few risks in these
wireless nodes. Those risks are the following:
1. 120 VAC to 3.3 VDC
a. 1% chance of Killing yourself
i. Mitigation A: Buy the part instead of building it yourself
ii. Mitigation B: Make sure that the power is off when working on it
iii. Mitigation C: Not working on it by yourself
2. Measure Voltage/Current
a. Really no risk on this part because all we need to do is buy the sensors and that
should take care of it.
3. Relay Control
a. 1% chance of Killing yourself
i. Mitigation A: Buy the part instead of building it yourself
ii. Mitigation B: Make sure that the power is off when working on it
iii. Mitigation C: Not working on it by yourself
4. Send Data to Base Station
a. 10% chance of communication failure
i. Mitigation A: Bring our own WIFI router
ii. Mitigation B: Cover the receiver with foil to make it work (blocks out
school network)
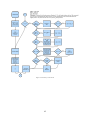
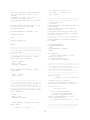
Figure 23: Level 1 Tier “Base Station” and Its Corresponding Level 2 Structures
In the Base station the only part we could scrutinize for risk assessment would be the following:
1. Setup/Install OS and Software
a. 5% chance of Hardware implementation failure
i. Mitigation A: Buy another piece of hardware
ii. Mitigation B: Build another piece
25
Figure 24: Level 2 Tier “Database” and “Mobile Web Interface” and their Corresponding Level 3 Structures
DATABASE:
1. Data Insertion/Extraction
a. 10% chance of library access failure
i. Mitigation A: additional coding will be written
2. Structure/Design
a. Can't think of any risk
MOBILE WEB INTERFACE:
1. Structure/Design
a. Can't think of any risk
2. "Low Power Configuration"
a. 20% chance of communication failure with the database
i. Mitigation A: Write more code to solve this issue
ii. Mitigation B: maybe it the Wi-Fi the school has that interfere
3. Set Device Names
a. 20% chance of device not showing up
i. Mitigation A: write more code to solve this issue
Figure 25: Level 1 Tier “Abnormal Usage Check” and “Node Communication” and their Corresponding Level 1 Structures
ABNORMAL USAGE CHECK:
1. Send SMS
a. 10% chance of library access failure
i. Mitigation A: additional coding will be written
2. Usage Algorithm
a. Can't think of any risk
3. Query Database
a. Can't think of any risk
26
NODE COMMUNICATION:
1. Database Insertion/Extraction
a. 10% chance of library access failure
i. Mitigation A: additional coding will be written
2. Protocol
a. Can't think of any risk
Figure 26: Level 1 Tier “Utility Web Interface” and “Presentation Structure” and their Corresponding Level 2 Structures
UTILITY WEB INTERFACE:
1. Authentication
a. Can't think of any risk
2. Structure/Design
a. Can't think of any risk
PRESENTATION STRUCTURE:
1. Frame
a. No risk at all with the frame
2. Breaker Box/Outlets
a. NO risk at all with breaker box or outlets because it not wired yet
3. Electrical Wiring
a. 1% chance of Killing yourself
i. Mitigation A: Buy the part instead of building it yourself
ii. Mitigation B: Make sure that the power is off when working on it
iii. Mitigation C: Not working on it by yourself
4. Device Hookup/Testing
a. 50% chance something goes wrong
i. Mitigation A: Testing everything individually
ii. Mitigation B: Expand on our testing to pin point our problem
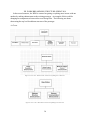
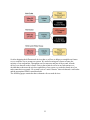
A. Summary
So overall, let’s return to level 1 and put all the risk assessment there. We would have the
following outline:
27
Figure 27: Level 0 Tier “Home Energy Management” and their Corresponding Level 1 Structures
1. WIRELESS NODES
a. 10% chance of communication failure
b. 1% chance of Killing yourself
2. BASE STATION
a. 5% chance of Hardware implementation failure
b. 10% chance of library access failure
c. 20% chance of communication failure with the database
d. 20% chance of device not showing up
e. 10% chance of library access failure
f. 10% chance of library access failure
3. UTILITY WEB INTERFACE
a. Can't think of any risk
4. PRESENTATION STRUCTURE
a. 1% chance of Killing yourself
b. 50% chance something goes wrong
5. NEST INTERFACE (IN THE END BUILD OUR OWN THERMOSTAT)
a. 50% chance in not working with the base station
After taking into consideration of each branches we concluded that the base station is the
part that has the most risk of something going wrong. Pretty much the communication between
our devices is from the brain of our operation which is the Base Station that relays everything to
other component of our product.
28
IX. SPRING 2014
During the spring semester, we needed
to buy new parts to replace old parts as
several devices were unusable or destroyed.
The team also bought new parts and services
to enhance the project including the new
mobile frame and PCB fabrication. We have
added a substantial amount to this
semester’s cost but it was necessary in order
to complete the project. The list following
below is the list of purchases the TEAM has
done only in the spring.
Home Depot (A-frame) $61.27
Office Max (sticky)
$9.75
Home Depot (separate frames) $42.37
TOTAL $222.13
Billy Saetern:
SaintSmart 4-Channel Relay Module $14.58
TOTAL $14.58
Complete Total Cost of Purchases End of
Spring 2014: $470.28
When the semester ends and our project has
been completed, the total cost will be
averaged, and those who are above the
average will be compensated by those who
are below it.
X. FUNDING-SPRING 2014
Logan Odell:
4x USB Power Adapters
DigiKey minor parts
DigiKey minor parts + XBee and relay
Seeedstudio PCB Fabrication
TOTAL
$22.76
$5.06
$41.51
$18.61
$87.94
XI. MILESTONE-SPRING 2014
The following are milestone in our Work
Breakdown Structure for Spring 2014:
1. SMS
2. Project Frame
3. Testing/Enhancing
4. Documentation
SMS is a milestone that we did not finish in
fall 2013. Hence, it is a milestone now. The
Project Frame has the flexibility of being
enhanced upon daily. Testing/Enhancing is
another big milestone. After testing we can
conclude whether each feature is up to par or
if it needs to be enhanced to make it better.
Documentation is a small milestone. There
always something due every week.
Waleng Vang:
USB hub $19.99
Diodes $1.98
Bread Board $19.99
TOTAL $41.96
Sean O’Hara:
6x Plastic Enclosures
$4.07
4x Non-Invasive Current Sensor - 100A $56.40
4x 9V AC-AC Power Adapter $43.20
TOTAL $103.67
Va Banh:
TAX
DigiKey (X-Bee (5), T-sensor(2))
$10.18
$98.56
29
XII. WORK BREAKDOWN STRUCTURE-SPRING 2014
In the second semester, the WBS is centered on getting everything more in tune with one
another by making enhancement to the existing prototype. An example of this would be
changing out components to better tailor to our design idea. The following are charts
showcasing the top level breakdown structure of the prototype.
A. Charts
Figure 28: Level 0 Tier and Its Corresponding Level 1 Structures
Figure 29: Level 1 Tier “Wireless Nodes” and Its Corresponding Level 2 Structures
Figure 30: Level 1 Tier “Base Station” and Its Corresponding Level 2 Structures
30
Figure 31: Level 1 Tier “MOW Page”, “Presentation Structure” and “Thermostat” and their Corresponding Level 2 Structures
Figure 32: Level 1 Tier “Documents” and their Corresponding Level 2 Structures
B. Tables
TABLE 4
HOME ENERGY MANAGEMENT SECOND SEMESTER WORK BREAKDOWN STRUCUTRE OVERVIEW
Level 1
Level 2
HEM1: Wireless Nodes (15%)
1.1: Relay Control Enhancements (5%)
1.2: Measure Voltage/Current Enhancements (5%)
1.3: Power Regulation Enhancements (5%)
HEM2: Base Station (30%)
2.1: Database Structure Enhancements (15%)
2.2: Gateway Communication Enhancements (15%)
31
HEM3: Mobile Optimized Web Page (16%)
3.1: Mobile Optimized Webpage Enhancements (8%)
3.2: Flex Alert Enhancements (8%)
HEM4: Presentation Structure (20%)
4.1: Add More Materials to Frame (5%)
4.2: Clean Up (5%)
HEM5: Thermostat (9%)
5.1: Software Enhancements (9%)
HEM6: Documents (10%)
6.1: Weekly Reports (1%)
6.2: Outgoing Team Leader Written Reports (1%)
6.3: Revised Problem Statement Report (1%)
6.4: Device Test Plan Written Report (1%)
6.5: Feature Report (1%)
6.6: Market Review Report (1%)
6.7: Mid-Term Progress Report (1%)
6.8: Team Member Evaluation (1%)
6.9: Deployable Prototype Review (1%)
6.10: Final Documentation Report (1%)
32
C. Second Semester WBS ~Allocation
Overview
The following overview will explain the
details of each task, and the designated
person who is responsible for its completion.
TOP LEVEL (Lvl.0)
HOME ENERGY MANAGEMENT
SYSTEM
This is the top level component, the entirety
of the project. As stated before, “We are
creating a home energy management system
that will track and display homeowner’s
energy usage, and provide energy saving
controls to the consumer.”
Who: The Team
Time Allotted: 15 weeks
see if it meets the standard of our
design idea concepts.
Who: Logan Odell & Sean O’Hara
Time Allotted: 6 days
LEVEL 1 Component
b. BASE STATION: One of the two
core presentable component of the
project, the base station is the front
end and back end of our software
Who: Logan Odell & Billy Saetern
Time Allotted: 10 days
LEVEL 2 COMPONENTS of Base station
1. DATABASE STRUCTURE
ENHANCEMENTS: Make any
changes to the structure of the
database for easier access through
parcels and communications.
Who: Logan Odell & Billy Saetern
Time Allotted: 10 days
2. GATEWAY COMMUNICATION
ENHANCEMENTS: Check the
communication between all nodes,
devices, database, and web page
after enhancements been
implemented from other parts.
Who: Logan Odell
Time Allotted: 10 days
LEVEL 1 Component
c. MOBILE OPTIMIZED WEB
PAGE: The web page built
exclusively for the utility company
that will have access to the flex alert
Who: Waleng Vang & Billy Saetern
& Va Banh
Time Allotted: 20 days
LEVEL 2 COMPONENTS of Mobile Web
Optimized
1. MOBILE OPTIMIZED WEB PAGE
ENHANCEMENTS: Make web
LEVEL 1 Component
a. WIRELESS NODES: The
component that collects the energy
data based on the device
LEVEL 2 COMPONENTS of the Wireless
Nodes
1. RELAY CONTROL
ENHANCEMENTS: Will reevaluate the components and change
if necessary.
Who: Va Banh/Sean O’Hara
Time Allotted: 4 days
2. MEASURE VOLTAGE/CURRENT
ENHANCEMENTS: Re-Evaluate the
efficiency of the current device to
see if it will meet the standard of our
design idea concept.
Who: Sean O’Hara
Time Allotted: 3 Days
3. POWER REGULATION
ENHANCEMENTS: Re-Assess the
current power regulator we have and
33
page more dynamical. It will detect
when a device is added or taken off.
Who: Waleng Vang & Billy Saetern
Time Allotted: 10 days
2. FLEX ALERT ENHANCEMENTS:
Make it easier for utility company to
use this flex alert.
Who: Va Banh & Billy Saetern
Time Allotted: 10 days
LEVEL 1 COMPONENTS
d. PRESENTATION STRUCTURE:
The second presentable component
of the project, the Presentation
Structure is framework of the
project’s hardware all in one.
Who: The Team
Time Allotted: 13 days
LEVEL 2 COMPONENTS of Presentation
Structure
1. ADD MORE MATERIAL TO
FRAME: Add more materials like
outlets, lights, expand on HVAC
system, maybe add water heater
(heat pump) in it.
Who: Va Banh
Time Allotted: 7 days
2. CLEAN UP: Make sure that the
presentation Structure will not hurt
anyone. Make sure all live voltage is
isolated and secure here people
cannot touch and safe.
Who: The Team
Time Allotted: 5 days
LEVEL 1 COMPONENTS
e. THERMOSTAT: Built own
thermostat to do the thing we want it
to do.
Who: Va Banh
Time Allotted: 8 days
1.
f.
1.
2.
3.
4.
5.
34
LEVEL 2 COMPONENTS
SOFTWARE ENHANCEMENTS:
Fix the thermostat to be easier to use.
Who: Va Banh
Time Allotted: 8 days
DOCUMENTS
Revised Problem Statement Report:
A document entailing in more detail
the scope of our project; what
societal problem we are tackling.
Who: Team
Time Allotted: 7 days
DEVICE TEST PLAN WRITTEN
REPORT: A document that has a test
plan that proves the laboratory
prototype works as expected over a
convincing range of factors such as
temperature, humidity, voltages or
other pertinent factors for your
design.
Who: Team
Time Allotted: 7 days
MARKET REVIEW REPORT: How
does your deployable prototype
solves the societal problem, who
your consumer and how does it fit
your market.
Who: Team
Time Allotted: 7 days
FEATURE REPORT: Document
about your features.
Who: Team
Time Allotted: 7 days
MIDTERM PROGRESS REVIEW:
Demonstrate that your team is
implementing the changes to your
project as discovered by your device
testing.
Who: Team
Time Allotted: 7 days
6. DEPLOYABLE PROTOTYPE
REVIEW: Demonstrate the
completed deployable prototype.
Who: Team
Time Allotted: 7 days
7. FINAL DOCUMENTATION:
Document of all details of the
project.
Who: Team
Time Allotted: 7 days
8. WEEKLY REPORTS: Document of
what happen every week.
Who: Team
Time Allotted: Each Week ~ 7 days
9. OUTGOING TEAM LEADER
REPORT: Leader outgoing report
document.
Who: Team Leader
Time Allotted: End of your Rule
10. TEAM MEMBER EVALUATIONS:
Evaluate each team member even
yourself.
Who: Team
Time Allotted: half a semester
To make it easier to understand we
provided the following table:
TABLE 5
SPRING ASSIGNMENTS
Task Name
Duration
Resource Names
Start
Finish
Weekly Reports Spring #1
40 days
ALL
Tue
12/3/13
Mon
1/27/14
Outgoing Team Leader Written Report
40 days
Waleng Vang
Tue
12/3/13
Mon
1/27/14
Weekly Reports Spring #2
5 days
ALL
Tue
1/28/14
Sun
2/2/14
Revised Problem Statement Report/Revised
Project Timeline/Presentation
6 days
ALL
Mon
1/27/14
Mon
2/3/14
Weekly Reports Spring #3
6 days
ALL
Mon
2/3/14
Sun
2/9/14
Device Test Plan Written Report
5 days
ALL
Tue
2/4/14
Mon
2/10/14
Weekly Reports Spring #4
6 days
ALL
Mon
2/10/14
Sun
2/16/14
Power Regulation Enhancements
10 days
Sean O’Hara
Tue
2/4/14
Mon
2/17/14
35
Weekly Reports Spring #5
6 days
ALL
Mon
2/17/14
Sun
2/23/14
Relay Control Enhancements
21 days
Va Banh/Sean O'Hara
Mon
1/27/14
Mon
2/24/14
Gateway Communication Enhancements
10 days
Logan Odell
Tue
2/11/14
Mon
2/24/14
Team Member Evaluation
10 days
ALL
Tue
2/11/14
Mon
2/24/14
Weekly Reports Spring #6
6 days
ALL
Mon
2/24/14
Sun
3/2/14
Database Structure Enhancements
26 days
Logan Odell
Mon
1/27/14
Mon
3/3/14
Measure Voltage/Current Enhancements
10 days
Sean O'Hara/Logan
Odell
Tue
2/18/14
Mon
3/3/14
Market Review Report/Presentation
5 days
ALL
Tue
2/25/14
Mon
3/3/14
Outgoing Team Leader Written Report
25 days
Va Banh
Tue
1/28/14
Mon
3/3/14
Weekly Reports Spring #7
6 days
ALL
Mon
3/3/14
Sun
3/9/14
Software Enhancement
15 days
Va Banh/Billy
Saetern/Waleng Vang
Tue
2/25/14
Sat
3/15/14
Weekly Reports Spring #8
6 days
ALL
Mon
3/10/14
Sun
3/16/14
Mid-Term Progress Review/Presentation
5 days
ALL
Tue
3/11/14
Mon
3/17/14
Mobile Optimized Web Page
Enhancements
47 days
Waleng Vang/Billy
Saetern
Mon
1/27/14
Tue
4/1/14
Utility Web Page Enhancements
47 days
Waleng Vang/Logan
Odell
Mon
1/27/14
Tue
4/1/14
Weekly Reports Spring #9
16 days
ALL
Mon
3/17/14
Sun
4/6/14
Team Member Evaluation
15 days
ALL
Tue
3/18/14
Mon
4/7/14
36
Outgoing Team Leader Written Report
25 days
Sean O’Hara
Tue
3/4/14
Mon
4/7/14
Weekly Reports Spring #10
6 days
ALL
Mon
4/7/14
Sun
4/13/14
Feature Report
5 days
ALL
Tue
4/8/14
Mon
4/14/14
Weekly Reports Spring #11
6 days
ALL
Mon
4/14/14
Sun
4/20/14
Weekly Reports Spring #12
6 days
ALL
Mon
4/21/14
Sun
4/27/14
Deployable Prototype Review
5 days
ALL
Tue
4/22/14
Mon
4/28/14
Weekly Reports Spring #13
6 days
ALL
Mon
4/28/14
Sun
5/4/14
Outgoing Team Leader Written Report
20 days
Billy Saetern
Tue
4/8/14
Mon
5/5/14
Add more to Presentation Frame
16 days
Va Banh
Tue
4/15/14
Tue
5/6/14
Team Member Evaluations
1 day
ALL
Tue
5/6/14
Tue
5/6/14
Weekly Reports Spring #14
6 days
ALL
Mon
5/5/14
Sun
5/11/14
Clean-Up Enhancement
9 days
ALL
Wed
4/30/14
Mon
5/12/14
Final Documentation Report/Presentation
6 days
ALL
Mon
4/28/14
Mon
5/5/14
Deployable Prototype Presentation
5 days
ALL
Tue
5/6/14
Mon
5/12/14
37
Here is a short summary of the hours
the team spent on each portion of the
prototype.
Team Meetings:
71 Hours
Logan Odell:
Research:
Testing: Mesh:
Testing: Plug-n-Play:
Testing: Distance:
Project Frame:
New Arduino Board:
Documentation:
TOTAL:
1 Hour
2 Hours
5 Hours
15 Hours
19 Hours
5 Hours
54 Hours
101 Hours
Va Banh:
Research:
SMS:
Testing: T-stat:
Testing: Database:
Testing: Flex Alert:
Debugging:
Project Frame:
Documentation:
TOTAL:
Waleng Vang:
Research:
Authentication:
Automation:
Mobile: Display
Energy
Consumption:
Testing: System:
Website:
Documentation:
TOTAL:
Research:
Testing: Energy
Measurements:
New Arduino Board:
Power Separation:
Project Frame:
Documentation:
TOTAL:
Billy Saetern
Research:
Authentication:
Testing:
Authentication:
Database To
Web Host:
Outside Temperature
Display:
SMS:
Testing: Website:
Documentation:
TOTAL:
12 Hours
6 Hours
13 Hours
3 Hours
4 Hours
3 Hours
17 Hours
44 Hours
102 Hours
TOTAL HOURS SPENT:
18 Hours
5 Hours
1 Hour
9 Hours
5 Hours
3 Hours
76 Hours
117 Hours
Sean O'Hara
38
12 Hours
14 Hours
4 Hours
5 Hours
5 Hours
49 Hours
89 Hours
6 Hours
8 Hours
5 Hours
22 Hours
13 Hours
8 Hours
5 Hours
44 Hours
111 Hours
591 Hours
XIII. RISK ASSESSMENT &
MITIGATION-SPRING 2014
The Spring 2014 Risk Assessment and
Mitigation takes into consideration what the
team has completed in the fall semester.
The end result left the team with the need to
make the prototype perform better. Hence,
testing is a key factor to make sure our
entire prototype component meet our
standards. Testing is meant to reduce all
bugs and errors to zero with the goal being
to enhance our product. Our risk
assessments for the spring semester focus
mostly on testing and enhancements. The
following are the factors the team has
considered as risk mitigation:
1. SMS
a. Text message service
i. Mitigation A: Find a
free service provider
online
ii. Mitigation B: Pay for
the service just for the
semester
b. No Internet connection
i. Mitigation A: Consult
the ECS department
about it
ii. Mitigation B: Connect
a Laptop to our
Raspberry Pi to tether
the WIFI
iii. Mitigation C: Take
the loss of it not
working
2. Project Frame
a. 1% chance of killing yourself
i. Mitigation A: Power
Off
ii. Mitigation B: Have
someone with You
when working on
electricity
3. Testing/Enhancing
a. Testing shows component is
useless
i. Mitigation A:
Enhance the
component to make it
viable
ii. Mitigation B: Rethink
our Design Idea
Contract
iii. Mitigation C: Talk to
our Advisor about the
problem
4. Documentation
a. Really no risk here. Just do
the work in a timely fashion.
After analyzing the work hours the team
spent, we can conclude that the team spent
most of the time working on documentation
in the spring semester than the fall semester.
The next topic that the End of Project
Document will discuss is the Market Review
analysis piece. As engineers, creating new
systems and devices and properly testing
them for perfection is expected within the
skill set. But an engineer many times must
step outside this circle of comfort and tackle
concepts unfamiliar to them. One concept is
the market review of the product they have
created. The next section will discuss the
Home Energy Management System’s market
placements, its target consumers, and the
competitors targeting the same consumers.
XIV. MARKET REVIEW-SPRING 2014
The significance of the Market Review
Stage is that it provides an economical and
business savvy view of an engineering
39
product. Entry level engineers rarely
understand how their involvement and work
on a product will be applied in the market;
and that is primarily because large
corporations have an entire division
dedicated to marketing and advertising the
product. The following information is in
regards to the Home Energy Management
System and its placement in the global
market. The information will discuss the
target consumers and the competitors in the
smart home market.
eye on it, and the H.E.M.S is the perfect
product for it. For electric car users,
knowing the exact energy consumption of
the recharge would be vital, as it would
provide the necessary information to
conclude accurate savings and electric bill
cost.
II. The Average Homeowner
For the average homeowner in the
United States, we will divide them into three
sub categories, lower class, the middle class,
and the upper class. We target homeowners
because renters are not in the position to
upgrade their homes because of both renting
regulations and finance restrictions. We will
be analyzing their ability to upgrade via
their income and their desire to upgrade.
a. Low Income
People in the low income bracket
currently have an average annual income
of $23,000 for a family of four [5].
Homeowners in this class usually have
aid in owning a home such as the section
8 housing program and aid in paying
utilities as well [6]. Unless we, electric
companies, or the government are able
to provide assistance for them to upgrade
their homes, they will not be able to
afford our current system. Although
people in low income are more prone to
savings, the upfront cost of a system is
more than they are willing to pay.
b. Middle Class
People in the middle income bracket
are further divided into three sub
categories: the lower middle class, the
middle class and the upper middle class.
i. The lower middle class have an
average annual income of $23,500 to
$32,000 [5] Homeowners in
this class in this are not too
far from low income and are
going to be very reluctant to
upgrade their homes to our
system. They may not have
the financial comfort to
A. Our Target Consumers
I. The Energy Savvy Individuals
The first target consumers the Home
Energy Management System needs to focus
on is the Energy Savvy Individuals. These
are the people who have electric cars, use
PV systems, solar systems, or are off-grid.
One would assume that the average
homeowners would be the target, but the
project itself is a lost cause for profitable
gain. The reasoning for this is that the cost
of the entire system being close to $1500,
will outweigh savings the system will do.
And this is primarily because heavier device
loads are vampire devices that need to
remain on. These include freezers,
refrigerators, and HVAC systems. At the
end of the month, homeowners who wish to
use the H.E.M.S will depressingly, yet
accurately save just a few dollar, and not
enough to warrant an actual purchase. So the
only benefit gained would be environmental
(unless of course, we’re speaking of the long
run ~ 2-3 years, which would save the
homeowners money). And the ones seeking
environmental benefit are the ones already
aiming to save it.
Off grid individuals who use PV systems
or other resources for the energy need to
keep track of their energy consumption
because they are no longer given a “semilimitless” supply of energy. Since they are
providing for themselves, they must ration
their energy production and keep a careful
40
upgrade their homes to the
degree our system requires
unless a large subsidy is in
place to help offset the costs.
ii. The middle class has an
average annual income of
$32,500 to $60,000 [5].
Homeowners in this class
will be more likely but still
reluctant to purchase as they
may find it more fit to spend
their extra income on other
less inexpensive upgrades to
save on their homes such as
energy efficient appliances
that they may not own yet
with our system being one of
the last things on that list of
upgrades.
iii. The upper middle class
has an average annual income
of $60,000 to $150,000 [5].
Homeowners in this class
will be our primary target as
they will have the financial
stability to consider upgrades
to their home such as our
system. Because our system
is one of the cheaper
alternatives among our
competitors, we will have a
greater appeal in their
choices.
c. Upper Class
People in upper class income
bracket have an annual income of
greater than $150,000 [5].
Homeowners in this class will have
no financial restrictions with
upgrading to our system. We will
however have to find a way to
increase our appeal to these
consumers because their lack of
financial restriction will entice them
to our competitors who can offer
more features and greater support at
a greater price range.
III. The Home Developers
As stated before, smart homes are
expanding similarly to how solar power
homes are already or in process of being
built to appease the demand of the
consumers. In the future, home developers
will be making smart homes to appeal more
to consumers and raise the price of the
house. So by creating this infrastructure of
our H.E.M.S. it will hopefully be appealing
to the home developers.
IV. The Utility Companies
The utility companies also play a key
role of our system and help set our design
apart from other HEMS. The reason being is
because they will be in charge of issuing
Flex Alerts to homeowners to put homes in a
lower power state. This will in addition
allow for even further energy conservation
than what our system is already providing.
We target the utility companies because our
focus is on saving energy anyway that we
can, and Flex Alerts will assist in that. Team
11 is hoping that by providing this included
feature that not too many, if any other
HEMS already have, will bring about further
consumer interest in our system.
B. Competition
I. Z-Wave
Z-Wave is a proprietary protocol and
assortment of devices that also allow you to
control your home through a Smartphone or
tablet device. Z-Wave offers a variety of
devices to control such as lights, locks,
thermostats, and even televisions. This
would be the biggest competitor as it is such
a widespread brand that already has plenty
of devices. The benefits of Z-Wave include:
Reliability - Z-Wave has excellent
reliability due two to major aspects
of the protocol: transmission
acknowledgement and mesh
networking.
41
Two-way transmission - Node
devices can send information to the
controller. This allows the controller
to know the states of the devices to
allow better control.
Range and limited interference Because Z-Wave runs on the 900
MHz range, it avoids the interference
of devices that run on the common
2.4 GHz band.
Device Variety - Simpler solutions,
such as X10 work on only a limited
number of devices, such as lights and
outlets. Z-Wave can work on much
more because the commands that can
be sent can be more complex than
simpler commands, like X10.
Some of the drawbacks of Z-Wave include:
Price - The simpler Z-Wave devices,
such as lights and outlets can cost
upwards of $60. In addition, the
gateway can cost upwards of $200.
The Vera3 Smart Home Controller,
for example, costs $250.
New device setup - Adding devices
to a Z-Wave gateway require that
you follow a specific sequence.
Removing devices also requires
special instructions. The devices are
not plug-and-play.
Proprietary - The biggest drawback
to Z-Wave is the lack of an open
protocol in which a developer of a
product can use to add a device with
Z-Wave capabilities. This means, in
addition to the added hardware costs,
developers would need to pay for the
privilege of using the Z-Wave
protocol.
Energy Reduction - Z-Wave is
positioned to consumers as an
automated control solution, and isn’t
specifically intended to reduce
residential energy waste. They
provide only a few solutions for
reducing the home energy usage,
such as a whole home “shut down”
II. Xfinity Home Control
Xfinity Home Control is another system
that attempts to provide mobile controls for
home devices to consumers. It is provided
by Comcast as a monthly service in addition
to the one-time purchase of a starter pack.
Comcast focuses more on security and
augments device control as part of the
service. Some of the benefits for Xfinity
Home Control are:
Device Variety - Similar to Z-Wave,
there are a number of devices that
can be controlled through Xfinity
home control.
Monitoring - Comcast provides 24/7
monitoring for things like security,
fire and carbon monoxide.
Some of the drawbacks of Xfinity Home
Control are
Regional - Xfinity Home Control is
only available where Comcast
resides. Any home out of their area
would not be able to take advantage
of this service.
Proprietary - Similar to Z-Wave,
devices and the protocol are
proprietary.
Cost - Unlike Z-Wave, there is a
monthly subscription cost. So the
energy savings must be at a
minimum every month for the
solution to be attractive to
consumers. The starter packs are also
quite expensive, as much as $350 for
5 devices.
Energy Reduction - Xfinity Home
Control isn’t intended to reduce
energy consumption; it’s intended to
provide security and convenience to
the consumer.
III. NEST
Nest is a thermostat recently purchased
by Google. It makes great strides in reducing
home energy consumption by learning the
42
consumer’s behavior and adapting its
controls to fit their lifestyle. This goes along
with HEMS philosophy of limiting the
requirement of consumer intervention. Some
of the benefits to Nest are:
Energy Reduction - Unlike the
previous two solutions, Nest
positions itself as a product that
saves energy.
Cost - While the initial cost of the
thermostat is quite a bit more than
your average home thermostat, the
energy cost savings quickly
outweigh the purchase cost.
Open API - While there is no open
API published yet for developers,
there seems to be indications that this
will eventually be released.
The disadvantages to the Nest thermostat
are:
Limited Focus - Nest Labs has, so
far, has only focused on Thermostats
and Fire/CO2 sensors and doesn’t
have anything for other energy
consuming devices.
Uncertain Future - With the purchase
by Google, who has not in the past
been in the business of home energy
management, the motives for the
purchase has come under scrutiny
and it’s unknown what Google’s
plan will be.
IV. The HEMS placement in the flooded
market.
Given the variety of products available
for home control devices, it’s important to
remember the focus of HEMS versus the
aforementioned and other solutions. HEMS
intends to reduce energy cost with limited
consumer intervention. At this point, the
Nest thermostat is the only solution that has
managed to achieve that goal. The Nest,
however, isn’t as comprehensive as HEMS.
It focuses on only one portion of home
energy waste (albeit, one of the largest). As
we progress into the future, and non-
renewable resources start to become scarce,
the savings from reducing home energy
waste will become more noticeable to
consumers. That, however, isn’t necessarily
going to encourage more homeowners to
take an active role in their energy waste;
rather, they will start to look at solutions that
will do it forward. Comparisons to the other
solutions:
Z-Wave
o Just as reliable: mesh
networking is available and
we have the option of also
using the 900 MHz spectrum.
o Two-way communication is
also implemented in HEMS.
o Open protocol allows
developers to easily add their
device to our network of
devices.
o Easier setup. Our system is
designed to be plug-and-play,
so the only intervention
required by the consumer is
to name the device.
o Automated controls - Being
more focused on energy
reduction, we can start to
implement controls that will
reduce the energy waste
without requiring constant
user interaction.
XFinity Home Control
o Energy reduction focus.
Rather than focusing on
security and convenience, we
can focus on reducing energy
consumption.
o No recurring costs will mean
a shorter return on investment
time
o Open protocol as mentioned
previously, allows for easy
integration for developers.
Nest Thermostat
43
o
Thermostat in current project
is a proof of concept. Ideally,
when the API is released for
the Nest, we would want to
integrate it with our project
as its focus is much more
aligned with ours. We are
simply scaling up the
concepts to other sources of
energy waste.
engineering level User Manual that is meant
is to provide a step by step instruction set
that will allow the operation of the Home
Energy Management System.
XV. SYSTEM SETUP
The H.E.M.S. project uses a simple
mobile-optimized web page to access a base
station that creates hardware reactions. For
consumers, using the H.E.M.S system
comes in the form of the Mobile Optimized
Webpage. Touch mechanics and data
display are all that the consumers need to
operate the H.E.M.S...
The features the H.E.M.S provide are
vital components of what an ideal smart
home system should do; simplicity,
reliability, and automation. If we focus our
system to the consumers who are middle
class and above, and those who are energysaving savvy (owners of electric cars and
PV systems), there a good chance that our
product will survive in the market. If we
introduce our system to Home Developers
and get them to include our devices into
their development, we will have an even
better chance. If we manage to work with
Utility Companies and partner with them to
help reduce energy consumption, it would
be ideal. Understanding the market and
where the H.E.M.S place is critical.
As provided in the research,
understanding that the growth of the market
is there is also vital to our cause. The strong
pushes for smart homes are coming. This is
where the H.E.M.S will succeed. The
H.E.M.S will be carried along in this current
of mass desire when the big corporations
begin pouring their resources into smart
home systems and its advertisements. The
history of the Smart Home Systems proved
that the concept was ideal but due to
technological limits, smart homes were held
back. After two decades since its initial
beginning in 1990, smart homes are now
ready to for mass implementation. Now that
the technology for it is here and everevolving, all that is left is to look towards
the future. The next section will discuss an
A. Laboratory Prototype Consumer Guide
Step 1: Set up the Belkin Router given to
you by plugging the router into an outlet to
give it power.
Step 2: Access the H.E.M.S project web
page via your Smartphone or PC using your
choice of search engine. Enter the following
IP Address: 192.168.1.128
Step 3: A menu will appear giving you the
option to regulate outlets or devices.
Step 4: If you choose outlets, you will be
given the option to shut off or on a certain
outlet. . It will also show the apparent power
usage next to the “on/off” switch.
Step 5: If you choose the devices, you will
arrive to thermostat. Select it.
Step 6: For the thermostat page, there is
slider indicating what number you wish to
set your temperature to. This page also has
OFF, COOL, and HEAT. OFF shuts off the
thermostat. COOL causes to decrease the
temperature until it reaches the number you
set on the slider is reached. HEAT causes
the furnace to increase your temperature
until it reaches your slider temperature
choice.
44
● (4) Arduino Uno/Duemilanove
Microcontrollers w/ USB Power
Cord
● (1) Wireless Router w/ Power
Adapter
● (1) CAT5 Ethernet Cable
● (1) Raspberry Pi
● (1) Series 2 XBee USB dongle
● (1) SD Card
● (1) Thermostat
Other:
● 20 Gauge Single Core Wire
● Wire Strippers
● Electrical Tape
● Wall Mounting Screws
Step 7: You can return back to any page by
pressing the back button, or main page
button.
Step 8: To exit out of the webpage, simply
exit out.
However, for one who is trying to recreate
the project, we have created a technical user
guide.
B. Technical User Guide Preface
This technical user guide presents the
hardware assembly and software
configuration of the Home Energy
Management System (H.E.M.S.). It is
intended for users who possess a basic
understanding of household electrical
systems and electronic circuits, as well as
familiarity with networking, the Arduino
Uno/Duemilanove microcontroller, Series 2
XBee modules, ZigBee protocol, Raspberry
Pi computer, and HTML/PHP/jQuery
scripting languages. In this guide, you will
find out how to successfully hook up the
entire H.E.M.S., as well as be provided with
troubleshooting and FAQ’s.
E. Software Components
The HEMS project requires a user who
is familiar with the following programming
languages and software. It is possible to
acquire and learn these by searching the web
and putting aside time to master the
following:
● MySQL Database - a SQL base,
simplistic and powerful Open Source
Software database management
system used as the intermediate for
the software and hardware of the
system.
● PHP (Hypertext preprocessor) - a
user/server-side scripting language
created for web development. It is
also a general programming
language used by many.
● HTML (Hyper Text Markup
Language) - the standard system for
tagging text files to create font,
color, graphics and links to the
Internet.
● AJAX (Asynchronous JavaScript
and XML) - interconnected web
C. Before Getting Started
Before assembly or configuring the
H.E.M.S., first make sure you have all of the
necessary hardware components and
software as shown in the “Hardware
Components” and “Software” sections to
ensure proper functioning of the system.
D. Hardware Components
● (5) 9V AC-AC Power Adapters
● (5) Non-Invasive 100A Current
Sensors
● (3) Relay Circuits
● (4) Power Sensing Circuits
● (4) XBee Circuits
45
development tools used on the client
side to create web pages that are
dynamic with change.
● JAVASCRIPT - a programming
language that is object oriented and
is commonly used to create
interactive effects on a website.
● jQuery Mobile Libraries - a
mobile/touch optimized web
framework used to create web pages
that are meant for mobile use. It
converts basic HTML tags into
simplistic touch options.
● PHPMyAdmin - a free open source
program used to manage and
construct databases in one easy user
interface.
4 fields you wish to use, enter that
number.
Step 6: Defining your fields. You
need to specify what “types” you
will be using in each field. If you are
using ages, then you will be using
numbers. If you are using names, use
VARCHAR. You can find more by
searching the web. Here is a list of
the most used types:
o INT - Normal Numbers
o FLOAT/DOUBLE - Much
Larger Numbers and
Decimals
o VARCHAR - Any characters
up to 255.
o TEXT - A text column with a
maximum length of 65,535
characters.
o DATE - A date
o DATETIME - A date and
time
o TIMESTAMP - Used for
recording the date and time
of an insert or update
o TIME - A time
Step 7: Selecting a special Attributes
for your database. These attributes
help enhance your database. You can
search the web for more Special
Attributes. Here is a list of Special
Attributes that can be used:
o Auto Increment: AutoIncrement fields are useful
for assigning unique
identification numbers for
users, products, and
customers, etc.
o Primary Key: The primary
key is a data column that
uniquely identifies a specific
instance of that data. At least
F. Software Assembly
1) MySQL Database Setup
Step 1: Download and Install
PHPMyAdmin.
Step 2: Open PHPMyAdmin
Step 3: When prompted, name your
database using this format:
username_databasename. This will
help specify to others who the user is
and what database they are
accessing.
Step 4: Create a table using the drop
box list of databases. Select the
database you wish to insert the table
in and name it properly. Choose a
name that reflects the data you will
be putting in the table.
Step 5: Choose the number of fields
you wish to have. Fields refer to
username, first name, last name,
phone number, age. If you have 3 or
46
one of your fields must be a
Primary Key.
o Index Key: Allows you to
speed up searches by
designating a field as a
preferred data source,
especially when combining
data from multiple tables.
Step 8: You are now ready to import
data
G. Hardware Assembly
IMPORTANT: TO AVOID THE RISK
OF ELECTRIC SHOCK, DO NOT
PROCEED TO THE FOLLOWING
STEPS BEFORE FULLY TURNING
OFF HIGH VOLTAGE AC POWER
FROM THE MAIN HOUSEHOLD
BREAKER BOX.
1) Individual Node Setup
Step 1: Remove the wall outlet cover
by unscrewing the single screw
Step 2: Remove the wall outlet by
unscrewing the top and bottom
screws
Step 3: Use wire cutters to cut the
hot (red) and neutral (black) wires in
half
Step 4: Connect the hot wire in
parallel with the blue wire from the
Relay Circuit and the red wire from
the AC-AC step-down transformer
Step 5: Connect the neutral wire in
parallel with the yellow wire from
the Relay Circuit and the black wire
from the AC-AC step-down
transformer
Step 6: Connect the green wire from
the Relay Circuit to Digital I/O Pin
12 on the Arduino
Step 7: Connect the red wire from
the Relay Circuit to 5V on the
Arduino
Step 8: Connect the black wire from
the Relay Circuit to GND on the
Arduino
Step 9: Connect the orange wire
from the Power Sensing Circuit to
TX on the Arduino
Step 10: Connect the purple wire
from the Power Sensing Circuit to
Rx on the Arduino
2) Mobile Website Setup
Step 1: Install a Web Server to host
your website.
Step 2: HTML and basic
understanding of the jQuery Mobile
framework is required to build a
simple, but strong touch-optimized
web page.
Step 3: Refer to the jQuery Mobile
page to start building your Website
as needed. Be sure to call upon the
jQuery Mobile Libraries to optimize
your interface.
3) Connecting the Website to the
Database
Step 1: PHP and AJAX are required
to interface the Website with the
Database. Be sure to know both
languages thoroughly.
Step 2: Depending on how you setup
your website, after each button or
update, use PHP and AJAX
accordingly to update your data to
your database.
Step 3: When starting up your
website, create a PHP/AJAX script
to update all of your
buttons/information. This is done by
extracting the data from the database
when called upon.
Step 4: Create an insert script from
each update/button to the database.
This should be done dynamically so
that constant refreshing will not be
necessary.
47
Step 11: Connect the red wire from
the Power Sensing Circuit to 5V on
the Arduino
Step 12: Connect the black wire from
the Power Sensing Circuit to GND
on the Arduino
Step 13: Connect the yellow wire
from the Power Sensing Circuit to
Analog Input Pin A1 on the Arduino
Step 14: Connect the green wire
from the Power Sensing Circuit to
Analog Input Pin A2 on the Arduino
Step 15: Clamp the current sensor
onto either the hot or neutral wire of
the load of the wall outlet
Step 16: Mount the Relay Circuit and
the Power Sensing Circuit to the
inside of the wall next to the wall
outlet using the screws
Step 17: Reinstall the outlet into the
wall
3) Thermostat Setup
Step 1: Turn off all electricity to the
household thermostat
Step 2: Remove the plastic faceplate
from the thermostat
Step 3: Remove the thermostat from
the wall by unscrewing the screws on
each corner
Step 4: Connect the white wire to the
HEAT screw terminal
Step 5: Connect the yellow wire to
the COOL screw terminal
Step 6: Connect the green wire to the
BLOWER screw terminal
Step 7: Connect the red wire to the
POWER screw terminal
Step 8: Reattach the thermostat to the
wall
Step 9: Turn back on the electricity
to the thermostat
H. Troubleshooting
Problem: I receive the following error when
trying to upload my sketch to the Arduino:
avrdude: stk500_getsync(): not in sync:
resp=0x00
avrdude: stk500_disable(): protocol error,
expect=0x14, resp=0x51
Solution: To correct this error, unplug the
TX and Rx wires from the Arduino and then
re-upload the sketch.
Problem: I am not getting accurate power
readings, what is wrong?
Solution: Adjust the Arduino sketch voltage
and current calibration value until you get
power readings that correspond to a
multimeter’s values.
2) Base Station Setup
Step 1: Plug the wireless router
power adapter into an AC wall outlet
Step 2: Connect the CAT5 cable
from one of the “LAN” ports on the
wireless router to the “LAN” port on
the Raspberry Pi
Step 3: Plug in the Series 2 XBee
dongle into the “USB 2.0” slot on the
Raspberry Pi
Step 4: Insert the SD card into the
“SD Card” slot on the Raspberry Pi
Step 5: Plug in the Raspberry Pi
power adapter into an AC wall outlet
Step 6: Place/mount the Raspberry Pi
and router centered in the household
(ceiling preferably) to avoid signal
interference
I. FAQ
1) Will an AC-DC power adapter work
instead of an AC-AC power adapter?
48
A. Outlet Page
Answer: No, a sinusoidal waveform is
needed in order to find the RMS voltage and
RMS current.
The outlet page covers three of the
features indicated in the design contract:
allowing users to turn on/off individuals’
devices, displaying individual items as a
percentage of total consumption, and the
display of total house energy consumed.
Accessing the outlet page gives the user
controls to all node-connected outlets. Each
outlet contains an on/off switch, as well as a
section indicating the power consumed by
the device plugged in. When a user flicks
the on/off switch, a PHP script commits a
function that allocates a 0(off) or 1(On) to
the database. This information is grabbed by
the nodes and activates the relays to turn
on/off the device. If the user commits an
“ON” and there is a device connected to the
outlet, the power consumed by the device
displays on the left of the on/off switch in
watts. Currently, outlet percentage will
always be 100% because the H.E.M.S
prototype is currently simulating the effects
of the HVAC systems, which would ideally
consume about 30-40% of the home. On a
side note, if the user adds a new outlet to the
system, the mesh system will update the
database, and the website will access the
database and create a new outlet within the
outlet list.
XVI. USER MANUAL
The mobile website is composed of
two sections: the front-end, which is meant
for consumer interaction, and the back-end,
the scripts and functions transferring the
data to and from the base station. The frontend of the mobile website is primarily
designed using HTML code that is made
mobile-compatible with jQuery Mobile
libraries. Accessing and coding with jQuery
Mobile recreates the HTML code using CSS
and JavaScript’s into simple-to-use controls
and widgets, providing a simple yet
adequate structure to the website. Because
of this, the website can be accessed
anywhere with an Internet connection via
smart phone or computer. The back-end
contains separate PHP scripts and functions
indicated in the code that carry out the
database updates for each of the consumers
widget use. Designed with simplicity and
the user in mind, the Mobile Website is
composed of three primary separate
sections: the outlets, the thermostat, and the
low power mode.
Figure 33: Home Page of the Mobile Website
49
grabbed by the thermostat node, which then
displays the designated value, and activates
a relay. On our prototype, we have three
light bulbs simulating the activation of the
heat, air conditioning, and off. Depending
on which one the user chooses, the
temperature node’s relay will activate the
designated light bulb.
TABLE 6
DATABASE STRUCTURE FOR TEMPERATURE
Figure 34: Outlet Page
B. Thermostat Page
Temp.
The thermostat page covers two of
the Mobile Website’s features: allowing
users to set temperature for heating and air
conditioning, and displaying the
temperature inside and outside the house.
The thermostat page contains a slider with
preconfigured low end and high end values:
(65, 85). The default value of the slider is set
to the current temperature of the room; this
is done with the thermostat node and its
temperature sensors. Moving the slider to
the indicated temperature does not set off
the simulated HVAC though. Below the
slider, are three button options: heat, cool,
and off. The user is given the option to
indicate if he/she would like to activate
either the heater or the air conditioning, or
turn the system off. Once the user has
committed to a value on the slider, he/she
then can choose to activate the heat, air
conditioning, or off. In order to differentiate
between the three in the database, we
designated values to each one; Heat is
indicated with a value of “1” in front of the
desired temperature, air conditioning is
given a value 2, and off zero. Once the value
is set, the data is sent into the thermostat
table in the database, and the information is
HEAT
75
Cool
275
Off
175
075
____________________________________
______________
Figure 35 Thermostat Page
C. Low Power Mode Page
The last section of Mobile Website is
the Low Power/Vacation Mode which
covers the last feature: Allow users to enter
“vacation” or “low power” mode. The
primary purpose of this mode is to allow the
user to have a preconfigured default of their
entire home system; this includes all outlets
as well as the thermostat. The goal is to
simplify the consumer’s need to actively
control every piece of their house, and
50
provide a meaningful automation piece to
the H.E.M.S prototype. When the user enters
the Low Power page, a button called
“Activate” will be at the top. Below that is
the button called “Low Power Settings.”
Accessing this, the user will arrive to a list
of all the outlets in their mesh system, as
well as the components to the temperature
section. The user can than allocate their
desired configuration to each piece. The user
can then return to the previous page and hit
the “activate” button. This will set the
current values of the nodes and temperature
equal to the values inside the Low Power
Table. The end result is outlets and
temperature set to the preconfigured Low
Power settings.
Figure 36 Low Power Activate
Figure 37: Low Power Configuration
XVII. HARDWARE
So you can only plan and document so much before you have to just go forward with the
design. To start, let’s take a very high level view of how we ended up designing our system:
Figure 38: System Block Diagram
We can break our system up into two major devices: base station and node device. Our
deployable prototype has a single base station and 4 node devices. This base station consists of a
Raspberry Pi, an XBee and an XBee Explorer. The Raspberry Pi provides the following services:
Hosts mobile website
51
Hosts database
Serves as communication bridge between XBee and database
Runs automated control code
The XBee used was an S2, and was loaded with the Coordinator API firmware, allowing it to
communicate with the node devices through ZigBee packets and manage the mesh network. The
XBee explorer was used to interface the XBee with the Raspberry Pi over a USB COM port,
rather than directly through the UART. Using the XBee explorer allowed us to not have to
concern ourselves with writing or testing drivers for the Raspberry Pi’s onboard UART. The
following is a slightly more detailed block diagram of our base station:
Figure 39: Base Station Block Diagram
By using the aforementioned hardware, we were able to come up with a final design that is
practical, affordable, scalable and open.
To capture the energy measurement data and control the devices, we had to create a number
of node devices that had a similar core, but came with slight variations that tuned it to work with
whatever device we were trying to control and/or measure. The following table gives you an idea
of the different variations:
TABLE 7
COMPARISON OF NODE DEVICE FEATURES
Device
Power measurement capabilities?
Control mechanism
Outlet
Yes
1x General Purpose SPDT Relay
Thermostat
No
3x General Purpose SPDT Relay
HVAC
Yes
N/A
Whole House
Yes
N/A
Our deployable prototype contains one of each node device, plus an additional outlet to help
demonstrate the wireless and mesh networking capabilities. The following are the block
diagrams of our devices Note that we have 4 node devices that perform separate tasks, the
HVAC and Whole House nodes have the same hardware:
52
Figure 40: Node Device Block Diagrams
So after designing the different node devices that we will use to help us accomplish our feature
set, we needed a way to present our system. We settled on using an A-frame to house the
majority of our components. Throughout our first semester and part of the second, all node
devices were housed on the A-frame. Prior to the technical review in our 2nd semester, we
decided that to showcase the wireless capabilities of our system, we needed to break out a few
nodes onto their own panels. We created a pair of “mini A-frames” that each housed a wall outlet
and the appropriate HEMS control hardware.
The following pages contain the three schematics for our node devices:
53
Figure 41: Schematic For Wall Outlet Node Device
54
Figure 42: Schematic For Thermostat Node Device
55
Figure 43: Schematic For HVAC and Whole House Node Device
For documentation of how our current and voltage are being measured and set up to determine
real power; please see Appendix A.
56
The following is a list of programs and
libraries used to help us develop the
software for our deployable prototype:
Arduino IDE v1.05 - Used to
develop the node device code.
EmonLib v1.0 - Used on the Arduino
to assist in calculating real power.
xbee-arduino library v0.5 - Used on
the Arduino to help assist in
communication with our XBees
through ZigBee packets
GCC 4.8 - Used on our Raspberry Pi
to compile the flex alert, database
and XBee communication code.
MySQL C API - A C library
installed onto our Raspberry Pi that
allows us an easy way to send
MySQL commands
MySQL 5 - Hosts our database on
our Raspberry Pi
JQuery Mobile 1.8 - Create a mobile
website to view device information
and instruct our system to change
device states.
So we can break out the software in our
system into a few distinct categories:
Arduino Sketches that are loaded
onto the Arduino Unos which control
and measure power from our various
household devices. We need
different sketches for the wall outlet,
HVAC, whole house and thermostat
devices.
Embedded Raspberry Pi program
that interfaces our XBee with the
database, and keeps track of flex
alerts.
MySQL database that hold state and
power measurement data
JQuery Mobile website that is
displayed in a user’s web browser
and interfaces with the database.
XVIII. SOFTWARE
Having the proper hardware can only
take us so far. At some point, you need to
step in and let the software take over. Our
project leans more towards the software end
of the spectrum (likely because our team is
80% Computer Engineers). Nevertheless, we
felt confident that we could design a system
that would accomplish our goal of reducing
home energy waste, with a heavy
dependency on software. What we did not
realize was how software-diverse our
solution would be. Software in our prototype
performs all of the following:
On Arduino:
o Calculate the real time real
power of our load using
voltage, current and time
(Done with the assistance of
the Emon library located in
Appendix B).
o Composing a packet of real
power, device state and
device type and sending it in
a ZigBee packet to an XBee.
On Base Station:
o Host mobile website.
o Host database for storing
device state and energy data.
o Receiving and parsing the
ZigBee packets from the
XBee over the COM port.
o Updating a device’s state and
real-time power readings in a
database.
o Noticing state change
requests inserted into the
database, and sending the
request to the appropriate
device.
o Continuously checking for an
issued flex alerts.
57
A. Flowcharts
For the first two bullet points, we can demonstrate the logic through flow charts. The following
pages contain flowcharts for our Arduino Sketches and Raspberry Pi embedded code.
Figure 44: Flowchart For The Outlet Sketch
58
Figure 45: Flowchart for the Thermostat Sketch
59
Figure 46: Flowchart For HVAC and Whole House Sketch
60
Figure 47: Flowchart For Raspberry Pi Main Function
61
Figure 48: Flowchart for TTY Thread
62
Figure 49: Flowchart For Stat Update Thread
63
Figure 50: Flowchart For Flex Alert Thread
64
B. Database
Our database contains 3 tables. The first
table is named device and it contains an
entry for each node device in our system.
The second table is called measure and it
contains an entry for each power
measurement from the various devices. The
third is used for authentication The
following is breakdown of the tables and
column information.
TABLE 9
COLUMN INFORMATION FOR MEASURE
TABLE
TABLE 8
COLUMN INFORMATION FOR DEVICE TABLE
Column
Name
Data
Type
Description
address
number
64-bit XBee Address
name
string
Name set by the user and
displayed on the mobile
web interface
current_state
number
The state of the device as
reported by the device
set_state
number
The state of the device as
set by the user
flex_enabled
boolean
Set by the user to
determine if device is
affected by flex alerts
flex_state
number
Set by the user to
determine what to change
set_state to during a flex
alert
last_state
number
Column
Name
Date
Type
Description
address
number
64-bit XBee Address
time
number
Epoch time set to when the
entry was added to the table
value
number
Value, in Watts, of the
power measurement
TABLE 10
COLUMN INFORMATION FOR
AUTHENTICATION
On flex alert, copied
from set_state to keep
track of pre flex alert
state
65
Column
Name
Date
Type
Description
id
number
number of users
username
varchar
username for login
password
char
password for login
salt
char
key for encryption and
decryption of password
email
varchar
email to send in case
password is forgotten
zip_code
number
used for accessing
weather for home page
on website
phone_number
number
used for sending SMS
text messages
C. Website
Our mobile website consists of
markup code and trivial function calls. Any
website button that is pushed, or slider that
is adjusted, simply executes a subroutine
that issues a MySQL command to update the
database. A sample of that code is provided
below
/* Returns the number of outlets
(type 0) in our device table */
function getNumOutlets()
{
hems_dbConnect();
$query = "SELECT * FROM
device WHERE type=0;";
$result =
mysql_query($query)
or die(mysql_error());
$num =
mysql_numrows($result);
mysql_close();
return $num;
}
TABLE 11
ZIGBEE RX PACKET DESCRIPTION
Frame Field
Start
Delimiter
Length
Frame
Specific
Data
Frame
Type
64-bit
source
address
16-bit
source
network
address
Received
options
Received
Data
Checksum
Offset
0
Example
0x7E
MSB 1
LSB 2
3
0x00
0x11
0x00
MSB 4
5
6
7
8
9
10
LSB 11
MSB 12
0x00
0x13
0xA2
0x00
0x40
0x52
0x28
0xAA
0x7D
LSB 13
0x84
14
15
16
17
18
19
20
21
‘H’
‘e’
‘l’
‘l’
‘o’
‘!’
0x57
The start delimiter byte remains
constant to identify the start of the ZigBee
packet. This is followed by a two byte
length with the most significant byte sent
first. The length is the number of bytes in
the frame specific data section. The
checksum is calculated by subtracting each
byte in the frame specific data section from
an initial starting value of 0xFF. The
received data portion of the packet is where
we look to find out the HEMS protocol data.
The HEMS protocol is ASCII encoded and
contains four arguments, separated by
colons and terminated with a null. The
arguments, in order, denote the packet type,
state, power measurement, and device type.
The following table provides more details:
The above is called when rendering the
webpage to determine how many outlets to
display. A connection is made to the table, a
query is issued, and the result is returned.
The appendix will contain the full suite of
code for our website.
D. Protocol
While not software specifically, I felt
that it was worth discussing the protocol that
our team built for our system. Our protocol
is built upon the ZigBee protocol. This gives
us features such as mesh networking and
packet acknowledgement. The following
table shows an example and breakdown of a
ZigBee packet that is sent over the XBee
transceiver.
66
performance goal and then directs
the actuator input.
From the above description of a mechanical
system we can infer that our design of
components does not accommodate any
mechanical aspect.
As you can see from the figures below:
TABLE 12
DESCRIPTION OF HEMS PROTOCOL
ARGUMENTS
Argument
Value
Description
Packet Type
HT or
HV
HV packets update the
current_state column while
HT packets update both
the set_state and
current_state columns. The
latter is used when a user
wants to change the
device’s state from the
node itself, as is done with
the Thermostat’s buttons.
Device State
0 to
300
For outlets, 0 or 1 is used
for off or on, respectively.
For thermostat’s, the
desired temperature is used
as a base, and the either 0,
100 or 200 is added for the
mode (off, heat and cool
respectively).
Power
Measurement
0 to
65535
The real power in watts of
the device.
Device Type
0 to 3
Either 0 for wall outlets, 1
for thermostats, 2 for
HVAC or 3 for whole
house node devices.
Figure 51: Project Frame
Our design is all hardware and software
base. The hardware includes the
components that controls and measures the
flow of electricity. The software enables all
communication between the hardware
components. So overall, there are no
mechanical objects in our prototype. The
next section will discuss the Test Plan for
the Home Energy Management System. The
Test Plan is meant to correct all bugs and
errors, and create a prototype capable of
surviving in multiple conditions.
XIX. MECHANICAL
A mechanical system manages power to
accomplish a task that involves forces and
movements, such as a waterwheel, windmill,
or even a motor. A mechanical system
consists of the following:
1. A power source and actuators that
generate forces and movement
2. A system of mechanisms that shape
the actuator input to achieve a
specific application of output forces
and movement
3. A controller with sensors that
compares the output to a
XX. TEST PLAN-HARDWARE
To properly test the energy
measurements, accuracy, precision, and
resolution needed to be taken into account
during testing stages. The level of accuracy
should be fairly rough, somewhere in the
area of +- 10%.
67
A. Accuracy
Firstly, the accuracy of a measurement is
how close the measurement corresponds to
its actual value. Accuracy depends on the
accuracy of the device or the method used to
calibrate it. This means that most instruments
cannot be declared “accurate” because they
will only be as accurate as their calibration.
“Reproducible” or “precise” are better words
in this case.
On
Speed 1
Speed 2
Speed 3
70.01W
Voltage
(V)
122.4V
122.4V
122.4V
Current
(A)
0.312A
0.333A
0.395A
Watts
(W)
38.19W
40.76W
48.35W
TABLE 15
ARDUINO TESTING RESULTS
On
Voltage
(V)
122.4V
Current
(A)
13.6mA
Watts
(W)
1.66W
A Kill A Watt electricity usage monitor was
also used to double check the values
determined by the multimeter before
proceeding to measure each load using our
system and came out to be within a couple
watts of each other, which is reasonable.
When beginning to first test the energy
measurement accuracy, precision, and
resolution of our system, the results were
within about 12 watts of the multimeter and
Kill A Watt values. By adjusting the RMS
voltage, RMS current, and phase shift
calibration values in the Arduino code that
our system uses, it was then within 7 watts
from the actual values. Because a 30A
current sensor was initially used in our
system, and now 100A current sensors are
being used, the value of the burden resistor
needed to be adjusted accordingly. By
recalculating the burden resistor value used,
the readings were then within only a few less
watts of each other, which is fairly
reasonable for a clamp on current
transformer. In the end, to the consumer, a
couple watts in difference are not going to
matter to them. What matters is which
devices are using more energy than other
devices and by approximately how much.
C. Resolution
Lastly, the resolution of a measurement is
the tiniest change that a sensor can determine
in the quantity that is being measured.
Declaring that resolution is superior to
precision is also misleading because the
sensor itself has an effect on the
measurement being measured.
D. Energy Measurement Testing
During white box testing, three primary
devices were used to determine the accuracy,
precision, and resolution of the energy
measurements. These electrical loads
included a 72 watt light bulb, a 50 watt 3
speed fan, and an Arduino Uno
microcontroller. By measuring the voltage
and current and applying Ohm’s Law, the
calculated wattages are summarized in the
tables below.
TABLE 13
LIGHT BULB TESTING RESULTS
Current
(A)
0.572A
TABLE 14
FAN TESTING RESULTS
B. Precision
Secondly, the precision of a measurement
is a measure of the range of its different
readings. It is important to understand that
accuracy and precision are not the same, as a
measurement can be accurate but not precise
or vice versa. Precision is also a synonym for
the resolution of the measurement that can
be
differentiated
between
other
measurements.
Voltage
(V)
122.4V
Watts
(W)
E. Wireless Communication Testing
68
on our intermediate node. After loading the
proper firmware, and letting the test run for
longer (to allow the mesh network to build),
the packet loss was reduced to less than 1%.
This gave us indication that the mesh
networking was working.
Overall, our testing showed that the
hardware we chose to use was sufficient to
accomplish the tasks set forth in our feature
set.
To test the wireless communication in our
design, we need to verify distance and
reliability of our system in an average home
and ensure mesh networking was operating.
For distance and reliability, we wanted to
calculate packet loss in an average sized
home, without the aid of mesh networking.
According to the census bureau in 2010, the
average size of a home in the US was 2169
square feet [4]. The largest home we had
available for testing was 1800 square feet,
roughly 17% smaller than the average. We
felt that the added size would be aided by the
addition of the mesh networking capabilities,
so an acceptable packet loss in our testing
scenario would suffice and not warrant any
change in hardware. To calculate packet loss,
the following test environment was setup:
1. The node device was loaded with an
Arduino sketch that sent out a ping
message at specified intervals.
2. The node device was placed in one
corner of the home.
3. A Processing sketch that logged a
timestamp to a CSV file whenever it
received the ping message was
loaded onto a laptop.
4. The laptop was placed in the
opposite corner of the home and the
setup was run for two hours.
5. The CSV file was opened with Excel
and a VBA macro was run to
calculate the packet loss.
We ran the tests under 1Hz, 0.5 Hz and 0.25
Hz conditions to see if there was any effect
on frequency. In every case, the packet loss
was calculated to be less than 1%.
To test the mesh networking the
aforementioned setup was taken outside.
The devices were set at a distance that
equated to roughly 30% packet loss. An
intermediate node was added to the setup
and the test was run again. Initially, the
change in packet loss did not change. It was
later determined to be a configuration error
XXI. TEST PLAN-SOFTWARE
For the software section of the test plan,
we ran and debugged our programs which
included the mobile website, the database,
and the backend scripts. In order to properly
test the software components, we needed to
find test cases that crash the software. We
used both black-box and white-box testing
methods to find bugs in our design.
For software testing, many companies do
not involve software developers with the
testing process. This was primarily because
developers usually have the belief that their
software was errorless, and do not have the
methodology and mindset of cracking their
own system. The factors we tested for were
time delay between data updates, data
accuracy, and ease of use.
A. Black Box Testing
In order to test the functionality of each
of our features used black box testing, we
created a series of inputs for some of our
features to be tested that uses code segments
that our members did not write themselves.
All we cared for were that our outputs
matched our predictions with the selected
input. In order to reduce the ambiguity of
whether our software was functioning
properly or whether it was a “lucky”
prediction, we created a large number of test
inputs that cover the domain functionality of
our software.
B. White Box Testing
69
The majority of tests we conducted were
white box testing. Since most of our
software was written by our own members,
we know the implementation that was used
in most of our software. The test cases were
created according to the functionality of the
software to insure it met specifications. If
any of the test cases failed, we backtracked
and traced the root of the problem within our
software and provided a software patch. We
used test cases that covered all parts of
software, utilizing each and every path for
the given inputs including but not limited to
testing for endless loops, false condition
branches, and if we have any “dead code” or
code that doesn’t get executed whatsoever.
database was being updated. If not,
debugging of the PHP script was
required.
Test Cases:
1. For each of the
buttons, we slid it to on or off
and saw whether the
database had updated to on
or off.
b. All users to set temperature for
heating and air conditioning
I. Testing for the functionality of the
Temperature Slider
-- checked to see if the Temperature
Slider works. The slider was set from
65 to 85, as the range between those
two temperatures seem reasonable. If
not, debugging of the code was
necessary.
C. Mobile Website:
1. Features to be Tested:
a. Allow users to turn off/on
individual devices
I. Testing for the functionality of the
on/off button
-- checked to see if the button flicks
on/off. We are testing for website
flexibility and user friendliness. If the
buttons did not work, the design
JQuery/html code needed to be
checked and debugged. This was
done by running test line codes to
find any issues.
Test Cases:
1. For each integer in the
temperature scale, we slid the
control bar from lowest value to
highest value and observed whether
the website had displayed that the
slider had moved to the appropriate
temperature.
2. For each integer in the
temperature scale, we slid the
control bar from highest value to
lowest value and observed whether
the website had displayed that the
slider had moved to the appropriate
temperature.
II. Testing if the chosen temperature
was updating the database
-- checked the database if the
temperature that the user last left the
slider had been sent to the database.
Again this was a database test case, but
we needed to confirm that the PHP
script being used to transfer the data
was working. If not, we needed to
Test Cases:
1. For each of the buttons,
we flicked the button on or off to see
the action on the website. The action
being whether the website displayed
that it had is turned on or off.
II. Testing if the on/off button was
updating the database
-- checked to see if the button flicks
are updating the database. This was
primarily a database testing case, but
we needed to confirm if the script was
sending the 0 or 1 (1 for on, 0 for off)
and it was stored in the database. We
tested this by confirming if the
70
debug each line of code to trace the
source of the problem.
the buttons for setting the button to
on in normal mode but used the
buttons in power saving mode and
observed whether the website had
displayed that the button had been
turned on.
2. For each of the buttons, we
conducted the same test cases on the
buttons for setting the button to off in
normal mode but used the buttons in
power saving mode and observed
whether the website had displayed
that the button had been turned off.
3. For the temperature slider,
we conducted the same test cases on
the temperature settings for the
normal mode but used the
temperature slider in power saving
mode and observed whether the
website had displayed the
temperature according to the
temperature slider.
II. Testing if the low power mode was
updating the database
-- checked to see if the low power
mode setting data was being sent into
the database. Once the user had the
settings complete, she/he simply needed
to press a button called “Low Power
Activate” (some renaming might be
needed) for the data to be sent to the
database. If data was not being sent, we
needed to debug the PHP script.
Test Cases:
1. For each integer in the
temperature scale, we slid the
control bar from lowest value to
highest value and observed whether
the database had changed the value
for the temperature according to the
current value displayed on the
website.
2. For each integer in the
temperature scale, we slid control
bar from highest value to lowest
value and observed whether the
database had changed the value for
the temperature according to the
current value displayed on the
website
3. For each integer in the
temperature scale, we slid the
control bar one integer up and one
integer down and observed whether
the database had changed the value
for the temperature according to the
current value displayed on the
website.
c. Allow users to enter “low
power/vacation” mode
I. Testing for functionality of the low
power modes presetting option
-- checked to see if the low power
mode was functioning. The low power
mode settings had all options including
the off/on switched for each device, as
well the temperature slider. We needed
to confirm that the user can set these
settings, and if its user friendly. If the
on/off buttons or slider were not
working then we needed to debug the
code.
Test Cases:
1. For each of the buttons,
we conducted the same test cases on
the buttons for setting the button to
on in normal mode but used the
buttons in power saving mode and
observed whether the database had
updated the value of that button had
been turned on.
2. For each of the buttons, we
conducted the same test cases on the
buttons for setting the button to off in
Test Cases:
1. For each of the buttons,
we conducted the same test cases on
71
normal mode but used the buttons in
power saving mode and observed
whether the database had updated
the value of that button had been
turned off.
3. For the temperature slider,
we conducted the same test cases on
the temperature settings for the
normal mode but used the
temperature slider in power saving
mode and observed whether the
database had updated the value of
the slider according to the one
displayed website.
Test Cases:
1. Having data sent to the
Database from flex alert
e. Authentication/Log in
I. Testing for the authentication of
user
-- This test case was used to confirm
that only a designated user login can
work. There be a username and
password to confirm access to the
H.E.M.S. This data is entered into
the database where the
authentication reference used an
“equal” script to confirm that it was
the designated user. This case is
heavily tested for the sake of the
accessibility and assurance of
security. Other cases to test for also
include page bypassing and lock out
mechanisms.
d. Interface that allows utility
companies to send a “flex alert” to
H.E.M.S.
I. Testing for the functionality of the
flex alert
-- checked to see if the flex alert had
zip code options. The flex alert was
meant to be used by a utility
company in case of emergency. Flex
alert activation should include
several zip codes. If not, debugging
was required.
Test Cases:
1. Log in with authorized
user (case sensitive username) and
correct password (case sensitive
password).
2. Log in with authorized
user (case sensitive username) and
correct password (not case sensitive
password).
3. Log in with authorized
user (case sensitive username) and
incorrect password.
4. Log in with unauthorized
user and a correct password (case
sensitive) from an authorized user.
5. Log in with unauthorized
user and incorrect password.
6. Log in with single
authorized user from multiple
devices.
7. Log in with multiple
authorized users from multiple
devices.
Test Cases:
1. Having a virtual box that
can be control by the flex alert
along.
2. Able to control our frame.
3. Survey on clients opinion.
II. Testing if the flex alert was
updating the database
-- Like many other components of the
Mobile Website, the flex alert had to
send information to a database. This
database was exclusive to the utility
company. We needed to checked if
the flex alert activation for a zip
code was working; if not, debugging
of the PHP script necessary.
72
8. Type in a directory of all
known paths of mobile website
without logging in. Also known as
page bypassing
needed to update the current go-to
temperature. If not, then we checked
the database for any script error,
then confirm if it was a hardware
issue, where our hardware
teammates can then pinpoint and fix.
D. Database:
1. Features to be Tested:
a. Switches Update
I. We needed to confirm if the
data being sent into the database
from the website was being
portrayed onto the hardware.
Switching the on/off button from the
Mobile Website needed to turn off or
on the lights. If not, then we checked
the database for any script error,
and then confirm that it was a
hardware issue, so that our
hardware team can pinpoint it and
fix it.
Test Cases:
1. Test the thermostat by
changing the temperature used the
setting on the mobile website used a
connected mobile device and
observed whether it had changed the
actual thermostat readings. We
incremented the temperature in the
first few trials, and decrement the
temperature afterwards.
c. Low Power Mode Update
I. We needed to confirm if the
Low Power Mode activation data
was being sent to the database and
updating the hardware. Since this
was multi- activation scenario, we
confirm that each of the settings the
user decided on was updating the
database and hardware correctly. If
not, we checked the PHP script that
was updating each of the devices. If
no problem was found there, we
pinpoint the problem if the issue was
a hardware problem. If it was, we
updated and worked with our
hardware teammates to debug it.
Test Cases:
1. Test each attached
appliance by turning on and off one
by one using the setting on the
mobile website used one connected
mobile device and observed whether
it had affected the appliance
associated with the mobile website.
We started with the lighting, then
each individual node device.
2. Test each attached
appliance by turning on and off one
by one used the setting on the mobile
website used multiple connected
mobile devices and observed whether
it had affected the appliance
associated with the mobile website.
Test Cases:
1. Test whether the default
data configured in the Low Power
Mode in the database was being sent
to the actual appliance associated
with Low Power Mode and observed
the actual display of each appliance.
2. Test whether data
configured by user in the Low Power
Mode in the database was being sent
to the actual appliance associated
b. Thermostat Update
I. We needed to confirm if the
temperature data was being sent into
the database was changing the
thermostat. Sliding the temperature
slider from the Mobile Website
73
with Low Power Mode and observed
the actual display of each appliance.
74
E. Results:
Our results show that our software is performing as expected and we have cleaned up the
code that we have either updated or removed. Our output matches what we expected of our
inputs and if it didn't, we provided a software fix. There was one test that we took into
consideration of our perspective clients. This was an interesting test where we had to go out and
talk to random people. We talked to about 50 people near Wal-Mart by Florin Road
(Sacramento). We asked 4 questions:
Could you afford to put this system in your house ($1500)?
o 20/50 say Yes they could afford it.
Would you like our product in your home?
o 15/20 of the people who could afford it say Yes if it was safe.
o 45/50 say Yes if they could afford it
so those 5 was stingy
Would you let the Utility Company control an aspect of it?
o 49/50 say NO
that 1 said sarcastically "sure why not"
Would you give the permission if the utility company is willing to provide rebates and
financing options for you?
o 28/50 say Yes
those Yes was mainly from those who couldn't afford it
The answer varies from person to person. But, overall we got that the customer will not let
utility company in without any compensation or incentives.
The following below shows other type of testing we had done. Each table are results of each of
the individual testing of each of the separate sections of the software testing.
TABLE 16
SOFTWARE TESTING WEBSITE TO DATABASE--OUTLET
Mobile
Website Trials
Outlet 1
Outlet 2
Database
Outlet 1
Database
Outlet 2
Pass
or Fail
1
On
On
1
1
Pass
2
Off
On
0
1
Pass
3
On
On
1
1
Pass
4
Off
Off
0
0
Pass
5
On
On
1
1
Pass
6
Off
Off
0
0
Pass
7
On
On
1
1
Pass
8
Off
Off
0
0
Pass
9
On
On
1
1
Pass
10
Off
Off
0
0
Pass
75
TABLE 17
MOBILE WEBSITE TO DATABASE -- TEMPERATURE
Mobile
Website
Trials
Cold
Temperature
Input
Hot
Temperature
Input
Database: Cold
Temperature
Database: Hot
Temperature
Pass
or Fail
1
65
85
265
185
Pass
2
66
84
266
184
Pass
3
67
83
267
183
Pass
4
68
82
268
182
Pass
5
69
81
269
181
Pass
6
70
80
270
180
Pass
7
71
79
271
179
Pass
8
72
76
272
176
Pass
9
73
75
273
175
Pass
10
74
74
274
174
Pass
TABLE 18
CHECKING UPDATE BETWEEN WEBPAGE THERMOSTAT VALUE AND DATABASE
Mobile Website Trials
Off
Database Update
Pass or Fail
1
70
070
Pass
2
71
071
Pass
3
72
072
Pass
4
73
073
Pass
5
74
074
Pass
6
75
075
Pass
7
76
076
Pass
8
77
077
Pass
9
78
078
Pass
10
79
079
Pass
76
TABLE 19
MOBILE WEBSITE TO DATABASE -- LOW POWER MODE
Mobile Website Trials
Low Power Mode - ON
Database
Update
Pass or Fail
1
Outlet 1 → On
Outlet 2 → On
Temp → Cold: 66
Outlet 1 → 1
Outlet 2 → 1
Temp → 266
Pass
2
Outlet 1 → On
Outlet 2 → Off
Temp → Hot: 84
Outlet 1 → 1
Outlet 2 → 0
Temp → 184
Pass
3
Outlet 1 → Off
Outlet 2 → On
Temp → Off: 75
Outlet 1 → 0
Outlet 2 → 1
Temp → 075
Pass
4
Outlet 1 → On
Outlet 2 → On
Temp → Cold: 69
Outlet 1 → 1
Outlet 2 → 1
Temp → 269
Pass
5
Outlet 1 → Off
Outlet 2 → On
Temp → Hot: 80
Outlet 1 → 0
Outlet 2 → 1
Temp → 180
Pass
6
Outlet 1 → Off
Outlet 2 → Off
Temp → Off: 80
Outlet 1 → 0
Outlet 2 → 0
Temp → 080
Pass
7
Outlet 1 → On
Outlet 2 → Off
Temp → Cold: 74
Outlet 1 → 1
Outlet 2 → 0
Temp → 274
Pass
8
Outlet 1 → On
Outlet 2 → On
Temp → Hot: 78
Outlet 1 → 1
Outlet 2 → 1
Temp → 178
Pass
9
Outlet 1 → On
Outlet 2 → Off
Temp → Off: 85
Outlet 1 → 1
Outlet 2 → 0
Temp → 085
Pass
10
Outlet 1 → On
Outlet 2 → On
Temp → Cold: 70
Outlet 1 → 1
Outlet 2 → 1
Temp → 270
Pass
TABLE 20
MOBILE WEBSITE TO DATABASE -- AUTHENTICATION
User(s)
password
Pass
or Fail
77
Notes
Authorized
correct
Pass
N/A
Authorized
correct
Pass
N/A
Authorized
incorrect
Pass
Should restrict number of attempted logins to
prevent brute force attacks.
Single user/multiple devices
(3)
correct
Pass
Should add alert showing login from multiple
devices
Single user/multiple
devices(5)
correct
Pass
Should add alert showing login from multiple
devices
Single user/multiple
devices(7)
correct
Pass
Should add alert showing login from multiple
devices
Multiple users (3)/single
device (1)
correct
Pass
Should add alert showing login from multiple
users
Multiple users (3)/multiple
devices (5)
correct
Pass
Should add alert showing login from multiple
users
Multiple users (3)/multiple
devices (5)
correct
Pass
Should add alert showing login from multiple
users
Unauthorized/Not registered
incorrect
Pass
Should restrict number of attempted logins to
prevent brute force attacks to find username
and password combinations
Unauthorized/Not registered
From another
existing user
Pass
N/A
Bypassing login page by
entering direct path in URL
N/A
Pass
Previously failed but provided a software
patch.
TABLE 21
MOBILE WEBSITE TO DATABASE FLEX ALERT
Mobile Website
Trials
Flex Alert -On
Current Settings
before Flex Alert
1
On
Outlet 1 → Off
Outlet 2 → Off
Temp → Off: 75
Outlet 1 → On
Outlet 2 → On
Temp → Cold: 68
Outlet 1 → 0
Outlet 2 → 0
Temp → 075
Pass
2
On
Outlet 1 → Off
Outlet 2 → Off
Temp → Off: 75
Outlet 1 → Off
Outlet 2 → On
Temp → Cold: 68
Outlet 1 → 0
Outlet 2 → 0
Temp → 075
Pass
78
Database
Update
0 = On
1= Off
0xx = off
1xx = heat
2xx = cold
Pass or
Fail
3
On
Outlet 1 → Off
Outlet 2 → Off
Temp → Off: 75
Outlet 1 → On
Outlet 2 → Off
Temp → Cold: 68
Outlet 1 → 0
Outlet 2 → 0
Temp → 075
Pass
4
On
Outlet 1 → Off
Outlet 2 → Off
Temp → Off: 75
Outlet 1 → Off
Outlet 2 → Off
Temp → Cold: 68
Outlet 1 → 0
Outlet 2 → 0
Temp → 075
Pass
5
Off
Outlet 1 → On
Outlet 2 → On
Temp → Cold: 68
Outlet 1 → 1
Outlet 2 → 1
Temp → 268
Pass
6
Off
Outlet 1 → Off
Outlet 2 → On
Temp → Cold: 68
Outlet 1 → 0
Outlet 2 → 1
Temp → 268
Pass
7
Off
Outlet 1 → On
Outlet 2 → Off
Temp → Cold: 68
Outlet 1 → 1
Outlet 2 → 0
Temp → 268
Pass
8
Off
Outlet 1 → Off
Outlet 2 → Off
Temp → Cold: 68
Outlet 1 → 0
Outlet 2 → 0
Temp → 268
Pass
We ran a script to check the global performance of the queries done between our website and
our database in the Raspberry Pi (this includes transportation to the database + execution +
transportation back to the server.). Ideally, latency time in the United States consisted of the four
main broadband service options, with a latency time as follows:
TABLE 22
US LATENCY SERVICE SPEED
LATENCY TIME
FIBER OPTIC
18 MS
CABLE
26 MS
DSL
44 MS
SATELLITE
638 MS
Since we ran our system on a local network, the script gave us an average latency time of about
85 ms. The global performance was shown to be at 160 ms. We can conclude that the user inputs
on the mobile website is satisfactory based on United States wireless broadband services
standards.
79
profit, as well as the concept of mainstream
appeal, and target consumers: off-grid
individuals, energy saving advocates, and
environmentalist. The completion of all
documentation has been a vital part of
growing the team, and it has been a very
beneficial and educational experience.
With the completion of the A-Frame,
and the testing results outcome being
satisfactory, the Home Energy Management
System is now ready for the final
presentation, the Trade Show. From Fall
2013 to Spring 2014, the team has worked
together developing and documenting the
H.E.M.S, all in hopes of building an
industry level project to prepare them for the
future. The concept of the Senior Design
Course was to train the students for the
future. One can never say they are fully
ready for what is to come as life is
unpredictable throwing new and unexpected
roadblocks. The best one can do is simply to
be prepared. And this is what the team has
concluded. Prime your skills, and sharpen
your knowledge, because with those, you
can stand your ground for whatever comes.
We are Team 11, and we designed a Home
Energy Management System that tracked
and displayed homeowner's energy usage,
and provided energy saving controls to the
consumer.
XXII. CONCLUSION
The Senior Design Course is meant to
put students in an industry like simulation to
allow them to experience what it means to
have critical deadlines, to have test plans, to
have tasks and allocations, and to work as a
group on a project. It is to prepare the
graduating students for their future careers,
teaching them the essentials of how
industry-level work operates. The team has
taken the course for two semesters, building
and developing a project that utilized a
plethora of skills and documentation. The
most important skill gained from the course
was agreed on to be the ability to operate as
a unit. Being able to work on a team and
adapt to each other’s strengths and
weaknesses has been the most essential part
of the project. When one of the team
members’ lacked the knowledge to
implement a circuit or a multithreaded
program, there were those who were able to
teach and apply their skills to accomplish
the necessary goal. It can be said that
projects in a real life scenario is done
through engineering teams, and this course
has prepared the team for this.
The Home Energy Management System
is built on the idea of reducing energy waste
through automated controls. With a userfriendly Mobile Website Interface that
integrates mobile use and accessibility, the
software system of the Home Energy
Management System is ready to operate at
the consumer level. The hardware, mostly
made up of the mesh system and its node,
works together to activate relays and send
and take information as needed. All of this is
transferred through a base station acting as
the middleman and messenger. The system
is now operating as one unit, depending on
each part to complete its piece similarly to
how the team is. The addition of the Market
Review gave the team an understanding of
how the economical side of engineering
worked. It taught the team the value of
80
REFERENCES
[1]
[2]
[3]
[4]
Market Trends - US. Energy Demand, "Annual Energy
Outlook 2014," [online] 2014, Available:
<http://www.eia.gov/forecasts/aeo/MT_energydemand.cfm
>(Accessed: 7 April 2014).
"7 Trends in Home Energy in 2013 and What they Mean for
2014”, Katherince Tween, 2013,
<http://www.greentechmedia.com/articles/read/7-trends-inhome-energy-in-2013-and-what-it-means-for2014?utm_source=Daily&utm_medium=Headline&utm_cam
paign=GTMDaily>
OpenEnergyMonitor. 2010. Measuring Voltage and Current.
[image online] Available at:
<http://openenergymonitor.org/emon/sites/default/files/curre
ntvoltage_bb.jpg> [Accessed: 6 Apr 2014].
US Census Berueau, “Median and Average Square Feet of
Floor Area in New Single-Family Houses Completed by
Location,” [online], Available:
[5]
[6]
[7]
[8]
81
<http://www.census.gov/const/C25Ann/sftotalmedavgsqft.pd
f> (Accessed: 4 April 2014).
"Promoting Homeownership Among Low-Income
Households, 2007." The Urban Institute. Web. 27 Feb. 2014.
<http://www.urban.org/UploadedPDF/411523_promoting_ho
meownership.pdf>
"Which Income Class Are You." Investopedia US. Web. 28
Feb. 2014. <http://www.investopedia.com/financialedge/0912/which-income-class-are-you.aspx>
R. Faludi, “API and a Sensor Network” in Building Wireless
Sensor Networks: with ZigBee, Xbee, Arduino and
Processing. 1st ed. Sepastopol: O’Reilly, 2010.
"Causes of Lag on Computer Networks and Online."
About.com. Web. 04 April 2014
<http://compnetworking.about.com/od/basicnetworkingconce
pts/a/causes-of-lag-on-computer-networks-and-online.htm>
Node Device - The control circuitry that reads the power data
and/or controls a household electrical device, such as a light,
outlet or HVAC.
Glossary
AJAX(Asynchronous Javascript and XML) - interconnected web
development tools used on the client side to create web pages that
are dynamic with change.
OTLWR - Outgoing Team Leader Written Report
Design idea - A feature list of design specs that specifies what the
final product should be able to do.
PHP(Hypertext preprocessor) - a user/server-side scripting
language created for web development. It is also a general
programming language used by many.
H.E.M.S ( Home Energy Management System ) - A smart home
control system that is comprised of a mesh community, actively
communicating with a central core base station that is providing
energy data and controls to the consumer.
Power Sensing Circuit - A circuit that makes up the voltage and
current sensing aspects of the system that consists of a series of
voltage dividers and a burden resistor, as well as a 100A current
transformer and 9V AC-AC power adapter.
Home Controller - A Raspberry Pi and XBee that hosts the mobile
website and contains the algorithms necessary to interface the
website with the various node devices.
Relay Circuit - A circuit consisting of a 5A miniature relay, a
2N3904 transistor, a 1k resistor, and a diode that controls the wall
outlets.
HTML(Hyper Text Markup Language) - the standard system for
tagging text files to create font, color, graphics and links to the
Internet.
Societal Problem - A worldwide problem that is effecting a large
portion of humanity.
HVAC - Stands for heating, ventilating, and air conditioning. It is
the technology consisting of indoor and vehicular environmental
comfort.
TEAM 11 - The Senior Design team creating and marketing the
Home Energy Management System. It is composed of four
Computer Engineers (Logan Odell, Va Banh, Billy Saetern,
Waleng Vang) and one Electrical & Electronic Engineer (Sean
O’Hara.)
JAVASCRIPT - a programming language that is object oriented
and is commonly used to create interactive effects on a website.
Work Breakdown Structure - A decomposition of the working
schedule of a project into graphical and table view.
jQuery Mobile Libraries - a mobile/touch optimized web
framework used to create web pages that are meant for mobile use.
It converts basic HTML tags into simplistic touch options.
XBee Circuit - A circuit that consists of a series of resistors used
as voltage dividers to convert 5V to 3.3V to allow power to
individual XBee’s.
82
APPENDIX
Appendix A: Electrical Power Overview
In order to measure energy not only at a
single node, but an entire home, there are
two necessary electrical properties that are
needed: voltage and current. In particular,
the RMS voltage and RMS current are
needed in order to find effective AC values.
If the direct AC voltage and current values
were used versus the RMS current and RMS
voltage values, the nature of a sinusoidal
signal (fluctuating positive to negative)
would result in values of zero, which is not
useful. So, in this case, the RMS values are
critical in order to find the apparent power,
power factor, and primarily, real power.
power adapter (or step down transformer or
AC to AC power adapter) is used to isolate
high voltage AC from low voltage AC. In
this case, the 120V AC input voltage into
the power adapter is stepped down to 9V AC
RMS, or 12.7V AC peak value. A voltage is
required to be between 0 and 5V in order to
be fed into the analog input of the Arduino
microcontroller. This means that the 12.7V
AC output from the power adapter needs to
be converted to a positive peak value less
than 5V and a negative peak value more
than 0V. To do this, the output voltage is
scaled down and an offset is added in order
to omit negatives values. First, a voltage
divider consisting of a 100k Ω and a 10k Ω
resistor is used to scale down the AC
waveform to a peak value of 1.15V.
=
= 1.15V
Second, another voltage divider is used to
provide a DC bias voltage (offset) consisting
of two 10k Ω resistors, which results in half
the Arduino’s supply voltage (5V, since the
resistors are equal) to yield 2.5V.
=
= 2.5V
Figure 52:Energy Measurement Circuit
Lastly, a 10uF capacitor is used to provide
the AC voltage a low impedance path to
ground. The resulting waveform now has a
positive peak voltage value of 3.65V
SOURCE[3]
Voltage Sensing
In order to measure an AC sinusoidal
voltage (RMS specifically) safely without
any high voltage involved, an AC to AC
i
=
=
secondary peak-current, which is found by
dividing the primary peak-current by the
number of turns (N = 2000 turns for this
particular current sensor).
3.65V
and a negative peak of 1.35V,
=
=
=
1.35V
=
141.42A
which corresponds to the Arduino’s analog
input requirements.
= 0.0707A
Current Sensing
=
In addition, to measure an AC sinusoidal
current (RMS specifically), a non-invasive
100A (max) current sensor (or split core
current transformer) was used to clamp
around a supply line of an electrical load in
order to determine the amount of current
that is passing through it. The device does
this by imitating the properties of an
inductor, which responds to magnetic fields
that surround a conductor due to a current
flowing through it. It is important to only
clamp the device around either the hot or
neutral conductor of an electrical load versus
both of them to avoid cancelling out the
magnetic fields, which will result in a
current reading of 0A. The output signal of
the current sensor, like the voltage sensor,
also needs to have a voltage between 0 and
5V before being passed into the analog
inputs of the Arduino microcontroller. Once
a current reading is obtained from the
current sensor, the output is fed into a 33 Ω
burden resistor to convert the output current
waveform into a measurable voltage
waveform by the Arduino. The closest
standard resistor value of 33 Ω (35.36 Ω
exactly) is chosen and calculated by dividing
half the Arduino’s analog reference voltage
(to maximize the voltage measurement
resolution over the burden resistor) by the
= 35.36 Ω
This resistor is required because this specific
current sensor does not have a burden
resistor already built into it. Two 10k Ω
biasing resistors are also used to similarly
add a DC bias voltage of half the Arduino’s
supply voltage, resulting in 2.5V using the
previous bias voltage equation.
Lastly, a 10uF capacitor is also used to
provide a low reactance and secondary path
to ground for the AC signal.
Energy Calculations
Now that the raw analog input voltage
values have been obtained and have a range
between 0 and 5V, the real power can be
found using the Arduino EmonLib. First, the
analogRead ( ) command is used to convert
the analog input voltage value (between 0 to
5V) to a digital value between 0 and 1023
( = 1024) through the use of an analog-todigital converter. Once the digital value of
the waveform is close to zero,
approximately 500 on sinusoidal signal, it is
sampled. The amount of samples are defined
by the number of half wavelengths chosen to
be measured, which in this case by
comparing the voltage and current values of
ii
a multimeter to the values calculated by the
EmonLib were chosen to be 20 samples to
get the most accurate results for a 121
voltage and 52 current calibration values.
This sampled signal is then passed through a
digital high pass filter to remove the 2.5V
DC offset.
nodes. All of these nodes are wirelessly
connected together to establish a ZigBee
mesh network, which makes up almost the
entire hardware aspect of the system.
Interdependence of Energy Measurement
Circuit
The energy measurement circuit makes up
the foundation of the H.E.M.S. The entire
project began using this circuit, and without
it, the system would only be a web interface
with a mesh network without any useful data
involved. The energy measurement circuit is
able to produce a low voltage digital output
that is proportional to a high voltage analog
output. The actual energy measurements
from individual nodes are the high voltage
analog outputs that are converted to a low
voltage digital output that the Arduino uses
to present useful data on a computer. This
represents the very basis of how our energy
measurement sub system functions.
Although meaningful data is obtained using
the energy measurement circuit, this does
not mean that the other components of our
system can be omitted. By only being able
to view energy measurement data on the
serial monitor of the Arduino I.D.E. is not
very useful when it comes to monitoring and
controlling an entire home. A computer
would be needed for each node and there
still would be no logical way to combine all
of the data together to view total house
energy consumption unless each energy
reading at individual nodes were manually
added together one by one. This is not ideal
and does not represent an efficient way
going about finding this information.
To obtain the real power, which is the
primary concern, the instantaneous power is
needed. To calculate this value, the phase
shifted voltage is multiplied by the digital
HPF current value.
The voltage and current ratio values are then
multiplied by the ratio of the instantaneous
power and the number of samples to find the
real power.
where
= 0.591
= 0.254
Each node of our system consists of an
energy measurement circuit, which consists
of a voltage sensor, current sensor, resistors,
capacitors, and a standalone Arduino
microcontroller circuit to deliver the real
power calculations. Along with this circuit
exists an XBee circuit to send the energy
data to the base station, and simple relay
circuit to trigger wall outlets on/off. All of
these circuits are integrated on a single
circuit board and make up the individual
iii
Appendix B: EMON Library
Emon.h
powerFactor,
Vrms,
Irms;
/*
Emon.h - Library for openenergymonitor
Created by Trystan Lea, April 27 2010
GNU GPL
modified to use up to 12 bits ADC
resolution (ex. Arduino Due)
by [email protected] 26.12.2013
*/
private:
//Set Voltage and current input pins
int inPinV;
int inPinI;
//Calibration coeficients
//These need to be set in order to obtain
accurate results
double VCAL;
double ICAL;
double PHASECAL;
#ifndef EmonLib_h
#define EmonLib_h
#if defined(ARDUINO) && ARDUINO >= 100
#include "Arduino.h"
//-----------------------------------------------------------------------------------// Variable declaration for emon_calc
procedure
//-----------------------------------------------------------------------------------int lastSampleV,sampleV;
//sample_ holds
the raw analog read value, lastSample_ holds
the last sample
int lastSampleI,sampleI;
#else
#include "WProgram.h"
#endif
// to enable 12-bit ADC resolution on
Arduino Due,
// include the following line in main sketch
inside setup() function:
// analogReadResolution(ADC_BITS);
// otherwise will default to 10 bits, as in
regular Arduino-based boards.
#if defined(__arm__)
#define ADC_BITS
12
#else
#define ADC_BITS
10
#endif
#define ADC_COUNTS
double lastFilteredV,filteredV;
//Filtered_ is the raw analog value
minus the DC offset
double lastFilteredI, filteredI;
double phaseShiftedV;
//Holds the calibrated phase shifted
voltage.
(1<<ADC_BITS)
class EnergyMonitor
{
public:
double sqV,sumV,sqI,sumI,instP,sumP;
//sq = squared, sum = Sum, inst =
instantaneous
void voltage(int _inPinV, double _VCAL,
double _PHASECAL);
void current(int _inPinI, double _ICAL);
int startV;
//Instantaneous voltage at start of
sample window.
void voltageTX(double _VCAL, double
_PHASECAL);
void currentTX(int _channel, double
_ICAL);
boolean lastVCross, checkVCross;
//Used to measure number of times
threshold is crossed.
int crossCount;
// ''
void calcVI(int crossings, int timeout);
double calcIrms(int NUMBER_OF_SAMPLES);
void serialprint();
};
long readVcc();
//Useful value variables
double realPower,
apparentPower,
#endif
Emon.cpp
ii
/*
Emon.cpp - Library for openenergymonitor
Created by Trystan Lea, April 27 2010
GNU GPL
modified to use up to 12 bits ADC
resolution (ex. Arduino Due)
by [email protected] 26.12.2013
*/
if (_channel == 2) inPinI = 0;
if (_channel == 3) inPinI = 1;
ICAL = _ICAL;
}
//------------------------------------------------------------------------------------// emon_calc procedure
// Calculates
realPower,apparentPower,powerFactor,Vrms,Irm
s,kwh increment
// From a sample window of the mains AC
voltage and current.
// The Sample window length is defined by
the number of half wavelengths or crossings
we choose to measure.
//------------------------------------------------------------------------------------void EnergyMonitor::calcVI(int crossings,
int timeout)
{
#if defined emonTxV3
int SUPPLYVOLTAGE=3300;
#else
int SUPPLYVOLTAGE = readVcc();
#endif
//#include "WProgram.h" un-comment for use
on older versions of Arduino IDE
#include "EmonLib.h"
#if defined(ARDUINO) && ARDUINO >= 100
#include "Arduino.h"
#else
#include "WProgram.h"
#endif
//------------------------------------------------------------------------------------// Sets the pins to be used for voltage and
current sensors
//------------------------------------------------------------------------------------void EnergyMonitor::voltage(int _inPinV,
double _VCAL, double _PHASECAL)
{
inPinV = _inPinV;
VCAL = _VCAL;
PHASECAL = _PHASECAL;
}
int crossCount = 0;
//Used to measure number of times
threshold is crossed.
int numberOfSamples = 0;
//This is now incremented
//----------------------------------------------------------------------------------------------------------------------// 1) Waits for the waveform to be close to
'zero' (500 adc) part in sin curve.
//----------------------------------------------------------------------------------------------------------------------boolean st=false;
//an indicator to exit the while loop
void EnergyMonitor::current(int _inPinI,
double _ICAL)
{
inPinI = _inPinI;
ICAL = _ICAL;
}
//------------------------------------------------------------------------------------// Sets the pins to be used for voltage and
current sensors based on emontx pin map
//------------------------------------------------------------------------------------void EnergyMonitor::voltageTX(double _VCAL,
double _PHASECAL)
{
inPinV = 2;
VCAL = _VCAL;
PHASECAL = _PHASECAL;
}
unsigned long start = millis();
//millis()-start makes sure it doesnt get
stuck in the loop if there is an error.
while(st==false)
//the while loop...
{
startV = analogRead(inPinV);
//using the voltage waveform
if ((startV < (ADC_COUNTS/2+50)) &&
(startV > (ADC_COUNTS/2-50))) st=true;
//check its within range
if ((millis()-start)>timeout) st = true;
}
void EnergyMonitor::currentTX(int _channel,
double _ICAL)
{
if (_channel == 1) inPinI = 3;
//-----------------------------------------------------------------------------------------------------------------------
ii
// 2) Main measurment loop
//----------------------------------------------------------------------------------------------------------------------start = millis();
//2) sum
//---------------------------------------------------------------------------// E) Phase calibration
//---------------------------------------------------------------------------phaseShiftedV = lastFilteredV + PHASECAL
* (filteredV - lastFilteredV);
while ((crossCount < crossings) &&
((millis()-start)<timeout))
{
numberOfSamples++;
//Count number of times looped.
//---------------------------------------------------------------------------// F) Instantaneous power calc
//---------------------------------------------------------------------------instP = phaseShiftedV * filteredI;
//Instantaneous Power
sumP +=instP;
//Sum
lastSampleV=sampleV;
//Used for digital high pass filter
lastSampleI=sampleI;
//Used for digital high pass filter
lastFilteredV = filteredV;
//Used for offset removal
lastFilteredI = filteredI;
//Used for offset removal
//---------------------------------------------------------------------------// G) Find the number of times the
voltage has crossed the initial voltage
//
- every 2 crosses we will have
sampled 1 wavelength
//
- so this method allows us to
sample an integer number of half wavelengths
which increases accuracy
//----------------------------------------------------------------------------
//---------------------------------------------------------------------------// A) Read in raw voltage and current
samples
//---------------------------------------------------------------------------sampleV = analogRead(inPinV);
//Read in raw voltage signal
sampleI = analogRead(inPinI);
//Read in raw current signal
lastVCross = checkVCross;
//---------------------------------------------------------------------------// B) Apply digital high pass filters to
remove 2.5V DC offset (centered on 0V).
//---------------------------------------------------------------------------filteredV =
0.996*(lastFilteredV+(sampleV-lastSampleV));
filteredI =
0.996*(lastFilteredI+(sampleI-lastSampleI));
if (sampleV > startV) checkVCross =
true;
else checkVCross =
false;
if (numberOfSamples==1) lastVCross =
checkVCross;
if (lastVCross != checkVCross)
crossCount++;
}
//---------------------------------------------------------------------------// C) Root-mean-square method voltage
//---------------------------------------------------------------------------sqV= filteredV * filteredV;
//1) square voltage values
sumV += sqV;
//2) sum
//----------------------------------------------------------------------------------------------------------------------// 3) Post loop calculations
//----------------------------------------------------------------------------------------------------------------------//Calculation of the root of the mean of
the voltage and current squared (rms)
//Calibration coeficients applied.
//---------------------------------------------------------------------------// D) Root-mean-square method current
//---------------------------------------------------------------------------sqI = filteredI * filteredI;
//1) square current values
sumI += sqI;
double V_RATIO = VCAL
*((SUPPLYVOLTAGE/1000.0) / (ADC_COUNTS));
Vrms = V_RATIO * sqrt(sumV /
numberOfSamples);
double I_RATIO = ICAL
iii
*((SUPPLYVOLTAGE/1000.0) / (ADC_COUNTS));
Irms = I_RATIO * sqrt(sumI /
numberOfSamples);
{
Serial.print(realPower);
Serial.print(' ');
Serial.print(apparentPower);
Serial.print(' ');
Serial.print(Vrms);
Serial.print(' ');
Serial.print(Irms);
Serial.print(' ');
Serial.print(powerFactor);
Serial.println(' ');
delay(100);
//Calculation power values
realPower = V_RATIO * I_RATIO * sumP /
numberOfSamples;
apparentPower = Vrms * Irms;
powerFactor=realPower / apparentPower;
//Reset accumulators
sumV = 0;
sumI = 0;
sumP = 0;
//-------------------------------------------------------------------------------------
}
//thanks to
http://hacking.majenko.co.uk/makingaccurate-adc-readings-on-arduino
//and J��r��me who alerted us to
http://provideyourown.com/2012/secretarduino-voltmeter-measure-battery-voltage/
}
//------------------------------------------------------------------------------------double EnergyMonitor::calcIrms(int
NUMBER_OF_SAMPLES)
{
long EnergyMonitor::readVcc() {
long result;
//not used on emonTx V3 - as Vcc is always
3.3V - eliminates bandgap error and need for
calibration
http://harizanov.com/2013/09/thoughts-onavr-adc-accuracy/
#if defined emonTxV3
int SUPPLYVOLTAGE=3300;
#else
int SUPPLYVOLTAGE = readVcc();
#endif
#if defined(__AVR_ATmega168__) ||
defined(__AVR_ATmega328__) || defined
(__AVR_ATmega328P__)
ADMUX = _BV(REFS0) | _BV(MUX3) | _BV(MUX2)
| _BV(MUX1);
#elif defined(__AVR_ATmega32U4__) ||
defined(__AVR_ATmega1280__) ||
defined(__AVR_ATmega2560__) ||
defined(__AVR_AT90USB1286__)
ADMUX = _BV(REFS0) | _BV(MUX4) | _BV(MUX3)
| _BV(MUX2) | _BV(MUX1);
ADCSRB &= ~_BV(MUX5);
// Without this the
function always returns -1 on the ATmega2560
http://openenergymonitor.org/emon/node/2253#
comment-11432
#elif defined (__AVR_ATtiny24__) ||
defined(__AVR_ATtiny44__) ||
defined(__AVR_ATtiny84__)
ADMUX = _BV(MUX5) | _BV(MUX0);
#elif defined (__AVR_ATtiny25__) ||
defined(__AVR_ATtiny45__) ||
defined(__AVR_ATtiny85__)
ADMUX = _BV(MUX3) | _BV(MUX2);
for (int n = 0; n < NUMBER_OF_SAMPLES; n++)
{
lastSampleI = sampleI;
sampleI = analogRead(inPinI);
lastFilteredI = filteredI;
filteredI = 0.996*(lastFilteredI+sampleIlastSampleI);
// Root-mean-square method current
// 1) square current values
sqI = filteredI * filteredI;
// 2) sum
sumI += sqI;
}
double I_RATIO = ICAL
*((SUPPLYVOLTAGE/1000.0) / (ADC_COUNTS));
Irms = I_RATIO * sqrt(sumI /
NUMBER_OF_SAMPLES);
//Reset accumulators
sumI = 0;
//-------------------------------------------------------------------------------------
#endif
#if defined(__AVR__)
delay(2);
// Wait for Vref to settle
ADCSRA |= _BV(ADSC);
// Convert
return Irms;
}
void EnergyMonitor::serialprint()
iv
while (bit_is_set(ADCSRA,ADSC));
result = ADCL;
result |= ADCH<<8;
result = 1126400L / result;
//1100mV*1024 ADC steps
http://openenergymonitor.org/emon/node/1186
return result;
#elif defined(__arm__)
return (3300);
//Arduino Due
#else
return (3300);
//Guess that other un-supported
architectures will be running a 3.3V!
#endif
}
v