Download ARM Software Development: User Manual
Transcript
ARM SOFTWARE DEVELOPMENT
USER MANUAL
This document describes an integrated design environment for developing C-language applications for the ARM
(Cortex-M3) processor on the ComBlock modules. The environment is based on popular open-source programs
such as Eclipse which the user may be already familiar with.
This user manual covers five key topics:
1. Installation on a PC of a comprehensive, free software development environment.
2. Compiling the baseline C program and loading it into the ARM processor.
3. Debugging
4. FPGA – ARM processor communication
5. USB communication
This document applies primarily to ComBlock modules equipped with the NXP LPC1759 ARM Cortex-M3
processor, namely:
COM-1500 FPGA (Spartan-6 LX45/LX150) + ARM + DDR2 SODIMM socket + NAND development platform
COM-1600 FPGA (Spartan-6 LX16) + ARM + USB2 + DDR2 + NAND development platform
and any subsequent platforms.
FPGA developers may skip this document entirely unless they are using the ARM co-processor for mixed
FPGA/ARM custom algorithms.
1. Software Development Environment
The software development environment comprises four key components:
1. GNU GCC C/C++ compiler. [Yagarto GNU ARM toolchain for Windows and make tools]
2. Eclipse IDE for C/C++ Developers [Eclipse Galileo, CDT]
3. Java JRE (needed for Eclipse)
4. OpenOCD debugger
Important Note: the GNU programs must be installed in directories without spaces in the name. In
particular, c:\Program Files\… will NOT work.
Your PC must be connected to the Internet during the installation in order to access installation files.
1.1 In-Circuit Debugging (OpenOCD + GDB)
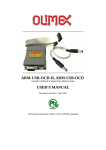
In-circuit debugging, as described in this Section, assumes the use of the Olimex ARM-USB-OCD JTAG
adapter hardware (dongle).
The dongle bridges the PC (via USB cable) and the target board (via a 20-pin JTAG cable).
Insert pic here
MSS • 18221-A Flower Hill Way • Gaithersburg, Maryland 20879 • U.S.A.
Telephone: (240) 631-1111 Facsimile: (240) 631-1676
www.ComBlock.com
© MSS 2010
Issued 3/13/2012
1.1.1 JTAG Communication Check
First, let’s verify that the JTAG communication works properly. Power up the target board. Highlight the project
in Eclipse project explorer, then start one of the OpenOCD programs from the Eclipse Run | External Tools
menu.
The console should show the following reports:
Open On-Chip Debugger 0.4.0 (2010-02-22-19:05)
Licensed under GNU GPL v2
Info : JTAG tap: lpc1768.cpu tap/device found: 0x4ba00477 (mfg: 0x23b, part:
0xba00, ver: 0x4)
The “tap/device found” message means that the JTAG communication is working between Eclipse and the
target ARM processor.
Two versions of the OpenOCD are supplied: one focused on flash programming and/or debugging, the other
focused on RAM debugging.
1.1.2 Flash programming
The flash memory area of the ARM processor can be programmed via JTAG. This is only one of the several
ways of programming the microprocessor.
Step 1: edit the makefile to set “TARGET = flash”, then save the modified makefile.
Step 2: do a project clean (Eclipse | Project | Clean menu)
Step 3: build the project (Eclipse | Project | Build Project menu). This will create the .hex and .elf files.
Step 4: start the OpenOCD_flash external tools (Eclipse | Run | External Tools | OpenOCD_flash menu) as
discussed in the previous section.
Step 5: switch Eclipse to the Debug perspective
Step 6: run the CB1600flash debug configuration (Eclipse | Run | Debug Configurations | Zylin Embedded
Debug (Native) | CB1600flash menu)
The relevant “Debug Configuration” screens are shown below:
2
3
The screenshot above only shows a partial list of ‘Run’ commands. The complete list of GDB commands for
flash programming followed by debugging is as follows:
target remote localhost:3333
symbol-file CB1600_flash.elf
monitor reset
monitor sleep 500
monitor soft_reset_halt
monitor flash erase_sector 0 0 29
monitor flash write_image CB1600_flash.hex 0x00
thbreak main
cont
1.1.3 Loading the program in RAM
Alternatively, the program can be loaded into the RAM memory area of the ARM processor prior to debugging.
Please note that the RAM area is much small than the Flash area and thus cannot be used for full-size programs.
Step 1: edit the makefile to set “TARGET = ram”, then save the modified makefile.
Step 2: do a project clean (Eclipse | Project | Clean menu)
Step 3: build the project (Eclipse | Project | Build Project menu). This will create the .hex and .elf files.
Step 4: start the OpenOCD_ram external tools (Eclipse | Run | External Tools | OpenOCD_flash menu) as
discussed previously.
Step 5: switch Eclipse to the Debug perspective
Step 6: run the CB1600ram debug configuration (Eclipse | Run | Debug Configurations | Zylin Embedded Debug
(Native) | CB1600ram menu)
The GDB commands for loading the program in RAM before debugging is as follows:
target remote localhost:3333
monitor reset
monitor sleep 500
monitor soft_reset_halt
#set VTOR to SRAM
mon mww 0xE000ED08 0x10000000
load CB1600_ram.elf
monitor reg pc 0x10000004
symbol-file CB1600_ram.elf
thbreak main
continue
1.1.4 Debugging
1.1.5 Troubleshooting OpenOCD + Debugger
Symptoms
Upon starting the OpenOCD from Eclipse | run external tools | OpenOCD_x ,
this message shows up:
Solution
Project is not open within
Eclipse, or not highlighted.
Go back to the C/C++
perspective and highlight the
project before running
openOCD_x.
4
Upon starting the OpenOCD from Eclipse | run external tools, this message
shows up:
Error: unable to open ftdi device: device not found
Command handler execution failed
Upon starting the OpenOCD from Eclipse | run external tools, this message
shows up:
Error: JTAG scan chain interrogation failed: all
zeroes
Upon starting a new debugging session, this message pops up:
Verify that the USB cable is
connected between the ARMUSB-OCD dongle and the PC.
A green LED will then light up
on the dongle.
Verify that the JTAG cable
between the dongle and the
target board is connected and
that the target board is powered.
Make sure the JTAG connector
orientation matches the outline
printed on the target circuit
board.
Make sure there is only one
debug session started.
Terminate other debug sessions.
The main OpenOCD documentation is available at http://openocd.berlios.de/doc/html/index.html
If all else fail, re-start with a clean slate:
- Turn off/on the target board power
- unplug and replug the JTAG pod USB cable
- stop / restart the OpenOCD_x external tool
- stop / restart the GDB debugging session.
2. Baseline C Program
The baseline C program includes essential functions used at power up or reset, such as
- turning the power ON
- configuring the FPGA using configuration file stored in Flash memory
- writing new FPGA configuration files into Flash memory from an external PC
- passing user control and monitoring commands via USB to the FPGA or adjacent Comblocks.
In the absence of user activity, the ARM processor is idle after completing its configuration tasks at power-up or
reset.
5
The ARM processor can therefore be used for additional co-processing tasks, to complement the parallel signal
processing tasks implemented in the FPGA.
The best way to develop custom program is to add onto the baseline C program.
3. After programming the ARM processor
After programming the ARM processor flash memory, the board must be given a name. To do so, connect the
board to a PC via the USB. Start the ComBlock Control Center program. Power up the board and detect the
board from the ComBlock Control Center (2nd button from left). It will appear as ‘unknown’.
In the ComBlock Control Center, open the terminal emulator window (rightmost button).
Type the following command, in upper case:
@001SMI1600<enter key> (in the case of the COM-1600).
Wait 5 seconds
Verify that the command was successful by clicking on the detect button again. The module should now appear
as COM-1600 FPGA/ARM Development platform (or similar).
6


