1
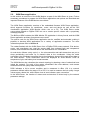
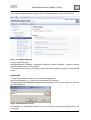
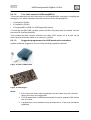
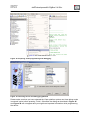
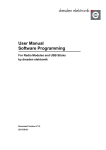
User Manual
Version 1.0
2013-02-28
5.2.
deRFdevelopmentKit ZigBee 2.4 GHz
WSN Demo application
In this section an overview of the WSN Monitor as part of the WSN Demo is given. Further
necessary procedures to prepare the WSN Demo application and options are described and
important features of the WSN Monitor are outlined.
The WSN Demo application consists of the embedded
which supports functions for coordinator, router, and
visualization application WSN Monitor which runs on
communicate based on ZigBee PRO but use a vendor
message payload.
firmware WSN Demo application,
end device as well as the GUI
a PC. The WSN Demo nodes
specific cluster with a proprietary
The BitCloud SDK includes the WSN Monitor PC application in binary format, and the WSN
Demo application as binary format and source code.
The source code for the WSN Demo application can be modified and extended, making it
possible to develop WSN applications for a variety of application scenarios. For more
information please refer to Section 6.
The nodes flashed with the WSN Demo form a ZigBee PRO sensor network. End device,
router, and coordinator can read the sensor data from onboard light and temperature
sensors, and forward the collected data to the WSN Monitor for visualization.
An end device follows a duty cycle (i.e., the microcontroller and radio transceiver are put to
sleep periodically) and wake up to transmit data to the coordinator. Using the serial
connection, the coordinator transmits the received packets, along with its own sensor data to
the WSN Monitor. These transmitted values are displayed on WSN Monitor views as
temperature, light, and battery level measurements.
The WSN Monitor also visualizes the network topology by drawing a tree of nodes that have
joined the network. For each of the nodes, parameters like node address, node sensor
information and link quality data are displayed.
RSSI indicates a link’s current condition and is measured in dBm. LQI is a numeric
parameter defined within the range of 0 to 255; it is used to measure the link quality. Larger
values mean a better link, while values close to zero indicate a poor connection.
In the WSN Demo, the number of routers and end devices is limited only by the network
parameter settings.
www.dresden-elektronik.de
Page 20 of 66