1
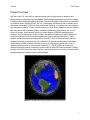
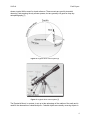
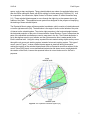
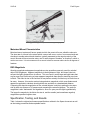
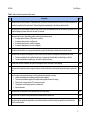
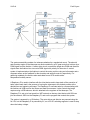
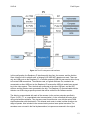
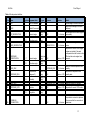
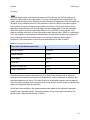
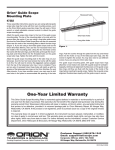
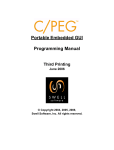
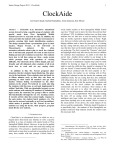
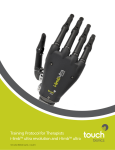
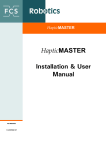
SatTrak
ELEC 420/ CPEG 420
Bucknell University
Lewisburg, PA
Final Report
SatTrak
An automatic RSO observation unit for amateur sky-watchers
EE/CPE Senior Design 2012-2013
Bucknell University
Client
Dr. Kerry Wood
Advisors
Professor Alan Cheville
Professor M. Stu Thompson
Professor Matt Watkins
Team
Michael Alpogianis
Phillip Diefenderfer
Alex Thompson
Brandon Walls
SatTrak
Final Report
Project Overview
SatTrak’s client, Dr. Kerry Wood, organized this project for the purpose of designing and
implementing an inexpensive system capable of automatically gathering long-exposure images
of satellites and other debris orbiting the Earth. These orbiting objects are commonly referred to
as Resident Space Objects (RSOs). The U.S. Department of Defense needs to maintain up-todate orbital information of RSOs to ensure that these RSOs do not interfere with one another or
any launches into space. To carry out this mission, the Joint Space Operations Center (JSpOC)
has been tasked with maintaining Space Situational Awareness (SSA) through the use of a
variety of sensors; these sensors consist of a small network of RADAR transmitters and
receivers, such as those at the Air Force Space Surveillance System, and optical telescopes,
which are utilized at the Air Force Maui Optical and Supercomputing Observatory. These
systems continuously observe the large RSOs currently in orbit as well as all new instances
created from launches and collisions. As of March 2012 the National Aeronautics and Space
Administration (NASA) estimates that there are over 21,000 objects greater than 10 cm in
diameter and many more at much smaller diameters [1]. JSpOC utilizes the information
obtained from their network of sensors to predict orbits of these RSOs and maintains a “space
catalog” of the RSOs and their orbits. Figures 1 and 2 below give a visual aide of just how many
satellites and pieces of debris need to be catalogued.
Figure 1: Low Earth Orbit image showing low orbiting RSOs [2]
1
SatTrak
Final Report
Figure 2: High Earth Orbit image showing low and high orbit RSOs [3]
The current SSA system poses a number of disadvantages. Primarily, the existing sensor
network is not large enough to track the massive amount of RSOs, so the sensors are
overworked and orbital information is updated too infrequently. Furthermore, the current RADAR
systems are not as accurate as expected. By the time the signals reach an RSO and return to
the location where these signals were originally transmitted from on Earth, the RADAR signals
will have dissipated significantly. This weak signal will sometimes lead to inaccurate and
unreliable data for tracking RSOs. In addition to these previous issues, the quantity of RSOs in
orbit increases every day, making it even more difficult to keep track of them all. Additional
launches are not the main cause of the increasing number of RSOs; the true reason is from
collisions between RSOs and the debris from these collisions becoming RSOs themselves.
Thus, all of these new RSOs that were created from the collision must also be tracked.
Furthermore, the trajectory of the original RSOs will also change, making the previous trajectory
information invalid and creating additional problems for JSpOC.
Through crowdsourcing, the manpower that amateur astronomers provide can be incorporated
into the process of data acquisition. These sky-watchers could search for RSOs and log their
sightings, which would ease the load on JSpOC. However, the necessary resources are not
readily available and financially accessible to most amateurs in order into to integrate them into
the system of tracking RSOs. Thus, there exists a need for a low-cost, yet reliable tool with
which amateur stargazers can help to track RSOs. The SatTrak system was designed to meet
these needs. It consists of a mounted optical device capable of focusing on a specified location
in the sky at a specified time and capture an image of the object for a given exposure time. In
order to make the fixture a feasible option for a typical amateur, it can be constructed from
materials that are readily available to consumers rather than from custom parts. This system
was also designed to eventually be standardized so that a large number of amateur
2
SatTrak
Final Report
astronomers around the world could form a network and upload data to a central server for
SSA.
Background
This project combines many different sets of knowledge in addition to electrical engineering,
especially relating to astrophotography, the photographing of objects in space. The knowledge
of optics is necessary for deciding what characteristics are optimal for the collection of data
about RSOs, and the optical components determine the field of view and the apparent
magnitude of the RSO in the image that is captured. The field of view is how much of the sky is
captured in each image, and the apparent magnitude is how bright objects appear. Modern
astrophotography systems are designed with higher precision and accuracy in the mounting
system, as well as higher quality optics systems. Understanding the uses of various mount
types is important for making the SatTrak system function as desired.
Optics
Aperture size of an optical system is the single most important specification, since aperture size
determines the performance of the two most vital aspects of an optical system: light gathering
power and maximum resolving power [4]. An example of the aperture size is shown in Figure 3.
Light gathering power means that objects will appear brighter due to a larger area and thus
more photons being collected, while maximum resolving power has to do with how well the
optics system can reveal fine detail. So generally, bigger is better; however there are always
practical limits depending on the application. For this application, the observation of fine details
of the RSOs is not necessary and thus large maximum resolving power should not be
necessary [5].
Figure 3: Aperture Size [6]
Mounts
There are two prominent mount systems utilized currently, the Equatorial Mount and the
Altitude-Azimuth Mount. The Altitude-Azimuth Mount, or the Alt-Az mount as it is commonly
called, is the simplest type of mount because it consists solely of two angles that make up a 3D
vector. The angle that is parallel to the ground is called the Azimuth (side to side, along the
horizon), and the angle from ground to the sky is the Altitude (or angle of elevation as it is
referred to occasionally). Figure 4 depicts the Altitude-Azimuth coordinate system, and Figure 5
3
SatTrak
Final Report
shows a typical Alt-Az mount for visual reference. These mounts are good for terrestrial
observing, and scanning the sky at lower powers, but are generally not good for deep sky
astrophotography [7].
Figure 4: A typical Alt-Az mount system [8]
Figure 5: A typical Alt-Az mount system [7]
The Equatorial Mount, in contrast, is set up to take advantage of the rotation of the earth and is
used for the observation of celestial objects. Celestial objects are naturally occurring objects in
4
SatTrak
Final Report
space, such as stars and planets. These celestial objects are orders of magnitude farther away
than the RSOs orbiting the Earth, with RSOs orbiting no further away than 2,000 km [10]. Just
for comparison, the closest star, Alpha Centauri’s Proxima is about 41 trillion kilometers away
[11]. These celestial objects appear to move through the night sky as time passes due to the
rotation of the Earth. The equatorial mount system was designed for the purpose of simplifying
the tracking of these celestial objects.
The Equatorial Mount system utilizes equatorial coordinates, which consists of a declination and
a circular right ascension (RA). The declination is the angle of incline or the latitude of the point
of interest on the celestial sphere. The circular right ascension is the horizontal angle between
the horizontal projection of the point of interest and the Vernal Equinox. Figure 6 shows how the
parts of the equatorial coordinates are used to map stars in the sky. The inclined declination is
set to the degrees equal to your latitude, and the right ascension axis is made parallel to the
Earth’s rotational axis. Using this setup, equatorial mounts make tracking objects as they move
through the sky a one-axis tracking system instead of a two-axis tracking system. This type of
mount, seen in Figure 7, makes celestial objects appear to stand still during observation,
making the tracking of the celestial objects easier with an Equatorial mount than with an Alt-Az
mount. Since RSOs travel in non-standardized trajectories and almost never coordinated with
the rotation of the Earth, it seems the equatorial mount is not an ideal mount for SatTrak’s
purposes.
Figure 6: The equatorial coordinate system [12]
5
SatTrak
Final Report
Figure 7: A typical equatorial mount system [13]
Motorized Mount Characteristics
Motorized mount systems all have a speed at which the mount will move called the slew rate.
The slew rate of a mount is the rate at which a mount will move, or slew, from one azimuth and
elevation to another azimuth and elevation, typically measured as the angular velocity of the
mount. Mounts will have two slew rates, one for each degree of freedom, or direction in which a
motion can occur. It is not uncommon for a mount to have a common slew rate for all degrees of
freedom.
RSO Magnitude
Absolute magnitude and apparent magnitude are two quantities commonly used for celestial
object RSO brightness. Apparent magnitude is the brightness of light, but doesn’t take into
account the light’s distance from its source. This can result in some large and bright stars that
are far away from Earth having a lesser apparent magnitude than dimmer stars that are closer
to Earth. This effect is due to the fact that so few photons actually find their way to Earth from so
far away. However, this can be resolved using absolute magnitude, which uses distance and
apparent magnitude to calculate how bright the star would be at a standardized distance.
Comparing the absolute magnitudes of two celestial objects is similar to putting the two stars
side by side at a distance of 10 parsecs and comparing the actual brightness. The scale for
magnitude is also “backwards” and logarithmic, since our eyes perceive light logarithmically.
The larger the magnitude, the fainter the star is, and the smaller (and sometimes negative)
magnitudes represent brighter stars.
Specification, Testing, and Results
Table 1 shows the original performance specifications outlined in the Specs document as well
as the testing procedures and acceptable results.
6
SatTrak
Final Report
Table 1: Specification table with test details and results
No. Requirement
1
2
3
4
5
6
7
8
Radius of the boundary
for the point of interest
Radius for the
boundary for streaks
Maximum
Calibration/Setup time
Maximum Task Time
Maximum Slew Time
Minimum Settling
Time
Capture Time Accuracy
Exposure Time
Accuracy
Specified Performance
Level
0.25*h (See Specs Doc.)
0.49*h (See Specs Doc)
10 minutes
10 minutes
5 minutes
30 seconds
1 second
1 millisecond
Evaluation Test
Check test images and measure the distance between the
center of the image and the start of the point of interest.
Check test images and measure the distance between the
center of the image and the start of the point of interest.
Measure the time it takes to set up the system.
N/A
Measure the time it takes to slew 180° (farthest it will slew)
Measure the time between when the mount stops moving
and the picture is captured.
Record the time from the GPS when the image is captured.
Use the system to capture a digital clock with milliseconds
precision and calculate the difference between the time
shown in the first and last frames.
Capture images of RSOs with a magnitude of
approximately zero.
9
Maximum capturable
RSO apparent
magnitude
0
10
$600
Check the budget.
11
Maximum Cost
(assuming user already
has sky-watching
equipment)
Maximum Power Draw
36 Whr
12
13
Operating Voltage
Minimum Battery Life
12 V
3 hr
14
Maximum System
Weight
40 lb
Measure maximum current draw and multiply by input
voltage.
Measure the input voltage using a voltmeter.
Run the system for a 3-hour period with tasks executed at a
typical frequency that would be expected for normal use.
Weigh the system.
Measured
Performance Level
Not yet tested
Met?
Not yet tested
Yes
< 5 minutes
Yes
N/A
1 min
N/A
N/A
Yes
N/A
< l second
> 1 millisecond
Yes
No
Successfully captures
stars with apparent
magnitude greater than
0.
Yes
Yes
Yes
5.76 Whr
Yes
12 V
>3.25 hr
Yes
Yes
29
Yes
7
SatTrak
Final Report
Table 2: Table of functional requirements with results
No.
Description
Met?
1
The system shall be able to operate in a standalone mode, in which it will receive task orders in the form of a user-provided text file,
formatted as specified by the user’s manual. Tasks will be performed sequentially in the order they listed in the file.
No
2
The system shall be able to operate in external control mode, in which an independent device will send tasks to the system, and the
system will attempt to process each task in the order it is received.
Yes
3
The system shall receive / ingest tasking orders consisting of the following inputs:
• An image capture start time (UTC precise to a second)
• An exposure time (precise to a millisecond)
• An azimuth angle (precise to a tenth of a degree)
• An elevation angle (precise to a tenth of a degree)
Yes
4
The system shall also listen for a user-generated terminate job input that will stop the indicated job and output error data.
No
5
The system shall be capable of accepting a list of task orders, where all tasks will be completed at the specified time unless:
• The task is scheduled to occur within the time frame of a previously scheduled task (one that is higher in the list).
• The task is impossible to complete (e.g. the azimuth is below the horizon).
Yes
6
If a task order cannot be completed, the system shall disregard this task and output an error message.
Yes
7
The system shall capture and store an image of whatever is within the field of view of the optical element at the given capture start
time.
Yes
8
Once the system has captured the image, it shall compile and store meta-data, including:
• Latitude and Longitude of the system (precise to a tenth of degree)
• The azimuth and elevation angles of the optical element (precise to a tenth of degree)
• The start time of image capture (UTC precise to a second)
• The exposure time of capture (precise to a millisecond)
• Optical information
Yes
9
The system shall be comprised of widely available parts (not custom-made).
Yes
10
The system shall be capable of being assembled and disassembled with simple tools.
Yes
11
The system shall be capable of transportation via a standard automobile and shall be easily transported from the vehicle to the
location of data collection.
Yes
8
SatTrak
Final Report
Adjustments
The only requirement from the original specification document that could not be met is
Requirement 8. The value of this metric is no longer valid for a number of reasons. The field of
view has increased significantly, meaning that exposure times will have to be longer to get the
same streak length, and thus millisecond accuracy has become unnecessary. In addition, the
method of image capture has changed from capturing a long-exposure photograph with a
camera to capturing video with a webcam, so the precision is limited by the low frame rate of the
webcam. Our client is aware of and has approved this change.
The two requirements from the original specification document that are not relevant are
Requirements 4 and 6. For Requirement 4, the task time depends on the user-selected capture
duration time. The capture duration time should be calculated based on system parameters so
that a resulting streak will meet Requirements 1 and 2, but there should not be a fixed maximum
value because this could limit the ability to meet said requirements. For requirement 6, the
definition of settling time used was incorrect and this poor wording choice makes this
requirement unusable.
Two functional requirements were not met. The first is Functional Requirement 1. In an effort to
get the important functionality of the project working correctly, this extra feature for submitting
tasks via a text file was left for future iterations. For similar reasons, the option to terminate
individual tasks, Functional Requirement 4, has also not been implemented yet because it was
not an essential function of the project and time needed to be spent on other features. Both of
these features could be easily implemented in future iterations to improve the ease of use for
the system.
In Retrospect
A number of changes could be made to make the specification document to make it better
embody the requirements of the project. As indicated in the previous section, Requirement 4
should be removed entirely because it is irrelevant. Requirement 8 should be modified from 1
millisecond accuracy to 1 second accuracy to better reflect the actual requirement for usable
data as well as the practical capabilities of the system.
Design Evolution
System Architecture
The overall system diagram can be seen in Figure 8.
9
SatTrak
Final Report
Figure 8: System diagram
The system essentially consists of a telescope attached to a mechanical mount. The azimuth
and elevation angles of the telescope are each controlled by a DC gear motor that is driven by a
PWM signal from the Arduino. A motor driver circuit converts the single-wire PWM and direction
signals from the Arduino into a two-wire PWM signal with polarity for the motor. A control
system is implemented on the Arduino to control the motor position using an inclinometer and a
compass sensor as the feedback for the elevation and azimuth controls, respectively. For
gathering metadata, the Arduino also reads data from a GPS module and a
temperature/humidity sensor.
A Raspberry Pi is used to interface with the client device and to keep track of the execution of
tasks, where each task is the process of moving the telescope to the desired position at the
desired time and capturing an image. The Raspberry Pi executes tasks by communicating with
the Arduino via USB to move the motors and read from sensors. It also controls the image
capture using a USB webcam, which is attached to the eyepiece of the telescope. The
Raspberry Pi is set up to host an ad-hoc WiFi network so that any client device with SSH can
join the network, SSH into the Raspberry Pi, and run the program that controls the system.
The system is powered by a 12V battery. The motor driver and Arduino are powered using the
full 12V, but the Raspberry Pi is powered by 5V, so a DC-DC switching regulator is used to step
down the battery voltage.
10
SatTrak
Final Report
Processing Unit
Hardware
One of the first design decisions for the system was the internal processing unit (IPU).
Decisions on almost all of the other components, including the motors, sensors, and user
interface depended on this decision. For example, a client device that communicates over a
serial interface could only have been considered if the IPU contained a USB port, and a client
that communicates wirelessly could only be considered in the IPU had a WiFi card, Bluetooth
receiver, etc. A block diagram of the components that communicate with the IPU is shown in
Figure 9.
Figure 9: Block diagram of IPU communication
The first step in the decision was to determine the requirements and constraints for the IPU.
For example, the IPU must be capable of:
1
2
3
4
Controlling motors (stepper, DC, etc.)
Reading in analog data from various sensors (camera, GPS, temperature, etc)
Capturing images from a camera
Communicating with the client device
In addition, the processing unit needed to be inexpensive and accessible to any consumer. This
means that custom-built boards with specially chosen microcontrollers were not an option.
To meet these stipulations, the team chose to use a combination of a Raspberry Pi and an
Arduino Uno. A Raspberry Pi is a single-board computer with an ARM processor capable of
running various Linux distributions. This was used as the primary processing unit which
interfaces with the client device and schedules and executes tasks. An Arduino Uno is a singleboard microcontroller that uses an ATmega328p. In this system, it acts as an I/O controller by
reading from the sensor array and controlling the motors. The Raspberry Pi communicates with
the Arduino over USB in order to control I/O functions during task execution. The IPU
subsystem is shown in Figure 10 below.
11
SatTrak
Final Report
Figure 10: The IPU subsystem and interfaces
In this configuration, the Raspberry Pi interfaces with the client, the camera, and the Arduino.
Since it has no built-in wireless card, a Netgear N150 USB WiFi adapter was used. There are
only two USB ports on the Raspberry Pi, so a Belkin powered USB hub was used to allow for up
to five total USB connections. The webcam used, a Logitech Webcam Pro, needed to be
connected to a direct USB port on the Raspberry Pi because the USB hub would have caused
lag in the video capture. Thus, the hub was connected to the other USB port, and the WiFi
receiver and the Arduino were connected to the hub. The Raspberry Pi communicated with the
Arduino over USB using a specific protocol that will be outlined in the Software section.
The Arduino communicated with each of the sensors via the various protocols specified in
Figure 10 (SPI, I2C, or a specialized serial communication). It also controlled the motor driver
using pulse width modulation. Two pins were used for each motor: one with the actual PWM
signal and another with the direction. This allowed each motor to rotate in either direction at a
range of speeds. Also included in the communication protocol were optical encoders. The
encoders were not used in the final implementation, but space was reserved in the original
12
SatTrak
Final Report
design in case they were needed. More on decision to exclude the encoders can be found in the
Control System section. The pin configuration for the Arduino can be seen in Figure 11.
Figure 11: The Arduino red shield pin-out used for each peripheral device, including encoders which
could potentially be used in a future iteration
At first, the combination of two microprocessors may seem unnecessary, but there are a
multitude of reasons why the team chose to use both of these boards, all of which stem from the
inability of either board to handle all of the required functionality on its own.
1
The system is intended to function as a node in a networked system, so a single client
must be easily able to access any node and cannot just have a one-to-one connection
with a single node. The Arduino alone is not capable of network connectivity. Ethernet
and Wifi shields are available that would allow Ethernet communication, but these
shields are more expensive than a Raspberry Pi. Since the goal of the project is to make
an inexpensive system, the Raspberry Pi is a more economical choice. In addition, as
the next reason will expand upon, almost all of the Arduino pins were used by other
peripherals, so it would not have been possible to interface with an additional shield.
2
The processing unit needs to interact with a large number of peripheral devices,
including 4 sensors and a motor driver, most of which require multiple pins for
communication. The Raspberry Pi has GPIO pins, but these pins are limited and
notoriously difficult to interface with. Since the true goal of the project was not to design
a polished final product but to produce a working prototype, it made more sense in terms
of our budget and time constraints to use the Arduino, which already has libraries for
interfacing with many of the chosen sensors.
13
SatTrak
3
Final Report
The IPU needed to control the capture and storage of images. Since we opted to use a
USB webcam, the unit needed a USB port, so again the Arduino alone was not
sufficient. Again USB host shields are available, but the lack of pins and cost makes the
Raspberry Pi a better option. The Raspberry Pi runs Linux, so there are drivers for most
webcams. In addition, the Raspberry Pi supports SD cards, so it is capable of storing a
large number of images.
Software
The IPU software consists of three major components:
1 A Controller program- This is written in Java and is run on the Raspberry Pi. It has a
simple console interface that allows a user to submit tasks and perform other diagnostic
functions. It keeps track of all tasks submitted using a delay queue. Each task in the
delay queue is associated with a delay to wait before dequeuing the task. A thread runs
in the background that constantly waits for a delay in the queue to expire and then
executes that task by telling the I/O Controller (see below for communication details) to
set the position of the motors, capturing an image from the webcam (see Imaging for
details), reading metadata from the I/O controller, and saving all of the results to its SD
card.
2
An I/O Controller program- This is an Arduino sketch written in processing that is
programmed onto the Arduino. It runs a super-loop executive that waits for serial
communication from the Controller and performs the functions indicated. Examples of
possible functions are setting the positions of the motors and reading from the sensors
(see Control System for details on the control system for positioning).
3
A serial communication protocol- This is not a program but simply a definition of the
packet structure that is used for communication between the Controller and the I/O
Controller. The packet structure can be seen in Table 3 below.
Table 3: Serial packet structure
Byte(s)
0
1
2:n
Data
Header (0xAA)
Command
Arguments
Each serial packet sent by either device must begin with a 1-byte header. This header must
always be 0xAA. Since both devices use a buffer to read serial data, having a header allows
them to verify that they are actually reading the packet from the beginning and not extra
nonsense data that was left in the buffer. After the header, the next byte is the command. The
protocol defines the meaning for each command value. Examples of commands are “Set
Orientation” and “Read GPS.” Each command can have a number of arguments of various
lengths that follow in the packet. For example, the “Set Orientation” command has two
arguments: azimuth angle and elevation angle. Each of these is a floating point number
represented by an 8-byte ASCII string. The protocol definition can be seen in Table 4 below.
14
SatTrak
Final Report
Table 4: Serial protocol definition
Value
Name
Arg bytes Argument data
Arg type
Response
Direction
Details
0x01
ACK
0
Ack'd Command
byte
-
-
Acknowledge a received command
0x02
NACK
0
Nack'd Command byte
-
-
Negative acknowledge a received
command
0x03
SET_ORIENTATION
0-7
Azimuth angle
RPi -> Arduino
Set the angles of the motors (angles
are doubles)
8-15
Elevation angle
-
-
RPi -> Arduino
Read the current angles of the
motors
Arduino -> RPi
Respond with current motor angles
(angles are doubles). Also sent
unrequested from the Arduino to the
RPi when the motor angles have
been set.
RPi -> Arduino
Read the current temperature and
humidity
Arduino -> RPi
Respond with temperature and
humidity data
RPi -> Arduino
Read the current GPS location
Arduino -> RPi
Respond with current GPS location
RPi -> Arduino
Send to the Arduino until a proper
Ack packet is received in response.
This ensures that the connection is
established.
0x04
0x05
0x06
0x07
READ_ORIENTATION
RESPONSE
_ORIENTATION
READ_ENV
RESPONSE_ENV
Azimuth angle
8-15
Elevation angle
-
-
0-7
Temperature
(degrees C)
double (as
ACK
string)
8-15
Humidity
double (as
string)
READ_GPS
-
-
0x09
RESPONSE_GPS
0-7
Latitude
8-15
Longitude
ESTABLISH
_CONNECTION
double (as
ACK
string)
double (as
string)
0-7
0x08
0x0A
double (as
ACK
string)
double (as
string)
RESPONSE
_ORIENTATION
-
-
RESPONSE_ENV
RESPONSE_GPS
double (as
ACK
string)
double (as
string)
-
ACK
15
SatTrak
Final Report
Sensors
Azimuth
The Azimuth sensor is an essential component of the SatTrak system, since the system utilizes
an Azimuth-Elevation mount. Azimuth is the angle between the north vector and the horizon
plane projection of the RSO’s vector. The main method of measuring this angle is by utilizing a
compass sensor, since it readily measures angles from magnetic north to its horizontal pointing
vector.
Researching compass sensors revealed that there is not a large variety of options. Aside from
accuracy and precision, the two largest factors in choosing the sensor were reasonable price
and amateur usability due to the DIY nature of the project. One of the least expensive options
that also had a large amateur user base was the Honeywell HMC6352. This compass sensor
was lower-priced and of reasonable accuracy and precision, so it was monetarily viable. Also,
due to the extensive online documentation and libraries it was very easy to interface this sensor
to the Arduino, making the sensor Amateur User viable. The HMC6352 uses I2C to
communicate with microcontrollers, which the Arduino implements on pins A4 and A5. Using the
compass sensor was simple since it came with an example sketch for the Arduino which was
modified for the needs of the project. An example wiring diagram for connecting the compass
sensor to the Arduino is shown in Figure 12.
Figure 12: Compass Sensor Wiring Example [14]
Once the sensor was received, it was tested utilizing a basic Arduino sketch to verify
functionality, but the lab in which it was initially tested proved to be full of magnetic interference.
Once tested outside, or in a relatively interference-free area, we found it to be accurate and
precise enough, though with a larger budget, it would be easy to improve these characteristics.
16
SatTrak
Final Report
Elevation
The elevation sensor is also an essential component of the SatTrak system. Elevation is the
angle from the horizontal plane to the RSO’s vector. Many different types of sensors were
researched, but the most accurate and precise type of sensor was the inclinometer.
Unfortunately, there were few inclinometers that were reasonably priced. Many available
inclinometers had high accuracy and precision and thus were much more expensive. Further,
many inclinometers found were designed for instrumentation applications meaning that the
interface consisted of proprietary connectors, protocols, and pin-outs. The most cost-effective
inclinometer that could be interfaced with the Arduino was the MuRata 81-SCA61T-FA1H1G-1.
Additionally, the first inclinometer stopped working after an event with ESD resulting in total
failure. The pin out of the inclinometer used is shown in Figure 13.
Figure 13: MuRata 81-SCA61T-FA1H1G-1 Inclinometer Pin-out [15]
The inclinometer’s accuracy steadily decreased with higher altitude angles starting at about 45
degrees above horizon. Since the system could not accurately slew to very high angles, the
system was limited to gathering data from lower altitude angles. Since RSOs generally do not
appear only at high altitude angles, it was trivial to simply capture the RSO while it was still at
lower altitude angles. Again, this sensor was accurate and precise enough for the SatTrak
prototype system, though with a larger budget these characteristics could be improved as well.
Environmental Sensor
The temperature and humidity sensors are supplemental features of the SatTrak project that
were requested by the client. Their purpose is to provide information about weather conditions.
This could be useful in analyzing the streak image because the line of sight of the optical device
can be distorted or blurred depending on the humidity and temperature outside. Furthermore,
equipment may get damaged if it is too hot or humid outside. Overall, the sensors help to
provide extra data that may be taken into account in the case of an unclear image. Therefore, it
is important to have the temperature and humidity sensors to ensure the system is safe and
accurate.
While researching sensor options, a number of dual temperature/humidity sensors were
discovered. Combining the features into one sensor not only saves money, but also saves
17
SatTrak
Final Report
space and time when configuring the device. Three different sensors were found and are
compared in Table 5.
Table 5: Comparison of temperature/humidity sensor options
Sensor
Temp
Accuracy
(°C)
Humidity
Accuracy
(%)
Temp
Operating
Range
(°C)
Humidity
operating
Range
(%)
Power
Draw
(mW)
Price ($)
Compatibility
with IPU
SHT21
+/- 0.3
+/- 1.5
-40-125
0-100
.08
39.93
Yes
DHT22
+/- 0.5
+/- 2-5
-40-80
0-100
30
12.50
Yes
DHT11
+/- 2
+/- 5
0-60
20-90
30
8.99
Yes
The DHT22 sensor was chosen because it is cost-effective and accurate enough for use in this
system.
Once the part was ordered and received, the process of connecting it to the IPU started. An
online tutorial was found on how configure the DHT22 with an Arduino. Figure 14 below depicts
the wiring scheme.
Figure 14: Wiring diagram for the DHT22 and Arduino [16]
18
SatTrak
Final Report
To complete the configuration of the DHT22 with the Arduino, an online library was found [17].
By writing a simple Arduino sketch using this library, data could be collected from the sensor.
Testing produced readings comparable to average room conditions (22°C, 40% humidity), so
the sensor was accurate enough for this application.
GPS
The GPS is important for identifying the geographic location of the SatTrak system. This
information can be used to triangulate the exact position of the RSO in the sky by using the
location of a known object in space. There are no particular specs directly related to this
component; thus, to save money and time, a GPS was found in the Breakiron Robotics Lab that
was used for a previous project. It is small, has minimal power draw, and is configurable to the
IPU. It also has an accuracy of 5 m [18], which meets the functional requirements for the
system. These characteristics are adequate enough to meet the specifications, so this part was
used in the final design.
The GPS model that was used is a PMB-648. A specs sheet for it was found online [19]. A
web page containing the Arduino libraries for the GPS in addition to a pin connection diagram
was also found as seen in Figure 15. After it was connected to the Arduino and the libraries
were run, it collected accurate data on its location. It was accurate to within 15ft of its locations.
One unfortunate problem with the GPS, however, was that it did not work inside. Therefore, all
the testing for this device was done outdoors. In the end though, our system is meant to
operate outside so this obstacle did not affect the final product.
Figure 15: The wiring diagram for the GPS and Arduino [19]
19
SatTrak
Final Report
Imaging
Optics
While the optics system could have been based on other devices, the SatTrak system was
based on a telescope for two main reasons. First, the telescope that was incorporated in the
system was borrowed from the Bucknell University Astronomy Department, which simulated the
utilization of any available resources. This was done in spirit of creating a successful system
from whatever resources an amateur sky-watcher would have. The second reason is that a
telescope’s characteristics such as focal length and thus angular field of view are adjustable.
While other options could have potentially worked, such as a DSLR or a monocular, a skywatcher would be more likely to have a telescope at their disposal than a DSLR or a monocular.
Thus, the variability of the telescope’s characteristics and the likelihood that a sky-watcher will
have a telescope were the two main reasons for choosing a telescope as the optical
component. The specifications for the borrowed telescope can be seen in Table 6.
Table 6: Telescope specifications
Orion Short Tube Refractor Specs. [20]
Best for imaging
Terrestrial
Optical diameter
80 mm
Focal length
400 mm
Focal ratio
f/5.0
Length of optical tube
15.0 in.
Weight, optical tube
3.8 lbs.
Originally the optics system comprised of an Orion Short Tube Refractor and an eyepiece
camera (also borrowed from the Astronomy Department), which is effectively an eyepiece and
camera bundled into one device. This was found to be an impractical solution since eyepieces
within the project’s budget were not supported on Linux devices, and the eyepiece cameras that
were Linux-supported were too expensive.
Shortly after discovering this, the eyepiece camera was traded for the telescope’s standard
eyepiece and a separate camera. The eyepiece was a 26 mm plossl, which resulted in the
optical system characteristics as seen in Table 7.
20
SatTrak
Final Report
Table 7: Eyepiece and Telescope Characteristics for the first eyepiece
Focal Length
26 mm
Resulting magnification:
15
Power per inch of aperture:
5
Exit pupil (mm):
5.33
True Field of View (degrees):
3.667
Since it was calculated that the International Space Station would have a top angular speed of
about 1.1 degrees at its perigee (closest point to Earth), this eyepiece would allow for an
exposure length of about 3 seconds. If one picture takes too long, the system would be
incapable of accomplishing many tasks in one night. Conversely if the exposure time is too short
the pictures may be unusable. This optics system was the ideal candidate for a while, until there
was some uncertainty about the accuracy that the mechanical mount system could provide, at
which point there was a unanimous decision to increase the angular field of view, just to be
safe.
The next eyepiece that was chosen was a 40 mm that provided a larger field of view. It was
chosen because it was inexpensive and allowed for one of the highest field of views. The
characteristics of the new and final optics system can be seen below in Table 8.
Table 8: Eyepiece and Telescope Characteristics for the final eyepiece
Focal Length
40 mm
Resulting magnification:
10
Power per inch of aperture:
3
Exit pupil (mm):
8
True Field of View (degrees):
4.3
Camera
The camera was originally going to be an eyepiece camera, as many astrophotography
applications utilize, though it was discovered that this was not a viable option. As stated above,
the less expensive models did not have driver support for Linux, and the more expensive ones
that did have Linux driver support were too expensive for our budget. From here, a few other
solutions were explored.
21
SatTrak
Final Report
One alternative option was to use a cell phone camera. While many phone cameras can be
found for cheap or even free, there are many issues to using one. The biggest issue is
integration, and more specifically communicating with and controlling the camera from a remote
source outside the phone. This setup would likely result in needing to program an android
application to control the camera and transport the pictures back to the main processing unit of
the SatTrak system. Not to mention the fact that phone cameras lack much of the necessary
capabilities for this system (such as controlling exposure time). They also have comparable
image quality to web cameras.
Another option was to use a point-and-shoot digital camera, which looked like a much better
option since they generally have more capabilities and more control, though there is the similar
problem of how the camera will be remotely controlled. Further, even if remotely controlling the
camera was possible, there would still be the problem of having the camera communicate with
the main processing unit to give it the image and metadata. Towards the end of the semester,
the Canon Hack Development Kit [21] was discovered and warrants more investigation for
future work, as it could make it possible to use a point and shoot camera. With the limited time
remaining, it was deemed not worth attempting to pursue this complicated option.
The third and most straightforward alternative was utilizing a web camera. Web cameras are
USB powered and controlled, so using one would make its control fairly trivial. This method, like
the others, is not without its issues. Web cameras are designed with 30 frames per second
video capability, and no exposure time adjustments. They are also not ideal for capturing lowlight images. The web camera that was utilized was also not a high quality one, so the image
quality was not great, but it worked for our prototype system. The lack of exposure time
adjustment was effectively solved through capturing video for the duration of the exposure time,
and then using digital processing to stack the frames together into one picture with the prior
exposure length. This method turned out well, but was not ideal. With more money it would have
been easy to purchase a real astrophotography eyepiece camera with Linux driver support,
averting most of our problems.
Software and Processing
Since the camera being used is a webcam, rather than a CCD or point-and-shoot, it is
impossible to actually control the exposure time, which is an essential function of the system.
However, capturing long-exposure images of RSO streaks was simulated through the following
process:
1
2
Capture a video- The Controller program uses the ffmpeg library to capture a video
from the webcam. It begins video capture a set time before the intended capture time
and continues recording for a set time longer than the intended duration. This
guarantees that all of the desired information is captured.
Extract each frame from the video as a PNG image- The Controller parses through
the log that was created by the video capture to get the time at which video capture
22
SatTrak
3
Final Report
actually began (it is not the same as the time the command was executed because there
is a variable delay). It then saves the difference between this time and the time that the
user intended to begin capture as the seek position. Then the Controller again uses the
ffmpeg library to transcode the video into PNG frames, starting at the seek position and
continuing for the duration specified by the user. Essentially, this step both extracts the
frames and trims the extra unnecessary information.
Flatten the frames into a single streak- The Controller uses the imagemagick library to
basically pass each frame through a high-pass filter, in which any pixels above a certain
threshold of brightness become completely white, and any pixels below the threshold
become black. This enhances the visibility of the RSO. Next all of the frames are
combined into a single image using a simple averaging function. Since the averaging
process makes the streak look dimmer, this averaged image is again passed through the
high pass filter to make the streak visible.
Motors and Drivers
The original plan for the motors in the fall semester used stepper motors as the actuators. Over
the winter break and at the beginning of the spring semester, the decision was made to switch
from stepper motors to DC gear-motors. Stepper motors were originally chosen because they
allow for simple position control. The rotational distance that a stepper moved could be
calculated by multiplying the number of steps the motor moved by the degrees per step. This
would have allowed the system to be easily controlled by stepping the motor the number of
steps needed to move from one position to another.
The downsides with stepper motors are the vibrations, power draw, and gearing. When a
stepper steps, it is moved in a pulse which will cause vibrations, possibly causing the entire
system to shake itself apart. These vibrations were unacceptable for the sensors and the optics
to have to deal with and would have caused more issues later on if the implementation had
included steppers.
The next issue with the stepper motors was the power draw. In order for a stepper motor to hold
position, a voltage has to be maintained across the coils. Upon testing of some stepper motors,
it was found that some steppers required as much as one ampere to hold position at twelve
volts. This is the reason such a large maximum power draw was specified in the specifications
document. The steppers would have to hold position at all times that the steppers were not
moving to hold the mount in place for the optics and camera to work.
The final issue with stepper motors was the stepping accuracy of the steppers and the inability
to gear the motors down. Many cost effective steppers only have 200 to 400 steps per
revolution. Although the 400 steps per revolution steppers would allow us to have an accuracy
of less than a degree, it would still only be able to move discrete amounts rather than over a
continuous range. This could have been remedied by gearing the motors down, but a costeffective gearbox that would have been compatible with the steppers could not be found. At this
23
SatTrak
Final Report
point given the issues with using stepper motors, the decision was made to switch from stepper
motors to DC gear motors.
There were very few DC gear motors available that met the requirements for having high torque
and being non-backdrivable. Many geared motors were found that would have the necessary
torque, but none that satisfied the non-backdrivable specification that would allow us to hold the
mount in position while capturing an RSO without implementing a braking scheme. The use of
electric braking is unreliable at best and would most likely not hold the mount in a fixed position.
At this point is was found that windshield wiper motors would be suitable and are relatively
inexpensive when obtained from a junkyard or from an online surplus store. Windshield wiper
motors are mostly non-backdrivable, have enough torque to move windshield wipers, and
operate at 12 volts. The phrase “mostly non-backdrivable” is used because the worm gears can
in fact be back-driven, but it takes an arbitrarily large amount of torque to backdrive the motors,
which is the best such a system can do with implementing a separate braking system. At this
point a windshield wiper motor was obtained and tested. The motor was found to have about the
same current draw as a stepper motor and it would not need to be powered constantly to hold
the motor in place. At this point the design was changed to use largely available windshield
wiper motors.
The motor driver circuit was designed around an L298N, a high power motor driver IC. The
L298N was selected because of its high power capacity that was needed to power the motors
selected for the mount. The L298N is a quadruple-half H-bridge motor driver IC, which can be
wired to control 4 motors running in a single direction, 2 bi-directional motors, or 1 bi-directional
motor using both bi-directional drivers to drive higher-power demanding loads. The design used
two L298Ns both wired up to drive higher-power motors. The schematic for one L298N and its
motor can be seen below in Figure 16. The L298N took two inputs; the direction to spin the
motor and the PWM signal to control the motor speed. The L298N output is an amplified PWM
signal at the polarity indicated by the direction input. In retrospect, the circuit should have
included flyback diodes to discharge any back-EMF in the motor drivers from switching the
motors at a high frequency.
24
SatTrak
Final Report
Figure 16: The L298N motor driver schematic for the bi-directional high power configuration used to
control the mount’s motors.
Mechanical System
The mechanical system of the mount had not changed much from the mechanical system
designed in the fall semester. The decision was made to implement the U-mount system from
the fall and can be seen below in Figure 17. The U-mount was chosen because it would be the
simplest option to implement. Starting from the base, there were two plates, a bottom plate (part
A) attached to the top of the tripod, and a top plate (part B). Both plates were connected via a
turntable bearing (part C). In the center of the turntable bearing, an aluminum shaft (part D)
was cut on the lathe that is used to hold the large pulley (part E) of the azimuth drive train. The
large pulley is connected to the small pulley (part F) on the azimuth motor (part G) via a timing
belt. For the elevation drive train, the elevation motor (part H) is connected to a small pulley
(part I) that is connected to the large pulley (part J) on the telescope’s drive shaft (part K) via
25
SatTrak
Final Report
another timing belt. These parts are held up by two u-beams (part L) that allow the telescope to
rotate a full 360 degrees.
Figure 17: Solidworks render of the motorized mount with the parts of the drive train labeled
26
SatTrak
Final Report
The mount was built using common materials that could be obtained from either McMaster-Carr
or from a local hardware store. The motors that were used were found in the Bucknell electrical
engineering shop but could easily have been sourced from either an online surplus store or from
a junkyard. The plates and some of the support structures were cut from either acrylic or ABS,
both of which were cut using the laser cutter in the Bucknell Project Development Lab (PDL)
and could be replicated by a hobbyist with a drill and a ruler. The only other custom-machined
part was the aluminum shaft in the center of the azimuth drive train, which was cut on the lathe
in the PDL. Once the mount had been constructed, an exoskeleton was made from acrylic to
hold the telescope and to attach to the mount. On the top of the exoskeleton, the GPS,
compass, and inclinometers were mounted. Finally an acrylic support was built to attach the
camera to the eyepiece of the telescope. Some in-progress pictures of the mount being
constructed can be seen in Figures 18a and 18b.
Figure 18a: in-progress mount
27
SatTrak
Final Report
Figure 18b: Image of the in-progress mount during the testing phase
Upon construction of the mount, it was found that it had a significant amount of backlash and
was not as stable as was originally intended. Both the Azimuth and the Elevation drivetrains
allowed the telescope to move despite the non-backdrivable gearboxes. Slack in the system
was introduced through the belts and backlash in the drivetrain itself. The u-beams used for the
uprights also flexed allowing even more oscillations and instability to be introduced to the
mechanical system. Finally the turntable bearing allowed the top plate to tilt relative to the
bottom plate causing issues with the mount binding on itself and causing fine motion controls to
be difficult to implement. The entire mount was not nearly as solid as was intended in the design
which caused control and stability issues later on during the control system implementation and
testing phase.
28
SatTrak
Final Report
Control System
The control system needed to be implemented to use the data from the sensors to accurately
move the mount to the directed position. Since the compass sensor was not tilt-compensated,
so it could not operate at any orientation, the mount had to be leveled before making any
azimuth movements. Because of this, the control system had to first level the mount, orient the
mount to the proper azimuth, or compass heading, and then tilt the mount to the proper angle of
elevation. All of the motion controls of the mount were implemented using a proportional control
system where the feedback into the system was the sensor readings. The decision was made
not to utilize encoders due to the increased complexity, cost, and machining time that would be
needed to add the encoders to the mount. Had encoders been added, the microcontroller
would need to monitor the encoders, which could have increased the accuracy. After preliminary
testing with the mount and its sensors, it was found that the sensors alone were adequate to
serve as the feedback mechanisms to the control system.
The original control system of the mount was implemented using a proportional control system.
It calculated an error value by taking the difference between the desired final location and the
current location read from the sensor. The speed at which the motors were told to spin was
varied depending on this error value. Essentially, the motors would slow down as the telescope
closed in on its target position. This was originally implemented as the only control system used
on the mount, but it was found that a fine control system was necessary to get the accuracies
required by the field of view of the optical system.
The final control system was implemented by pulsing the motors where the motors would be
given the full power available for a very short time, ~5 ms, and then the power would be cut off
for a longer period of time, ~250 ms. An issue that arose during testing was the introduction of
harmonics through the pulsing implementation. During the first attempts to pulse the motors, the
pulse period was approximately the period of oscillation of the telescope if the telescope was
given an impulse, i.e. tapping it on the side. This caused issues where the mount would oscillate
enough to cause the belt to skip teeth on the pulley rather than move as expected. After the
matching periods were discovered, the period of the pulsing was changed to a different number
to prevent harmonic oscillations from being an issue. The period of time where no power was
applied to the motor for the pulsing was changed to ~50 ms rather than the previous 250 ms.
This pulsing proved to move the mount a very small amount at a time, around a quarter of a
degree per pulse. The control system was then modified to utilize this pulsing scheme to act as
a fine control system. The mount would use the PWM controls as a coarse control system to get
close to the target location, and then it would switch to the pulsing control system which was
used as a fine control system. This proved to be very accurate and repeatable and was used on
the final version on the azimuth controls.
One issue with this control system occurred in the Elevation controls when the new eyepiece
was added to the telescope. The new eyepiece added a significant amount of weight to one
side and had to be compensated with by adding a counterweight. This addition of weight forced
the PWM controls to be inoperable, and adjustment only caused extreme variation in the results.
29
SatTrak
Final Report
The PWM would either move the mount too fast causing it to pass the target location by a large
gap, or it would not move at all due to the increased moment of inertia. After some testing, it
was found by accident that the pulsing controls still worked on the elevation after the addition of
the new eyepiece. At this point the decision was made to switch the elevation controls to only
use the pulsing control system rather than the PWM proportional system.
Another issue with the azimuth controls was due to the backlash and misalignment caused by
the tilt introduced through the turntable and backlash introduced through the gearbox and pulley
drivetrain. The azimuth controls were implemented using the pulsing and PWM control system
described above, but the mechanics required some tweaking to make the system operable. The
first attempt was to add some spacers to the mount to force the top plate to be level in respect
to the bottom plate. This method did not work since the spacers introduced too much friction
and caused the mount to bind up where the motor would force the top plate to flex to allow the
pulley to skip the teeth rather than move the mount. The second attempt to remedy this was to
add bolts with ball bearings attached to the bottom to create a lower friction leveling assembly.
This too failed to work since the friction introduced by the bolts caused the same results as
above. Any appreciable removal of this instability caused too much friction. Finally the decision
was made to use a heavy grease to lubricate the bolts. This method did not work for the bolts,
but the lubrication did allow the spacers to work. In the final system, spacers were used with
heavy grease to better stabilize the mount.
Battery
Another important piece of the design is the battery. Without it, nothing would be powered and
the system itself would not work. Thus, it was imperative to find a battery that could adequately
power the project and meet the specs. There are many factors that go into finding the correct
amp-hour rating such as current flow, temperature, and a safety factor. In reality, a battery
should only be drained to 40% of its original capacity; otherwise, the battery could get damaged.
Furthermore, a battery has a rated amperage is over a 20-hour period, and if it draws more than
its average current every hour, then the battery power drains faster. Factors such as these are
difficult to determine, so an online calculator [21] was used to find the final rated amp-hours
necessary for the 12-volt battery. The specifications document states that the system will not
draw more than 36 Whrs, must have a minimum battery life of 3 hours, and will use a 12-volt
battery. Using these parameters and the fact that the components in Table 9 need to be
powered, it was determined that a battery with 22 Ahrs was needed.
Table 9: Components of the SatTrak system powered by the battery
Devices
Power Draw (W)
DC Gear Motor
~ 48 (total)
Arduino Microcontroller
~ 0.5
GPS
~ 0.78
DHT22 Temperature/Humidity Sensor
~ 0.013
30
SatTrak
Final Report
However, this situation is calculated assuming that the motors are running continuously when, in
fact, they only rotate one at a time for a very short period. This helps our design significantly as
we do not need such a high amp-hour battery to power our system for three hours.
So, there was a 7.2 Ahr battery that was in the lab and it was used throughout all our testing.
We charged it fully before testing began and it lasted for well over 3 hours. The current was
also measured while the motors were operating in order to find the power of the system. It was
calculated at 5.76 Whr. Not only did this fulfill the spec that was written, but it allowed the design
to be run on a smaller battery for a longer period of time. Using an online battery drain
calculator, the 7.2 Ahr battery should last approximately 6.25 hrs. If the battery were to last the
3 hour minimum that was specified, then approximately a 3.5 Ahr battery would suffice. What
must be taken into account is that these calculations assume the motors are operating
continuously so in actuality the batteries would last much longer.
Final Implementation Details
After the design was finalized, the SatTrak mount was assembled and all of the sensors and
processing units were attached to the mount. Figure 19 shows where motor board, Arduino,
and Raspberry Pi were mounted on the turntable.
Figure 19: The turntable with mounted processing units and motor drivers.
31
SatTrak
Final Report
First the Arduino and the Raspberry Pi were stacked using standoffs and some acrylic between
the Azimuth and Elevation Motors. This ensured a solid position for the processing units where
they could be mounted in a central and somewhat protected location. After some testing and
consulting Prof. Kelley, it was determined that the Electromagnetic fields created by the motors
would not have an effect on the Arduino and Raspberry Pi. Once the Raspberry Pi and Arduino
were mounted, the cables going between the processing units were attached and the shield was
placed on top of the Arduino. Figure 20 shows the final position of the Arduino and the
Raspberry Pi attached to the mount.
Figure 20: The Arduino and Raspberry Pi attached to the mount.
Next the assembled motor driver circuit was attached to the mount. The motor driver was placed
in the next largest position between the gearboxes for the Azimuth and Elevation motors. It was
oriented so the battery terminals would be on the outside of the turntable for easy access to
connect or disconnect the battery. The DC-DC regulator was also placed on the motor board to
isolate the 12V circuits from the rest of the project. The motors then connected to the motor
board. A 5V power wire was used to deliver power to the Raspberry Pi and a 12V power wire
delivered power the Arduino which used its internal regulator to distribute 5V to itself and all the
sensors. The DC-DC regulator was not used for both the Raspberry Pi and the Arduino since a
majority of the regulator’s power output was needed by the Raspberry Pi and its peripherals. An
image of the motor driver board is shown in Figure 21.
32
SatTrak
Final Report
Figure 21: The Motor board
The final part to be mounted on the turntable was the temperature sensor. The temperature
sensor was mounted next to the motor board, near the elevation gearbox. The desire to keep
the 12V circuits isolated meant that the temperature sensor was mounted separately rather than
on the motor board. This was also important since the temperature sensor was meant to
measure the ambient air temperature and false readings could occur if placed near a processing
unit or motor driver that produced heat. The mounting for the temperature sensor can be seen in
Figure 22.
Figure 22: The temperature sensor
33
SatTrak
Final Report
The remaining sensors were all placed on the top of the telescope. The mounted sensors can
be seen in Figure 23.
Figure 23: The compass, inclinometer, and GPS mounted on top of the telescope.
The compass sensor needed to be isolated from ferrous materials and the motors. The
telescope was constructed from both aluminum and ferrous materials. At the end of the
telescope was an aluminum tube and it was here that the compass sensor was mounted since
this spot was far enough away from both the motors and any ferrous materials that could have
interfered with the compass readings. Figure 24 shows a close-up of the mounted compass
sensor.
Figure 24: The mounted compass sensor
34
SatTrak
Final Report
The inclinometer needed to be placed on the telescope itself to provide pointing accuracy.
Unlike the compass, the inclinometer is insensitive to ferrous materials. Because of this the
inclinometer was placed on top of the telescope above the drive shaft. Due to the moisture and
static sensitivity of the inclinometer, it was also encased inside of some epoxy to protect it from
the elements. An image of the inclinometer is shown in Figure 25.
Figure 25: The mounted inclinometer
The GPS could have been placed anywhere on the mount, but the decision was to place it on
top of the telescope as well seeing as there was room for the module there and placement there
negated the need for the external antenna. The positioning of the GPS on top of the telescope
can be seen in Figure 26.
Figure 26: The mounted GPS module
35
SatTrak
Final Report
Once all of the sensors and circuit boards were mounted to the telescope, the mount was ready
for the final implementation testing. With this, all parts were mounted on the moving turntable
with the only remaining part being the battery. The battery was placed on the ground with wires
going from the battery to the motor board. The control system of the mount was designed such
that the mount would not pass 180 degrees to ensure that the power cable from the battery to
the mount would not be twisted. An image of the fully integrated mount can be seen in Figure
27.
Figure 27: Fully integrated mount
36
SatTrak
Final Report
Bill of Materials
Final Production Cost
Table 10 depicts the individual costs of all the components that went into the final design.
Table 10: The production cost of the Mount
Item Description
Cost ($)
Count
Total ($)
Inclinometer
48.74
1
48.74
Temp/Humidity Sensor
12.50
1
12.50
Compass Module
34.95
1
34.95
Motors
est. 20.00
2
40.00
Motor Drivers
2.95
2
5.90
ABS
23.95
1
23.95
Acrylic
17.95
1
17.95
Arduino Microcontroller
29.95
1
29.95
Proto-shield
4.95
1
4.95
Raspberry Pi Model B
35.00
1
35.00
Real-Time Clock
17.50
1
17.50
SD Card (32GB)
33.36
1
33.36
Eyepiece
29.99
1
29.99
Web Camera
29.95
1
29.95
Power Regulator
16.25
1
16.25
Battery
19.95
1
19.95
Charger
31.84
1
31.84
1 ft. USB cable
6.23
1
6.23
Other (protoboard, turntable-1, timing
belts-4, pulleys-4, stand-offs-8, angle
bracket-9, bushing-2, drive shaft-1)
78.74
1
78.74
Total Cost
517.70
37
SatTrak
Final Report
Total Project Cost
Table 11 below summarizes to the cost of the project including equipment used to create the
design.
Table 11: The Total Project Cost had all parts been bought
Item Description
Cost ($)
Quantity
Total ($)
Product Cost
517.70
1
517.70
Shipping Fees
65.86
1
65.86
Extra Inclinometer
48.74
1
48.74
Extra Temp/Humidity
Sensor
12.50
1
12.50
Extra Motor Driver
2.95
1
2.95
Total
647.75
Discussion
Overall, the budget for this project was pretty accurate compared to the projected budget that
was made last semester. The projected budget for this project was approximately $524 dollars
where the total product cost was $517.70. Not only is this exceptional, considering the costs
associated with this design could have accrued heavily and easily, but the final project cost was
under the maximum allowable budget of $600. Furthermore, there were some additional,
unnecessary costs that would have brought the project total down even more. A new
inclinometer needed to be ordered because the original one failed and extra components were
bought that did not end up being used. Also, some parts needed expedited shipping which
increased the overall cost of the items more than they could have been. This brought the total
project cost up to $647.75. Without the additional components that were not needed, the total
cost with shipping would have been $583.56, still under budget.
38
SatTrak
Final Report
In Retrospect
This project proved to be a challenging project that integrated many fields inside and outside
engineering including Electrical Engineering, Computer Science, Mechanical Engineering,
Astronomy, and Optics. Much of the time spent working on this project was on both aspects of
the project outside of Electrical Engineering and combining these aspects with the Electrical
Engineering aspects. Throughout the project, many problems were encountered, and there
were many lessons learned that would have made the project much easier or at least flow better
had these lessons been known from the beginning. While working on this project, there were
parts that were damaged while working, issues with the project integration, and other general
issues that could have been resolved with better planning from the start.
The first lesson learned was to always use Electrostatic Device (ESD) safe straps and
equipment, as well as making sure everything is grounded properly. The inclinometer is both
static and moisture sensitive and not following proper safety procedures caused the first one to
die. The first time the inclinometer was mounted on a circuit board for testing, it was both poorly
soldered and not well protected. It was mounted on an exposed piece of proto-board without
any protection from moisture or static. While testing the inclinometer, the device experienced an
electrostatic event which killed the device. When the second inclinometer arrived, it was placed
on another piece of proto-board with wires rather than header pins for better placement and
stability. After the inclinometer was mounted, the sensor and its board were coated in epoxy to
protect the inclinometer from moisture and ESD.
A large portion of time was spent working on the mechanical aspects of the motorized mount.
SatTrak consisted entirely of Electrical and Computer Engineers with no formal training in
mechanisms. This made design and implementation of the motorized mount difficult. The mount
had to be designed and built quickly to allow for ample time to implement and test the control
system. Designing and building the mount took much more time than was expected and other
mechanical issues caused delays in the development of the control system. Two potential
solutions would have been to include Mechanical Engineers on the team that designed and built
the mount or to use a pre-fabricated mount designed for a similar application. Interdisciplinary
collaboration would have made the mechanical aspects of this project easier and allotted more
time and focus for the controls.
The next lesson that was learned during the course of this project was the importance of circuit
protection. The circuit should have utilized protection in the form of fuses and barrier diodes.
There were a few instances where reverse polarity protection diodes and fuses would have
saved a large portion of time and work had these parts been implemented. Both fuses and
diodes would have protected the circuit when a power spike caused both motor H-bridges and
the DC-DC regulator were damaged by an incorrect polarity on the battery. Another piece of
circuit protection that should have been implemented is flyback diodes to protect the circuit from
back-EMF caused by the pulsing and PWM controls.
39
SatTrak
Final Report
The next lesson was on the reliability and testability of the compass sensor. The compass
sensor relies on the magnetic field of the Earth to provide a heading. Unfortunately, the Earth’s
magnetic field is disrupted by steel structures. Inside of the lab where the project was worked
on, the magnetic field was impossible to detect meaning that testing using the compass sensor
was next to impossible indoors. Since the weather was not cooperating for a long period of
time, the sensor, which was a crucial part of the control system, could not be used. This was
remedied by placing a large magnet near the compass sensor to act as a fake North. The fake
north worked to a limited extent, allowing some testing to be done indoors. In the future, the use
of encoders could have allowed indoors testing without the need for a solid fake North magnetic
field.
Another lesson learned through different aspects of the project was that redundancy is not a
bad idea. For example, redundant sensors for measuring the device’s position and state would
have been a great help. Experimenting with the compass sensor in an environment with
interference as stated above, would render the system inoperable. A redundant system that
would help avoid total system failure is ideal. Encoders or some other method of tracking the
motion of the mount, the compass and inclinometer sensors, and potentially even a third set of
sensors that operate independently of the others, would have allowed for continued operation,
even if one or two sensors experienced failure in some way.
40
SatTrak
Final Report
References:
1
2
3
4
5
6
7
8
9
10
11
12
13
14
15
16
17
18
19
20
21
22
http://orbitaldebris.jsc.nasa.gov/faqs.html#3
http://orbitaldebris.jsc.nasa.gov/photogallery/beehives/LEO640.jpg
http://orbitaldebris.jsc.nasa.gov/photogallery/beehives/GEO640.jpg
http://www.galileotelescope.com/choosing_a_telescope.htm
http://astronomicaltelescopesguide.blogspot.com/2007/02/aperture-size-versusmagnification.html
http://www.answersingenesis.org/assets/images/articles/am/v3/n1/telescope-optics.jpg
http://www.celestron.com/c3/support3/index.php?_m=knowledgebase&_a=viewarticle&k
barticleid=2133
http://upload.wikimedia.org/wikipedia/commons/thumb/f/f7/AzimuthAltitude_schematic.svg/350px-Azimuth-Altitude_schematic.svg.png
http://www.celestron.com/images/tb-mtrm1.gif
http://orbitaldebris.jsc.nasa.gov/faqs.html#1
http://www.eso.org/public/news/eso0307/
http://en.wikipedia.org/wiki/File:Ra_and_dec_on_celestial_sphere.png
http://www.celestron.com/images/tb-mtrm2.gif
http://bildr.org/blog/wp-content/uploads/2011/01/HMC6352.png
http://www.mouser.com/ds/2/281/sca61t_inclinometer_datasheet_8261900a2_02599.pdf
http://learn.adafruit.com/assets/578
https://github.com/adafruit/DHT-sensor-library/downloads
http://www.parallax.com/Portals/0/Downloads/docs/prod/sens/PMB688_Specification_V0.1.pdf
http://learn.parallax.com/KickStart/28500
http://www.telescope.com/Telescopes/Refractor-Telescopes/Refractor-Optical-TubeAssemblies/Orion-ShortTube-80-T-Refractor-Telescope/pc/1/c/10/sc/346/p/9946.uts
http://chdk.wikia.com/wiki/CHDK
http://lib.store.yahoo.net/lib/sports-imports/BatterydrainCalc.html
41