1
User Manual
Data Acquisition Studio
UMDAQC
Rev 3.0, 02/2011
TABLE OF CONTENTS
1.
INTRODUCTION .................................................................................... 5
1.1
INTRODUCTION ...............................................................................................................5
1.2
SYSTEM REQUIREMENTS .................................................................................................5
1.3
DAQ FEATURES .............................................................................................................5
1.3.1
Real Time Viewer..................................................................................................5
1.3.2
Historical Viewer ...................................................................................................6
1.3.3
Sample Applications..............................................................................................7
2.
2.1
2.2
SOFTWARE INSTALLATION .............................................................. 10
DAQ SOFTWARE INSTALLATION.....................................................................................10
DAQ SOFTWARE UNINSTALL .........................................................................................11
3.
IO STUDIO............................................................................................ 11
4.
CONFIGURATION................................................................................ 20
4.1
TOOLS IN DAQ SOFTWARE ...........................................................................................20
4.1.1
Tool Bar...............................................................................................................20
4.1.2
Menu Bar.............................................................................................................21
4.2
BANK SETTINGS............................................................................................................22
4.2.1
RS232 bank setting.............................................................................................22
4.2.2
Ethernet Bank setting..........................................................................................24
4.3
CREATE NEW PROJECT FOR IO MODULES .....................................................................25
4.3.1
Add new IO module by RS232/RS485................................................................28
4.3.2
Add new IO module by Ethernet .........................................................................29
4.4
CREATE A NEW PROJECT FOR PAPERLESS RECORDER ..................................................31
4.4.1
Create a New project by Ethernet .......................................................................31
4.4.2
Create a New project by RS485..........................................................................37
4.5
CREATE A NEW PROJECT FOR CONTROLLERS................................................................40
4.5.1
Modification of controller parameters in Real time..............................................44
4.6
CHANNEL CONFIGURATION ...........................................................................................46
4.6.1
Event ...................................................................................................................48
4.6.2
Jobs.....................................................................................................................49
4.6.3
Analog inputs ......................................................................................................51
4.6.4
Digital Inputs .......................................................................................................52
4.6.5
Analog Outputs ...................................................................................................53
4.6.6
Digital Outputs.....................................................................................................53
4.6.7
Add a Math channel ............................................................................................54
4.6.8
Add third party device .........................................................................................58
4.7
DISPLAY CONFIGURATION .............................................................................................60
4.8
TOOLS CONFIGURATION ...............................................................................................61
4.8.1
Timers .................................................................................................................61
4.8.2
Counters..............................................................................................................63
4.8.3
Totalizers.............................................................................................................65
4.9
COMMENTS ..................................................................................................................66
4.10
PROJECT AUTO CONFIGURE ......................................................................................68
4.11
OPTION ....................................................................................................................70
4.11.1 Share...................................................................................................................70
4.11.2 Email ...................................................................................................................71
4.11.3 Communication ...................................................................................................73
4.11.4 Auto-Page ...........................................................................................................74
4.12
PRINT CONFIGURATION .............................................................................................74
4.13
BACKUP ...................................................................................................................76
4.13.1 Project and Data backup.....................................................................................76
4.13.2 Restoring Project with Data.................................................................................77
4.13.3 Sending Project files ...........................................................................................78
2
5.
REAL TIME VIEWER............................................................................ 79
5.1
OPENING PROJECT .......................................................................................................80
5.1.1
Display Arrange All..............................................................................................80
5.1.2
Display Events ....................................................................................................81
5.1.3
Display Digital Values..........................................................................................82
5.1.4
Display Bar Graphs .............................................................................................84
5.1.5
Display Real Time Trends...................................................................................85
5.1.6
Display All Channel Digital ..................................................................................86
5.1.7
Display Counter & Totalizers...............................................................................87
5.2
DATA DYNAMIC EXCHANGE (DDE).................................................................................89
6.
HISTORICAL VIEWER ......................................................................... 95
6.1
HUMAN MACHINE INTERFACE (HMI) ...............................................................................95
6.1.1
Preparation of historical data storage in HMI ......................................................95
6.1.2
HMI data archive in PC using storage device (USB stick) ..................................96
6.1.3
HMI data archive in PC via Ethernet .................................................................100
6.2
PAPERLESS RECORDER..............................................................................................106
6.2.1
Paperless data archive in PC using storage device (CF card) .........................106
6.2.2
Paperless data archive in PC via Ethernet........................................................109
6.3
TOOLS .......................................................................................................................114
6.3.1
Tool Bar.............................................................................................................114
6.3.2
Menu Bar...........................................................................................................115
6.4
IMPORT AND EXPORT OPTIONS ....................................................................................117
6.4.1
Manually............................................................................................................118
6.4.2
Automatically.....................................................................................................118
6.4.3
Automatically and export to Excel .....................................................................119
6.4.4
Automatically and export to database format....................................................119
6.5
EXPORT DATA ............................................................................................................120
6.5.1
Export data to Excel..........................................................................................120
6.5.2
Export data to database ....................................................................................122
6.5.3
Export data automatically..................................................................................124
6.6
REMARK ....................................................................................................................124
6.7
VIEW .........................................................................................................................126
6.8
DISPLAY.....................................................................................................................127
6.8.1
Trend view.........................................................................................................127
6.8.2
Events/Alarm List ..............................................................................................129
6.8.3
Reports List (Only for Paperless Recorder) ......................................................130
6.8.4
Value List ..........................................................................................................134
6.9
PAGE SELECTION .......................................................................................................135
6.10
SEARCH .................................................................................................................136
6.10.1 By Time .............................................................................................................136
6.10.2 Period of Time...................................................................................................137
6.10.3 By Tag Name ....................................................................................................138
6.10.4 By Alarm/Event .................................................................................................139
6.10.5 By Remark ........................................................................................................139
6.11
PRINT.....................................................................................................................140
7.
FREQUENTLY ASKED QUESTIONS ................................................ 141
3
Information to user
NOTE:
Do not open IO Studio and Real time viewer at same time in your PC. First complete IO
module configuration by using IO studio software, close IO studio, then, open Real time viewer
It requires to buy USB hardware lock (Keypro) from supplier to run RealTime viewer in PC.
One single license is required to run Real Time Viewer in single PC. It is not required to purchase
Hardware lock to view historical data in other computers via LAN. With out hardware lock, Real
Time Viewer in Data acquisition software will run for 1 hr. in demo mode
Original equipment manufacturer reserves right to modify the document with out notice
4
1. Introduction
1.1 Introduction
Data Acquisition Studio (DAQ) software is PC based data logging and Acquisition
software. It acquires data from Modbus RTU/ Modbus TCP slave devices like IO Modules,
Recorders, Controllers etc., and shows Real time data in PC in form of Trends, Bar
graphs, Digital values etc. and store data in PC for later archival.
DAQ support till 2048 tags (from V1.2 or later). One tag means one channel and it can be
either Analog input or Analog output or digital input or digital output or Math channel
1.2 System requirements
Data acquisition Software
PC with Minimum 1 GHz processor, 512 MB RAM
1 GB MB free space in the hard disk
RS 232 serial port/ Ethernet Network adopter RJ 45 female
Operating system: Windows XP, Windows Vista, Windows 2000, Windows 2003 &
Windows 7
Note: For IO studio software, it requires to install dot net frame work 2.0. It is not
supported for Windows ME, Windows NT and Windows 2000
1.3 DAQ features
1.3.1 Real Time Viewer
2048 tags including AI, AO, DI, DO & Math
1 to 24 configurable tags display per page, maximum 200 display pages
Math channels
100 Timers, 50 Counters and 50 Totalizer’s
100 comments for Alarms
Real time trends, Bar graphs, Digital value display
Real Time Alarms
Log Speed: 1, 2, 5 10, 30, 60 & 120 Sec, Log Methods: Instant, Average,
Minimum & Maximum, Log trigger type: By time, By value change
Alarms by Email
5
Display languages: English, French, German, Italian, Japanese, Korean, Polish,
Portuguese, Russian, Spanish, Thai and Czech, Chinese (Traditional) and
Chinese (Simplified)
Connection to IO Modules, Paperless Recorder, Controllers and any third party
devices via Modbus RTU or Modbus TCP protocol
Five different types of Events can be configured for each channel and each event
support 2 jobs. So, total 10 different jobs can be set per each channel
Event Type available for Trigger: H, HH, L, LL, Rate of increase, Rate of
decrease and Error.
Jobs Available to link with events: Log Alarm, Log Event, Log Alarm (Auto ack.),
send email, Sound buzzer, DO Latch ON, DO Latch OFF, DO Process, Enable
Timer, Disable Timer, Preset Totalizer, Reset Totalizer, Enable Totalizer, Disable
Totalizer, Preset Counter, Reset Counter, Increase Counter, Decrease Counter,
Log Report, Reset Min/Max/Avg and Log Message
Project Auto configure option available (Generate tag data base automatically
once IO modules are connected to the network and create a new project)
Supported Math functions: SIN, COS, EXP, SQRT, LN, LOG, ABS, POW,
ROUND, HI, LO, INV, TG, CTG, ASIN, ACOS and ATG
Source of Math channel: Analog inputs, Math channels, Counters and Totalizers
Data Types: 2 byte, 4 byte and 8 byte, Decimal: 0 to 4
Real time + Historical combined by changing different display page properies
1.3.2 Historical Viewer
Historical trend
Historical Alarms/Events
Reports (Daily, Weekly & Monthly)
Display Historical values in tabular column
Mark Remarks on data (Comments)
Search data by Time, Timer Period, Event/Alarm, tag wise and Remark
View trends both Horizontally and Vertically
Zoom out & Zoom In
Display view options available at 1 sec/dot, 2 sec/dot, 5 sec/dot, 10 sec/dot, 20
sec/dot, 30 sec/dot, 1 min/dot, 2 min/dot, 5 min/dot, 10 min/dot, 30 min/dot, 10
min/page, 30 min/page, 1 hr/page, 2 hr/page, 4 hr/page, 8 hrs/page, day/page,
week/page and Month/page
6
Display white back ground/black background
Export data and alarms/events to CSV files. (Specify time or time period or all)
Print trend view, Event/Alarm list, Reports & Tag Values
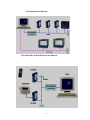
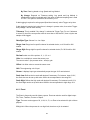
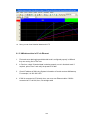
1.3.3 Sample Applications
Data Acquisition Studio Software in PC will act as Modbus Master and Acquire data from
IO modules acting as Modbus Slaves in RS485 network. The serial port of the PC is
connected to an RS232/RS485 Converter like SNA10A which in turn is connected to the
Network.
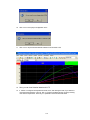
Alternatively Ethernet port of PC is connected to Protocol converter like PC-E as shown
attached
Fig1: Application by serial ports
7
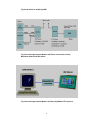
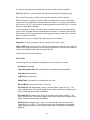
Fig2: Application by Ethernet
Fig3: Application by both Serial port and Ethernet
8
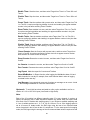
Fig: Send alarms to mobile by SMS
Fig: Data exchange between Master and Slaves via wireless devices,
Maximum distance till 800 meters
Fig: Data exchange between Master and Slave by Modbus RTU protocol
9
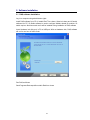
2. Software Installation
2.1 DAQ software installation
Log in to computer using administrator rights
Install DAQ software from CD. It installs Real Time viewer, Historical viewer and IO studio
software into PC. IO Studio software is used to configure Modbus based IO modules. IO
studio requires .Net frame work and it will be installed during installation of DAQ software
Insert Hardware lock (Key pro) in PC at USB port. With out hardware lock, DAQ software
will run for one hour in demo mode
Run DAQ as follows
Start-Programs-Data acquisition studio-Real time viewer
10
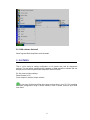
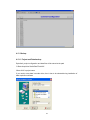
2.2 DAQ software Uninstall
Start-Programs-Data Acquisition studio-Uninstall
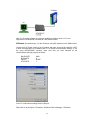
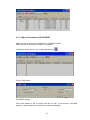
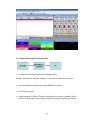
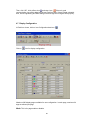
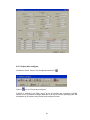
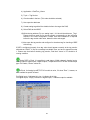
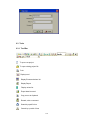
3. IO STUDIO
This is a tool useful for setting configuration of IO module and used for diagnostics
purpose. This tool will be installed during installation of Data acquisition software and can
be opened from Start-Programs-Data acquisition Studio-IO Studio
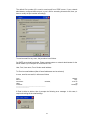
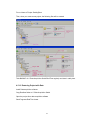
Ex: Set communication settings
Read IO status in PC,
Force Outputs to test the Output modules
Do not open IO Studio and Real time viewer at same time in your PC. First complete
IO module configuration using IO studio software, close IO studio, and then open Real
time viewer
11
Note: For IO studio software, it requires to install dot net frame work 2.0. It is not
supported for Windows ME, Windows NT and Windows 2000
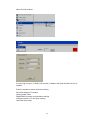
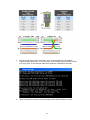
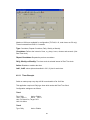
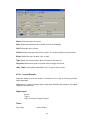
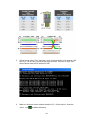
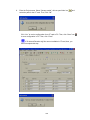
IO Module: Set address say 1 for the IO Module using DIP switches on the Module itself.
Connect 24V DC Power supply to the IO module and make sure that Dip switch10 is OFF
to allow communication of IO Module with PC on Default communication settings. If you
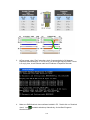
are using RS232/RS485 converter make sure that you have selected all the
communication settings properly as follows.
BAUD RATE
DATA BITS
PARITY
STOP BITS
9600
8
NONE
1
In the PC, select above settings at the COM port.
Right click on My computer –Properties - Hardware-Device Manager- COM ports
12
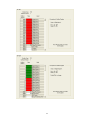
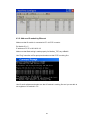
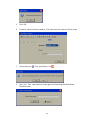
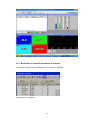
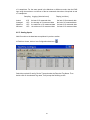
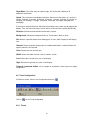
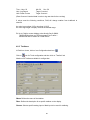
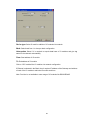
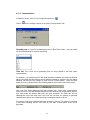
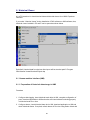
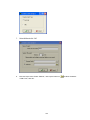
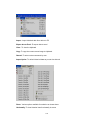
Open IO studio software
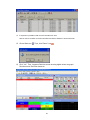
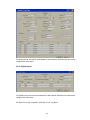
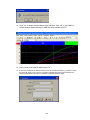
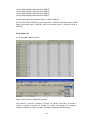
If every thing is proper, IO Studio will read the IO Module and show the status of the IO
registers.
If there is a problem, please check the following
Dip switch settings in IO module
Communication cable
RS485/RS232 converter communication settings
COM port number in PC and driver settings
Close Real time viewer
13
14
15
16
17
18
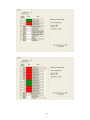
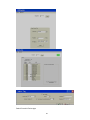
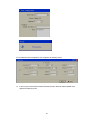
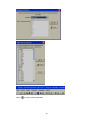
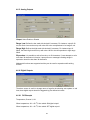
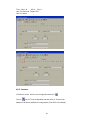
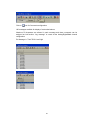
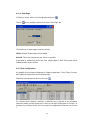
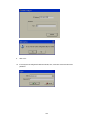
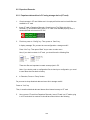
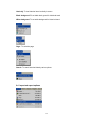
Configuration:
For ex: If you want set baud rate, enter the required value in the register 40121, and then
press enter in the PC keyboard. Set all the parameters once and then switch off the
power supply to the IO Module. Now switch on the Dip switch 10 on the module to make
above settings effective. After power on, the IO Module will have new Communication
settings. Please note that at this point of time, IO module may not communicate with PC
because you may have different settings at RS232/RS485 converter and also COM port
settings in the PC.
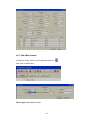
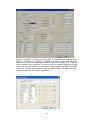
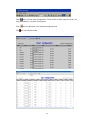
Testing the IO Module:
For ex: If you want to test Digital Output module 16DO module. It contains total 16 digital
outputs. You can connect IO module with PC as explained above via RS232/RS485
converter. You can force digital output from low to high and check its status at the IO
module and also you can observe LED status on the IO Module itself.
Do not open IO Studio and Real time viewer at same time in your PC. First complete
IO module configuration using IO studio software, close IO studio, then, open Real time
viewer
19
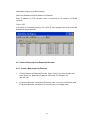
4. Configuration
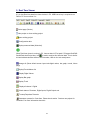
4.1 Tools in DAQ software
4.1.1 Tool Bar
Configuration data
New project or close existing project
Open existing project
Select page (Choice)
Measured data or Historical viewer
Arrange all (Show default screen layout-mix-digital values, bar graph, trends, Alarm
page)
Display Events/Alarms list
Display Digital Values
Display Bar graph
Display Trend
Display all channel - Digital
Check status of Counters, Digital inputs, Digital Outputs etc.
Save
Option
Delete this project
20
Print
Bank setting
Channel configuration
Channel Display configuration
Tools (Counter, Timers, Totalizers configuration)
Customized Comments for Alarms
Project Auto Configure
Close and return to main program
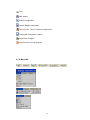
4.1.2 Menu Bar
21
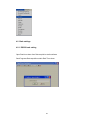
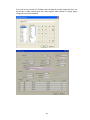
4.2 Bank settings
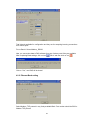
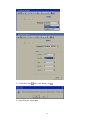
4.2.1 RS232 bank setting
Open Real time viewer from Data acquisition studio software
Start-Programs-Data acquisition studio-Real Time viewer
22
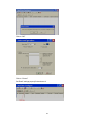
Click on “NO”
Click on “Cancel”
Set “Bank” settings properly first and save it
23
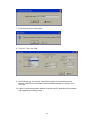
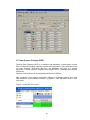
Total 4 banks available for configuration and they are for accepting incoming connections
from various ports
For ex: Bank1: Set as Modbus_ RS232
Now, you can receive data to DAQ software from any of above ports if they are available
After completing Bank settings, click on icon
“Save” and then click on icon
Click on “Yes”, now DAQ will be closed
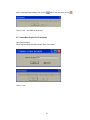
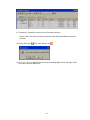
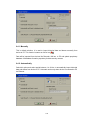
4.2.2 Ethernet Bank setting
Select Modbus_TCP protocol in any freely available Bank. Port number should be 502 for
Modbus TCP protocol
24
After completing Bank settings, click on icon
“Save” and then click on icon
Click on “Yes”, now DAQ will be closed
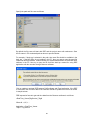
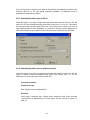
4.3 Create New Project for IO modules
Open DAQ software
Start-Programs-Data acquisition studio-Real Time viewer
Click on “Yes”
25
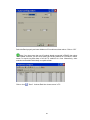
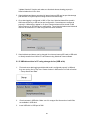
Select the Bank properly and enter Address of IO module as shown above. Click on “OK”
Note: If you have more than one IO module already connected in RS485, then select
“Auto-Update” and then you can enter starting and ending address of IO module in above
screen to acquire tag data base of all the IO modules at a time. Alternatively, other
modules can be added individually as explained later
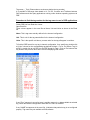
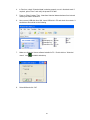
Click on icon
“Save”. It shows Real time viewer screen in PC
26
If it is by Ethernet, screen shots will be as shown below
Note: When Ethernet is used in a bank, it is not possible to add many IO modules to
the tag data base at one step. It requires adding each IO module individually
27
4.3.1 Add new IO module by RS232/RS485
Make sure that IO module is connected to PC via RS485 converter
Bank setting is made properly for RS232, say at Bank1
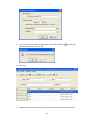
In Real time viewer, click on Icon Configuration data icon
Click on “Add” button
Select Bank properly
Enter node address of the IO module and click on “OK”. If the module is connected
properly, it acquire data base of selected IO module automatically
28
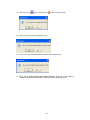
4.3.2 Add new IO module by Ethernet
Make sure that IO module is connected to PC via PC-E converter
Ex: Module ID = 5
IP address of PC-E is 192.168.0.112
Make sure that Bank setting is made properly for Modbus_TCP, say at Bank2
Use “Ping” instruction at Dos prompt and make sure that PC-E is working fine
Use IO studio software and make sure that IO module is working fine and you are able to
see registers of IO module in PC
29
Select IO card in Device type
30
Select Bank properly as per Bank settings
Select Use Gateway and Select address of IO Module
Enter IP address of PC-E converter which is connected to IO modules via RS485
converter
Click on “OK”
If IO module is connected properly to PC via PC-E, then tag data base of IO module will
be added as shown attached
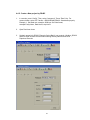
4.4 Create a New project for Paperless Recorder
4.4.1 Create a New project by Ethernet
1.
Check IP address of Paperless Recorder. Press “Config” key, select “System info”,
press “Enter” key. Note down IP address of Recorder. For example, it is
192.168.0.30
2.
If Paperless Recorder connected to PC directly, then, use cross over Ethernet cable.
If Paperless Recorder connected to PC via LAN, then, use straight cable
31
3.
At Dos prompt, using “Ping” instruction, check if communication is OK between
Paperless Recorder and PC. If it is OK, then, you should get reply as follows. If there
is no reply, then, check Ethernet cable and IP address of Paperless Recorder
4.
Open the Real time viewer from Start-Programs-DAQ Studio-Real time viewer
32
5.
Click “OK”
6.
For bank1, select Protocol as Modbus_TCP, make sure Port number is 502 as shown
7.
Click at Save icon
8.
Click “Yes”. Then, open Real time viewer again from Start-Programs-DAQ StudioReal time viewer
. Then, click “Return” icon
33
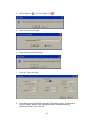
9.
Enter the new name for the project. Click “OK”
10. Click at “Yes”. Then, it appears the following screen
11. Select the required Recorder at device type
12.
Enter IP address of the Recorder. Then, click at “+”. Then, IP address should appear in IP List
as shown. Then click “OK”
34
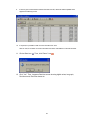
If no is selected for auto configuration, then, it appears the following screen
13.
If there is good communication between Recorder and PC, data base will be updated and it
appears the following screen
35
14.
If required, it is possible to add one more Recorder from here
Click at “Add”, then follow on screen instructions and enter IP address of second Recorder
15. Click at Save icon
. Then, click “Return” icon
16. Click “Yes”. Then, it appears Real time screen showing digital values, bar graph,
Real time trend, Real time alarms etc.
36
4.4.2 Create a New project by RS485
1.
In recorder, press “Config”. Then, select “Instrument”. Press “Enter” Key. For
communication, select PC Transfer = RS232/RS485/RS422. Set address properly.
Example: 1. Set Baud rate, example: 9600 bps. Set Data format,
example:Parity=None, Data bits=8, stop bits=1
2.
Open Real time viewer
3.
Set bank properly for RS232. Example: Select Bank2, set protocol = Modbus_RS232
and then enter all other communication settings exactly same as defined at
Paperless Recorder
37
4.
Click at Save icon
. Then, click “Return” icon
5.
Open Real time viewer again.
6.
Enter the new name for the project
7.
Click “No”. Then, click “Add”
8.
Select Device type as VR18/VR06 Recorder. Select Bank properly. If should show
protocol: Modbus_RS232. Enter node address same as address defined at
Paperless Recorder. Then, click “OK”
38
.
9.
If there is good communication between Recorder and PC, data base will be updated and it
appears the following screen
10.
If required, it is possible to add one more Recorder from here
Click at “Add”, then follow on screen instructions and enter node address of second Recorder
11. Click at Save icon
. Then, click “Return” icon
12. Click “Yes”. Then, it appears Real time screen showing digital values, bar graph,
Real time trend, Real time alarms etc.
39
4.5 Create a New project for Controllers
1. In controller, please set communication settings properly
Example: Set Baud rate: 9600 bps. Address: 1, Parity=None, Data bits=8, stop bits=1
2. Set communication settings properly at RS485/RS232 converter
3. Open Real time viewer
4. Set bank properly for RS232. Example: Select Bank2, set protocol = Modbus_RS232
and then enter all other communication settings exactly same as defined at Controller
40
5. Click at Save icon
. Then, click “Return” icon
6. Open Real time viewer again.
41
.
7. Enter the new name for the project
8. Click “No”. Then, click “Add”
9. Select Device type as Controller. Select Bank properly. If should show protocol:
Modbus_RS232. Enter node address same as address defined at Controller. Then,
click “OK”
10. If there is good communication between Controller and PC, data base will be updated
and it appears the following screen
42
11. If required, it is possible to add one more Controller from here
Click at “Add”, then follow on screen instructions and enter node address of second
controller
12. Click at Save icon
. Then, click “Return” icon
13. Click “Yes”. Then, it appears Real time screen showing digital values, bar graph, Real
time trend, Real time alarms etc.
43
4.5.1 Modification of controller parameters in Real time
It is possible to modify max.10 parameters for a controller in Real time.
Fig: Design time configuration
44
Click at
to modify controller parameters
45
Fig: Real time modification
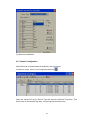
4.6 Channel Configuration
Add IO/Recorder to the data base as explained in previous section.
In Real time viewer, click on Icon Configuration data icon
Select the required IO card in Device Type and select the Required Tag Name. Then
double click on the selected Tag name, it will prompt the following screen
46
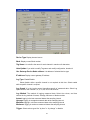
Device Type: Display channel source
Bank: Display current Bank number
Tag Name: It is to define the name for each channel in maximum 9 characters
Auto-Update: If you wish to modify Tag name and modify configuration, deselect it
Use Gateway-Device Node address: It is address of selected device type
IP address: Display current gateway IP address
Log Type: Enable/Disable
Select disable while a specific channel is not required at this time. Select enable
while a specific channel is required
Log Speed: It is the logging speed (recording speed) of measured data. Select Log
Speed column, then choose 1, 2, 5, 10, 30, 60 or 120 seconds
Log Method: The method of logging measured data. Select the column, and then
choose the Log method of Instant, Average, Minimum or Maximum data
Instant: logging in the last measured data at the sampling interval
Average: logging in averaged measured data at the sampling interval
Minimum: logging in minimum measured data at the sampling interval
Maximum: logging in maximum measured data at the sampling interval
Trigger: Select various types like “by time” or “by change” or disable
47
By Time: Data log based on Log Speed and Log Method
By Change: Depends on Tolerance setting. Log speed and Log Method is
disabled if this option is selected and if this option is selected sampling rate is fixed
at 1 sec. This option is selected to save memory in PC
If data logging is required in set log speed (fixed time interval), select Trigger as by timer.
If data logging is required only when there is change in process value, then select Trigger
as by change. This will save memory
Tolerance: This is enabled if “by change” is selected at Trigger Type. For ex: If tolerance
is set at 0.5, then if the new process value is more than or less than 0.5, then only the new
sample will be logged
Data Byte Type: Choose 2 or 4 or 8 byte
Range Low: Range low for specific channel in selected device, ex: 4.00 mA for 8AII
module
Range High: Range high for specific channel in selected device, Ex: 20.00 mA for 8AII
module
Decimal: select one of the options - 0, 1, 2, 3 or 4
Gain: It is a multiplier to correct the sensor error.
The correct value = (the process value + offset) x gain
Offset: It is offset value to correct the sensor error
Unit: The engineering unit of input
Sensor: It displays input type automatically as per the type of IO card selected
Scale Low: Defines the low scale with decimal if necessary. For instance, input 0-10 V,
the Scale Low can be set up with value 0.00 to be correspondent to low range 0 V.
Scale High: Defines the high scale with decimal if necessary. For instance input 0-10 V,
the Scale High can be set up with value 100.00 to be correspondent to high range 10 V.
4.6.1 Event
The Event is frequently used for Alarm purpose. Event can also be used for digital output
DO, Timer, Totalizer, Counter or Report.
Type: There are various types of H, L, HH, LL, R, r or Error to be selected for job or Alarm
purpose.
H: High limit. When the process is over high limit, the alarm or job is actuated.
48
L: Low limit. Any the process is lower than low limit, the alarm or job is actuated
HH: High high limit, to set up another limit higher than high limit for double warning.
LL: Low low limit, to set up another limit lower than low limit for double warning.
R: Increasing rate of change. The job or alarm is actuated when the rate of increasing
process value is greater than the specified rate time interval. For example, when the Set
point is set to 100_1S, if the process is increasing greater than the value 100 in 1 second,
then job or alarm will be actuated.
r: Decreasing rate of change. The job or alarm is actuated when the rate of decreasing
process value is greater than the specified rate time interval. For example, when the Set
point is set to 50_2S if the process is decreasing greater than the value 50 in 2 seconds,
then job or alarm is actuated.
Error: If there is error in channel input, then alarm or job is actuated
Set point: To set up the process value for actuating Job1 and /or Job2
Job1, Job2: When an event occurs, the task to be performed is called the job. A typical
example is to trigger sound buzzer in event of high temperature. Each pen can accept five
events (or alarms) and each event can create two jobs.
Various types of jobs can be selected:
4.6.2 Jobs
The following jobs are available for configuration to be executed on an event
No Action: Do nothing
Log Alarm (Auto Ack): Record alarm with acknowledgement automatically
Log Alarm: Record alarms
Log Event: Record events
Send Email: Send email if it is configured on an event
Sound Buzzer: Sound the buzzer on an event
DO Latch On: Set digital output / relay on, and then select Target say DO 1. The
relay is latched when it is activated. Digital Output relays will be shown if digital output
card is configured and available in database
DO Latch Off: Set digital output / relay off, and then select Target say DO 1. The
relay is latched when it is activated. Digital Output relays will be shown if digital output
card is configured and available in database
DO Process: Set digital output / relay on for process high or low, and then select
Target from DO 1 to DO 6. The relay is not going to be latched when it is activated.
Digital Output relays will be shown if digital output card is configured and available in
database
49
Enable Timer: Start the timer, and then select Target from Timer1 to Timer 100 or all
Timers
Disable Timer: Stop the timer, and then select Target from Timer1 to Timer 100 or all
Timers
Preset Totalz: Start the totalizer with a preset value, and then select Target from Tolz
1 to Tolz 50. It requires configuring totalizer via tools and enabling it to appear totalizer
number in the jobs after selecting Preset Totalizer
Reset Totalz: Reset totalizer into zero, and then select Target from Tolz 1 to Tolz 50.
It requires configuring totalizer and enabling it to appear totalizer number in the jobs
after selecting Preset Totalizer
Enable Totalz: Start the totalizer, and then select Target from Tolz 1 to Tolz 50. It
requires configuring totalizer and enabling it to appear totalizer number in the jobs after
selecting Preset Totalizer
Disable Totalz: Stop the totalizer, and then select Target from Tolz 1 to Tolz 50. It
requires configuring totalizer and enabling it to appear totalizer number in the jobs after
selecting Preset Totalizer
Preset Counter: Start the Counter with a preset value, and then select Target from
Cont1 to Cont50. It requires configuring Counter via tools to appear counter number
after selection of Preset counter in the jobs
Reset Counter: Resets the counter into zero, and then select Target from Cont1 to
Cont50.
Inc Counter: Increase the counter, and then select Target from Cont1 to Cont50
Dec Counter: Decrease the counter, and then select Target from Cont1 to Cont50
Log Report: Make the report for Counter and Totalizer
Reset MinMaxAve: In Report function, after logging the MinMaxAve data of AI and
Math channels for one day for example, then reset historical data in order to logging
new data for the next day
Log Message: Log customized comments for alarm as messages on an event. A total
of 100 messages available for customer customization
Hysteresis: To avoid job have been activated too often, option available to set for no
reaction in 0.1% to 10% of full span (Low Scale to High Scale).
Note:
Each of the IO modules has different sampling rates. For every channel, it requires to
specify the sampling rate in data acquisition software. By default DAQ will acquire data
from each of the IO module with sampling rate of 1 sec. Minimum available sampling rate
is 1 sec. Available options are 1, 2, 5, 10, 30, 60, 120 sec. For ex: If the logging speed is
set at 10 second in Instant mode, the DAQ logs using the last of ten measured data
values it acquired in last 10 sec at rate of 1 sample/sec. For the same speed in Averaging
mode, the DAQ logs using the average of the ten measured data values it acquired at rate
50
of 1 sample/sec. For the same speed in the Maximum or Minimum mode, then the DAQ
logs using the maximum or minimum of the ten measured data values it acquired at rate
of 1 sample/sec.
Sampling Logging (historical trend)
Instant
Averaged
Maximum
Minimum
10 S
10 S
10 S
10 S
the last of 10 measured data
the average of 10 measured data
the maximum of 10 measured data
the minimum of 10 measured data
Display (real time)
the last of 10 measured data
the last of 10 measured data
the last of 10 measured data
the last of 10 measured data
4.6.3 Analog inputs
Add IO module to the data base as explained in previous section.
In Real time viewer, click on Icon Configuration data icon
Select the required IO card in Device Type and select the Required Tag Name. Then
double click on the selected Tag name, it will prompt the following screen
51
For Analog inputs, five events are available for each channel. Maximum two jobs can be
configured for each event
4.6.4 Digital Inputs
For Digital inputs, two events are available for each channel. Maximum two jobs can be
configured for each event
Ex: When DI1 is high, Log alarm, when DI1 is Low, Log alarm
52
4.6.5 Analog Outputs
Output: Select Enable or Disable
Range Low: Defines the low scale with decimal if necessary. For instance, output 0-20
mA, the Scale Low can be set up with value 0.0 to be correspondent to low range 0 mA.
Range High: Defines the high scale with decimal if necessary. For instance input 020mA, the Scale High can be set up with value 100.0 to be correspondent to high range
20mA.
Expression: It is possible to write a formula up to 36 characters. If user attempts to write
more than 36 characters in formula, it prompt an error message indicating strings in
expression should be less than 36 characters
Mathematic functions are supported and they can be used in expression while writing
formula
4.6.6 Digital Outputs
The above screen is useful to change name of tag after de-selecting auto-update. In real
time, these digital outputs should be triggered by jobs defined at events.
4.6.6.1 DO Example
Temperature, Channel 1, AI1
When temperature, AI1 > 80 OC, then switch ON digital output1
When temperature, AI1 < 40 OC, then switch OFF digital output1
53
4.6.7 Add a Math channel
In Real time viewer, click on Icon Configuration data icon
Now, click on “Add” button
Device type: Select Math operation
54
Except for Expression, it is similar to do the setting up for Analog input explained earlier.
Define the Tag Name, Log Speed, Log Method, Log Speed, Trigger type, Data type,
Decimal, Unit, Scale Low, Scale High, and Event. Click on data entry box, it appears
Source, Operator and a keyboard. The Source covers all available Analog inputs, Math
inputs, Counters and Totalizers. The Operators are Mathematic functions described below.
Use Source, Operator and keyboard to define the Math equation. The Math expression /
equation can be keyed in maximum 36 characters.
55
Math Expressions
+
Addition
-
Subtraction
*
Multiplication
/
Division
SIN(x)
sin(x)
COS(x)
cos(x)
EXP(x)
ex
SQRT(x)
Square root of x
LN(x)
loge(x)
LOG(x)
log10(x)
ABS(x)
Absolute of x
POW (x,y)
x
ROUND(x)
The closest integral number to x
HI(x,y)
The bigger value between x and y
LO(x,y)
The smaller value between x and y
INV(x)
1/x
TG(x)
tan(x)
CTG(x)
1/tan(x)
ASIN(x)
Sin-1(x)
ACOS(x)
Cos-1(x)
ATG(x)
Tan-1(x)
x%y
Remainder of x/y
y
56
4.6.7.1 Math Example
Relative Humidity – Math application
/*How to Calculate Relative Humidity - Theory
Requirement: Two Analog Inputs, Type: RTD
AI1: To measure dry bulb temperature
AI2: To measure wet bulb temperature
First calculate the saturation vapor pressure (E) for both the dry-bulb (Td) and wet-bulb
(Tw) temperatures using the following equations:
Ew = 0.61078*EXP((17.269*Tw)/(Tw+237.3))*(Td-Tw)
Ed = 0.61078*EXP((17.269*Td)/(Td+237.3))*(Td-Tw)
In the above equations the temperatures units are Celsius and the saturation vapor
pressure units are milli bars. The function "EXP" is the exponential and not raising
something to an exponent.
Then calculate actual vapor pressure (Ea) using the following equation:
Ea = Ew-0.63*(Td-Tw)
Relative Humidity is then calculated using the following equation:
RH = (Ea/Ed)*100
The units of relative humidity are in percent.
Here is an example of the using the equations:
O
Assume that your dry-bulb temperature (Td) = 40 C and
Wet-bulb temperature (Tw) = 30 OC.
Ew = 0.61078*EXP((17.269*Tw)/(Tw+237.3))*(Td-Tw)
Ew = 0.61078*EXP((17.269*30)/(30+237.3))*(40-30)
Ew = 42.4262 milli bars
Ed = 0.61078*EXP((17.269*Td)/(Td +237.3))*(Td-Tw)
Ed = 0.61078*EXP((17.269 * 40)/(40+237.3))*(40-30)
Ed = 73.7416 milli bars
Ea = Ew-0.63*(Td-Tw)
Ea = 42.4262 - 0.63*(40-30)
Ea = 36.1262 milli bars
RH = (Ea/Ed)*100
RH = (36.1262/73.7416)*100
RH = 48.99 %
*/ End of Theory
DAQ support Virtual Math channels
5 Math channels are required to calculate one RH.
Td = AI1, analog input for dry bulb temperature (PT100)
57
Tw =AI2, analog input for wet bulb temperature (PT100)
Math1 = EXP((17.269*AI1)/(AI1+237.3))
Math2 = Ed1 = 0.61078*Math1*(AI1-AI2)
Math3 = EXP((17.269*AI2)/(AI2+237.3))
Math4 = Ew1 = 0.61078*Math3*(AI1-AI2)
Ea = Ew - 0.63 * (Td - Tw)
Math5= RH1 = ((Math4-0.63*(AI1-AI2))/Math2)*100
Now, in Math5, you will get Relative humidity in %
Five events are supported for every Math channel and two jobs are available in every
event same as Analog input channel.
Math channels are virtual channels. It contains measured value based on the equations.
These values can be recorded similar to physically connected Analog inputs and display
digital values, trends, bar graphs etc.
4.6.8 Add third party device
In Real time viewer, click on Icon Configuration data icon
Now, click on “Add” button
58
Select “Linear” as shown above, then following screen will open
Enter all the required settings, specially address, register type, conversions etc..
59
Then, click “OK”, click at Save icon
and return icon
. If there is good
communication, tag will be added and shows Real time data. If there is data mismatch,
then, check Engineering and Raw settings Low and High and configure them properly
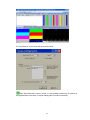
4.7 Display Configuration
In Real time viewer, click on Icon Configuration data icon
Click on
icon for display configuration
Maximum 200 display pages available for user configuration. In each page, maximum 24
tags are allowed per page
Mode: This is for page enable or disable.
60
Page Marks: This is the name for specific page. Ex: Section Kiln. Maximum 38
characters are allowed
Speed: This is real time trend display resolution. Select one of the options in 1 sec/dot, 2
sec/dot, 5 sec/dot, 10 sec/dot, 20 sec/dot, 30 sec/dot, 1 min/dot, 5 min/dot, 10 min/dot, 10
min/page, 30 min/page, 1 hr/page, 2 hrs/page, 4 hrs/page, 8 hrs/page, day/page and
week/page
If you wish to see both Real time and historical combined, then, select say day/page at the
display. Then, the Real time trend in screen will be for the last 24 hrs update dynamically
Direction: Selects the trend direction horizontal or vertical.
Background: Defines the background color of Trend mode in black or white
Pen: Defines a specific channel as a drawing pen, its color, width, Display Hi and Display
Low.
Channel: Selects a specific analog input AI or Mathematics Math, or selects Disable if a
specific channel is not required.
Color: Selects the color for each pen.
Width: Selects the width of trend, 1-thin, 2-medium, 3-wide.
Low: Defines the low scale for a pen on the display.
High: Defines the high scale for a pen on the display.
Forward / backward button: It is to navigate to next/earlier 8 sets of pens for display
configuration
4.8 Tools Configuration
In Real time viewer, click on Icon Configuration data icon
Click on
icon for Tools configuration
4.8.1 Timers
61
Maximum 100 timers available for configuration (Till DAQ 1.10, total timers are 50 only).
Timers increased from DAQ V1.2 onwards
Type: Countdown, Repeat Countdown, Daily, Weekly or Monthly.
Countdown: Defines the interval of time, e.g. days, hours, minutes and seconds. (Not
Real Time clock)
Repeat Countdown: Repeats the previous countdown.
Daily, Weekly or Monthly: The timer works in selected interval of Real Time clock
Action: Disables or enables the timer.
Job1, Job2: various jobs as described in 3.6.2, 2 jobs for each timer.
4.8.1.1 Timer Example
Switch on water pump every day at 8.00 hrs and switch off at 10.00 hrs
This application requires to Daily type timer which works with Real Time Clock.
Configuration settings are as follows.
Timer1
Type: Daily
Action: Enable
Time – Hour: 8
Min: 0 Sec: 0
Job1: DO Latch On, Target: DO1
Job2: No Action
Timer2
Type: Daily
Action: Enable
62
Time – Hour: 10
Min: 0 Sec: 0
Job1: DO Latch Off, Target: DO1
Job2: No Action
4.8.2 Counters
In Real time viewer, click on Icon Configuration data icon
Click on
icon for Tools configuration and then click on “Counter” tab
Maximum 100 timers available for configuration (From DAQ 1.2 onwards)
63
Name: Defines the name of counter.
Desc: Defines the description for a specific counter on the display.
Unit: Defines the unit of counter
Preset: Defines the preset value for the counter. The counter starts from a preset value.
Event: Defines the type, set point, Job1 or Job2.
Type: Select one of three options: None, Process Hi, Process Low
Set point: Defines the set point of process value to trigger the counter.
Job1, Job2: various jobs as described in 3.6.2, 2 jobs for each counter
4.8.2.1 Counter Example
Supervisor wants to know the number of occurrence of an event in a day say pressure
switch signal high
Digital input1 is used for Pressure switch. High signal indicates High pressure, Low signal
indicates normal pressure
Digital Input1
Event1:
Type: H
Job1: Inc Counter, Target: Counter1
Timer1
Type: Daily
Action: Enable
64
Time – Hour: 23
Job1: Log Report
Job2: Reset Counter
Min: 59
Sec: 59
Target: Counter1
Target: Counter1
(Reset Counter1 historical data in order to log new data for the next day)
If values meet the following conditions, DAQ will change notation from traditional to
scientific
the value is more than 10^5 or less than 1/(10^5)
the value digit-length in display exceeds the allowed range
Ex: Up to 5 digits, counter displays value directly Say 0-99999.
100000 will be shown as 1E5 that means 5 zero’s after 1
4294967295 will be shown as 4.29497E9 etc.
4.8.3 Totalizers
In Real time viewer, click on Icon Configuration data icon
Click on
icon for Tools configuration and then click on “Totalizer” tab
Maximum 50 Totalizers available for configuration
Name: Defines the name of the totalizer.
Desc: Defines the description for a specific totalizer on the display.
Source: Select a specific analog input or Math input to be used for totalizing.
65
Action: Disables or enables the totalizer.
Decimal: Defines the decimal point for the totalizer.
Period: Selects second, minute or hour used for the totalizer.
Unit: Defines the unit of totalizing
Preset: Defines the preset value for the totalizer. The totalizer starts from a preset value.
Low Cut: If Source channel has below this setting, then value is skipped from Totalizing
Event: Defines the type, set point, Job1 or Job2.
Type: Select one of three options: None, Process Hi, Process Low
Set point: Defines the set point of process value to trigger the totalizer.
Job1, Job2: various jobs as described in 3.6.2, 2 jobs for each totalizer.
4.8.3.1 Totalizer Example
Water flow rate is in M3/Sec. Supervisor want to know about total water discharged and
want this information daily, weekly and monthly reports
Totalizer1
Source: AI1
Action: Enable
Decimal: 1
Period: Sec
Unit: Cub.Mtr
Preset: 0.0
Timer1
Type: Daily
Time – Hour: 23
Job1: Log Report
Job2: Reset Totalizer
Action: Enable
Min: 59
Sec: 59
Target: Totalizer1
Target: Totalizer1
Reset Totalizer1 historical data in order to log new data for the next day
4.9 Comments
In Real time viewer, click on Icon Configuration data icon
66
Click on
icon for Comments configuration
100 messages available for display of customized alarms
Maximum 50 characters are allowed in each message and these comments can be
assigned as Job function “Log message” in events at the Analog/Digital/Math channel
configuration
Ex: Message1 = Tank TK101 level High
67
4.10 Project Auto configure
In Real time viewer, click on Icon Configuration data icon
Click on
icon for “Project auto configure”
If RS232 is selected in the Bank, then if all the IO modules are connected in RS485
network, then it is possible to acquire data base of all the IO modules specifying start and
end address of IO modules using Project auto configure function
68
Device type: Select IO card for addition of IO modules into network
Bank: Select bank from 1 to 4 as per bank configuration
Auto-update: Select if it is required to acquire data base of IO modules and give tag
name for the channels automatically
From: Start address of IO module
To: End address of IO module
Click on “OK” to add all the IO modules into network configuration
If Ethernet is selected in the Bank, then it requires IP address of the Gateway and address
of each of the IO module to add new IO module each time.
Note: Provision is not available to enter range of IO modules like RS232/RS485
69
Device type: Select IO card for addition of IO modules into network
Bank: Select bank from 1 to 4 as per bank configuration
IP address: IP address of the gateway say PC-E converter. May be all the IO modules
are connected to PC-E via RS485
Device Node address: Address of slave device to be added to network
4.11 Option
In Real time viewer, click on Icon Configuration data icon
Click on
icon to configure options
4.11.1 Share
In Real time viewer, click on Icon Configuration data icon
70
Click on
icon to configure options, then select “Share” tab
Share/do not share options are available for user selection. If share option is selected,
then historical data available in the computer can be shared from other computers. On
selection of this share data, shared folder will be created and following message will be
shown
For example, you have some Modbus slaves like IO module, recorder etc. and wish to
analyze historical data at different computer. While opening project in the second
computer, directly link to the project file available under C:\Data Acquisition Studio through
network configuration. This will minimize the data transfer between Modbus slaves and the
computers and make it more efficient by using available resources through network
configurations.
4.11.2 Email
This is to send email on an event like alarm
In Real time viewer, click on Icon Configuration data icon
Click on
icon to configure options, then select “Email” tab
71
The default Port number 25 is used to send email from STMP server. If your network
administrator configured different port in your LAN for accessing internet/email, then you
have to modify the port number accordingly.
To send an email for any event, the procedure is as follows.
Set SMTP server details as below. Please contact system or network administrator for the
server details if your computer is connected in LAN.
Host, Port, User name, From: Sender email address
To: Receiver email address (Max.10 email addresses can be selected)
In case, email is successful, it delivers as follows
Type:
Source:
ActiveTime:
05/08/09,
Value:
Comment:
------------------------------------------------------------------------------------------
HiAlarm
Tag1
13:31:04
50
Levelhigh
If Email is failed to deliver, then it prompts the following error message. In this case, it
requires checking all the email settings
72
4.11.3 Communication
In Real time viewer, click on Icon Configuration data icon
Click on
icon to configure options, then select “Communication” tab
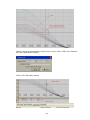
Sampling rate: It is used to set data display time for Real-Time Viewer. User can select
one from the following for real time monitoring.
Time out: This is time set for generating time out errors related to real time viewer
communication.
For example, if IO modules and PC with data acquisition software are located at different
places connected through Ethernet across different gateways, and then user can adjust
sampling rate and time out settings to avoid errors in communication. When real time
viewer is running, please observe the following taskbar at the bottom side of the screen.
Here, scan time should always be less than sampling rate. Other wise, communication
errors will occur. If PC and Modbus slave devices are connected by long distance network,
then there might be chances that scan time gets increased. So check this and set
sampling-rate more than scan time. Also user can set time out settings to generate
communication failure errors. Maximum time out settings possible is 60 sec.
For example, scan time is adjusted and time out setting = 30 sec. This means, if scan time
is more than sampling rate for more than 30 sec, then communication errors will be
generated.
73
4.11.4 Auto-Page
In Real time viewer, click on Icon Configuration data icon
Click on
icon to configure options, then select “Auto-Page” tab
This function is to rotate pages at set time interval
Action: Enable, Disable options are available
Interval: This is time interval and max. 60 sec. is possible
If this option is enabled and time is set, then, display pages in Real Time Viewer will be
rotated cyclically as per set time
4.12 Print Configuration
It is possible to print channel configuration, Display configuration, Tools (Timers, Counter,
and Totalizers) configuration and comments setup
Select the required and then click on Print icon
For Counters and Totalizers, maximum 4 channels can be printed at one command.
Select the starting counter number say 1, then you can print configuration of Counter 1 to
Counter4. If you select Counter 3, then you can print configuration of Counter 3 to Counter
7
74
Save:
this is to save report configuration. Format of files is Rave snap shot (.ndr). You
may download any .ndr viewer from internet
Print:
Exit
this is to take print out of selected configuration file
this is to exit print viewer
75
4.13 Backup
4.13.1 Project and Data backup
By default, project configuration and data files will be stored at the path
C:\Data Acquisition Studio\RealTime\XXX
Where XXX is project name
If you need to store data in another drive, then it has to be selected during installation of
data acquisition software
76
For ex: Name of Project: BottlingPlant
Then, when you create a new project, the following files will be created
Take BACKUP of C:\Data Acquisition Studio\RealTime regularly and store in safe place.
4.13.2 Restoring Project with Data
Install Data acquisition software
Copy Realtime folder to C:\Data Acquisition Studio
Open the project from data acquisition software
Start-Programs-RealTime viewer
77
4.13.3 Sending Project files
In case of any problems in configuration, if you wish to send project files, zip RealTime
folder available at C:\Data Acquisition Studio except data files and send it to us
If project is running for few days, then RealTime folder may become big size with
large storage data. If it is more data, it is difficult to send project files with data by Email.
So, before sending project configuration files, you may need to take out large data files
first and then send only configuration files. You may first copy total RealTime folder to
your desktop, and then remove the data files from RealTime folder at your desktop such
that it will contain only configuration files. Then, zip Realtime folder and send it to us
78
5. Real Time Viewer
It is to view Real time data from slave devices in PC. USB license key is required to run
DAQ in PC for more than 1 hr.
Select page (Choice)
New project or close existing project
Open existing project
Configuration data
Display measured data (Historical).
When Real time viewer is running in PC, it stores data in PC at path C:\Program files\DAQ
Studio\Real time\Project.daq. Icon
is used to archive this historical data. This is similar
to historical data stored at devices like Recorders, HMI etc. but not exactly same
Arrange all (Show default screen layout-mix-digital values, bar graph, trends, Alarm
page)
Display Events/Alarms list
Display Digital Values
Display Bar graph
Display Trend
Display all channel - Digital
Check status of Counters, Digital inputs, Digital Outputs etc.
To setup Paperless Recorder
Parameters operate for Controllers. Please check section “Create a new project for
Controllers” for more information about this
79
5.1 Opening project
If it is a new project, refer earlier section and create a new project. If it is existing project,
open the project by selecting appropriate path
If communication is established between PC and Modbus Slave devices over the selected
bank, then after opening Real time viewer. By default the following screen will appear
which shows all the components like Events/Alarm list, Bar graphs, Digital values and
Trends
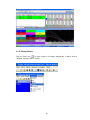
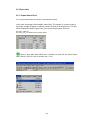
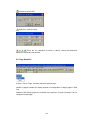
5.1.1 Display Arrange All
icon to display Digital values, trends, bar graph & events/alarm list in one
Click on
screen. Each of the above will be shown in separate windows, alternatively, in Menu click
on “Window” and then click on ‘Arrange All”
80
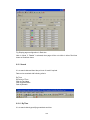
5.1.2 Display Events
Click on Event Icon
to show events in full page, alternatively, in Menu click on
“Window” and then click on “Event”
81
It displays the Ack (acknowledgement), Type, Source, Active time, Clear time and Value
of events or alarms. Use scroll bar to move downward or upward. Press Ack button to
acknowledge the alarm. Events do not need to be acknowledged.
On the Event / Alarm List, three different colors indicate the status of the alarm.
Red - Presently in alarm status
Green – The cause of alarm status was temporary, and has now
returned
To normal
Grey – A temporary alarm (in green status), after having been
Acknowledged, and then becomes grey.
Active Time is the time that alarm status becomes active. Clear Time is the time when
two conditions are met. Firstly alarm status is cleared and becomes normal, and secondly
the user has acknowledged it. If any alarm occurs, the red buzzer icon on the top right
starts to flash. After the cause of alarm is no longer met and the alarm is acknowledged,
then the red buzzer icon disappears. When Clear Time shows Terminated this indicates
that turning off the power has terminated the alarm.
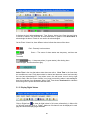
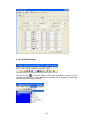
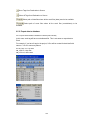
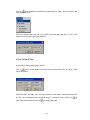
5.1.3 Display Digital Values
Click on Digital Icon
to show all digital values in full screen, alternatively, in Menu click
on “Window” and then click on “Digital”. Maximum 24 channels can be displayed in each
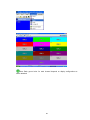
page and total 200 display pages available
82
Note: Back ground color for each channel depends on display configuration as
shown attached
83
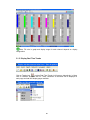
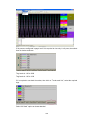
5.1.4 Display Bar Graphs
Click on Bar Icon
to show Bar graphs in full screen, alternatively, in Menu click on
“Window” and then click on “Bar”. Maximum 24 channels can be displayed in each page
and total 200 display pages available
84
Note: Fill color in graph and display range for each channel depends on display
configuration
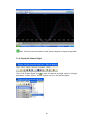
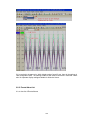
5.1.5 Display Real Time Trends
Click on Trends Icon
to show Real Time Trends in full screen, alternatively, in Menu
click on “Window” and then click on “Trend”. Maximum 24 channels can be displayed in
each page and total 200 display pages available
85
Note: Trend color and trend width for each channel depends on display configuration
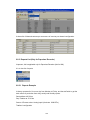
5.1.6 Display All Channel Digital
Click on All Channel Digital Icon
to show all channels as digital values in full page,
alternatively, in Menu click on “Window” and then click on “All Channels Digital”
86
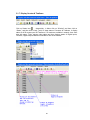
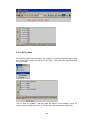
5.1.7 Display Counter & Totalizers
Click on Status Icon
, alternatively, in Menu click on “Window” and then click on
“Status”, and then click on tab “Tools” to show status of Counters & Totalizers. It display
status of all 50 counters and 50 Totalizers. If IO cards are available in network, then other
tabs with name “Tools” appear under status and they displays status of Digital Inputs,
Counters, Digital Outputs based on selected IO card in the network
87
If you wish to see Counter and Totalizer value as channels in main pages, then they can
be selected in Math channel and then select specific Math channel in Display pages
configuration as shown attached
88
5.2 Data dynamic Exchange (DDE)
Dynamic Data Exchange (DDE) is a standard inter-application communication protocol
built into Microsoft Windows operating systems and supported by many applications that
run under Windows. DDE takes data from one application and gives it to another
application. It allows Windows programs that support DDE to exchange data between
themselves.
Data from DAQ software can be exchanged with Excel on DDE link.
After completion of all network configuration (adding of all Modbus slaves), then open
Data acquisition studio software from start – programs – Data acquisition studio – Realtime viewer
Project – create DDE link in excel
89
Specify the path and file name as follows.
By default the file name will start with DDE and the project name with underscore. Save
the file name in PC at selected path as above to proceed further.
For example, if desk top is selected in the path, then excel file should be available in the
desk top. If the MS Office is not installed in the PC, then you cannot open the excel file
created as above procedure. Please contact your system administrator to install MS office
software in the PC. Now try to open the file from the desk top created for using DDE
application with the recorder through Observer software.
Click on update to activate DDE between DAQ software and Excel application. If the DDE
is successful, then real time data of the channels should be updated in excel file as shown
in sample screen.
DDE expression format to get real time data from the Observer software is as follows.
=RealTime_Viewer|TagService!_TagN
Where N = 1,2,3…..
Application = RealTime_Viewer
Topic = Tag Service
90
Tag name = _Tag1 (Please observe underscore before the tag number)
It is possible to exchange data related to AI, DI, DO, Counters and Totalizers between
DAQ software and third party applications running under windows operating systems via
DDE.
Procedure to find the tag number for the tag name to use in DDE applications
Create DDE link from Real time viewer.
Open Excel file.
Three columns appear in the excel file as Name, Unit and Value as shown in the Excel
file.
Name: This is tag name actually defined in the channel configuration
Unit: This is unit for the tag name defined in the channel configuration
Value: This is the specific cell where, process value for the tag will appear in real time.
To find the DDE format for any tag in channel configuration, for a specific tag, double click
at “Value” column for the corresponding tag defined at Name. For ex: For Name= Tag1 is
at R2C1, double click at cell R2C3 to see DDE format for Tag1. Click on Esc button at the
key board to see process value at the cell from displaying DDE format.
If any “Error” appears in any cell at excel, possible reasons is no data available at selected
tag. Check the channel configuration and make sure value is available
If any “NAME” text appears in the excel file, it indicates that particular tag is not configured
properly. Tag name may not available at DAQ software.
91
Note: If Excel file is not opening from the selected path, then check the following
1. RAM size in the PC is very less. Restart the computer and then create
the DDE link once again and open the Excel file.
2. Increase virtual memory in the PC. Please contact system administrator
to check the virtual memory settings at the PC.
My computer-properties-advanced-performance settings –advancedvirtual memory.
DDE with third party applications
Once the data is available at Excel at particular cell, then data can be exchanged with the
third party applications like PLC, SCADA, and Visual Basic etc. If data is to be exchanged
with PLC, then PLC programmer can write Visual basic macro in Excel from the following
link
Excel – Tools – macro
For the source code examples, PLC programmer may check the PLC manuals for DDE
sample macros. It is also possible to exchange data from recorder to SCADA applications
through DDE.
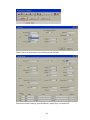
Example 1
DDE link between Allen-Bradley SLC 5/03 PLC and Excel
Task: Write a block of data (10 floating points) from Excel to PLC.
Name of the Excel file = Reports.XLS
Data Source: D 37 to D 46, data in total 10 cells
Target= PLC, Starting address= F8
User RSLinx to configure PLC and DDE link
DDE topic name in RSLinx= DDE_REPORTS
Sub Block_Write()
'open dde link: testsol=DDE Topic This is comment only
RSIchan = DDEInitiate("RSLinx", "DDE_REPORTS")
'write data thru channel This is comment only
DDEPoke RSIchan, "F8:2,L10", Range("[Reports.XLS]sheet1!D37:D46")
'close dde link This is comment only
DDETerminate (RSIchan)
End Sub
92
Example 2
DDE link between Allen-Bradley SLC 5/03 PLC and Excel
Task: Read a block of data (5 integers) from PLC to excel
Name of the Excel file = Reports.XLS
Data Source: PLC, Starting address= N7:30
Target cells in Excel= A7 to A11
User RSLinx to configure PLC and DDE link
DDE topic name in RSLinx= DDE_REPORTS
Sub Block_Read()
'open dde link: testsol=DDE Topic This is comment only
RSIchan = DDEInitiate("RSLinx", "DDE_REPORTS")
'get data and store in data variable This is comment only
data = DDERequest(RSIchan, "N7:30,L5,C1")
'Paste data into selected range This is comment only
Range("[Reports.XLS]Sheet1!A7:A11").Value = data
'close dde link This is comment only
DDETerminate (RSIchan)
End Sub
Example 3
DDE between DAQ software and SCADA (Allen-Bradley RSVIEW32)
When the Real time viewer in DAQ is working well in PC, then the tag data from DAQ
software will be available in the expression format as follows
=RealTime_Viewer|TagService!_Tag1
Application = RealTime_Viewer
Topic = Tag Service
Tag name = _Tag1 (Please observe underscore before the tag number)
The above tag information can be directly configured in SCADA to enable DDE between
DAQ software and RSVIEW 32 SCADA. There is no need to configure any thing at
RSLinx.
Procedure for configuration
1) Open SCADA project
2) System – Node – Select DDE server as data source
3) Name = DAQ (No gaps )
93
4) Application = RealTime_Viewer
5) Topic = Tag Service
6) Check enable in the box. (This node should be selected)
7) Now open the data base
8) Create analog tag with all the details similar to the tag at the DAQ.
9) Select DAQ at the NODE
10) Write the tag address. For ex: analog input 1, AI1 should be written as _Tag1.
Please check up excel file for the tag number corresponding to the tag name
defined in the DAQ configuration. Please note that underscore is required
before the tag number other wise, data will not be exchanged.
11) Now open the tag monitor and configure for the above tag for checking of DDE
with the tag.
If DDE is configured properly, then tag value should appear correctly at the tag monitor
with state as “VALID”. If any error message is available, then you have to repeat from step
1. Please note that before checking tag monitor, Real time viewer in PC should be in
running condition.
Using DDE, in Excel, it is possible to read status of Math channels, Analog Inputs,
Analog Outputs, Digital Inputs, Digital Outputs, Temperature from RTD and Thermocouple
type of IO cards, Counter values etc.,
In Excel, for Analog input/RTD/TC IO module at value, if it show “Error”, it means, no
data available in specific channel.
For Digital Input, 0 indicates bit is low, 1 indicates bit is high.
For Digital output, “Empty” indicates no digital output, 1 indicates output is available
94
6. Historical Viewer
It is a PC based tool to view historical data and historical alarms from HMI & Paperless
Recorder.
If you select “Historical viewer” during installation of DAQ software or HMI software, then,
historical viewer installed in PC and it can be opened as shown below
By default, historical data from devices after import will be stored at path C:\Program
files\Historical viewer\Historical/Project.daq
6.1 Human machine interface (HMI)
6.1.1 Preparation of historical data storage in HMI
Procedure
1. Configure data logging, insert historical trend object in HMI, complete configuration of
pens, download application to HMI and make sure historical data is showing properly
in historical trend at run time.
2. Configure alarms, insert historical alarm box in HMI, download application to HMI and
check historical alarms. If required, refresh alarms in Run time using Button linked with
95
“Update Historical” function and make sure historical alarms showing properly in
historical alarm box in Run time
3. Historical data and alarms are stored in internal memory/SD card as per data storage
path defined at Project explorer-Setting-Runtime-Internal storage
4. Once data logging is configured in HMI, in Run time, historical data will be stored in
HMI internal memory or SD card as per configuration. Once alarms are configured
properly in HMI and they appear in run time, historical alarms will be stored in HMI
internal memory or SD card as per configuration. These historical alarms and historical
data can be archived in PC later using historical viewer software.
5. Historical data and alarms can be dumped from Internal memory/SD card to USB stick
or directly transfer from HMI to PC via Ethernet using Historical viewer software.
6.1.2 HMI data archive in PC using storage device (USB stick)
1.
First make sure data logging and historical trend is configured properly in HMI and
they are running fine in Run time. Create a button in HMI screen. Link with a function
– “Dump Alarms and Data”
2.
Check contents in USB stick. Make sure it is empty at first time and no invalid files
are available in USB stick.
3.
Insert USB stick in USB port of HMI
96
4.
In Run time, check if historical data is showing properly or not in historical trend. If
required, press “Zoom” and verify the presence of data.
5.
Press on “Dump” button. Then, it transfers historical data and alarms from Internal
memory/SD card to USB stick
6.
Now, remove USB stick from HMI. Insert USB stick in PC and check its contents. It
should have files similar to the following
7.
Make sure Historical viewer software installed in PC. Double click on “Historical
viewer” icon
8.
available at desktop
Select HMI and click “OK”
97
9.
Enter the Project name. Select “Storage media”, click at open folder icon
path for the USB stick. Then, click “OK”
10.
Click “Yes”.
11.
All data log tags will be shown here. Enter the unit and select the number of decimal points
98
and select the
12.
Click “Save” icon
. Then, click Return icon
13.
Click “Yes’ to save project configuration in PC
14.
Click “Yes” to import historical data and alarms from USB stick to PC
15.
Click “Yes” to delete data and alarms from USB stick. Click “No”, if you wishes to
remain historical data and alarms in USB stick after transferring to PC
99
to return to main program
16.
Now, you can view historical data trend in PC
6.1.3 HMI data archive in PC via Ethernet
1.
First make sure data logging and historical trend is configured properly in HMI and
they are running fine in Run time.
2.
In Run time, check if historical data is showing properly or not in historical trend. If
required, press “Zoom” and verify the presence of data.
3.
Check IP address of HMI using System information at Control centre at HMI startup.
For example, it is 192.168.0.203
4.
If HMI is connected to PC directly, then, use cross over Ethernet cable. If HMI is
connected to PC via LAN, then, use straight cable
100
5.
At Dos prompt, using “Ping” instruction, check if communication is OK between HMI
and PC. If it is OK, then, you should get reply as follows. If there is no reply, then,
check Ethernet cable and IP address of HMI
6.
Make sure Historical viewer software installed in PC. Double click on “Historical
viewer” icon
available at desktop
101
7.
Select HMI and click “OK”
8.
Enter the Project name. Select “Ethernet”, click at open folder icon
of HMI. Then, click “OK”
102
and Enter IP address
9.
Click “Yes”.
10.
If security level is configured for historical viewer, then, it needs to enter user name and
password
103
11.
All data log tags will be shown here. Enter the unit and select the number of decimal points
12.
Click “Save” icon
13.
Click “Yes’ to save project configuration in PC
14.
Click “Yes” to import historical data and alarms from USB stick to PC
. Then, click Return icon
104
to return to main program
15.
Click “Yes” to delete data and alarms from USB stick. Click “No”, if you wishes to
remain historical data and alarms in USB stick after transferring to PC
16.
Now, you can view historical data trend in PC
17.
If security is configured for Historical viewer, then, after seeing the data, if you wishes to close
the historical viewer or log out, then, it prompts to digitally sign the record by entering user
name and password. Then only, it is possible to exit from historical viewer
105
6.2 Paperless Recorder
6.2.1 Paperless data archive in PC using storage device (CF card)
1.
Check contents in CF card. Make sure it is empty at first time and no invalid files are
available in CF card.
2.
Insert CF card in Paperless Recorder. Check icons on Top Right side of the
Recorder. CF should show 99% empty. If CF card is not inserted properly, then, it
shows with Red color mark on CF icon
3.
First time, press on “Config” key. Then, press on “Save” key.
It display message “Do you want to save configuration o storage media?
Press “Yes” key. Then press “Back” key to return to main menu
Now, if you check contents in CF card, you should have the following files
These two files are important to create a new project in PC.
Note: If you wish to send us configuration files to check your configuration, you need
to send these two files back to factory
4.
In Recorder, Press on “Dump” button.
Do you want to dump historical data and event list to storage media?
Press on “Yes” key
Then, it transfers historical data and alarms from internal memory to CF card
5.
Now, remove CF card from Paperless Recorder. Insert CF card in a CF reader, plug
in to PC and check its contents. It should have files similar to the following
106
6.
Make sure DAQ or Historical viewer software installed in PC. Double click on
“Historical viewer” icon
7.
available at desktop
Select Recorder and click “OK”
107
8.
Enter the Project name. Select “Storage media”, click at open folder icon
select the path for the CF card. Then, click “OK”
and
Click “Yes” to receive configuration from CF card to PC. Then, click “Save” icon
to save configuration in PC. Then, click “Close”
If IO.dat and Recorder.cfg files are not available in CF card, then, you
cannot complete this step
108
9.
Click “Yes” to import historical data from CF card to PC
10.
Click “Yes” to delete historical data and alarms from CF card. Click “No”, if you
wishes to remain historical data and alarms in CF card after transferring to PC
11.
Now, you can view historical data trend in PC
6.2.2 Paperless data archive in PC via Ethernet
1.
Check IP address of Paperless Recorder. Press “Config” key, select “System info”,
press “Enter” key. Note down IP address of Recorder. For example, it is
192.168.0.203
2.
If Paperless Recorder connected to PC directly, then, use cross over Ethernet cable.
If Paperless Recorder connected to PC via LAN, then, use straight cable
109
3.
At Dos prompt, using “Ping” instruction, check if communication is OK between
Paperless Recorder and PC. If it is OK, then, you should get reply as follows. If there
is no reply, then, check Ethernet cable and IP address of Paperless Recorder
4.
Make sure DAQ/Historical viewer software installed in PC. Double click on “Historical
viewer” icon
Historical viewer
available at desktop. Alternatively, click at Start-Programs-
110
5.
Select Recorder and click “OK”
6.
Enter the Project name. Select “Ethernet”, click at open folder icon
address of Paperless Recorder. Then, click “OK”
111
and Enter IP
7.
Click “Yes” to receive configuration from Recorder to PC
8.
If CFR21 is selected in Paperless Recorder, then, it needs to enter user name and
password
9.
Click “OK” to receive configuration from Recorder to PC. Then, click “Save” icon
to save configuration in PC. Then, click “Close”
112
10.
Click “Yes’ to save project configuration in PC
11.
Click “Yes” to import historical data and alarms from Recorder to PC
12.
Now, you can view historical data trend in PC
13.
If CFR21 is configured in Paperless Recorder, then, after seeing the data, if you wishes to
close the historical viewer or log out, then, it prompts to digitally sign the record by entering
user name and password. Then only, it is possible to exit from historical viewer
113
6.3 Tools
6.3.1 Tool Bar
To open new project
To open existing project file
Print
Display trend
Display Events and alarm list
Display Report
Display values list
Export data into excel
Copy curves to clipboard
Remark, write a comment
Search by specific time
Search by a period of time
114
Fast back ward for data monitoring
Backward
Forward
Fast forward
Zoom out
Zoom in
Zoom all
Zoom by time
Zoom by value
Navigate to next page
Close historical viewer and return to Main program
Black background
White background
Show graphical representation horizontally
Show graphical representation vertically
6.3.2 Menu Bar
115
Import: Import historical data from device to PC
Export data to Excel: To export data to excel
Clear: To clear the clipboard
Copy: To copy the current screen image to clipboard.
Remark: To enter custom comments by user
Import Option: To refresh historical data as per set time interval
Zoom: Various options available for selection as shown above
Horizontally: To view historical trend horizontally in screen
116
Vertically: To view historical trend vertically in screen
Black background: To set black back ground for historical trend
White background: To set white background for historical trend
Page: To select the page
Search: To search historical data by various options
6.4 Import and export options
117
6.4.1 Manually
This is default selection. It is used to import historical data and alarms manually from
device to PC. This function is same as click at icon
Data will be imported from devices like Recorder, HMI etc. to PC and update proprietary
database. All database format is proprietary for data security reasons
6.4.2 Automatically
Select this option and select period between 1 to 24 hrs. to automatically import historical
data and alarms from device to PC. Automatic works only when device is connected to PC
via Ethernet
118
For ex: If this option is selected, then, data will be imported automatically from devices like
Recorder, HMI etc. to PC and update proprietary database. All database format is
proprietary for data security reasons
6.4.3 Automatically and export to Excel
Select this option if you wish to import historical data and alarms from device to PC and
export to CSV files automatically with preset time interval from 1 to 24 hrs. Remember,
the new export will overwrite earlier Excel files. This feature will be useful if you wish to
import historical data to other databases. It is required to develop custom applications in
third party software to import data from these files and then clear these files if possible.
6.4.4 Automatically and export to database format
Select this option if you wish to import historical data and alarms from device to PC and
export to selected format automatically with preset time interval from 1 to 24 hrs.
Remember, the new export will overwrite earlier files.
File export attributes
Single file for tags
Each Tag will have one dedicated file.
Multitude
If this option is selected, then, a folder will be created for each 24 hrs and each
Tag will have one dedicated file. Ex: Folder name: 201129, year 2011, month = 2,
date = 9
119
6.5 Export data
6.5.1 Export data to Excel
It is to export historical data to Excel files in selected path manually
In this case, all the tags will be located in same file(s). For example, if you have 2 tags in
the project, all tags will appear in different columns in Excel file as shown below. Two files
will be created with names Project name_Pen.csv and Project name_Event.csv
Ex: Test1_Event.csv
Ex: Test1_Pen_csv, Where Test1 is project name
If there is large data, after 65535 rows, it creates new excel file with name Project
name (Part X), where X is the file number say 1, 2 etc.
120
Range
The display: Select this option if it is required to export data specific to display screen
(current view).
Time Period: Select this option and enter start data, end date, start time and end time.
This is to select historical data with specific time period and then export to excel
All: Select this option if all the historical data needs to export to excel files.
Speed: This is to select resolution for data archival.
100 msec/dot, 1 sec/dot, 2 sec/dot, 5 sec/dot, 10 sec/dot, 20 sec/dot, 30 sec/dot, 1
min/dot, 2 min/dot, 5 min/dot, 10 min/dot, 30 min/dot, 10 min/page, 30 min/page, 1
hr/page, 2 hrs/page, 4 hrs/page, 8 hrs/page, day/page, week/page and month/page
For example: If 1 sec/dot selected, then you can archive data once in a second.
If 1 min/dot selected, then you can archive data once in 1 min
Source List: Tags available for selection for data export
Destination List: Tags already selected for data export
Move Tag from source to Destination
Move all Tags from Source to Destination
121
Move Tags from Destination to Source
Move all Tags from Destination to Source
Select path of data files where all the excel files (data) need to be available.
Select path of event files where all the excel files (event/alarms) to be
available.
6.5.2 Export data to database
It is to export historical data to database in selected path manually
In this case, each tag will have one dedicated file. This is not same as export data to
Excel.
For example, if you have 2 tags in the project, 2 files will be created for data itself with
names + 1 file for events say alarms
Ex: DB_Tag1.csv, Tag1 data
DB_Tag2.csv, Tag2 data
DB_Event.csv, alarms data
122
All descriptions are same as in earlier section.
Export format: Currently Microsoft Text (*.CSV) is supported.
These files can be opened from Notepad also and they appear as follows
Select Files of type = “All files” and then, select the path where files are located
123
6.5.3 Export data automatically
If you wish to import data from device to PC first and export data automatically, then, select the
required options properly at section “Import options”
6.6 Remark
This is used to mark comment on data after verification. For example: supervisor checks
historical trend and may wishes to mark a comment say “Irregular” at specific date/time.
Maximum 40 characters are allowed in each remark.
In historical viewer, there is a pointer which moves around the trend for selecting the data.
Just use the mouse and left-single click on historical trend, then you can see pointer “+” as
shown attached.
124
Place the pointer at exact date/time required, then in menu, click on “Edit”, then “Remark”
and now, it prompts the following.
Click on “OK” after writing remark
125
Later, it is possible to search data with respect to above remark by any one of the
following ways.
Click on Remark icon
In Menu, click on “Search”, then select “Remark”
Alternatively, near the task bar at bottom area of the screen, click on “Seek by Remark”
Then, it will show list of Remarks available in a window. Just double click on selected
Remark and pointer will navigate to specific remark number automatically at specific
date/time.
6.7 View
This is to display trend in monitor with various zoom rate.
Horizontally: To view historical trend horizontally in screen
Vertically: To view historical trend vertically in screen
Black background: To set black back ground for historical trend
White background: To set white background for historical trend
For example: Zoom 1 sec/dot
First check, monitor current display setting
If screen resolution is “1280 X 800” pixels, then you may be able to see data around 900
sec. at right side of the trend, it shows digital values and it occupies remaining pixels.
126
6.8 Display
6.8.1 Trend view
It is to view historical trend
127
If 24 pens are configured in page1 and if it is required to view only 1 to 8 pens, then select
them in window as shown.
Tag1 scale is -120 to 1000
Tag2 scale is -120 to 1100
If it is required to see both the scales, then click on “Trend scale List”, select the required
tags.
Select “All Scale” option as shown attached
128
If it is required to change color, width, display scale of specific pen, then do the settings in
HMI configuration itself. The settings made at HMI shall be retrieved in historical viewer
also. No separate display settings available for Historical viewer.
6.8.2 Events/Alarm List
It is to view list of Events/Alarms
129
It shows list of Alarms/events as per occurrence of event as per channel configuration.
6.8.3 Reports List (Only for Paperless Recorder)
At present, this is applicable only for Paperless Recorder (Not for HMI)
It is to view list of reports
6.8.3.1 Reports Example
A factory operates for 8 hours a day from Monday to Friday, and the staff wish to get the
total volume of production from daily, weekly and monthly reports.
Start totalizer at 8.00 hrs
Stop Totalizer at 17.00 hrs
Source of Process value: Analog input1 (feed rate: 1000 M3/hr)
Totalizer1 configuration
130
Timer 1 Configuration
It require to Reset Totalizer at start of totalizing every day to begin recording of new data
again
Timer2 Configuration
131
When Log Report function is used, it memorize Totalizer data at specific time which will be
used later during reports archival as daily, weekly and monthly basis
Timer3 Configuration
Timer4 Configuration
132
Now, you can view various reports as follows
List: It lists all the Reports logged with in a day. For ex: three shifts in same day
Daily: Select Daily to list log report for total day. Use
navigate reports of other days
&
soft buttons to
Weekly: Select Weekly to list log report for current week (Sunday to Saturday). Use
&
soft buttons to navigate to earlier and next week
Monthly: Select Monthly to list log report for current month. Use
soft buttons to navigate to earlier and next months
For ex: 11 may, 2009, Monday, total feed rate is 1000 M3
133
&
12 may, 2009, Monday, total feed rate is 2000 M3
3
13 may, 2009, Monday, total feed rate is 3000 M
14 may, 2009, Monday, total feed rate is 4000 M3
15 may, 2009, Monday, total feed rate is 5000 M3
For the weekly report from May10 to May16, it shows 15000 M3
Ex: First week total is 10000 M3, second week total is 15000 M3, third week total is 10000
M3and fourth week total is 12000 M3, then in the monthly report, it will show a total of
47000 M3
6.8.4 Value List
It is to view data in tabular column
Various Zoom rates are available for selection
100 msec/dot, 1 sec/dot, 2 sec/dot, 5 sec/dot, 10 sec/dot, 20 sec/dot, 30 sec/dot, 1
min/dot, 2 min/dot, 5 min/dot, 10 min/dot, 30 min/dot, 10 min/page, 30 min/page, 1
hr/page, 2 hr/page, 4 hr/page, 8 hr/page, day/page, week/page and month/page
134
Search by specific time
Search by a period of time
These are for navigation of pointer in tabular column fast backward,
backward, forward and fast forward.
6.9 Page Selection
In Menu, click on “Page” and then select the required page.
Number of pages available for display depends on configuration of display pages in Real
time.
Maximum 200 display pages are available and maximum 24 pens (channels) can be
configured in each page.
135
Fig: Display pages configuration in Real time.
Note: In Mode, if “Disable” is selected, then page will be not visible in either Real time
viewer or Historical viewer.
6.10 Search
It is to search data and then take print out of trend if required.
Data can be searched with following criteria.
By Time
By Period of Time
Seek by Tag Name
Seek by Event/Alarm
Seek by Remark
6.10.1 By Time
It is to search data by specifying exact date and time
136
Click on
icon for search by specific time, alternatively, in Menu, click on “Search” and
then Select “By Time”.
Enter the required date and time of the data to be searched and click on “OK”, then
pointer in trend will go to specified date/time.
6.10.2 Period of Time
It is to search data specifying time interval
icon to search data by a period of time, alternatively, click on “Menu”, then
Click on
select “By period”.
Enter Start date, end date, start time and end time for the data to be searched and click
on “OK”, then it displays trend in specified range. To take print, click on Print icon
open Print viewer and then click on
for printing the trend
137
to
6.10.3 By Tag Name
It is to select specific trend for display. For example: You have configured 8 tags in page
no.1, to check tag1 clearly, you wish to see only trend1. Then, select this option and select
the required tag.
Click on “Seek by TagName”, and then select the required Tag to display in trend. If it
requires viewing display scale, click on “Trend scale list” and select the required tag.
138
6.10.4 By Alarm/Event
It is to view and point to data based on selected event.
Select the required event/Alarm, then double click on it. Then, pointer in the trend will
move to specific time at which event/Alarm is triggered.
6.10.5 By Remark
It is to view and point to data based on selected Remark.
139
All the list of Remarks will be shown in window at the bottom side of the screen as shown
above. Select the Remark and double click. Then, pointer in trend will go to data where
specific remark is marked earlier.
6.11 Print
It is to print Trends, Events/Alarms, Reports, Process Values etc.
First it requires to search the historical data as explained in earlier section and then click
on Print icon, it open Print preview first and then click Print icon again to take print out.
140
7. Frequently asked questions
1. What is the difference between Data acquisition studio and IO studio software?
IO Studio software is a tool used for configuration of IO module from PC and it is also
used for IO module diagnostics purpose. It is not for Real time Data logging and
archival. Real time viewer is for data logging and archival
2. What is the difference between Observer software, Communicator software and DAQ
software?
Observer software is used for Paperless Recorder
Communicator software is used for Temperature Controllers
DAQ software is used for IO modules, Paperless Recorders and Controllers
DAQ software is similar to Observer software but with additional features. Please
check section 1.3 for details information about features available with DAQ software
3. Can I open IO Studio and Real Time viewer at same time in PC?
No. First open IO studio software for configuration of IO module. Close IO studio
software and then open Real Time viewer
4. Can I open Observer software and DAQ software simultaneously in single PC?
No, it is not possible. It may conflict some of resources and it may generate some
error messages.
It is not required to run Observer software and Data acquisition software
simultaneously in same PC as Data acquisition software also covers paperless
Recorders and Controllers shortly along with IO modules. In this case, it just need to
uninstall Observer software and install data acquisition software
5. I want to run DAQ-Real time viewer in 3 different computers. Do I need to buy 3 nos.
hardware lock?
Yes. It is required to buy 3 nos. USB based hardware lock (Keypro). This is license to
use Data acquisition software in single PC. With out this hardware lock, data
acquisition software will run in demo mode for 1 hr
6. I have only COM port in PC, I don’t have USB port. How I can run DAQ software?
It requires another PC with USB port. Serial port based hardware lock is not available
7. I want to run Real Time viewer in single PC. I want to view historical data in other 2
computers in LAN. How many hardware locks I need to buy?
141
It requires purchase of single hardware lock for Real Time Viewer. It is not required to
have hardware lock (Keypro) to view historical data in another computers via LAN
8. Can I connect DAQ software to third party devices via Modbus?
Yes, it is possible
9. Can I connect Recorder/Controllers to DAQ software?
Yes, it is possible
10. Can I send email from DAQ software?
Yes, it is possible
11. I want to search data and then export data to excel. Is it possible?
Yes, it is possible
12. Can I display Real time trends, digital values, bar graphs using DAQ software?
Yes, it is possible
13. How many trends I can view in single page and how many display pages are
available?
24 pens/page and maximum 200 display pages
14. Can I exchange data from DAQ to another PC? How it is done?
Use Dynamic data exchange (DDE)
15. Can I switch on Digital Outputs from DAQ software?
If Digital Output cards like 8DIO, 4RO, 16DO is available in network, and then you will
be able to switch on digital outputs based on events
16. Can I include customized mimics into DAQ software?
No, it is not possible
17. Can I take print out of trends, digital values etc., from DAQ software?
Yes, it is possible
142
18. Can I write a formula for computation?
Yes, you can use Math channels and write formula
19. Do you have internal timers, counters, Totalizers etc., in DAQ software?
There are 100 timers, 50 counters and 50 Totalizers in DAQ software
20. I want to control the pump based on Real time clock. Is it possible in DAQ?
Yes, you can use Timer and select type as Daily and then configure start and stop
time
21. Can I configure Alarms in DAQ software?
Yes, it is possible
22. How many Tags supported in DAQ software?
Maximum 2048 including external and internal memory from DAQ 1.2 onwards
23. What is Tag?
It is a channel. Ex: AI, AO, DI, DO, Math etc..
24. Can I log report of counter values in digital IO module?
Yes, you can use 16DI and it support till 1 KHz. You can display counter values of
16DI module in DAQ software in future
25. I wish to see both Real time and historical combined. Is it possible?
If Real time viewer, Select configuration and adjust display settings say day/page, then
Real trend will show last 24 hrs display
26. I want to receive alarms by SMS. Is it possible?
In this case, select Analog output module like IO-8AOI and then connect with GSM
controller. Then, you can receive alarms by SMS.
143
Brainchild Electronic Co., Ltd.
No. 209, Chung Yang Road, Nan Kang Dist., Taipei, Taiwan, R. O. C.
Tel: 886-2-27861299 Fax: 886-2-27861395
E-mail: [email protected]
Technical support: [email protected]
Website: http://www.brainchild.com.tw
144