1
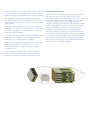
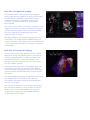
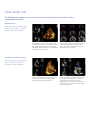
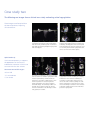
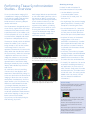
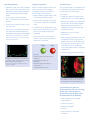
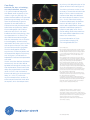
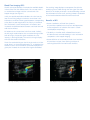
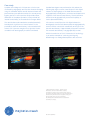
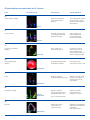
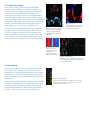
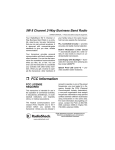
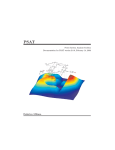
GE Healthcare
Vivid 7 Dimension
Real-time 4D imaging and
Real-time 4D color imaging
The Vivid™ 7 Dimension is a premier cardiovascular ultrasound
system that builds on the strength of GE’s powerful imaging
platform, acquiring more clinical information – and in fewer steps.
GE’s innovative transducer technology allows you to use
only one probe to acquire multiple planes of images at the
same time, and from the same heartbeat, without changing
probe positions.
This single, unique transducer gives you multiple imaging
capabilities, such as Coded Octave Harmonics, color Doppler,
Tissue Velocity Imaging, PW and CW Doppler – plus multidimensional and 4D imaging.
GE’s real-time 4D imaging and real-time, full-volume imaging
enable the user to acquire artifact-free depictions of the
entire heart, to increase diagnostic confidence.
Real-time 4D color Doppler, and real-time, full-volume color
Doppler imaging, offer instant displays of 4D color for
improved visualization, including the ability to quantify
regurgitant lesions.
So, one transducer can be used to perform a complete
exam, including stress and contrast imaging, which can
significantly reduce exam time and streamline workflow.
Technical description:
The foundation for 4D imaging is the unique 3V transducer.
This transducer has a true, non-sparse 2D array with
thousands of transducer elements. With such a high number
of transducer elements, part of the beam forming is made
within the transducer itself. Cutting-edge material and
electronic technology has made it possible to have a very high
dynamic range beam forming in the transducer. This results
in a probe capable of scanning all modes, including the
challenging CW Doppler mode. This technology makes it
possible to steer the ultrasound beam in any direction, so
that real-time 4D images can be acquired. For color imaging,
this translates into unprecedented sensitivity in 4D color flow
imaging. Even with such probe complexity, the design has
been made with an ergonomically shaped transducer that
allows easy access to imaging windows.
Real-time, non-gated 4D imaging
The 3V probe and the Vivid 7 Dimension are capable of
acquiring real-time, non-gated 4D tissue and color imaging.
The volume data is displayed in real time with volume
rendering techniques for visualization of valves and
structures. The size and shape of the volume can be
easily adjusted.
This system can even perform real-time, non-gated 4D color
imaging. The volume color data is simultaneously rendered
with the volume tissue data. Tools like Volume Size enable
the user to optimize the size and frame rate for the
respective region of interest.
Raw data capabilities offer all the same post-processing
functionality for 4D images that are available during the
routine examination. For example, controls like color baseline
or color maps can be adjusted on the EchoPAC™ workstation
during analysis.
Real-time, full-volume 4D imaging
The Vivid 7 Dimension system enables the user to acquire
large tissue volumes with gated acquisition. The powerful
processing capabilities allow for real-time display of the
data while the rendering continuously updates, so all
throughout the scanning process the user can see when
the correct data is acquired.
The highly efficient acquisition of color Doppler gives highvolume rates in real-time, 4D full-volume color imaging.
The user can easily change both the size of the color region
of interest and the acquired frame rates using the Volume
Size control.
The volume rendering technology for real-time, 4D full-volume
color Doppler allows for effortless jet flow detection.
The turbulent flow pattern can easily be rendered within
the color-volume data.
The scan setup for real-time, 4D full-volume color imaging
also includes the flexibility to set the number of required
cardiac cycles for acquisition. In addition, a number of
navigation and cropping tools are available that allow
for optimization of the 4D data.
Tips:
• Four-color render maps are available.
• Different color maps may improve depth perception
for a particular image or for an individual viewer
• The gray/red map may assist those that have
difficulties differentiating colors
Figure 1. Red/Bronze Depth Color Render map
Enhanced 4D Visualization
4D Ultra-Definition Clarity
Ultra-Definition Clarity Control is a one button setting to optimize
4D volumes for streamlined 4D workflow. Combines multiple
post-processing controls into one, to provide personalization
of image quality from smooth to crisp resolution.
How to activate on the Vivid 7
• Display a 4D image
• Bottom row of LED display, press more
• Press “4D colorize” then choose the Depth
Color Render map of your choice
How to activate on the EchoPAC
4D Stereo Vision
4D Stereo Vision is a technique where two different volume
renderings are displayed with two different colors and overlaid
at slightly different viewing angles. For the user to see the
stereoscopic effect, they must wear special Stereo Vision
glasses, which are provided with your 4D system or upgrade
purchase. 4D Stereo Vision gives the user a new perspective
of depth and volume for the rendered image.
Workflow Tip: Adjust Volume Optimization and UltraDefinition Clarity to improve the effect of both Depth Color
Render maps and Stereo Vision
Tip: Stereo angle rotary increases or decreases the angle
of the image to the left and right eye. Adjust to optimize
the effect on an individual basis.
• Display a 4D image
• Press 4D colorize on the control panel
How to activate on the Vivid 7
• Wear the provided Stereo Vision glasses
• Scroll down to Depth Color Render map of your choice
• Display a 4D image
Depth Color Render maps
Other visual enhancements such as Depth Color Render maps
have been integrated to improve the perception of depth in
volume-rendered images. Every pixel along each scan line, in the
volume rendering is assigned a color according to its depth.
This enables the user to better distinguish the perception
of depth in the volume rendered image. (Figure 1)
• Bottom row of LED display, press more
• Press 4D colorize, then Stereo
How to activate on the EchoPAC
• Put on GE viewing glasses
• Display 4D rendering
• Press 4D colorize
• Select Stereo
Case study one
The following are images from a clinical case study evaluating a patient with a history
of pacemaker insertion.
Optimization tip:
Increase 2D gain to visualize valves
and increase 4D gain to visualize
the back wall of the chamber.
Real-time 4D imaging enables the user to see the
4D rendering in real time, as the patient’s image
is continuously updated. This patient was treated
with a single chamber pacemaker. This patient
was followed with transthoracic echocardiography
including real-time 4D imaging.
The patient’s left ventricular function was
assessed with real-time, 4D full-volume imaging.
Following the full-volume acquisition, 9-Slice
mode can be used to further assess regional
wall motion of the left ventricle.
The patient’s right ventricular function was also
assessed with real-time 4D imaging. During the
routine echo examination, mild to moderate
tricuspid regurgitation was visualized.
To assess the interaction of the pacemaker wire
and the tricuspid valve, real-time, 4D full-volume
color imaging was utilized. Here, the system
demonstrates the extent of the tricuspid
regurgitation as it extends into the base of the
right atrium and is forced into the atrial septum
by the pacemaker wire.
Navigation and reference plane:
Use the navigation image located
in the middle of the screen for
orientation of the 4D dataset.
Case study two
The following are images from a clinical case study evaluating mitral regurgitation.
These images are all acquired from
the same transducer, improving
clinical workflow.
This patient presented with “moderate” mitral
regurgitation. This patient’s mitral regurgitation
was assessed by combining tools of continuous
wave (CW) and acquiring multiple-imaging views
with color Doppler.
Multi-dimensional imaging, including tri-plane
imaging, offers additional clinical confidence by
evaluating color Doppler from three orthogonal
views simultaneously, from the same heart cycle
as seen. This patient’s mitral regurgitation, PISA,
can be seen here from all three planes.
The advances in 4D imaging can improve accuracy
in the assessment of valvular regurgitation. What
has been quantitatively evaluated from two
dimensions can now be evaluated from a colorvolume acquisition. To assess this patient’s
mitral regurgitation, we acquired a real-time
full-volume image. The advantage of GE’s realtime 4D color acquisition is that the clinician
views the information as the 4D image continuously updates in real time.
One of the challenges in evaluating mitral
regurgitation has been the ability to accurately
evaluate the vena contracta. Following the
acquisition of a full-volume dataset, the user
can use the 6-Slice mode to quantify the colorvolume acquisition in 6 short-axis slices, giving
the user the ability to isolate the vena contracta
to perform a planimetry area of the narrowest
part of the regurgitation.
Optimization tip:
Use tissue transparency to suppress
the appearance of the tissue to
evaluate the interaction of this tissue
structure with the color-volume.
Vena contracta width ranges3:
<0.3cm Mild
.3-.7cm Moderate
>.7cm Severe
Acquiring and rendering 4D datasets are easy to learn
and adopt into clinical practice.
Real-time 4D acquisition
Real-time 4D color acquisition
1. Select 3V probe
2. Optimize IQ settings (gain, depth, TGC, etc.)
1. Press 2D and enter Color mode
(Optimize IQ – depth, gain, TGC and ROI)
3. Press 4D button
2. Press 4D (RT Color)
4. Adjust 4D (Active) Gain as necessary
3. Press 4D CF Prepare Mode
a. Increase 2D gain to see valves
b. Increase 4D (Active) Gain to see back
of the chamber
5. Select Full Volume
6. Press Image store or Freeze
Tissue rendering
4. Press Full Volume – (RT 4D Color FV)
5. Press Image Store or Freeze
4D color rendering
6. Press Angle
7. Use Trackball (Translate/Rotate)
to optimize dataset for region of interest
7. Press Angle
8. Increase Tissue Transparency
Evaluate Flow Transparency
8. Trackball (Translate/Rotate) for
image orientation
9. Press Store
9. Use Volume Optimize or Clarity if necessary
10. Press Image Store
Not all features may be available in your current software package.
Please consult your sales representative to inquire about additional
features for your Vivid 7 Dimension or your EchoPAC.
GE Healthcare
4D LV volume
Easy, fast and accurate assessments.
Quantifying left ventricular volumes
Echocardiography is reaching new dimensions with real-time
4D imaging and quantification. Now EchoPac™ Dimension
gives users the ability to quantify volume information,
increasing their clinical confidence by providing clinically
relevant information for routine patients.
Using the exceptional real-time full-volume image quality
produced by Vivid™ 7 Dimension, the 4D LV volume tailored
package from TomTec Imaging Systems can provide a
full assessment of the left ventricle, free of geometric
assumptions and shape, in less than a minute.
4D LV volume features advanced volume finding algorithms
for an easy, fast, accurate and highly reproducible functional
analysis of the left ventricle. These valuable clinical tools are
available on both Vivid 7 Dimension and EchoPAC.
4D LV volume rendering
4D LV volume tracks the endocardial border of the ventricle
in three dimensions, thus providing a model that represents
the true geometry of the ventricle instead of relying on shape
assumptions. Stroke Volume and Ejection Fraction are
derived from those measurements with higher accuracy than
2D methods allow. Using a 16-segment model, a subdivision
of the ventricle is performed for regional volumetric analysis.
Not only can resting transthoracic information be analyzed,
but stress echo datasets can be analyzed as well from the
Vivid 7 Dimension.
4D LV volume analysis:
The following global and regional measurements are derived:
EDV
ESV
SV
EF
—
—
—
—
End Diastolic volume
End Systolic volume
Stroke volume
Ejection fraction
These values can be stored into the Vivid 7 Dimension and
EchoPAC worksheet or report. The 4D LV volume analysis
can be stored as part of the patient exam.
*Reproducibility and accuracy of 3D Echo have been shown by Carly Jenkins et al. JACC, 2004,
Vol. 44, No. 4, 878-886
Not all features may be available in your current software package. Please consult your sales
representative to inquire about additional features for your Vivid 7 Dimension or your EchoPAC.
©2007 General Electric Company – All rights reserved.
GE Medical Systems Ultrasound & Primary Care Diagnostics, LLC,
a General Electric company, doing business as GE Healthcare.
General Electric Company reserves the right to make changes in
specifications and features shown herein, or discontinue the product
described at any time without notice or obligation. Contact your
GE representative for the most current information.
GE, GE Monogram, Vivid and EchoPAC are trademarks
of General Electric Company.
ULTC-0188-11.07-EN-US
GE Healthcare
Tissue Synchronization Imaging
(TSI) in Clinical Practice
Ole Breithardt, M.D.
Susan Floer, BS, RDCS
Hans-Juergen Goldschmidt, PhD
Andreas Heimdal, PhD
Sue Phillip, RCS
Performing Tissue Synchronization
Studies – Overview
Tissue Synchronization Imaging (TSI)
is a parametric imaging tool based on
Tissue Velocity Imaging that provides
clinicians with additional image
enhancement for assessing delayed
cardiac wall motion.
The TSI parametric image analyses the
tissue velocity signals within the image
to determine the peak velocities within
a specified portion of the cardiac cycle.
Since these peaks will occur in relation
to overall motion, delayed wall motion
will produce a delayed peak velocity.
The amount of delay within the defined
area of the cardiac cycle is used to
assign a map or color to that location
in the image. With TSI, the color
represents the amount of tissue motion
delay rather than the absolute value of
the tissue velocity. When this technique
is applied in real time across the 2D
image, the variation in color provides
both a qualitative and quantitative
representation of wall motion delay
allowing a trained physician to readily
identify and evaluate asynchronous
wall motion.
GE continues to invest in providing
clinical tools for the diagnosis and
treatment of heart failure by taking TSI
to the next level with multi-dimensional
imaging. It allows the user to acquire
three planes simultaneously from the
same cardiac cycle. This prevents any
differences seen between the heart
cycle lengths between the planes. It
gives the user the ability to generate
a bulls-eye display along with a 4D
model with quantitative measurements
and surface mapping so that you can
better communicate cardiac
dyssynchrony to Electrophysiologists
and referring physicians.
Both images (below) are provided with
a color scale relating the map color to
the amount of delay in seconds (top
right). An ECG trace (along the bottom)
shows the electrical activity of the
heart with markers to indicate the
segment of the cardiac cycle being
processed by TSI, as well as a cursor
showing the location in the cardiac
cycle of the displayed image. These
images are normally viewed with
real-time acquisition.
Obtaining an Image
For both 2D and multi-plane TSI
(multi-plane requires the 3V probe):
• Use the default or your own
customized Cardiac Preset.
• To enter the TSI mode, press TVI
then press TSI.
• For single image: The common imaging
planes acquired for TSI analysis are
the apical 4, 2 and long axis views.
• For multi-dimension TSI - Select the
3V probe. While acquiring an apical
4C view, press the multi-dimension
button, then press the tri-plane button.
• Acquire a full sector of the desired
imaging plane. A full sector is
preferred to simultaneously visualize
and compare all the walls within the
left ventricle. Accurate TSI analysis
is achieved with frame rates around
100fps or higher.
A normal cardiac cycle with an easily
recognizable ECG and synchronous wall motion.
The entire left ventricle is uniformly green in color.
• As with any Tissue Velocity Doppler
imaging technique, care should be taken
to keep the walls of interest aligned
parallel with the transducer so that
accurate velocities can be detected.
• To simplify TVI acquisition, TVI can be
acquired in the background during
any application (2D, stress echo or
even contrast). Simply enter TVI mode,
and then press the “TVI visible” button
to hide the colors. This setting can be
added to the User Preset. (Consult
the User Manual for additional
information.)
Wall motion delay (asynchrony) as indicated by
the red color segment in the lateral wall.
TSI Color Coding
The time-to-peak positive velocity is colorized
continuously from green through yellow,
and orange to red.
The exact start and end times for TSI are
shown on the color bar.
The TSI cutoff button assigns the same color
for all regions that reach peak velocity earlier
than the cutoff value.
Another color map that depicts blue and
green can be selected for those who are
color blind.
Note that the apex region does not allow a valid
interpretation, as the Tissue Synchronization
Imaging and measurement is based on
tissue velocity information.
Optimizing Controls
Image Interpretation
TSI Surface Map
• Optimize 2D gain for a clean chamber
that is free of noise. Automatic Tissue
Optimization (ATO) can be utilized for
this by simply depressing the gain
button.
Select TSI mode. Freeze 2D and scroll
to the TSI end time. The image is
colorized according to the time-topositive peak systolic velocity.
The TSI surface map is a qualitative tool
for identifying the extent and location
of asynchrony in the left heart.
• An ECG trace, free of noise and
with a consistent heart rate, should
be used.
• Acquire one or more full heart cycles
into cine loop.
• Typically, TSI start and end times do
not need to be manually adjusted.
The default settings are recommended.
*Please refer to the Advanced TSI White
Paper for instructions on how to modify
the TSI start/end time.
• Regions reaching peak velocity early
in systole are marked in green.
• Regions reaching peak velocity late
in systole or in diastole are marked
in red.
• To add a level of quantification, the
exact time-to-peak velocity for each
point in the image can be easily
measured.
• Freeze the loop in a late diastolic
frame. Vivid 7 Dimension platform
freezes at TSI end time.
Early
Late
Quick Steps:
• Display a tri-plane TSI image. Press
measure, enter TSI surface mapping.
• Starting at LV annullus on the left side of
the A4C view, click at least five points
along the walls around the LV (in
middle of tissue), end on right side
by double clicking.
• Repeat process for A2C and
ALAX views.
• After completing all three traces, use
trackball and scroll to End Systole.
Repeat the process on all three views.
• To display-press Layout, press Show
Scan Planes. Click on model with
cursor and rotate around to reposition
surface map.
• Store the image loop before exiting.
Synchrony
When TSI is activated, yellow QRS-markers
will appear on the ECG trace. Make sure there
is a yellow circle on each QRS complex at the
point of the steepest rising slope.
* Please refer to user manual for instructions on how to
change the QR markers.
• Regions reaching peak velocity at the
same time
• Regions with the same color
Asynchrony
• Regions reaching peak velocity at
different times
• Regions with different colors
Tip: To generate a more accurate TSI Surface
Map, draw the LV shape in the middle of the
tissue rather then on the endocardial edge.
If you would like to generate
quantitative data from the TSI image,
please refer to the Advance TSI
Quantitative Analysis White Paper
for information on the following:
• How to perform time-to-peak
measurements
• TSI bulls-eye report
• Asynchrony indexes
• TSI trace
• How to modify TSI start and
end times
asynchrony with delayed motion of the
septum and the inferior wall (Figure 2).
Case Study
Breithardt, OA, Dept. of Cardiology,
Univ.-Hospital Aachen, Germany
A 74-year-old male was diagnosed
with dilated cardio-myopathy of nonischemic origin two years ago. The
patient remained stable on an optimized
pharmacological therapy until recently,
when he experienced progressive
dyspnea. He was admitted to our
hospital with acutely decompensated
heart failure and pulmonary edema.
Electrocardiographic QRS width on
admission was 160 ms, with a leftbundle branch block morphology. After
recompensation on I.V. diuretics, the
QRS width became narrower again
and was measured at 140 ms. Routine
echocardiography showed severely
reduced left ventricular systolic function,
with an ejection fraction of less than
20% and severe mitral regurgitation.
The echocardiographer noted an
asynchronous contraction pattern and
documented the degree of asynchrony
with TSI (Figure 1). An indication for
implantation of a biventricular pacemaker
was made.
The left ventricular lead was implanted
transvenously into an infero-lateral
epicardial vein through the coronary sinus.
After implantation, the atrioventricular
delay was programmed to a standard
value of 120 ms, with simultaneous
biventricular pacing (no interventricular
delay, VV = 0 ms). To confirm the
resynchronization effect, another TSI
exam was performed one month after
the implant, which showed persistent
Figure 1
To achieve synchronous motion, it was
necessary to shorten the atrioventricular
delay to 100 ms, and to introduce an
intraventricular delay with additional
left-ventricular pre-excitation of 20 ms
(VV = -20 ms). Under these settings,
TSI demonstrated nearly simultaneous
motion in all walls (Figure 3). Three
months after reoptimization, the patient
reported a marked improvement in
symptoms and quality of life. The sixminute walking distance improved from
345 meters before implantation to 480
meters four months later.
For more information on Tissue
Synchronization Imaging (TSI),
visit www.gehealthcare.com
Figure 2
List of TSI References:
Bax JJ, Abraham T, Barold S, Breithardt OA, Fung JWH, Garrigue S,
Gorcsan J 3rd, Hayes DL, Kass DA, Knuuti J, Leclercq C, Linde C,
Mark DB, Monaghan MJ, Nihoyannopoulos P, Schalij MJ, Stellbrink
C, Yu CM. Cardiac Resynchronization Therapy - Part 1 - Issues
Before Device Implantation. J Am Coll Cardiol. 2005 Dec 20;
46(12):2153–67.
Dohi K, Suffoletto M, Ganz L, Zenati M, Gorcsan J 3rd. Utility of
echocardiographic tissue synchronization imaging to redirect left
ventricular lead placement for improved cardiac resynchronization
therapy. Pacing Clin Electrophysiol. 2005 May;28(5):461-5.
Dohi K, Suffoletto M, Murali S, Bazaz R, Gorcsan J. Benefit of
cardiac resynchronization therapy to a patient with a narrow
QRS complex and ventricular dyssynchrony identified by tissue
synchronization imaging. Eur J Echocardiogr. 2005 Dec;6(6):455-60.
Figure 3
Gorcsan J 3rd, Kanzaki H, Bazaz R, Dohi K, Schwartzman D.
Usefulness of echocardiographic tissue synchronization imaging
to predict acute response to cardiac resynchronization therapy.
Am J Cardiol. 2004 May 1;93(9):1178-81.
Lind B, Nowak J, Dorph J, van der Linden J, Brodin LA. Analysis
of temporal requirements for myocardial tissue velocity imaging.
Eur J Echocardiogr. 2002 Sep; 3(3):214-9.
Yu CM, Zhang Q, Fung JW. Images in cardiovascular medicine.
Visualization of regional left ventricular mechanical delay by tissue
synchronization imaging in heart failure patients with wide and
narrow QRS complexes undergoing cardiac resynchronization
therapy. Circulation. 2005 Aug 16;112(7):e93-5.
© 2006 General Electric Company – All rights reserved.
GE Healthcare, a division of General Electric Company
General Electric Company reserves the right to make changes in
specifications and features shown herein, or discontinue the product
described at any time without notice or obligation. Contact your
GE representative for the most current information.
GE, GE Monogram, Vivid™ and EchoPAC™ are trademarks of
General Electric Company.
ULTC-0140-05.06-EN-US
GE Healthcare
Blood Flow Imaging
(BFI)
Thaddeus Chodakauskas, RDCS
Trond Kleveland, M.Sc
Stienar Bjaerum, PhD
Background
Conventional color Doppler imaging has become a routine
standard and accepted method for the non-invasive imaging
of blood flow through the vessels, by displaying blood flow
data on a B-Mode image. A new clinical tool, called Blood Flow
Imaging (BFI), utilizes a unique signal-processing algorithm for
visualizing blood flow data on the Vivid™ 7 Dimension system.
To understand the benefits of BFI, it is necessary to review
the basic principles of color-flow Doppler imaging. To obtain
a color Doppler image, multiple pulses are transmitted along
each scan line of the image. For each sample volume in the
image, there is a packet of data samples available for
estimating parameters describing the blood flow (see Figure 1).
The first step in processing, is to remove the clutter noise
originating from stationary and slowly moving tissue. Using
this filtered packet, the mean blood velocity can be estimated
by calculating the mean phase shift from sample to sample in
the packet. In addition to the mean velocity, the amplitude of
the echo from blood, as well as the variance of the velocities
around the mean, can be calculated.
Large accelerations and turbulent flow patterns result in a
broad distribution – and large variance – of velocities. To
obtain robust estimates of the flow parameters, substantial
temporal and spatial averaging is performed on the data.
This averaging blurs potential clinically valuable flow details
in both the temporal and spatial dimensions.
Pulse transmissions
Packet Size
As a result of the physics of ultrasound imaging, a distribution
of sound scatterers inside the body produces an image with
spatially varying amplitude. The variation in amplitude is
called a speckle pattern, and is a well-known phenomenon
in regular B-mode images. The spatial averaging performed
in conventional color Doppler imaging smoothes out the
amplitude variation, and the speckle information is not
clearly seen in the color image.
Following the wall filter, but prior to collapsing the acquired
packets to a one color image, the resulting set of images
display the flow with both high spatial and temporal
resolution. Each image is a snapshot of the speckle pattern
produced by the spatial distribution of the red blood cells
at the instant the image was acquired.
With displacement of the blood cells from image to image,
there will be a corresponding displacement of the speckle
pattern from image to image. When a series of such images
is displayed, the user perceives a movement in the speckle
pattern, corresponding to the movement of the blood cells
producing the speckle flow information.
Pulse transmissions
Packet Size
Time
Time
Image
Image
Time
Time
Image display
Image samples
Image display
Image samples
Figure 1. Conventional color flow imaging
Figure 2. Multiple blood flow images
The Vivid 7 Dimension system transmits multiple transmission
pulses per packet size for each ultrasound beam. For each
blood flow image, the ultrasound system also displays the
B-Mode image.
BFI samples multiple blood flow images for each packet size
containing multiple transmit pulses.
Blood Flow Imaging (BFI)
The BFI technique attempts to maintain the available details
in the echoes from the red blood cells. The concept in BFI is
to combine these images with the conventional color
Doppler images (see Figure 2).
In BFI, the speckle amplitude modulates the color intensity
level. The resulting images include the conventional color
information, as well as a flowing speckle pattern corresponding
to the direction and magnitude of the velocity in the blood
flow. The benefit is more hemodynamic information and
increased visual differentiation between true blood flow and
wall motion artifacts.
BFI enhances the conventional color-flow mode. Similarly,
the BFI Angio mode enhances the conventional Angio mode.
With BFI Angio, the speckle signal modulates the color
intensity in the Angio display. The result is an Anglo display
with flow directional information.
The B-Flow mode builds upon the BFI Angio mode. In B-Flow
mode, there is no tissue/flow arbitration, i.e., no hard decision
whether tissue or flow information should be displayed in a
given pixel. Instead, the tissue and flow signals are added.
BFI image visualizing a tortuous ICA vessel.
The resulting image displays a transparent flow with the
underlying tissue visible through the flow signal. The main
benefit of this display technique is reduced bleeding of blood
flow information into the tissue, resulting in better visualization
of the interface between blood flow and vessel wall.
Benefits of BFI
• Better visualization of blood flow dynamics.
BFI provides a qualitative tool to assess and appreciate
the hemodynamics of turbulent flow seen in certain
carotid plaque morphology.
• The ability to visualize small collateral blood vessels.
BFI demonstrates minimal bleeding of color information
compared to color Doppler imaging.
• Better definition of vessel wall to blood tissue interface.
BFI provides a unique clutter filtering technique in
removing blood flow from wall motion artifacts.
Color Doppler image visualizing a tortuous ICA vessel.
Case study
A patient with a diagnosis of 60 percent occlusion was
confirmed by angiography and vascular ultrasound imaging
using BFI. A bilateral duplex carotid ultrasound exam was
performed as a pre-operative workup for coronary artery
bypass graft. BFI is more sensitive and provides better
delineation of the plaque formation in the proximal left
internal carotid artery, as illustrated in the images below.
Cerebral arteriogram was performed on this patient the
following day. Right common carotid injection with digital
subtraction arteriography of the head demonstrates an
angiographically normal petrous, cavernous and supraclinioid
segments of the internal carotid artery. The ACA and MCA
territories are angiographically normal with capillary or
venous phase abnormality.
The carotid ultrasound examination revealed potentially
hemodynamic significance of carotid stenosis in the
proximal left internal carotid artery. It also revealed mild
stenosis (50-70 percent range) on the right side. Further
correlation with arteriography should be considered.
Left common carotid injection with digital subtraction
arteriography over the neck demonstrates an angiographically
normal common carotid, the carotid bulb, and origin of the
internal carotid artery is approximately 60 percent stenosed.
The external carotid artery is angiographically normal.
With the introduction of Vivid 7 Dimension, BFI technology
is yet another example of continuing and ongoing
breakthroughs to manage better patient care outcomes.
Color Doppler Imaging
Blood Flow Imaging (BFI)
© 2006 General Electric Company – All rights reserved.
GE Healthcare, a division of General Electric Company
General Electric Company reserves the right to make changes in
specifications and features shown herein, or discontinue the product
described at any time without notice or obligation. Contact your
GE representative for the most current information.
GE, GE Monogram, Vivid™ and EchoPAC™ are trademarks of
General Electric Company.
ULTC-0142-05.06-EN-US
GE Healthcare
GE quantitative analysis
for left ventricular function
GE quantitative analysis overview
Echocardiography traditionally has been all about the image –
a fast moving image. From this image, the experienced
eye may be able to identify irregularities in myocardial
motion and left ventricular (LV) function. This, coupled
with its non-invasive nature, has made echocardiography
one of the leading diagnostic imaging techniques.
New generation ultrasound scanners generate images
of several hundred frames per second, which is beyond the
perception of even the most experienced eye. This created
the need for a more precise quantitative assessment tool
for LV function, called QScan.
The first QScan tool, Anatomical M-Mode, was introduced
in the early 1990s to derive quantitative information from
high-frame-rate, raw-data images.
In 1995, QScan technology was applied to Tissue Velocity
Imaging (TVI). TVI derives velocity traces and anatomical and
curved Anatomical M-Mode information, which initiated new
clinical applications.
Building on QScan technology, GE introduced Tissue Tracking
for assessment of longitudinal displacement. Strain and Strain
Rate Imaging was also introduced with clinical applications
for regional assessment of LV function. The Vivid™ 7 Vantage
release introduced another new quantitative QScan tool (TSI)
developed to support cardiac resynchronization therapy (CRT).
In 2004, on the Vivid 7 Dimension release, GE introduced
2D Strain, a unique, advanced research tool that leverages
its leadership in quantitative echocardiography and includes
the latest breakthroughs in Strain and Strain Rate Imaging.
GE quantitative assessment tools for LV function
Mode
Parametric image
Measurement
Clinical application
Measures longitudinal
myocardial velocities
(cm/sec)
Assess global and regional
systolic function; assess
left ventricular relaxation
abnormalities
Integrates TVI over time
to yield longitudinal wall
displacement (mm)
Easy recognition of
regional and global
left ventricular wall
motion abnormalities
Color-coded, timeto-peak velocity (ms)
Unique tool to assess
asynchrony in the left
heart, manage heart
failure patients and those
patients undergoing CRT
Regional and global peak
longitudinal strain (%)
Assessment of left
ventricular function at rest
Measures regional
longitudinal deformation (%)
Evaluates ischemic heart
disease; true analysis of
a specific piece of the
myocardium
Measures regional
myocardial compression
speed (deformation rate)
Evaluates ischemic
heart disease; true
analysis of a specific
TVI
Tissue Velocity Imaging
Speed
TT
Tissue Tracking
Distance
TSI
Tissue Synchronization
Imaging
Synchrony
AFI
Automated Function
Imaging
Deformation
S
Strain
Deformation
SRI
Strain Rate Imaging
(1/sec)
Speed of
deformation
piece of the myocardium
2Ds
2D Strain
Advanced research
tool based on 2D
speckle tracking
Deformation
Evaluation of longitudinal,
radial and circumferential
myocardial
deformation/strain
Tissue Velocity Imaging
Tissue Velocity Imaging (TVI) uses myocardial Doppler
frequency shifts to quantify myocardial tissue motion. TVI
can be used to assess global and regional systolic function,
as well as left ventricle relaxation abnormalities. The
advantage of TVI is that it is based on the Doppler-shifted
part of the reflected signal. This gives the clinician a tool to
assess myocardial function, even though the two-dimensional
image quality may be sub-optimal. Just as with conventional
Doppler, TVI can be displayed as pulsed Doppler (Figure 1),
color Doppler (Figure 2) and color M-Mode (Figure 3).
GE allows access to raw data, which gives you the ability
to quantify TVI live or at a future time by simply storing a
2D color TVI image. You can then go into Q-Analysis and
acquire TVI waveforms (Figure 4). You can also convert the
TVI information from the raw data to display Tissue Tracking,
Tissue Synchronization Imaging, Strain or Strain Rate Imaging.
Figure 2. Color TVI
Figure 1. Pulse Wave TVI
Normal spectral wave displays
a positive wave in systole and
a negative wave in diastole,
representing early filling and
atrial filling.
Red color displays motion toward
the probe. Blue color displays
motion away from probe.
Figure 3. TVI M-Mode
Red color in systole
displays tissue motion
toward the probe,
while blue in diastole
displays motion away.
Figure 4. TVI Waveforms
Waveforms may be extracted at any time from
color TVI loops in the quantitative analysis mode
on Vivid 7 or EchoPAC.
Tissue Tracking
Tissue Tracking displays systolic longitudinal displacement
by integrating tissue velocity over time. Tissue Tracking is
displayed as a color band representing motion during systole.
The system color codes each point in the myocardium with
the displacement occurring from end diastole to end systole
(see Figure 5).
Tissue Tracking is performed from the apical views. A normal
left ventricle will display the lowest motion at the apex, while
the mitral annulus will display the greatest motion. Systolic
mitral annular displacement, determined by tissue tracking,
correlates closely with left ventricular ejection fraction.2
Figure 5. Tissue Tracking
Tissue Tracking represents myocardial motion or distance
during systole. The motion is displayed as a color band
representing distance in mm.
Early
Tissue Synchronization Imaging
Tissue Synchronization Imaging (TSI) is a parametric imaging
tool based on Tissue Velocity Imaging that provides clinicians
with additional image enhancement for assessing delayed
cardiac wall motion.
The TSI parametric image analyzes the tissue velocity signals
within the image to determine the peak velocities within a
specified portion of the cardiac cycle. Since these peaks will
occur in relation to overall motion, delayed wall motion will
produce a delayed peak velocity.
The amount of delay within the defined area of the cardiac
cycle is used to assign or map a color to that location in the
image. With TSI, the color represents the amount of tissue
motion delay rather than the absolute value of the tissue
velocity. When this technique is applied in real time across
the 2D image, the variation in color provides both a qualitative
and quantitative representation of wall motion delay,
allowing a trained physician to readily identify and evaluate
asynchronous wall motion (see Figures 6 and 7).
For more information on quantitative TSI, refer to the
“Advanced TSI for Quantitative Analysis white paper”
available at www.gehealthcare.com.
Late
Synchrony
• Regions reaching peak
velocity at the same time
Figure 6. Early Systole
Regions reaching peak velocity in early
systole are marked in green.
• Regions with the same
color
Asynchrony
• Regions reaching peak
velocity at different
times
• Regions with different
colors
Figure 7. Late Systole/Diastole
Regions reaching peak velocity in late
systole or in diastole are marked red.
Strain and Strain Rate Imaging
Strain Imaging provides regional detection of myocardial
contraction. It enables clinicians to determine velocity
gradients along the ultrasound beam, thereby helping users
analyze tissue contraction and regional myocardial function.
Strain and Strain Rate Imaging have been used by a number
of researchers to evaluate ischemic heart disease. Strain
Imaging measures percent of regional deformation of the
myocardium, while Strain Rate Imaging measures the speed
of deformation (see Figures 8 and 9).
Figure 8. Strain Imaging
Strain Imaging measures change in shape.
The majority of strain rate changes are too fast to be
detected by the human eye in real time. With the application
of post-processing tools, the comparison of strain or strain
rate traces from different myocardial regions allows detailed
insight into regional mechanical function. As an added benefit,
the analysis of strain and strain rate information is minimally
affected by motion or tethering effects of the heart.
Figure 9. Strain Rate Imaging
Strain Rate Imaging measures how fast
the change occurred.
Automated Function Imaging (AFI)
AFI is a semi-automated measurement tool that displays
peak longitudinal systolic strain in a bull’s-eye display,
along with segmental strain values and global peak strain.
AFI is a clinical decision support tool for assessing left
ventricular function at rest. The measurement is performed
from three apical views that are part of your normal protocol,
so it is easily incorporated into your routine workflow.
Like in 2D Strain, AFI analyzes myocardial motion by tracking
features (natural acoustic tags) in the ultrasound image
in two dimensions. The AFI algorithm estimates the percent
of wall lengthening and shortening in a set of three
longitudinal 2D image planes, APLAX, A4CH and A2CH.
It then combines the results of all three planes in a single
bull’s-eye summary.
Color Bar Explanation
Shortening or negative strain is displayed
as red. The higher the percent of shortening
the darker the shade of red.
Lengthening or positive strain is displayed
as blue. Again, the higher the value, the
darker the shade.
Figure 8 Strain (S ) can be
defined as shown, where
l is instantaneous length,
lo is original length, and
∆l is change in length.
Figure 9 Strain Rate (SR )
can be estimated from
spatial velocity (v ) gradient,
where va – vb represents
difference in instantaneous
myocardial va and vb at
points a and b. Distance d
represents difference in
instantaneous myocardial
v points at specific time.
2D Strain
2D Strain, an advanced research tool, is a unique imaging
mode that allows analysis of the complete myocardial motion
throughout the entire heart cycle. Similar in concept to MRI
tagging, 2D Strain analyzes motion by tracking features
(natural acoustic tags) in the two-dimensional image.
2D Strain is also a natural extension of one-dimensional
analysis, which is based on Doppler techniques. Similar to
one-dimensional Doppler, myocardial motion is characterized
in terms of tissue velocity and tissue deformation parameters,
such as strain and strain rate. One of the main advantages
of this technique is that it allows the Region of Interest (ROI)
to be automatically tracked in the myocardium.
2D Strain is less angle dependent than Doppler-based only
techniques. The 2D strain package also offers a torsion
calculation tool. After processing the parasternal short-axis
view at the mitral valve level (SAX-MV) and the parasternal
view at the apical level (SAX-AP), the torsion button
will be available.
Normal
Pathologic
a) Parametric image
b) Traces
a) Parametric image
b) Traces
Peak radial strain values
are low, especially in the
anterior part.
For more information on 2D Strain, refer to GE Healthcare’s
“2D Strain white paper” available at www.gehealthcare.com.
Additional educational tools and white papers on TVI, TSI,
and Strain are also available at www.gehealthcare.com:
• The Role of Tissue Synchronization Imaging in Cardiac
Resynchronization Therapy
• Case Study Review for the Assessment of LV Function-TVI
• Strain Imaging
• Tissue Synchronization Imaging (TSI) in Clinical Practice
white paper
• Advanced TSI for Quantitative Analysis white paper
• Introducing 2D Strain: Tagged Echocardiography
white paper
• Automated Function Imaging (AFI) white paper
Not all features may be available in your current software package.
Please consult your sales representative to inquire about additional
features for your Vivid 7 Dimension or your EchoPAC.
Normal longitudinal strain displayed in quad format,
and curved anatomical M-Mode.