1
WaterCress User Manual – RFRO models
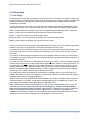
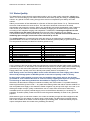
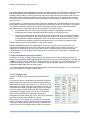
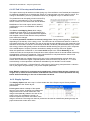
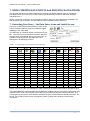
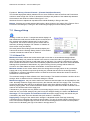
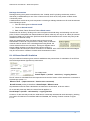
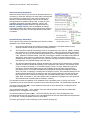
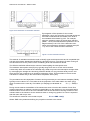
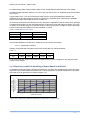
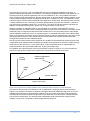
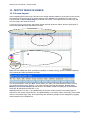
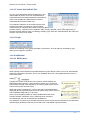
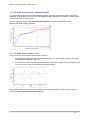
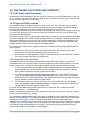
Figure 9.4.1 shows the average annual reduction in rainfall due to the abstraction of Initial Losses in
the range 0.5 to 5 mm/day from the 30 year Adelaide rainfall (1967-1996). Ie. the abstraction of 1
mm/day from all daily rainfalls in Adelaide over the period 1967 to 1996 would reduce the average
effective rainfall from 542 mm/a by 19.5%. A 2 mm/day abstraction reduces the average by 32.5%,
etc. Similar reductions would apply to all locations within the Adelaide region with rainfall in the range
450-650 mm. This curve can therefore be used to identify the effect of the (Daily rainfall-IL) part of the
above formula on the prediction of annual runoff.
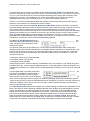
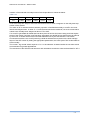
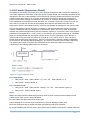
By inserting the values of IL, OF and Con as given in Table 1 into the WaterCress runoff formula, the
average annual runoff depth per unit area of roof and paved areas as a % of the annual rainfall would
be (1.0-0.195)*0.5*0.9 = 36% and (1.0-0.325)*0.8*0.85 = 46% respectively (where 1-0.195 is the long
term reduction in effective rainfall due to the abstraction of an IL of 1 mm/day, etc.). If (as stated) the
roofed and paved areas are assumed to occupy equal areas, the average runoff coefficient for the
total of the impervious areas would be 41%. If the pervious part of the catchment is assumed to
occupy 50% of the total catchment area, but to generate little runoff, then the runoff coefficient for the
whole catchment would be 20.5%.
By assuming different values for IL, Con, OF and different proportions of roofed, paved and pervious
areas, different average runoff coefficients for the total catchment can be calculated.
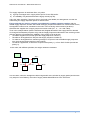
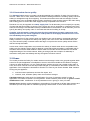
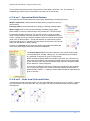
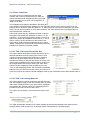
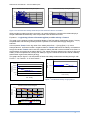
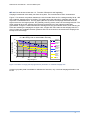
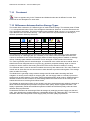
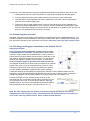
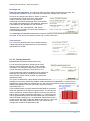
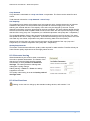
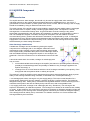
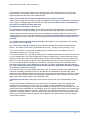
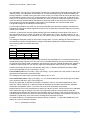
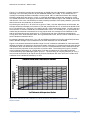
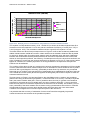
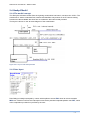
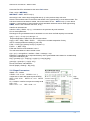
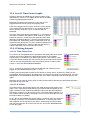
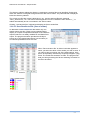
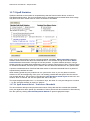
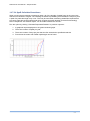
Figure 9.4.2 shows a theoretical indicative range of runoff coefficients calculated for catchments with
different proportions of impervious and pervious areas. Obviously, by including pervious areas into the
calculations, which are assumed to have zero runoff, the overall catchment runoff coefficients will be
reduced in direct proportion to the proportion of pervious area. Thus while (from Figure 1) an 80%
runoff coefficient might apply to a ‘stand-alone’ roof with an initial loss of 0.5 mm/day and when
connected directly to the drainage system (ie Con = 1.0) and having an ongoing loss (OF) of 10%, if
the roof was surrounded by an equal area of pervious catchment with zero runoff, the overall runoff
coefficient for the total area would drop to 40%.
IndicativeAnnual Runoff Coefficientsfor Adelaide
90
Thebaseline(lower graph) representsequal areasof
roofedandpavedsurfaceswithInitial Lossesof 1and2
mm/dayandContinuingLossesof 45and65%
.
respectively, ietypical residential values. Thehigher graphs
represent areaswithlower initial lossesandcontinuing
losses. Perviousareasareassumediohavezerorunoff.
80
IndicativeRunoff Coefficient
as%Annual Rainfall
70
60
50
40
30
20
10
0
0
10
20
30
40
50
60
70
80
90
100
%of Catchment withImperviousSurface
Figure 9.4.2 Indicative Runoff Coefficients for Urban catchments with Different proportions of Impervious and
Pervious Areas.
111