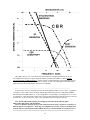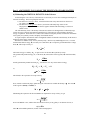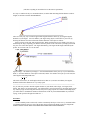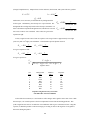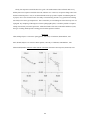
1
The REMOTE ACCESS ASTRONOMY PROJECT presents Image Processing Activities for High School and College Students A sampler of curricula with background information and suggested resources for high school and college students in physics and astronomy. Voice: (805) 893-7240 BBS: (805) 893-2650 e-mail: [email protected] WWW: http://www.deepspace.ucsb.edu/ funded by: The Center for Particle Astrophysics at U.C. Berkeley The University of California The National Science Foundation NASA Rockwell compiled by: Shea Lovan Jatila van der Veen Philip Lubin, Director of the Remote Access Astronomy Project curricula by: Jatila van der Veen and Philip Lubin (PC) Roger Freedman (Mac) contributors: Shea Lovan, Matthew Schalit, Ted Smith, Christopher Stubbs, and Alex Wuensche revised: November, 1995 CONTENTS OF THIS MANUAL / CURRICULUM PACKAGE I. The Remote Access Astronomy Project (RAAP) p. 4 II. RAAP System User’s Manual p. 10 A. Remote Observation Telescope (ROT) p. 11 B. CCD Astronomy p. 14 C. Photometry p. 16 III. Lab Exercises & Activities p. 20 A. Getting Started Using Imagine-32 p. 21 B. PC Ready Lab Activities p. 24 1. Labs for Introductory Astronomy a. Introduction to Digital Image Processing: What is CCD astronomy and image processing? p. 26 b. Color Mixing with Imagine-32: How do colors mix on a computer screen? p. 34 c. Tri-Color Imaging of the Orion Nebula: Create a true-color picture of the Orion Nebula by combining three separate images. p. 36 d. Finding Light Curves of Supernovae using RAAP CCD Images: General directions on how to create a light curve from images of a supernova. p. 38 e. Monitoring the Variations in Magnitude of SS-Cygni: Create a light curve for the variable star SS-Cygni. p. 46 f. Investigation of M16, an Open Cluster in Serpens: Examine the properties of the open star cluster M16 by creating a Hertzsprung-Russell diagram. p. 50 2. Labs for Introductory Physics a. Volcanoes on Io: Calculating the trajectory of ejecta from images of a volcano on Io P. 56 b. Craters in the Solar System: Comparing craters on 3 moons of the solar system, and calculating the energy released by an average impact p. 64 2 c. Kepler's Laws and the Orbit of Mercury: d. e. Demo of Kepler's first and second laws by plotting the position of Mercury p. 72 The Moons of Saturn: Demonstrating Kepler's third law from period-distance data of Saturn's moons p. 80 Tracking Sunspots: Calculating the rotation rate of the Sun by observing the positions of sunspots on 5 consecutive days p. 86 2. Introductory Cosmology Labs a. COBE for (Big) Kids: A simulation of the data processing and analysis that went into data gathering and interpretation for the Cosmic Background Explorer Satellite p. 94 b. Searching for Remote Dark Matter in the Galactic Halo: In this series of exercises we will attempt to find evidence for MACHOs in the Large Magellanic Cloud by performing photometry on a series of CCD images taken of a region of the LMC by observers at the Mt. Stromolo observatory Australia p. 110 3. Astronomy Labs for General Physical and Earth Science a. Measuring Angles in the Sky Using Fingers of the Hand: An exercise to explain b. c. how angular sizes are determined and why they are used in astronomy. p. 122 Tracking the Sun: A simple way to have students watch how the position of the sun changes over the course of a year. p. 126 Investigating Impact Craters: A simplified version of the Craters lab. p. 129 C. Macintosh Ready Lab Activities p. 134 1. Craters in the Solar System: Comparing craters on 2. 3 moons of the solar system, and calculating the energy released by an average impact. p. 136 Tracking Sunspots: Calculating the rotation rate of the Sun by observing the positions of sunspots on 5 consecutive days. p. 148 IV. Appendices A. Sample Research Project - Observations of Supernova 1993J B. Technical Information C. Published Articles on RAAP 3 p. 158 p. 164 p. 168 The REMOTE ACCESS ASTRONOMY PROJECT BBS Phone: (805) 893-2650 e-mail: [email protected] WWW server: http://www.deepspace.ucsb.edu/ What is RAAP? The Remote Access Astronomy Project (RAAP) was developed to allow undergraduates in beginning and advanced astrophysics courses to combine theory with observations by working with real satellite imaging data and a remotely operated telescope. The program has been extended to allow high schools and junior colleges to participate by calling our bulletin board and downloading images and educational programs. Funding for this program is through the University of California, the National Science Foundation Center for Particle Astrophysics, and the National Aeronautics and Space Administration. The program director is Dr. Philip Lubin of the Physics Department at the University of California, Santa Barbara, CA 93106. 4 5 THE REMOTE ACCESS ASTRONOMY PROJECT Remote Access Astronomy Project Dept. of Physics Univ. of Calif. at Santa Barbara Santa Barbara, CA 93106-9530 BBS: (805) 893-2650 e-mail: [email protected] ftp site: rot.ucsb.edu Dear Science Enthusiast / Instructor: The Remote Access Astronomy Project (RAAP) would like to invite you to participate in a unique educational outreach program that will place high tech digital image processing techniques/curricula into your classroom. This is a tremendous opportunity for students to have access to real satellite imagery and to be able to work with it in a fun, productive, computer environment. Remote Access Astronomy Project (RAAP): The RAAP is a computerized optical telescope and dial-in data distribution system that places high quality images and image processing techniques into computer workstations in junior and senior high school, community colleges, and university classrooms. This system provides a unique opportunity for students to utilize images from the Voyager, IRAS, COBE, Hubble Space Telescope, Keck, and many other sources. It also allows students to develop observing projects with the RAAP telescope. Objectives: To help reverse the alarming decline in the number of American students choosing to major in engineering or physical sciences, RAAP is dedicated to making the traditional high school science curriculum more appealing. The goal of the Remote Access Astronomy Project is to entice students into a life-long pursuit of scientific discovery. Through the computerized bulletin board, either by telephone or network access, students and teachers in different schools can communicate with each other or with the University, exchange ideas and curricula, seek solutions to problems, and keep current with new information in physics, astronomy, and other areas of science. Students are exposed to ideas and data that are not available in textbooks, in an interactive and challenging way. Students become empowered as researchers and take on an active role in their own education. The motivation to attend class is increased, as students look forward to reading their computer "e-mail," downloading image files, and viewing the results of the observing requests they submitted to the RAAP. Our experience has shown that the visual and participatory nature of the system is far more successful in motivating students to study natural phenomena than a textbook. By making traditional curricula relevant to current topics which are of great interest to the general public, and by increasing the level of student initiative in class on a daily basis, we hope to increase enrollment in higher-level science courses at the secondary level. RAAP is also useful in general science, chemistry, Earth science, and biology classes, as well as physics and astronomy. Students are able to design their own research projects with remote access to our telescope, within the context of their general science, physics, or astronomy classes. Such access will help retain student interest in science and also attract a wider pool of high school students to the sciences. In addition, a computerized on-line electronic bulletin board provides a method of curriculum distribution that allows teachers from across the state and country to interact with each other and with university scientists on an ongoing basis. 6 Remote Observation Telescope (ROT): An important component of the RAAP project is the Remote Observation Telescope (ROT). Students are often disappointed when they observe celestial objects with small telescopes used in astronomy labs. These objects appear only slightly better through small telescopes than with the naked eye, and look nothing like the spectacular photographs taken with large ground-based telescopes or the digital satellite images seen in astronomy text books and magazines. By mounting a very sensitive digital camera on the back of a 14-inch telescope, students can study stars, galaxies, planets, moons, nebulae, and other interesting items in a more meaningful way. Such a system allows students to design and implement their own research projects. The quality of images will be high enough that, given the creativity of the research endeavor, some real contributions to astrophysical research can be made. This is especially true of research projects which will require numerous observations over some given time period (such as variable star studies). In general, telescope time is hard to come by in the scientific community--yet students in the RAAP will get telescope time since the telescope can address the needs of many students in one evening, remotely and robotically. At the heart of the RAAP is the remotely controlled telescope which is currently situated on the roof of the physics building at UC Santa Barbara and will eventually be stationed at an Air Force missile tracking site on Santa Ynez peak, in the mountains overlooking the city. The first group of undergraduate students at UCSB began design and construction of the telescope in the fall of 1988; it saw first light during the summer of 1992. The students successfully completed a number of observational projects, including measuring the light curve of the supernova 1993J in M81. Since then, numerous students have used the ROT doing a variety of research projects such as supernova searches and light curve measurements, variable star and eclipsing binary studies, microlensing (MACHO) searches, black hole flare searches, and many other studies. The RAAP Bulletin Board System (BBS) During the summer of 1990, the AstroRAAP bulletin board was started, with the goal of eventually extending use of the telescope to high schools, junior colleges, and other universities. As most public high schools do not offer separate astronomy courses, this set of activities was originally developed to supplement the traditional high school physics curriculum, and is available on our bulletin board. The labs utilize existing data from some of the many NASA space probes and satellites. Our goal was to familiarize students and teachers with concepts in astronomy and techniques of image processing, so that they could eventually use the telescope to design their own research projects. The system consists of a centralized image database, computer network, modems, and a remotelycontrolled telescope with a CCD (Charge Coupled Device - direct electronic imaging) camera. The UCSB system is also linked with additional institutions that are providing data from other telescopes and satellites. Each remote school site should have at least one image processing workstation and modem. Students call the central system at UCSB and check for new electronic mail or leave messages. Images or entire curricula can be downloaded, or requests for targeted telescope observations can be uploaded. Initially, our database consisted of planetary, stellar, extra-galactic and daily solar and satellite weather images. Many of those images were from Voyager, Magellan, IRAS, and the Hubble Space Telescope. Our database of images has been expanded to include atomic force microscope images of atoms and molecules (including DNA), MRI and x-ray images of the human body, images of the Earth from the Earth Resources and Landsat satellites, as well as our regular planetary and astronomical images at visible, microwave, infrared and x-ray wavelengths. Some of these include the Keck telescope, optical and IR solar eclipses, COBE satellite sky surveys (public release), and daily satellite weather images, etc. In addition to still images, short movie sequences have been tried and can be useful for weather animation, solar rotation, and other comparisons. 7 Curricula and Tutorials The labs are continuously being expanded to include background material, references, ideas for further study, and supplemental activities which are useful in physics, astronomy, and astrophysics courses in high school and college. We have also developed computer-guided tutorials which provide background information on basic astronomy and some of the recent developments in observational astrophysics such as infrared astronomy and cosmology. The labs range from beginning physics applications such as projectile motion, to advanced topics such as mapping the cosmic background radiation. As with any lab manual, these labs are meant to provide the teacher with ideas and resources, and teachers should feel free to tailor them to their individual needs. Any part of this manual may be altered and reproduced FOR USE IN A CLASSROOM ONLY - and of course not for reproduction outside the classroom or for commercial purposes. Equipment Needs / Requirements: To participate in the RAAP project you will need computer based digital image processing software able to work with FITS and GIF format images and a high speed modem (preferably 9.6 kbs or higher) for communicating with our Bulletin Board System (BBS). Feel free to contact us for suggestions in software. Curricula have been developed for IBM 386 (with math coprocessor), 486, and Pentium class computers, with some modified to work on the Macintosh as well. Digital Image Processing Workshops: Workshops on digital image processing with the Remote Access Astronomy Project are conducted at various professional meetings and here in Santa Barbara. The workshops provide you with hands on experience in digital image processing and provide you with background material in photometry, CCD imaging, and general observational astronomy. If you are interested--contact us for scheduling. For More Information: For more information please write us, e-mail us, or leave messages on the BBS. We hope you take advantage of the many educational services offered by the Remote Access Astronomy Project. 8 9 RAAP SYSTEM USER’S MANUAL BBS Phone: (805) 893-2650 e-mail: [email protected] WWW site: http://www.deepspace.ucsb.edu/ The RAAP System User’s Manual: The following is a guide to using the services offered by the Remote Access Astronomy Project. Outlined here are instructions on how to use the Bulletin Board System (BBS) and the Remotely Operated Telescope (ROT) to effectively participate in the RAAP program. 10 REMOTE OBSERVATION TELESCOPE The Remote Observation Telescope system is available for you to use. In order to make use of it, your system must have a modem, a ZIP decompression routine, and a software package that accepts FITS format images. The image files you will receive will take about 2 minutes to download at 14,400 baud, or around 15 minutes at 2400 baud. The RAAP Bulletin Board has a 14,400 baud modem. It is recommended that you not use a modem slower than 2400 baud. Selecting an Image The first step in requesting an image is to select your target. Consult a star chart of some sort to find what is visible that night. Look up the exact coordinates, magnitude, and size on a table. For efficient use the object should not be dimmer than 15th magnitude and should have a minimum angular size of 30 arc seconds for extended galaxies or nebula. In order to simplify this process, there is a text file, "OBJ_LIST.ZIP", in the UCSB Telescope Images download section that contains hundreds of visible objects that fit these parameters. Request Files In order to place a request, you must prepare a request file. We have a form on our WWW server to generate the file automatically, or you can create one by hand and upload it. This is an ASCII file containing all of the information about your request. The Request File may be prepared with a normal text editor. It may also be assembled with a word processor but it MUST be saved as an ASCII text file. The format should be: USERNAME: <Name> TITLE: <Title> RA: hh.mm.ss DEC: dd.mm.ss Time: ###.# FILT1: # FILT2: # GAIN: (1 or 4) COMMENT: <Text> - Your Username on the RAAP Bulletin Board - Title of your observation (for your records) - Right Ascension (hours.minutes.seconds) - Declination (degrees.minutes.seconds) - Exposure time in seconds - Filter from wheel #1 - Filter from wheel #2 - System gain (set to 4 for normal objects) - Comment for personal use The filename for this file is limited to eight characters and needs to be acceptable to MS-DOS and have the ".REQ" extension. In order to prevent confusion on the bulletin board try to make your filenames unique. One method is to use the first three letters of your first name (or your school’s initials) followed by the first three of your last name and a two digit index number. Using this method the filename for Charles Messier's third request would be "CHAMES03.REQ". The components of this file should be fairly self explanatory. The "RA" and "DEC" lines correspond to the celestial coordinates of the object that you wish to view. Note that the hours, minutes, and seconds are separated by periods. "TIME" is the exposure time for the image. Acceptable times at the present would be from 0.3 seconds (for very bright objects) to 1 minute. "FILT1" and "FILT2" allow you to set a filter combination. The list of available filters is in the next section. If no filters are specified, then the system will default to no filters. The system gain adjusts the sensitivity of the CCD. For normal observation this should be set at 4. If the object is very bright, then request gain 1. The 11 comment is to allow you to describe the image such as "M 57" or "Pelican Nebula" for your own records and also to help insure that the image you receive was properly aimed. Filters Numerous filters for astronomical use are available. These filters confine the spectral response of the CCD to predefined portions of the Electromagnetic Spectrum and are useful in producing color composites, obtaining photometric data, or making calculations on a star’s physical characteristics (such as its temperature and size). Remember that filters will reduce the light falling on the CCD and will subsequently require increased integration times (longer exposures). Available filters are: Filter Wheel 1 1 Polarizer1 2 Polarizer2 3 BG39-Blue 4 RG645-Red 5 BR14-Blue 6 RG610-Red 7 U-Glass 8 Empty Filter Wheel 2 1 Light Pollution 2 H-Alpha 3 I-Band 4 R-Band 5 V-Band 6 B-Band 7 U-Liquid 8 Empty Selecting 8 from both filter fields allows the camera to see the sky without any filter in place. Retrieving the Image It may take a few days to process the image request. This, obviously, is influenced by weather conditions and will vary a bit. Once the image has been taken, it will be compressed along with the Dark, Flat, and the original Request File into one with the same filename as your request, but with a ".ZIP" extension. To retrieve it, go to the Files Menu on the bulletin board and select "D" to download it. Follow the prompts to select the file and protocol, and you will have your image. 12 Example Request File Let us suppose that Charles Messier wants an image of the Orion Nebula. He thinks it would be good on a 35 second exposure and is interested in examining it in the I band (infrared). He has been keeping a record of his image requests and knows that this is his 42nd. His file request would look like this. Filename- CHAMES42.REQ USERNAME: Charles Messier TITLE: Orion Nebula RA: 5.35.24 DEC: -5.27.0 TIME: 35 FILT1: 8 FILT2: 3 GAIN: 4 COMMENT: Also known as NGC 1976 This file gives all of the necessary data and has a unique filename. When he downloads later, he will download CHAMES42.ZIP which, when decompressed, contains CHAMES42.FTS (the image), and CHAMES42.REQ (the original request). Darks and Flats will also be available on the BBS for Downloading (see next section). 13 CCD ASTRONOMY- A Brief Introduction Charge Coupled Devices (CCD’s) have revolutionized modern astronomy and astrophotography. A CCD is an array of tens of thousands to millions of solid state light detecting photosites placed on a single silicon microchip. Light falling on the chip is recorded as an electrical signal by converting photons to electrons. Chip sensitivity is ten times that of the fastest photographic films and is linear in response (which films are not). The number of photons converted to electrons (the chip's quantum efficiency) is on the order of 50%. These advantages as well as the digital nature of the data make CCD devices ideal for astronomical imaging. With the advent of high speed low cost microcomputers it is now possible for everyone to benefit from CCD technology. Raw CCD images are exceptional but not perfect. Due to the digital nature of the data many of the imperfections can be compensated for or calibrated out of the final image through digital image processing. Composition of a Raw CCD Image A raw CCD image consists of the following signal components: TARGET SIGNAL - The signal from the source target. Electrons are generated from the actual source photons. BIAS SIGNAL - Initial signal already in place on chip before exposure is taken. Electrons already there due to electronic chip biasing and A/D offset. THERMAL SIGNAL - Signal (Dark Current thermal electrons) due to the thermal activity of the semiconductor. Thermal signal is reduced by cooling of the CCD to low temperatures. Sources of Noise The raw CCD image is susceptible to the following sources of noise: PHOTON NOISE - Random fluctuations in the photon signal of the source. The rate photons are received is not constant. THERMAL NOISE - Statistical fluctuations in the generation of Thermal signal. The rate at which electrons are produced in the semiconductor substrate due to thermal effects is not constant. READOUT NOISE - Errors in reading the signal generally dominated by the on-chip amplifier. QUANTIZATION NOISE - Errors introduced in the A/D conversion as a result of how large a number the signal can be mapped to. For example, if the A/D converter can only map to a number between 1-16 we will have more error than if the conversion is to a number between 1-256. The ROT CCD A/D range is 0 - 4095 (12 bits). SENSITIVITY VARIATION - Sensitivity variations from photosite to photosite on the chip or across the chip. Modern CCD’s are uniform to better than 1% between neighboring photosites and uniform to better than 10% across the entire surface. 14 The Processed Image The processed image will be one where the Bias and Thermal signals have been removed and the Noise effects have been reduced as much as possible. Noise Corrections REDUCING NOISE - Readout Noise and Quantization Noise are limited by the construction of the CCD Camera and can not be improved upon by the user. Thermal Noise, however, can be reduced by cooling of the CCD (temperature regulation). The Sensitivity Variation can be removed by proper flat fielding. ***FLAT FIELDING - A record of the photosite to photosite sensitivity variations can be obtained by taking an exposure of a uniformly lit "flat" field. These variations can then be divided out of the Raw image to produce an image essentially free from this source of error. Any length exposure will do, but ideally one which saturates the pixels to the 50% or 75% level is best. CORRECTING FOR THE BIAS AND THERMAL SIGNALS - The Bias and Thermal signals can be subtracted out from the Raw image by taking what is called a Dark Exposure. The Dark exposure is a measure of the Bias Signal and Thermal Signal and may simply be subtracted from the Raw Image. ***DARK EXPOSURE - The Dark Exposure is simply a capped exposure (shutter closed) taken with the same exposure length as the Raw Exposure. The Dark Exposure is a direct measure of the Bias Signal and Thermal Signal and can be used to subtract these effects from the Raw Image. The Dark Exposure should be taken at the same time in the evening as the Raw Exposure was taken to more accurately reproduce the Bias and Thermal effects of the time. The Final Processed Image The final Processed Image which removes unwanted signals and reduces noise as best we can is be computed as follows: Final Processed Image = (RAW - DARK) / FLAT In downloading observation files from the BBS, you will also need to download the Dark and Flat exposures needed to perform the image analysis procedures described above. Various exposure length Dark exposures are supplied. Be sure to use one with the same exposure length as your observation. 15 PHOTOMETRY Photometry is the quantification of a star’s brightness and can be technically quite challenging yet reveal a lot about a star’s physical characteristics. A star’s distance, composition, internal structure, size, and temperature can all be deduced through careful photometry. Some digital image processing software will allow you to perform CCD photometry quickly, easily, and efficiently. Theoretical Background The total energy put out by a star is known as its Bolometric Magnitude. This is the combined energy emitted by the star over all the wavelengths of the electromagnetic spectrum. Heuristically, one can say that a star has different brightness at different wavelengths or colors of light and that the Bolometric Magnitude is the combined brightness over all the possible colors. The human eye, photographic film, and charge coupled devices (CCD’s) can not measure the total Bolometric Magnitude of a star directly but rather only a small part of it depending on the device’s spectral response (how sensitive the device is to different colors of light). In addition, interstellar gas and dust, the Earth's atmosphere, and the telescope optics will absorb some of the light. All of this occurs as a function of wavelength with some colors being more greatly effected than others. The challenge in photometry is to deal with all of these wavelength dependent attenuation effects to gain useful information on a star's brightness. Historical Development The first attempt to characterize the brightness of stars was made 2000 years ago, long before Galileo's telescope was created in the 16th century. Hipparchus divided the naked eye stars into six brightness classes based solely on the human eye's ability to discern some stars as brighter than other stars. Today we do much better by using photomultipliers and CCD’s for photometry. Hipparchus' original classification scheme is still in use today as the standard of comparison. A first magnitude (m=1) star is 100 times as bright as a sixth magnitude star. This makes each magnitude 2.512 times brighter than the next higher magnitude. A 16th magnitude star (which is within the capabilities of the Remotely Operated Telescope) is only one-millionth the brightness of a first magnitude star (a relatively bright star in our night time sky) and one ten thousandth the brightness of a sixth magnitude star (the dimmest stars of the night time sky seen with the unaided eye). So we see that we are able to detect and work with very dim stars and that small differences in Hipparchus' magnitude values for these stars correspond to large differences in their actual brightness. CCD Photometry To perform CCD Photometry one must select a stable calibration star in the same field of view as the target object. This calibration star with its precisely measured known magnitude can thus be used for comparison with the target object. In aperture photometry, concentric circular apertures are used to compute the sky subtracted flux of a star. The inner circle is made large enough to cover almost all of the 16 flux from the star, and the outer one is large enough to obtain a good sky value but should not be too large. Digital image processing software will compute the flux of your target star and compare it with the known flux of the calibration star. Your final answer will depend on the accuracy of your calibration star and on properly selected radii for the concentric circles. UBVRI Color Indices Different filters can be placed over the telescope optics, and photometric magnitudes can be computed. This can yield very useful photometric data which can be used many ways. For example, a measure of temperature often used in astronomy is the difference between the apparent magnitudes measured in two spectral regions. For example, B - V (blue minus visual). The difference B - V is called the color index of the star. The blue magnitude (B) measures bluer radiation than the visual magnitude (V). A very hot star is brighter in the blue than in the visible, thus V is fainter. The B - V color index is zero for an "A" class star of about 10,000K. Tables will give the corresponding temperatures for other color index values. Variable Stars Many stars are variable in their light output. Some of these stars are variable due to internal structure while others are variable due to eclipses by a binary partner. In either case, analysis of the light curve can lead to a better understanding of the star. There are over 25,000 cataloged variable stars (plus countless others uncataloged). Scientists do not have the people or the resources to monitor even a small fraction of these stars. Large telescopes are put to use to look at dim, diffuse, or distant objects and can not be dedicated to monitoring any single star. Due to continued demand of telescope time by other scientists and projects, the responsibility for the monitoring of variable stars falls on the amateur. It is here that the amateur with limited telescope resources can make significant contributions to real science. The American Association of Variable Star Observers (AAVSO) was founded in 1911 to coordinate the efforts of amateur astronomers world wide and to compile and summarize the millions of observations into useful material that can be distributed to the general scientific community. The ROT is an ideal instrument for contributions to variable star research. For more information on the AAVSO, consult the RAAP BBS or leave mail for the SYSOP. Photometric Projects The photometry of stars is of fundamental importance to astronomy as it provides a direct measurement of the energy output of stars at several wavelengths, and thus sets constraints on the models of stellar structure. Student projects could be set up to calculate the temperature of certain stars by color index, or to calculate the size of a star if we know its distance. Repeated observations on a given variable star over time can be used to construct a light curve from which the physical properties of the star or binary system may be deduced. Participation with the AAVSO could result in your data being put to good use and being made readily available to the scientific community. Also, the AAVSO could provide you with light curves for your chosen star spanning many years for your own analysis and deductions. Monitoring of a distant supernova could be used to construct a light curve to show whether it is of type I or type II. The light curve could then be used to collaborate with 17 others taking photometric data and eventually be compared with publicly released material. Asteroids or comets can be monitored. Deviations in photometric magnitude can be correlated to reflectivity variations on the surface of the asteroid, breakup of a comet’s nuclei, or angle of approach. It should be clear that there are numerous projects to involve students in such a way that they feel that they are a part of science, rather than merely non influential observers. The goal of the RAAP project is to bring real science to the classroom, and what better way than to let students conduct real science by running their own research projects using a remotely operated telescope through the Remote Access Astronomy Project. Their science will be contributory in nature and using the centralized BBS system may result in rewarding collaborations between many different schools and even professional researchers. 18 19 LAB EXERCISES & ACTIVITIES BBS Phone: (805) 893-2650 e-mail: [email protected] WWW site: http://www.deepspace.ucsb.edu/ Lab Exercises & Activities: Following is a sampler of digital image processing exercises and activities for high school and college students. These exercises and activities can be used “as is” in conjunction with the Imagine-32 software--or can be modified to work with any software package you choose to work with. Imagine-32 is available from: ISIS, Inc. 323 Love Place, Suite D Goleta, CA 93117 Voice: (805) 692-2390 Fax: (805) 692-2391 Lab activities written and prepared by: Lab activities written and prepared by: Jatila van der Veen Roger Freedman All of the needed images may be downloaded from the RAAP World Wide Web server or from the AstroRAAP BBS. 20 GETTING STARTED USING IMAGINE-32 IMAGINE-32 is a professional-quality image processing program, which is a powerful tool for analyzing digital images. It is similar to the programs that the scientists at NASA, JPL, and other research institutions use. There is no substitute for reading the manual; however, the following description of the icons that are most frequently used may be helpful in getting started. 1) ! The "floppy disk" icon is used to call up a menu of available images. The top line of the image menu contains the path drive:\directory\*.ext of the images. The default file extension is .FTS. You can change the path where the program searches for images by clicking on the top line, deleting the text, and retyping it. The images provided with this manual all have the file extension ".FTS". If you click the RIGHT mouse button on the floppy disk icon, this will bring up a list of available file formats that IMAGINE-32 can handle. If you wish to change file format, just click the LEFT mouse button on the name of that extension. 2) The "exploding arrows" icon is used to enlarge an image. The icon right next to it, with the arrows pointing inward is - you guessed it! - used to shrink an image. 3) Pal This icon calls up the palette feature. By clicking the LEFT mouse button on the palette icon, you call up the box palette. This is the default palette option. A box will appear in the lower left-hand corner of the screen. If you click the mouse in the box, then move it around, you will change the colors of the image. When you get a color scheme you like, click the mouse again, and the colors will stay. To get back to black and white, click on the icon that is half black, half white. If you click the RIGHT mouse button on the palette icon, a pallet options menu box will appear, and you have the option of selecting the box or graph palette, or loading a palette that has already been saved. If you click the left mouse button in the graph palette option, then click on Okay and the Palette Options Menu box will disappear. Click the LEFT mouse button on the Pal icon again, and this time graphs of the red, blue, and green hues for each pixel will appear in the upper left hand corner of your screen. You can change the way your image is colored by adjusting the three primary colors individually. You can accomplish this either by clicking-and dragging the mouse along each primary color graph separately, or by selecting to scale each color as a function, f(x). The sum of red+blue+green values for each pixel is displayed on the bottom graph, with the lowest pixel intensities on the left. If you design a palette you particularly like for a certain image, you can save it as “<name>.PAL”. You can attach any palette to an image by selecting the Effects option from the top menu bar, and then selecting Attach Palette from the pull-down menu that appears. 4) HIST “HIST” stands for histogram, which graphs the number of pixels of a given value versus the pixel value. FTS images all have histograms attached to them, which allows you to effectively "adjust the exposure" of the images. Each image has 256 possible colors, or shades of gray available. IMAGINE-32 automatically reads the histogram of each image you select, and scales the 256 available shades to the range of pixel intensities for that image. When you click on the HIST icon, a window appears, with a graph of the histogram of intensities. Two red lines show you the range of intensities to which the program scaled the 256 available shades. The default is to scale to the standard deviation. By holding the left mouse button down on the up or down arrow, you can adjust the red lines to limit or expand the scale. Generally, to see the best details, you should limit the red lines to cover the range in which the majority of pixels fall; this usually means that the range of pixels included in the red lines resembles a jagged Gaussian curve. 21 5) +− The "math symbols" icon is used for manipulating the images. When you click on this icon, ×÷ a pop up window appears with choices of the mathematical operations you can perform on an image. These include digital or spatial filters, adding or multiplying the image by a constant or an array, masking, etc. This feature is only used in the COBE lab. For a detailed description of each filter, see the IMAGINE-32 manual. 6) Squiggly lines The "squiggly lines" icon allows you to see the pixel intensities plotted graphically across the image, as a function of x or y position. You can save the values as an ASCII file, which you can later graph with any graphing program. 7) " The “scissors” icon allows you to box off a portion of an image. You can then use the exploding arrows to expand this piece of the image. This feature is useful for examining details of images, such as volcanic plumes in the images of Io, or sunspots and solar flares in images of the Sun. 8) trash can The “trash can” icon clears the current image from the screen. It does not destroy the image from your hard drive. These are the main icons that you need to be familiar with as you begin the image processing labs. You will learn by experimenting with the program yourself! So, have fun! If you have questions, comments, or suggestions regarding the labs or tutorials, we would like to receive them! You can leave a message for Jatila Van der Veen on the AstroRAAP bulletin board: 805-893-2650, or via e-mail for [email protected], or write to the Remote Access Astronomy Project, Physics Department, University of California, Santa Barbara, Santa Barbara, CA 93106, attention: Jatila van der Veen, Curriculum Development. 22 23 PC READY LAB ACTIVITIES The following group of lab activities has been written to give students an in depth laboratory treatment of digital image processing software. Although these exercises are specific to ISIS’s Imagine-32 Software, the general features being emphasized should be available in other software packages as well. The required image files are supplied on the disks given. Labs for Introductory Astronomy 1. 2. 3. 4. 5. 6. Introduction to Digital Image Processing Color Mixing with Imagine-32 Tri-Color Imaging of the Orion Nebula Monitoring the Variations in Magnitude of SS-Cygni Investigation of M16, an Open Cluster in Serpens Finding Light Curves of Supernovae using RAAP CCD Images Labs for Introductory Physics 1. 2. 3. 4. 5. Volcanoes on Io Craters in the Solar System Kepler’s Laws and the Orbit of Mercury The Moons of Saturn Tracking Sunspots Introductory Cosmology Labs 1. COBE for (Big) Kids 2. If Its Not Dark, It Doesn’t Matter Astronomy Labs for General Physical and Earth Science 1. Measuring Angles in the Sky Using Fingers of the Hand 2. Tracking the Sun 3. Investigating Impact Craters 24 25 RAAP Introductory Astronomy Activity: INTRODUCTION TO DIGITAL IMAGE PROCESSING Jatila van der Veen, Adolfo Camarillo High School and RAAP/UCSB Images used in this activity were provided by Mark Parker and others at UCSB, and taken with the UCSB Remote Access Telescope. This lab may be reproduced for use in a classroom in any form, however no part may be reproduced for publication without the written consent of the author. To the Student: This is a VERY BRIEF introduction to the modern methods of digital image processing, intended for those who want to get started and have never manipulated images before. For a more in-depth treatment of the subject, please refer to the literature! We offer some suggestions at the end of this lab... In this activity we shall attempt to answer some “FAQ’s” about digital image processing, and then give you some practice with some of the more common processing techniques. Part 1. Some FAQ’s (Frequently Asked Questions) About Digital Image Processing 1) What exactly IS a digital image? A digital image is a picture which is divided into a grid of “pixels” (picture elements) in which each pixel is defined by three numbers, and displayed on a computer screen. The first two numbers give the x and y coordinates of the pixel, and the third number, or z coordinate, gives the intensity value, relative to all the other pixels in the image. The x and y coordinates of each pixel relate it to the actual location on the CCD (Charge Coupled Device - more on that in the next FAQ!) of the photoelement that collected the light which is displayed in that pixel. The z coordinate is a measure of the amount of light collected by that photoelement. You can think of the (x,y,z) coordinates of each pixel as a vector in 3-D space, where the “height” relates to brightness instead of elevation, for example. In fact, in the more sophisticated image processing programs, you can even make 3-D plots of an image, where the “height” represents the brightness. The clarity of a digital image depends on the number of “bits” the computer uses to represent each pixel. The most common type of representation in popular usage today is the “8-bit image”, in which the computer uses 8 bits, or 1 byte, to represent each pixel. This yields 28 or 256 brightness levels - possible colors or shades of gray available within a given image. This is the way in which IMAGINE-32, the program we use at UCSB, handles our digital images. Other more expensive programs and computers can utilize 12 bits or 16 bits per pixel, yielding 212 (4,096) and 216 (65,536) brightness levels to represent the shading in an image. For example, here is a picture of the quasar Markarian 205, which was taken by Mark Parker with the 14” telescope at UCSB, using a camera with a CCD of 576 x 384 pixels: Markarian 205 is the smaller elliptical object to the left of the galaxy. 26 In the next image, the quasar has been “cut out” of the original image, and expanded. You can begin to see the pixels... Expand further, and you can REALLY see the pixels. The range of intensity values (also called pixel values, or A/D units) in an image also depends on the way in which a particular CCD handles its ANALOG TO DIGITAL (A/D) conversion. Our CCD at UCSB does 12-bit A/D conversion, which means that each image is capable of 212 or 4096 intensity values. Since our image processing program only handles 28 or 256 brightness levels, these must be divided among the total range of intensity values in a given image. We can change the way in which the 256 brightness levels are distributed among the 4096 pixel values with the HISTOGRAM feature of the program... 2) Wait a minute! Before you go talking about histograms, tell me: What is a Charge Coupled Device, or CCD, in the first place, and how does it take a picture? A CCD is a small light detector, measuring around 10 to 20 millimeters on a side, made up of an array of a few hundred thousand micrometer-sized light collectors, or photocells. Each photocell on the CCD corresponds to a pixel in the image. The photocells themselves are very small Metal Oxide Semiconductor (MOS) capacitors, which are all linked by very tiny circuits, on a silicon chip. Charge is created in each MOS capacitor by the photoelectric effect, and then transferred in an orderly way across the CCD to a collector. The variation of the electric signal at the output is proportional to the incident radiation falling on each photosite of the chip. The CCD has pins around its edges, so that it can be connected with the rest of the circuitry of the system. At the output stage, the charges are converted into a voltage which is measured at the output pin of the CCD. Each row of charge is transferred across the CCD, one row at a time, and read as a “∆V” (change in voltage) from a predetermined reference level. The ∆V is directly proportional to the charge which accumulated in each photosite, and the charge is directly proportional to the number of photons collected by the photosite. Since the registers at the output stage are emptied in a finite period of time, which occurs until all the rows of charge have been transferred across the CCD, this gives rise to a time-varying voltage, or ANALOG signal. This analog signal must be converted into a digital signal, in which the ∆V’s are translated into a number between 0 and 4096. These numbers become the pixel values in the image which you see. 3) How is an MOS capacitor different from the electrolytic capacitor we blew up in physics class last year? Well, if you REALLY want to know, may we suggest the book CCD ASTRONOMY by Christian Buil. Very briefly, however, the MOS capacitors are tiny p-n junction diodes. (Perhaps you have used light emitting diodes, or LED’s in your physics classes...) They are made up of a tiny wafer sandwich of a semiconductor - usually silicon -, an insulating layer of silicon dioxide a few microns thick, and a metallic electrode, called a gate. The silicon is doped to make it a p-type semiconductor, and the gate is a conductor. The sandwich of semiconductor - insulator - metal makes a capacitor. Without getting into the theory of p-n junction diodes, suffice it to say that a zone of depletion of charge carriers, called a potential well, is created across each MOS capacitor by applying a forward bias voltage of around 10 volts. The tendency of the semiconductor materials is to fill those wells with electrons until equilibrium is reached, and charge no longer flows. This filling of the potential wells can be accomplished in a number of ways to create an electric signal: the DESIRED way is for photons to strike the surfaces of each MOS capacitor and liberate electrons via the photoelectric effect, and cause charge to accumulate in each potential well. This constitutes the SIGNAL; all other ways of filling the potential wells - by thermal agitation, or other spurious charges floating around - constitute NOISE, and we want to eliminate as much of the noise as possible! 27 4) What are the sources of noise, and how do I tell noise from signal when I analyze an image? a) the DARK CURRENT There are a number of sources of noise in a CCD, but the only one that you as a user can measure and eliminate is the dark current. The rest must be taken care of by the manufacturer, and should all be listed on the package! The dark current is caused by thermal agitation of the electrons when the forward bias voltage is applied, even when no outside light is falling on the CCD. This causes the potential wells we spoke about in the last question to fill, and the MOS capacitors to return to equilibrium. When that happens, no current will flow any more. The time until the capacitors reach equilibrium is called the relaxation time. The time during which a CCD is exposed to light and charge builds up by the photoelectric effect is called the integration time. The trick is to make the total of the integration time and the time for the charges to be transferred across the CCD and output, less than the relaxation time of the MOS capacitors. This is done by keeping the CCD cool and at a uniform temperature, usually around -45o F or less. The better the temperature of a CCD is cooled and kept regulated, the less dark current there is, however almost all CCDs have some dark current, which contributes to noise in the signal. When you process an image correctly, you must account for this dark current, and subtract it out from the image. This is done by basically taking a “closed shutter” image of a dark background, and then subtracting this dark image from the ”raw” image of the starfield you are observing. The CCD used with the UCSB remotely-controlled telescope is kept at -45oF, and has a dark current of around 6 electrons/second, which is considered VERY GOOD. b) the SENSITIVITY VARIATION Another source of noise is the inherent variation in response of each MOS capacitor. Ideally, if your CCD is functioning properly, there should be no variation in pixel value when the shutter is closed and you are measuring the dark current. However, nothing is perfect, and there usually is some slight variation in the sensitivity of each MOS capacitor to incident radiation. This can be accounted for by taking a picture of a uniformly bright field and dividing the raw image by this “flat” field. This process is called “flat fielding”. The length of time to expose the flat image should be enough to saturate the pixels to the 50% or 75% level. 5) So I actually need three pictures before I can begin to process my image? Well, to put it bluntly, YES. You need a dark exposure, a flat exposure, and the actual picture of your target. In fact, to be TOTALLY rigorous, you need FOUR pictures: the original, a dark exposure of the same integration time as your original, a flat exposure, and another dark exposure, of the same integration time as your flat exposure! Often, however, you can use the same dark exposure for both. Before you can begin to really analyze the information contained in your image, you should create an image which is as accurate a record as possible of the actual light flux on the CCD. You create the final image which is ready for further processing by doing the following image subtractions and divisions: FINAL IMAGE = (RAW IMAGE - DARK EXPOSURE1 ) / (FLAT EXPOSURE - DARK EXPOSURE2) where DARK EXPOSURE1 has the same integration time as the RAW IMAGE, and DARK EXPOSURE2 has the same integration time as the FLAT EXPOSURE. If the picture itself and the flat exposure have the same integration times, then you can use the same dark exposure for both subtractions. When you request images to be taken with the UCSB Remote Access Telescope, you also need to request the appropriate dark and flat exposures. There are a number of dark and flat exposures of various integration times that have already been taken in the DARK and FLAT file areas of the RAAP “home page” on the World Wide Web. In the program IMAGINE-32 for the PC, the manipulations are done with the “math symbols” icon, by first doing the subtractions (“array - array), and then doing the division (“array / array”). Because of some errors at the edge of the image, you will get the message “division by zero error”; not to worry! Just use the 28 ✄ (“scissors”) icon and cut off the edges of the final image. Then adjust the upper and lower limits of the image with the HISTOGRAM function. 6) There you go again, throwing around fancy terms! What is a HISTOGRAM in a digital image? The histogram tells you the total range of intensity values within a digital image, and the number of pixels which have a given value. Recall that the total range of possible intensity values in any image depends on the way in which your CCD does its A-to-D conversion. The CCD on the UCSB telescope is capable of 212 or 4096 intensity values. Our image processing program, however, is only capable of 256 colors or shades of gray. With the histogram function in IMAGINE-32 you can “stretch” or “squeeze” the scale of 256 brightness levels by changing the limits of the red lines in the histogram box. Setting the lower limit tells the program to assign a color value of 0 to every pixel value below the lower limit; setting the upper limit tells the program to assign a color value of 255 to every pixel value above the upper limit. The program then distributes its available 256 shades of gray among the 4096 intensity values according to the limits you set. In this way you can highlight certain features. Sample histogram Intensity values are plotted on the horizontal axis, with lowest intensities to the left. Y-values on the plot tell the number of pixels with a given intensity. Vertical lines are set by the user to define the minimum and maximum values. All values below the lower limit are set to zero; all values above the upper limit are set to 255. If you are using IMAGINE-32, try this yourself: bring an image onto the screen by clicking on the ! (“floppy disk”) icon, and then clicking on the HIST icon. The histogram will be displayed in the upper left corner of the screen. Hold down the left mouse button on the down arrow on the minimum side, and notice the left red line move down. Click on Plot, and the program will replot the image, scaled to the new limits which you just requested. Try changing the upper limit also, and see what happens to your image. Find the best scaling for your image! Adjusting the histogram of a digital image has an effect on your digital image similar to adjusting the exposure in a regular photograph. An over-exposed photograph will appear washed out, while an under exposed one will appear too dark. 7) ARE THERE OTHER WAYS OF PLOTTING THE IMAGE? Yes! The most common ones are linear, logarithmic, and histogram equalization. a. linear scaling The response of the CCD to the incident light is linear, which means that each pixel value is directly proportional to the amount of charge that accumulated on the photosite that corresponds to that pixel, and the amount of charge is directly proportional to the amount of light that the photosite received. The image is normally plotted with a linear scale, meaning the graph of all the intensity values from 0 to 255 is a straight line. This is the default option of IMAGINE-32, and of most image processing programs. b. logarithmic scaling This option is sometimes used to highlight faint features, but often has the disadvantage of “washing out” the image. The graph of intensity values in this case is not a straight line; instead, the program scales each pixel value by its log, and distributes these values among the available 256 brightness levels. More low pixel values are given higher brightness values than with the linear scaling option. 29 c. histogram equalization This option distributes the 4096 pixel values available in the image evenly among the 256 brightness levels available in the program, so that there are equal numbers of pixels for each level of brightness. The following examples show a picture of M42, the Orion Nebula, taken with an infrared filter by Mark Parker using the 14-inch UCSB telescope, with a 384 x 576 CCD. The first image was plotted with the usual linear scaling, the second with logarithmic scaling, and the third with histogram equalization: linear scaling logarithmic scaling histogram equalization Now, with whatever image processing program you have, open an image of a nebula or starfield, and try plotting it with these different scaling options. If you are using IMAGINE-32, the icon that will give you the scaling options is labeled Plot. The same icon also allows you to make contour plots, in which the program will draw red lines connecting pixels of equal intensity, like a topographic map which connects points of equal elevation. (Some of the more powerful image processing programs, such as MIRA by Axiom Research of Tucson, allow you to make 3-D contour plots as well.) 8) What about color? All the pictures you have shown so far are in black and white, but how did they make all those beautiful pictures we see from the Hubble Space Telescope? Well, there are two basic types of color images that can be made with a CCD and image processing technology: false color and true color. False color images are made with the image processing program, in which you assign a combination of red, green, and blue (RGB) to each brightness level. You can control the percent of each primary color in a given brightness level with the Palette feature of your image processing program. Recall the way in which the terms brightness level and pixel value are used here: pixel value = the “z coordinate” of each pixel, and is a number between 0 and 4095 for a CCD with 12-bit A/D conversion, such as the one we use at UCSB; brightness level = a number between 0 and 255, to which a RANGE of pixel values are assigned, for 8-bit image processing, of which the program IMAGINE-32 is capable. False coloring of an image is useful when: * the image was taken at a frequency range that human eyes can’t see, such as radio, microwave, infrared, and you want to indicate variations in the signal intensity; * you only have one image taken with no filters of a planet such as Neptune, and you know what color it is supposed to be, so you make an artificial palette which will give you the appearance of the blue planet with its white clouds. True color is more complicated, as it requires you to take 3 separate pictures of the same target, then add them with your image processing program. This is how they make all those pretty pictures at NASA! There are such things as color CCD’s, but they are much more expensive and not as accurate as normal CCD’s, and no one really uses them much. The most common practice is to take a picture of the same target with a red, a green, and a blue filter, and digitally add them. Each image will appear black and white when you look at it with your image processing program, however you must remember that the pixel values are indicating the intensity of light of the color or frequency range that was admitted by that particular filter! 30 When you add the three images digitally, you are adding a certain percent of red, green, and blue light, and the program will figure out the true color of each pixel from that information. True color images are useful when: * you really want to know the true colors of something; * you want to learn more about the chemical composition of a nebula; (For example, excited hydrogen looks pinkish-reddish, and shows up best when viewed with a red filter.) * you want to learn more about the temperature of a group of stars. (For example, blue stars are hotter than yellow, which are hotter than red.) If you want to learn how to make tricolor images, may we suggest trying our lab “Tri-Color Imaging of the Orion Nebula”. This lab was designed to give the novice practice with aligning images and overlaying them to get true color portraits. When you request images with our telescope, you can also request a red, green, and blue image be taken of your target so that you can make true color portraits of your favorite nebulae and galaxies! 9) Okay, well isn’t this just a lot of trouble? Why not just get some high-quality astrophotography film and take a color picture? That is fine if you want to stay up all night looking at just ONE target! But, tricolor imaging is not the only benefit of using CCD’s and image processing techniques. The fun part is that if you are clever, you can extract much more information from a digital image with filtering techniques than you can from a photograph... ...which brings us to Part 2. Practice with Signal Enhancement and Digital Filtering The practice of trying to extract information out of digital signals is quite old, and hearkens back to the methods of the Fast Fourier Transform (FFT) which were devised at IBM in New York way back in the 1950’s, when computers were built with vacuum tube technology. The processes of digital image enhancement are extensions of those ancient practices to modern equipment, but the underlying principles are the same. Basically, ANY signal can be reduced, in theory at least, to a sum of sines and cosines, or relatives thereof, of varying frequencies and phases. In digital signal enhancement we attempt to accentuate the components of that signal which carry the information we want, and reduce to insignificance those components which carry the noise. Your audio equipment - stereo, CD player, etc. - does this for linear, time-varying signals. In image analysis we are dealing with 2-dimensional arrays which are static in time but vary spatially. Either way, the basic idea is the same - get the most out of your data for the least amount of hassle! Most image processing programs offer a variety of signal enhancement options: spatial filtering, convolution, and Fourier (pronounced “for-ee-yay”) methods. The trick is to apply them correctly, otherwise you introduce more noise, and your image comes out looking totally weird. One of the most common methods, and easy to use is UNSHARP MASKING. The following guided practice utilizes the program IMAGINE-32, by ISIS of Santa Barbara, but you can follow along with any similar program. You can download the necessary images from the RAAP homepage on the World Wide Web: http://www.deepspace.ucsb.edu/ 1) For this exercise you will need to select an image of a nebula, galaxy, or planet with lots of features, which you can download from the RAAP home page. a) You will need to download the raw image, and also the appropriate dark and flat images. With the “math symbols” icon in IMAGINE-32: b) Perform the image subtractions and divisions as described under section 5 above to remove the electronic noise from the raw image. Now you are ready to do unsharp masking. 31 2) Unsharp masking consists of making a copy of the image where each pixel is the average of the group of pixels surrounding it, so that the large features are not disturbed, but the small ones are blurred. (This is the unsharp mask.) Now the pixel values of the original image are multiplied by a constant (“A”), and then the pixel values of the unsharp mask are subtracted from this one or more times (“B”). In this way, the large features are not changed by much, but the small ones are enhanced. Then a low-pass filter is applied to enhance contrast. In most cases the best one to use is the 9x9 mask available with IMAGINE-32. The trick is to choose the right values for the constants A and B. Here is an example of a raw image of M57 (The Ring Nebula) which was sky-subtracted and unsharp masked with A=3 and B=1, and low-pass filtered with a 9mask: M57 - raw image M57 - sky subtracted and unsharp masked (A = 3, B = 2) Here is an example of using unsharp masking to highlight craters on the Moon: Moon crater, raw Moon crater, unsharp masked (A=3, B=2) After you unsharp mask, you can increase the contrast by clicking on the black & white icon and using the arrows to incrementally move the contrast and brightness sliders up and down. In this way you can further increase the contrast of features in your image. OTHER FILTERING METHODS IMAGINE-32, and most image processing programs, offer a variety of options. Some of the most commonly used are the HIGH PASS and LOW PASS masks, the EDGE DETECTION and GRADIENT masks, and filters such as the GAUSSIAN and BUTTERWORTH. Try each of these with your images, and see for yourself what each one does. Check your program manual for details of how the various filters work. Proper application will enhance features, but improper use will make a mess of your image! You will quickly get a feeling for the types of masks and filters to use for different types of images. Have fun, and happy processing! ---------------------------------------------------------------------------------------------------------------------------------For more information, check out the following excellent references: 32 “Image Processing in Astronomy”, by Richard Berry in SKY & TELESCOPE, vol. 87. no. 4, April, 1994 “The Universe in Color”, by Dennis diCicco, in SKY & TELESCOPE, vol. 85, no. 5, May, 1993 AN INTRODUCTION TO ASTRONOMICAL IMAGE PROCESSING, by Richard Berry, Sky Publishing, Inc., Belmont, MA, 1994 CCD ASTRONOMY: Construction and Use of an Astronomical CCD Camera, by Christian Buil, Willmann-Bell Inc., Richmond, VA 1991 33 RAAP Introductory Exercise: COLOR MIXING WITH IMAGINE-32 Jatila van der Veen, Adolfo Camarillo High School and RAAP/UCSB Most people are taught somewhere in the early grades about mixing paints, and are told that the primary colors are red, yellow, and blue. This, as any physicist or astronomer can tell you, is false! The misconception arises because the primary pigments are magenta (a purplish red), yellow, and cyan (a greenish blue), which are actually what are mixed in paints or color newsprint. The primary colors refer to colors of light which, when mixed in equal proportions, give white light. Any image processing program affords students an opportunity to investigate color mixing of primary colors to achieve almost any color imaginable. The following exercise is designed to give you familiarity with : * How you can combine the red, blue, and green values for each pixel using the GRAPH PALLETTE feature; * How you can create your own palette for an unusual false color image; * How to do basic image overlay of a red, blue, and green image to achieve a “true color” image. Go to the program IMAGINE-32 and bring up any picture of a planet. (Be sure the format is .FTS.) The double columns of icons on the left of the screen offer various options for image processing. In this exercise you will use the Pal icon to make color palettes. 1. Click the RIGHT mouse button on the word Pal in the left column. In the box that appears in the center of the screen, click on the words Graph Palette, then Okay. 2. Click the LEFT mouse button on the word Pal now, and the graph will appear. Notice that there are 3 separate functions, R, G, and B, and that the bottom graph shows you the sum of all three. The left side shows the color of the pixels with the LEAST INTENSITY (darkest), and the right side shows the color of the pixels with the GREATEST INTENSITY (brightest) in the original photo. You can change the values in two ways: 1) by clicking on the symbol F(x) in the upper left corner and selecting one of the functions; 2) by clicking and dragging the mouse along any of the graphs. A) First you will see what happens when you make one of the primaries ZERO. 1. Click and drag the mouse along the B graph, so that the B value is as close to 0 as you can make it. WHAT COLOR IS THE IMAGE? ______________ Now to restore the Blue color, click on F(x), Blue, and x for linear plot, then on Okay. 2. Do the same for the G graph. WHAT COLOR IS THE IMAGE? 3. Now do the same for the R graph. WHAT COLOR IS THE IMAGE? R+G=? R+B=? B+G=? R+G+B= ? B) Making your own palette. 1) Make a palette that goes from DARK BROWN for the lowest intensities, to YELLOW for the brightest pixels in your image. Try various different methods - use the function options, including the % option to make a color a flat %. When you have an aesthetically pleasing palette, in which the darkest pixels are dark brown and the brightest pixels are yellow, describe how you arrived at that, and sketch the RGB values for your palette as shown on the graph. 2) Then make a palette that goes from Royal Blue to Cyan to Magenta. Describe and draw it also. C) How they make real color images of things in space: 1) Trash everything on your screen, and click on the black & white icon to return the screen to B&W. Click on the floppy disk icon, and go to the NEBULAE or MESSIER directories. Select any object which has images in R,B, and V. (V stands for VISUAL, and is basically green.) Bring each of these onto your screen. 34 2) Use the “arc in the first quadrant” icon to star align the images. (Ask an astronomy student, teacher, or read in the IMAGINE-32 manual how to do this.) Don’t wrap around. Don’t worry if there are blank lines around one or more borders. You can’t help that. 3) When you have all three images aligned so that the stars are all in the same places, select EFFECTS from the top menu bar; then select the Tricolor option. The program will prompt you for the Red, Green, and Blue images; be sure to select the correct ones! (R = Red; V = Green; B = Blue). Then the program will add the images, and you will have a “true” color image of your target. The particular filter wheel on the telescope that took these images has a poor response in the blue range, so these are not the BEST true color images, but at least this gives you an idea of how they do this at NASA! 35 RAAP Introductory Astronomy Activity: Tri-Color Imaging of the Orion Nebula: What we can learn from COLOR Jatila van der Veen, Adolfo Camarillo High School and UCSB Remote Access Astronomy Project Data contributed by Mark Parker, UCSB Remote Access Astronomy Project This lab may be reproduced in any form for use in a classroom only, however no part of this lab may be reproduced for publication without the written consent of the author. NOTE: Before starting this activity, be sure you have the M42.FTS images in R, V, and B in the appropriate directory (e.g., C:\IMAGINE-32\IMAGES\NEBULAE). These images may be downloaded from the RAAP Internet homepage: http://www.deepspace.ucsb.edu/ . Background Information: The pretty color images you see in books were all made in the past by long-exposure photographs. Today, the same images are made with relatively short exposures, using an electronic imaging device called a CHARGE COUPLED DEVICE (CCD), similar to the chip in your “camcorder’, only more sensitive. A picture taken with a CCD camera assigns 3 numbers to each “pixel” (picture element): an x,y location and an intensity value, relative to all the other pixels in that image. If you take images of the same object with red, blue, and green filters, you can add them digitally with a computer program, and come out with a “truecolor” image of what the object looks like. (How close to “true” your image is depends on the response of each of your filters...See the RAAP User’s Manual or the RAAP homepage for a description of the telescope, filter wheels, and response curves for each filter.) 1. Go to the program IMAGINE-32. Click on the ! (floppy disk) icon to bring up a list of available images. Double click on the following images, one at a time, to bring them onto the screen: M42_V.FTS, M42_R.FTS, M42_B.FTS. M42_B and M42_R were taken with a blue and a red filter, respectively; M42_V was taken with a green filter. The V stands for VISIBLE, because green light is in the middle of the visible spectrum. 2. Shrinking the images: Click on the #$ arrows to shrink each image. Remove the big images from the screen by clicking on the name of the image and then clicking on the trash can icon. (The reason for using shrunken images is that there may not be enough RAM on your computer to do the tricolor manipulations with the big images.) Once you have three small images, drag them to the bottom of the screen. 3. Image aligning: Notice that the nebula is not in the same location in each image. Before you can add the images in a meaningful way, you must align them - otherwise there will be meaningless spreading out of colors. Click on the (“rotate”) icon; then, from the pop-up window in the center of the screen, click on the words Star Align. Select M42_V as the “anchor” image with which to align the others. Select a well defined, round star, which is visible in all three images, as the point on which to align. Click on that star in the M42_V image. 36 Next, select M42_R as the image to move. Click on the same star in the M42_R image as you did in the M42_V image. When the program asks you if you want “Wrap” or “No Wrap”, choose the “No Wrap” option. The program will then calculate another M42_R image, with a different extension in its name, as the aligned image. The new M42_R image will be lined up with the M42_V image! You can trash the original red image now. Repeat this process, aligning the blue image with the same star. You should now have three images all lined up perfectly: the original M42_V image, and the shifted M42_R and M42_B images. Don’t worry about the spaces at the top and bottom; we will cut those out later. 4. Combining the images: Now that you have all three images lined up correctly, click on the word “Effects” from the menu bar at the top of the screen. From the pop-down menu, select the “Tricolor” option. The program will then ask you to select a red, a blue, and a green image. Be sure you select the correct ones! (Remember: V is the GREEN image!) It will then go through a series of calculations, and finally a combined image with the name “Tricolor” will appear. VOILA! There is your true color image of M42, part of the Orion Nebula! 5. Making it nicer... To improve the look of your image, you can use the " (“scissors”) icon to cut out the unused portions of the image. __________________________________________________________________________ Analysis: *What color is the nebula? *What does the color tell you about: a) the composition of the nebula? b) the age of the nebula? *Why is the Orion Nebula so important for our understanding of stellar evolution? Look up the Orion Nebula in your text, and answer these questions: 1. What is the Trapezium? 2. What evidence is there that the stars in the nebula are young, and still forming? 3. What is the cause of the H-α emission of the gases in the nebula? 4. How were the giant molecular clouds behind the Orion nebula detected? 5. What is the “Becklin-Neugebauer” object, and how was it detected? 6. What is the “Kleinman-Low” Nebula? 7. How many solar systems would fit within the Kleinman-Low nebula alone? 8. What kind of nebula is the Orion nebula? 9. So, why are we interested in studying the Orion nebula and the molecular clouds behind it??? 10. If you wanted to go out at night and observe the Orion nebula yourself with a small telescope... a) exactly where would you look? b) what time of year would be best if you are an early morning type of person? an early evening type of person? ------------------------------------------------------------------------------------------------------------------------------------Additional reading: “Exploring the Orion Nebula”, by C. Robert O’Dell, in SKY & TELESCOPE, vol. 88, no. 6, Dec., 1994 37 RAAP Introductory Astronomy Activity: Finding Light Curves of Supernovas using RAAP CCD Images Jatila van der Veen, Adolfo Camarillo High School and RAAP/UCSB Data for this lab supplied by Mark Parker and Shea Lovan, U.C. Santa Barbara Physics Department, with the UCSB Remote Optical Telescope. Data can be downloaded from the RAAP home page: http://www.deepspace.ucsb.edu. This is a “Generic Supernova Light Curve Lab”. We provide general guidelines for downloading supernova data sets from the RAAP homepage, preparing the images for comparison with finder charts, finding the variation in magnitude with the photometry feature provided by IMAGINE-32, and graphing the light curve. Some general references on supernovae are provided for the interested student. Background: Supernovae have fascinated people even before the first well-documented supernova dazzled observers in 1054 AD; its remnant is still observed today as the Crab Nebula (M1) in Taurus, seen in the first image at the top of this page. According to records from the Sung Dynasty in China, this supernova was visible as a “guest star”, which gradually faded after a full year. (See Burnham’s Celestial Handbook, volume III, p. 1846.) More recently, Supernovae 1987A in the Large Magellanic Cloud and 1993J in M81, have provided astronomers with a wealth of information with which to test their models of stellar evolution and supernova genesis. It is estimated that supernovae occur at the rate of 1 per galaxy per century, which means that if you observe a single galaxy every night for 100 years, or 100 galaxies every night for one year, you may be lucky enough to discover a supernova! Rich galaxy clusters such as those in Virgo, Hercules, and Coma Bernices are good places to look for supernovae, and many amateur and research astronomers spend countless hours combing the sky, hoping to make the discovery. In fact, many supernovae ARE discovered each year, but most are in very distant galaxies. Supernovae are named according to the year in which they were discovered, and the order in which they occurred, for example: SN1987A was the first supernova discovered in 1987, and SN1993J was the tenth supernova discovered in1993. Supernovae fall into two general categories: Type I and Type II, distinguished by the presence of hydrogen lines in their spectra. Type I supernovae do not show hydrogen lines in their spectra, while Type II do. These two main classes are further subdivided based on their light curves and other elements visible in their spectra. Determining the light curve of a supernova can help determine what type of supernova it is, and shed light on what type of star it could have come from. Using the RAAP telescope to search for supernovae is one way in which you as a student can make a significant contribution to astronomy, if indeed you can find a supernova and then generate a light curve for it! (In fact, SN1993J was first discovered by an amateur astronomer in Madrid, Spain.) First, however, you should practice finding supernovae with existing data sets (it is not always as easy as it sounds), doing the photometry, and graphing the light curves. In this exercise you can select any data set from the RAAP home page to work with, as you follow the steps in this activity. %%%%☺☺☺☺.... -----------------------------------------------------------------------------------------------------------------------------------38 Step 1. Downloading the data set. In the top line of your NETSCAPE or MOSAIC screen, type in the address of the Remote Access Astronomy Project at the University of California, Santa Barbara: http://www.deepspace.ucsb.edu. Click on the highlighted word IMAGES, and under the Images page, click on the highlighted word Supernova. There you should find several data sets, including the images for SN1993J, SN1995D, and others. Click on the highlighted name of the file you want. You should get a message on your screen asking how you want to save this file. Type in the directory in which you wish to save it, and call the file name.ZIP , where “name” is the name of the data set, and “.zip” is the extension. (For PC’s the extension “.ZIP” is important.) You must also have the program PKUNZIP.EXE so that you can “unzip” this file once you have downloaded it. (“Zipping” is one way of compressing the file so that it will take less time to download. You must de-compress it on your end before you can use the images.) If you do not already have the utility PKUNZIP.EXE, you can also download that from the Utilities page of the RAAP homepage. Each zipped file contains several images, which once unzipped are all in the standard .FTS format. Once you have downloaded the zipped file of supernova images (and pkunzip.exe if you did not already have it), “unzip” the zipped file into the directory where you wish the images to reside, for example: pkunzip <name>.zip C:\IMAGINE-32\IMAGES\SUPERNOV will cause your computer to place the supernova images into the subdirectory SUPERNOV. Now you are ready to run IMAGINE-32 to analyze your supernova images! Type CD \IMAGINE-32 ... to get into the directory where IMAGINE-32 resides. Type IMAGINE-32 to start the program. Click on the ! (“floppy disk”) icon in the top left corner of the icon bar in the program, to bring up the menu of available images. (The menu that appears will differ for each person, depending on how you set up you directories of images.) The menu that appears should display all the images with the extension .FTS in the last directory you were using when you last used the program. Suppose you just made the subdirectory C:\IMAGINE-32\IMAGES\SUPERNOV, as suggested above. You won’t necessarily see those images appear in your menu. Don’t panic; just click on the arrow on the scroll bar to get to the bottom of the menu quickly. Then click on the ..\ symbol and you will see a list of all the subdirectories you have created in the \IMAGES subdirectory. Double click on the name SUPERNOV, and the menu of the supernova images will appear. Now you are ready to do some image processing! ☺ Step 2. Positioning the images so they align with finder charts. When you look at reference charts, such as those available in Burnham’s Celestial Handbook, or from the American Association of Variable Star Observers (AAVSO), the charts are usually oriented with North at the top of the page. When you look through a telescope, however, images are inverted (upside-down) and left-to-right flipped. So, if you try to compare an image taken with the RAAP telescope to a finder chart, you will notice that every star in the image is upside down and right-to-left flipped with respect to the finder chart! No, the finder chart is not wrong; it is set up to match what your EYE would see, but since the telescope inverts and flips the image, you have to invert and flip the other way to make the image as seen through the telescope match the image as would be seen by your eyes (that is, if they could collect enough light!). Example: Here is a raw image taken with the RAAP telescope. The galaxy in the image is NGC2962, a 12th magnitude spiral galaxy in Hydra. Somewhere in this image is lurking a supernova, SN1995D. 39 To make this image line up with the finder charts, it must be flipped vertically, then rotated by 90o. BE CAREFUL: THE ORDER IN WHICH YOU DO THE ROTATIONS MATTERS! Vertical flip followed by 90o rotation is NOT the same as 90o rotation followed by vertical flip! The corrected image should look like this: The icon that allows you to do the rotations and flips looks like the first quadrant of an x-y graph, with a quarter circle colored red: Try it with one of your images... Step 3. Positioning 6 or more images on your screen, looking for the star which brightened. Now that you have all your supernova images, and know how to flip and rotate them to match published finder charts, you will want to get as many images at once on your screen as you can, so that you can visually compare them and find the star that went supernova. The number of images you can fit on your screen at one time depends on how much RAM you have available. Hopefully, you have at least 8 Megabytes of RAM; then you should be able to fit at least 6 images on your screen at one time, if you shrink them down first. 40 A suggested procedure is as follows: 1. Click on the ! icon to bring the first image onto the screen. 2. Click on the “shrinking arrows” icon to shrink the image. 3. Click on the name of the original (large) image, then click on the “trashcan” icon to remove it from the screen. 4. Perform the vertical flip and 90o rotation, as described above. 5. “Trash” the unwanted images, keeping only the final image. 6. Move the final image to the bottom left of your screen by clicking on the name and dragging it while holding down the mouse. 7. Repeat this process for as many of the images as you can fit on the screen. Now visually compare all the images to see which star was the supernova. It should be fairly obvious when you have all the images lined up like this... Suggestion: If you want to save the images you just made, so that the next time you want to use them you don’t have to go through the shrink-flip-rotate process for each image, you can do so by: * clicking on the icon NEXT to the ! icon, that looks like FTS ; * typing in the name you want to call the shrunken, flipped, rotated image; * clicking on Okay when the program asks you to verify your choices. Now that you have decided which star is the supernova, you are ready to do the photometry to find out the change in magnitude QUANTITATIVELY...☺ Step 4. Finding magnitudes with IMAGINE-32’s photometry function. Photometry is the process of attempting to measure the total light reaching the detector (eye, camera, or CCD) from a star, not including the light from the background sky, atmosphere, heat of the electronics near the detector, or any other spurious signals. This can be quite a challenging process! Some idea of the light level of the background sky must be obtained, and there must be a reference star within the field of view whose magnitude is known independently. Before the advent of electronic CCD imaging techniques, the magnitudes of stars had to be determined by measuring their diameters on photographic plates very carefully. The diameter of the image on a photographic plate is related to the magnitude of a star because of the way in which the grains in the emulsion absorb light and are blackened. In a digital image taken with a CCD, the brighter stars also make larger spots on the image, however we can also read the maximum intensities of the pixels which form the star image, and in that way determine the actual flux of starlight hitting the CCD. It is possible to measure the magnitude directly by isolating the star from the background, subtracting the background sky from the image produced by the star, and then relating the intensity of the star to that of a reference star of known magnitude. To actually do the photometry, you should use the original images, not the shrunken ones. (Flipping and rotating is okay, though.) Now that you have determined which star is the supernova, trash all the small images on your screen. Bring the first image onto the screen. The date can be found by clicking on the * at the top of the image, then clicking on the words “View Header”. The date should be in the header. (In fact, it may be convenient for you to rename each image according to either the date it was taken or its sequential number.) We present two approaches to photometry: Process A for those who really want to know the magnitude variation of the supernova, and Process B for those who are only interested in the relative magnitude variation and only want a “seat of the pants” calculation: Process A: The detailed approach. Use this method if you really want to know the magnitude variation of the supernova as accurately as possible. You must know the magnitude of a reference star that appears in each image. IMAGINE-32 will perform “sky-subtracted photometry” automatically, as will most image processing programs. In process B we simply take the default values, however these may not be accurate enough for 41 certain applications, such as if you are trying to verify some published results, and need accurate magnitudes. Before actually going to the Photometry option, you need to do the following: 1. Look at the HISTOGRAM of the image. Find your best estimate of the optimal value for the sky background. The starlight you are trying to measure is a combination of the star as well as the sky, and the program will subtract out the value for the average sky background when it performs photometry. In order to check that the program correctly estimates the sky background to subtract, you should check it yourself first. Write down your estimate of the average sky background level. 2. Look at the ZOOM WINDOW, to get an idea of the maximum and minimum sizes of the stars in your image in pixels, and also to check if they are nicely spherical or somewhat ellipsoidal. (It may be easier to judge the extent of stars if, before using the zoom window, you turn OFF the autocontrast option, so that the pixel shades in the zoom window will match those of the original image. You can do this by clicking the RIGHT mouse button on the magnifying glass icon, then clicking the LEFT mouse button in the Autocontrast box.) In the zoom window, find the diameter in pixels of the average smallest star and the average largest star; you will enter these as your minimum and maximum widths in the photometry procedure. The diameter of a star in an electronic image is defined as the “full width at half max”, or the diameter at 50% of the maximum intensity. As you move the mouse around, the intensity of each pixel is displayed next to the zoom window. Also, look around the image and get a feeling for the shapes of stars. Ideally, stars are spherical, with an asymmetry of 0, however due to atmospheric effects they may appear somewhat elongated. The Asymmetry parameter in the IMAGINE-32 is defined as: asymmetry = 2 ((width in x) - (width in y)) / ((width in x) + (width in y)) In the photometry option you will have the opportunity to input the minimum and maximum values you want the program to use for the asymmetry of stars. 3. Doing the Photometry: first window: a. Set the Sky Level to that which you determined from the Histogram. b. Set the “Sky Sigma” to reflect the average deviation from the sky level that you determined from the Histogram. c. Set the minimum and maximum widths that you determined from the Zoom Window. d. Set the minimum and maximum asymmetry that you determined from the Zoom Window. e. You can set the sharpness parameter as follows: sharpness = (intensity at center of star) / (mean intensity around star) For most applications you can take the program’s defaults. f. Click on Manual. When you have set all the parameters you want, click on Okay. second window: g. Set the inner and outer radii of the aperture within which the program will calculate the sky level. The inner radius should be set large enough to include all the star light, typically twice as large as the value you used for the maximum diameter in the previous window. The outer radius is normally taken as twice the value of the inner radius. h. Click on the box Use Mean. This tells the program to use the mean value between the inner and outer radii in computing the sky value. i. Click on Add Stars, then Okay, and the zoom window will appear in the upper left corner of your screen. You will see a little red dot where the mouse is located. Move the mouse over your reference star and click; a red cross appears on the original window, and a blue cross appears in the zoom window, in (or close to) the center of the star. The program determines the center (“centroid”) of the star based on the parameters you gave it. Move the mouse over the supernova and click again. Hit the Escape key on your keypad twice to return to the photometry menu. j. Now click on the words Calibrate Star. When the zoom window reappears, move the mouse over the reference star and click. In the box that appears, type in the magnitude of the reference star, and click on Okay. k. To see the magnitudes, click on the magnifying glass icon on the left menu bar, and move the mouse over the reference star. There should be a box under the zoom window which tells you the magnitude and 42 error. Check that the magnitude given is the one you typed in...Now move the mouse over the supernova, and read the magnitude that the program has calculated. Check out the errors, too, for later reference. In order to have the program accurately calculate your errors, you need to know something about the “dark current” and “readout noise” of the CCD in electrons/second. You don’t have to worry about this unless you are really doing detailed measurements, and for a detailed treatment look at your program manual or a book on CCD photometry! However, you can get a rough idea if you are doing the procedure correctly if your errors are not more than a few percent of the calculated magnitudes. Write down the magnitude of the supernova and the error on day 1 in a data table. Click anywhere inside the image to get rid of the zoom window; then click on the trashcan icon to remove this image from the screen. Bring up the next supernova image, and repeat the entire process until you have found the magnitude of the supernova for each day! ☺ SKIP TO STEP 5: GRAPHING THE LIGHT CURVE! Process B: The quick and dirty method. Use this method if you only want to determine relative magnitudes, to get an idea of the shape of the light curve when you don’t really care about reporting actual magnitudes. 1. Click on the Photometry icon, located directly above the “trashcan” icon. 2. Click on the word Photometry in the little window that appears center screen. 3. In the larger window that now appears, disregard all the numbers that appear in the little boxes. These are the default values which the program has calculated for the image on your screen. Click on the word Manual, and in the next window that appears click on the words Add Stars. 4. The ZOOM WINDOW will appear in the upper left-hand corner of your screen. Move the mouse over the reference star and click the left button. A red cross will appear in the original image, and a blue cross will appear in (or close to) the center of the star in the zoom window. Now click on the supernova. 5. Hit the Escape key on your keypad twice to get back to the photometry window. 6. Click on the word Calibrate. The zoom window will reappear. Move the mouse to your reference star, click, and in the little box that appears type in the magnitude. Then click on Okay. (If you don’t know a reference magnitude, simply choose a star which appears constant in each image and assign an arbitrary magnitude - like 0 - which you will use in each image. You will then obtain relative magnitudes for the supernova, which you can shift later.) 7. Click on the magnifying glass icon to bring back the zoom window. Move the mouse over the reference star; you should see the magnitude you typed in appear in the window below the “zoom parameters”. Now move the mouse over the supernova, and record the magnitude for that date. It is also a good idea to record the error. If your errors are more than Click the mouse once anywhere inside the image to get rid of the zoom window. 8. Now trash this image and bring the next image (in chronological order) onto your screen, and REPEAT THE WHOLE PROCESS. (It gets easy after you have done it a few times.) Step 5. Graphing the Light Curve. You should now have the magnitude of the supernova for each day of observation. Your data table should be organized like this: DATE DAY # MAGNITUDE ERROR The first date is day 1. Count up from that date, and number each date with a day, so that the light curve will have the proper shape and not be scrunched up and distorted. For example: The header will most likely have the dates written in the form day/month/year. Suppose the first date of the observations was March 23, 1995; it will be recorded in the header as 23/3/95. You count this as day 1. Suppose that the next observation was made on 30/3/95; this would NOT be recorded as day 2. Counting up from March 23, the second observation was made on day number 8. Your data table would look something like this: 43 DATE 23/03/95 30/03/95 03/04/95 08/04/95 DAY # 1 8 12 17 MAGNITUDE 11.5 11.0 10.8 10.0 ERROR .125 .113 .053 .051 Notice that the magnitudes are DECREASING, which indicates that the supernova is BRIGHTENING! Calculate the percent error, and you will see that it is never more than around 1% of the calculated magnitude. (These are ideal, fictitious measurements!) This allows you to put error bars into your graph of the light curve. Small error bars indicate to the person who looks at your results that you did a careful job, and your results are credible. (Either that, or you “fudged” your data, but you would never do such a thing...) To make the light curve, you can use any graphing program or spread sheet. An easy program to use, and one that is also very inexpensive, is GRAPHICAL ANALYSIS by Vernier Software. Input the DAY # for the x-axis values; input the MAGNITUDE for the y-axis values. If you are using GRAPHICAL ANALYSIS or a spreadsheet, multiply all the magnitudes by -1. This is a TRICK to fool the program into plotting the true lower magnitudes (brighter stars) at the top of the y-axis; otherwise, the program will plot the y-axis values with the larger numbers near the top of the y-axis. Just ignore the minus sign, and read only the absolute values of the magnitudes. Have the program draw a LINE CONNECTING POINTS. Use the ERROR BARS feature. There should not be any x-axis errors, unless you are uncertain of the date of the observations! For the y-axis error values, if your program is sophisticated enough, you may be able to input individual error bars for each date; if you are using GRAPHICAL ANALYSIS, then just calculate the average % error, and input that for the y-axis error bars. Congratulations! You have plotted a supernova light curve! Once you get used to the process, it will go quickly. For an example of a student research project in which light curves for the supernova SN1993J in M81 were generated with data from the UCSB telescope, refer to the article “Supernova Search in the Virgo Cluster” by Shea Lovan in the manual of the Remote Access Astronomy Project, Image Processing Activities for High School and College Students. The manual is available upon request. To obtain a copy, send email to: Shea Lovan: [email protected] or Matthew Schalit: [email protected] -------------------------------------------------------------------------------------------------------------------------------The literature on supernovae is extensive, however here a few articles you may find useful in getting started: “Supernovae”, by Hans Bethe, in PHYSICS TODAY, vol. 43, no. 9, September, 1990 “A Supernova with an Identity Crisis” by Alexei Filippenko, in SKY & TELESCOPE, vol. 86, no. 6, December, 1993 “Supernova 1987A Revisited” by Robert Naeye, in SKY & TELESCOPE, vol. 85, no. 2, February, 1993 44 45 RAAP Introductory Astronomy Activity: Monitoring the Variations in Magnitude of SS Cygni Jatila van der Veen, Adolfo Camarillo High School /UCSB Remote Access Astronomy Project Data for this lab supplied by Mark Parker, UCSB Remote Access Astronomy Project This lab may be reproduced for use in a classroom in any form, however none of the RAAP materials may ever be reproduced for publication without the written consent of the authors. BEFORE STARTING THIS LAB: You will need to be sure the images are loaded into your C:\IMAGINE-32\IMAGES\STARS directory, or some other appropriately named directory. The data sets are labeled SSCY'.FTS, and can be downloaded from the Remote Access Astronomy Project world wide web home page: http://www.deepspace.ucsb.edu, under the Interactive Astronomy Arcade page. Background Info: SS Cygni is a famous “dwarf nova” in the constellation Cygnus, according to Burnham’s Celestial Handbook. It exhibits variations in its light output which are sudden; its light curve, while periodic, is not smooth and regular. It has been called a “cataclysmic variable” because it gives the appearance of suddenly exploding several times a year, varying between 12th and 8th visual magnitude. The light curve of SS Cygni exhibits a wide maximum of about 18 days duration, and a narrower maximum of about 8 days duration. These maxima most often occur alternately, although occasionally two of the same type of maximum will occur successively. The average interval between major outbursts, according to Burnham’s, is about 51 days. This intriguing variable was first discovered in 1896 at the Harvard Observatory in Cambridge, Massachusetts by Miss L. D. Wells, one of the many women who were employed there around the turn of the century. From observations made at Mt. Wilson in 1956, it became apparent that SS Cygni is a binary; the primary is a yellowish dwarf star, of spectral class similar to our Sun, while the secondary is a hot bluish star which, it is believed, may be related to the white dwarfs. Various studies of SS Cygni indicate the following information about this unusual binary system: Star A: radius is around .9R( Star B: radius is around .1R( Orbital period (P): around .276 days; Separation of their centers (r): about 1.23 solar radii Proper motion: 0.12” Distance: 90 to 100 light years Pre-lab questions: 1. If the total visual magnitude of SS Cygni varies between 8th and 12th magnitudes, by how much does the total light output vary? 2. Compute the total mass of the SS Cygni binary system: we will do this in MKS units, then convert to solar masses. First convert the total separation to METERS: 1 solar radius is 6.96 x 10⁸ m The average separation of SS Cygni A and B is 1.23 R( = _____________________meters Next convert the period into seconds: .276 days x 24 hours/day x 3600 seconds/hour = _________________________seconds Now we can use Kepler’s third law to find the total mass of the system: 46 r3/P2 = G(Mtotal )/4π2...where G = 6.67 x 10⁻¹¹ Newton-meters2/kg2 4π r G P2 = total mass of system in kilograms = ___________________________ 2 3 Now divide this by 2 x 1030 kg, which is the mass of the Sun, to get the total mass of the SS Cygni pair in terms of solar masses: total mass = __________________________M( 3. Using the formula relating distance (d), visual magnitude (m), and absolute magnitude (M), find the absolute magnitude range of SS Cygni. d = 10(m-M+5)/5 and m varies between 12 and 8; d is roughly 100 ly First change d to parsecs:______________________ (1 pc = 3.26 ly) Re-write the formula to solve for absolute magnitude, M: ____________________________ Mminimum = _______________________ Mmaximum = _______________________ ****************************************************************************************** **************** FINDING THE VARIATION IN MAGNITUDE OF SS CYGNI FROM IMAGES TAKEN WITH THE UCSB REMOTE ACCESS TELESCOPE Open the program IMAGINE-32; click on the ! (floppy disk) icon in the upper left corner to see a menu of available images. The images should be located in a directory called IMAGINE-32\IMAGES\STARS. You can quickly move to that directory by clicking the mouse in the space at the top of the menu window, deleting whatever it says in there, and typing in the words: C:\IMAGINE-32\IMAGES\STARS\*.FTS. Then this line will appear on the top line of the list of images; double click on it, and you will be in that directory! Now the list of SS Cygni images should appear. Since there are too many images for them all to fit on the screen at once, you will investigate the 5 images for the month of June first; then the 4 images for July, and then the 4 images for August. The date of each image is contained within its name; for example: SSCY6_22.FTS was taken on 6/22/94. i. Bringing the images onto the screen. Within the pop-up menu of available files, double click on the image named SSCY6_22.FTS. This image will appear in the upper right corner of your screen. Now click on the name, hold the mouse button down, and drag the image to the lower left corner of the screen. You have to make room for all the images! Now click on the floppy disk icon again; double click on the image named SSCY6_23.FTS; drag it to the bottom of your screen, next to the first image. Do this for the images for 6_28, 6_29, and 6_30 also. ** Can you spot the variable star??? It is located at coordinates x = 342, y = 115 in the first image... ** NOTE: To activate any image, simply click on its name. The name of the currently active image will appear in the gray border of the screen, at the lower left-hand corner. ii. Finding the magnitude variations. Click on the name of the first image to activate that image. Then click on the word Photometry within the icon menu bar on the left side of the screen. This icon is located directly above the trash can icon. Photometry is a process of measuring the visible light output of a star. After you click on the Photometry icon, a little window will appear in the middle of the screen; click on the word photometry within that little window. Then a larger window with lots of confusing-looking stuff will appear; disregard all that stuff, and click on the word “Manual”. Another window with more confusing-looking stuff will appear; never mind all that, and just click on the words “Add Stars”. You are now ready to find the magnitude of SS Cygni in that image. First, though, you need a REFERENCE STAR! According to Burnham’s, the star indicated below in the image SSCY6_22 has an absolute visual magnitude of 9.9, and does not vary appreciably. It is the rightmost of a little triangle of stars that appears in each image; use this as the reference star for each calculation, in each image of SS Cygni. 47 SS Cygni Reference star, mag. = 9.9 After you have clicked on the words “Add Stars” in the window, a magnified window will appear in the upper left corner of the screen. A little red cross will appear on the original image, indicating the location of the mouse. Move the mouse to SS Cygni and click; move the mouse to the reference star and click; the positions and relative intensities of these two stars will be saved. Then hit the ESC button in the upper left of your keyboard. This will bring you back to the center window; now click on the word “Calibrate”, and again the magnified window will appear in the upper left of your screen. Click on the reference star, and in the little window that appears, type 9.9, then Enter. Now click on the OK square in the window, and you will be back to the original screen. To see the magnitude of the stars, click on the magnifying glass icon, and the magnifying window will appear again. This time, when you move the cursor over the stars for which you have done the photometry, their magnitudes will appear under the magnifying window, along with the error for each magnitude calculation. Make a DATA TABLE in which you record: the date of the image, the day number (6/22 is day 0, 6/23 is day 1, 6/28 is day 6, etc.), the magnitude of SS Cygni, and the error in a data table. NOTE: BE SURE TO COUNT THE CORRECT NUMBER OF DAYS IN BETWEEN EACH OBSERVATION IN ORDER TO GET THE CORRECT SHAPE OF THE LIGHT CURVE! Now repeat this photometry process for all the images on the screen. Remember that to change to a new image, simply click once on its name. When you have gotten the magnitudes for each of the images taken in June, click 5 times on the trashcan icon to get all these images off your screen. Now, click on the floppy disk icon, and retrieve all the images from July - there are only 4: 7/04, 7/12, 7/27, and 7/31. Do the photometry on the four images of SS Cygni from July; then trash all four of them, and do photometry on the four images from August - 8/01, 8/03, 8/08, and 8/11. When you are finished, you should have magnitudes and errors for 13 images of SS Cygni, taken over a 50-day period. Your data table should have the following headings: date day # magnitude error GRAPHING THE LIGHT CURVE FOR SS CYGNI Use the program GRAPHICAL ANALYSIS (or your favorite graphing program!) to make a graph of the variation in magnitude over time for SS Cygni. INPUTS : x-axis: day; no units. Input the day NUMBER (0, 1, ..., 50) y-axis: magnitude; no units Note: For Graphical Analysis, input the magnitudes as NEGATIVE NUMBERS. In that way we can trick the program into putting the higher numbers on the bottom and lower numbers on the top, because for us a higher positive magnitude means a dimmer star, and we want the peaks in the curve to correspond to peaks in absolute light output! GRAPHING: use the following options: point protectors - on 48 grid on graph - on error bars - on line connecting points - on At the ERROR BAR screen, use 0% for the horizontal error size, and 3% for the vertical error size. At the screen that asks for scaling, select VARIABLE ORIGIN, MANUAL SCALING. Select 0 for the left side, and 50 for the right side. Print out your graph! ****************************************************************************************** ****************** Post-lab: evolution of close binary stars of the SS Cygni type: Now go back and read the appropriate section in your textbook about the evolution of close binary stars. Write a paragraph explaining the light outburst you just graphed for SS Cygni based on what we understand of the evolution of a close binary system! ****************************************************************************************** ****************** For the adventuresome: Extra Credit Options! 1) Look up the binary U GEMINORUM in Burnham’s and compare it to SS Cygni. Model both systems, SS Cygni and U Geminorum, with the CUPS software on eclipsing binaries; compare their predicted light curves; compare the predicted light curve derived for SS Cygni with the modeling program to the actual one that you found. 2) Contact the UCSB Telescope (http://www.deepspace.ucsb.edu) and download any images of U Geminorum. Find the light curve for U Geminorum in the same way as you did for SS Cygni. You will probably have to rotate any raw images you download from the telescope to match the finder charts in Burnham’s Celestial Handbook or other atlas. 3) Select a variable star from a constellation which is visible at this time of year between 9 PM and midnight which you wish to monitor, and upload your observation requests to the RAAP homepage. Use the convenient form on line at http://www.deepspace.ucsb.edu to upload your request. Download your images over the course of your observations, and make your own light curve. When you are all finished, you can save your light curve as an EXCEL file and upload your finished product! ........................................................................................................................................................ References: Burnham’s Celestial Handbook, Volume 2, Robert Burnham, Jr., Dover Publications, New York, 1978 49 RAAP Introductory Astronomy Activity: INVESTIGATION OF M16, AN OPEN CLUSTER IN SERPENS Jatila van der Veen, Adolfo Camarillo High School and UCSB /RAAP Data: courtesy of Mark Parker, UCSB Remote Access Astronomy Project Telescope This lab may be reproduced for use in a classroom in any form, however no part may be reproduced for publication without the written consent of the author. NOTE: Before starting this lab, be sure you have the M16 images in R, V, and B loaded in the appropriate directory (e.g., C:\IMAGINE-32\IMAGES\CLUSTERS or some similar name). The data can be downloaded from the RAAP home page: http://www.deepspace.ucsb.edu. Background: M16 is an interesting example of an open cluster, because it is also surrounded by a region of faint nebulosity. While it is called the Eagle Nebula by most observers, Robert Burnham (author of Burnham’s Celestial Handbook) prefers the name Star Queen Nebula. In this lab you will use digital images taken at UCSB with the 14” reflector and sensitive CCD camera to: * find the magnitudes of stars in M16 in Blue and Visual wavelengths and plot the magnitudes of the stars in the Visual as a function of the “B-V” index of stars; * estimate the absolute magnitude range for the cluster by comparing your plot with the H-R diagram and calculate the approximate distance to the cluster; * estimate the age of the cluster from the “turn-off point”; * make a tri-color composite image of the cluster and discover the “true” color of the nebulosity surrounding it (the “Eagle Nebula”). Have fun! ☺ Part 1. B-V photometry of M16 Procedure: 1. Open the program Imagine-32. Click on the ! (floppy disk) icon, and load the image M16V.FTS. 2. Click on the Photometry icon; in the pop-up window that appears, click on the word Photometry. Then click on the word Manual, and in the next pop-up window that appears, click on the words Add Stars. 3. Refer to the finder chart in Burnham’s Celestial Handbook, volume III, page 1785. Click on the following stars which are listed in the chart: 1, 4, 5, 6, 7, 8, 10, 11, 12, 13, 14, 15, 17, 18, 19, 20. (Stars 3 and 9 on the finder chart have been omitted because they do not appear in the field of view of the image, and star 2 has been excluded because it is a foreground object.) 50 4. When each of these stars has a little red cross in it, hit the Escape key to return to the pop-up window. Now click on the words Calibrate Star. Use star #1 from the finder chart. It has a magnitude of 8.24, so type that number into the little box, and hit Enter. Then click on Okay, and the program will tell you that it is calculating the magnitudes. 5. Now click on the magnifying glass icon, and move the cursor over each star that has a red cross. The magnitude appears in a little box in the window below the “zoom” screen. Write down the magnitude in your DATA TABLE, next to the correct star number. Refer to the finder chart to be sure you are looking at the right one! Make a DATA TABLE on a separate sheet of paper, with the following headings: STAR # MV MB B-V 6. When you are all done with this image, you can “trash” it. 7. Now, click on the floppy disk icon once again, and this time load the image M16B.FTS. Follow the same procedure to do photometry on this image. The only difference is that when you get to the part about CALIBRATE STAR, you must enter a different magnitude for star #1. FINDING THE MAGNITUDE OF STAR #1 IN BLUE LIGHT: Star #1 is an O5 star, and according to Norton’s 2000.0 Catalogue, O5 stars generally have a B-V index of -.35. So, since MV = 8.24, and B-V = -.35 , therefore, what is the B value that you should input? ________________ Good. Now input that value as the calibration value of star #1, and click on Okay. Find the B magnitudes of the same stars for which you found V magnitudes, and record in your data table. 8. Calculate the B-V index for each star, and record that in the data table. Example: For star #1 MV = 8.24 and MB = 7.89, so the B-V index is 7.89 - 8.24 = -.35 Making the graph: 9. Exit IMAGINE-32 for the moment, and go the program Graphical Analysis (or similar graphing program.) Make a graph of the B - V values on the x-axis, and the V magnitudes on the y-axis. (Don’t connect the points) Before you make the graph, go to MODIFY DATA and multiply the V values by -1 to trick the program into putting the smaller numbers (brighter stars) on top. Print out your graph, but don’t connect the points! (Why not???) ANALYSIS Now compare your plot to the H-R diagram in your text, and answer these questions: A) What part of the curve does your graph fit best? B) What type of stars are the brightest stars in M16? C) Is this cluster young, middle-aged, or old? How can you tell from the types of stars it contains? D) There are some points that lie to the right of the main sequence, yet are not bright. What could these represent? 51 Part 2. Estimating the distance to M16: 1) Find the visual magnitudes of the brightest and dimmest of the stars in M16 from your graph. From the comparison with the H-R diagram in your text, find the approximate absolute magnitudes of these two extremes. Calculate the distance to M16 using the distance formula for each of these two stars. Then take the average to estimate the distance to M16: d = 10[m - M +5]/5 where d = distance in parsecs, m = visual magnitude, M = absolute magnitude from H-R diagram. Brightest m= Dimmest m= M= d= (apparent mag. from your graph) M= d= (absolute mag. from H-R diagram) (distance in parsecs) average distance = Estimates of the distance to M16 range between about 2000 and 3300 parsecs, with 2500 being the most widely accepted value, according to Burnham’s Celestial Handbook. * Why do you think it is so difficult to measure the distance to M16? * M16 is believed to lie in the Sagittarius spiral arm of our galaxy; what could this location have to do with distance measurements to the cluster? ---------------------------------------------------------------------------------------------------------Note to teachers and students: When I originally wrote this lab, I used the star #1 in Burnham’s finder chart for M16, as the spectral type for this star is given as O5, and in Norton’s 2000 it is claimed that O5 stars have well known B-V indices of -.35. Knowing this, it is easy to use the same star as a reference in both the V and B images. However, star #1 is not a nice round, perfect star, and the program gives inconsistent results for the photometry calculations. When we used star 13, a B1 star with a nice round appearance, we got more consistent magnitudes out of the program. We estimated the B-V index for this star as -.28, as Norton’s 2000 gives B-V = -.31 for B0 stars and -.16 for B5 stars. I don’t know if this is as reasonable assumption, but we got more consistent photometry results using star #13 in this way. If you have any suggestions, I would greatly appreciate hearing from you. Please send email to: [email protected]! ......Jatila van der Veen ☺ -------------------------------------------------------------------------------------------------------------------------------- Part 3. Making a tricolor image of the Eagle Nebula and M16. Now go back to the program IMAGINE-32. Open the files EAGLE_B.FTS, EAGLE_V.FTS, and EAGLE_R.FTS. 1. Align the stars using the rotate icon and trash the unaligned images. (See IMAGINE-32 manual or M42 lab on tricolor imaging.) 2. After you have the R, B, and V images all lined up correctly, click on the word Effects from the top menu bar. In the pop-down window, click on Tri-color. BE SURE TO SELECT THE CORRECT IMAGES 52 FOR RED, BLUE, AND GREEN! (V is the Green one!) The program will make your “true color” image! ☺ * What color is the nebulosity??? * What does that tell you about its composition??? * How does the composition of the nebula help place additional constraints on the age cluster? of the Part 4. Finding the age of the cluster from its turnoff point on the H-R diagram. One of the reasons why so much useful information can be extracted from studying star clusters is that the stars in a cluster all began forming from the same initial cloud of gas and dust. We can infer, therefore, that all the stars in a given cluster are at approximately the same distance from us, have approximately the same chemical compositions, and are all the same age, although at different stages in their evolution. The STAGE of a star’s life in any cluster depends on the MASS of the star; the larger a star is, the faster it uses its nuclear fuel and the hotter and brighter it is. A low mass star will take much longer to reach the Main Sequence and begin fusing hydrogen in its core than a high mass star, and will spend more time on the main sequence before it exhausts its hydrogen supply. A color-magnitude diagram of a star cluster is like a snap shot of all the stars at one time, with each star being at a different stage in its development. The point at which a star leaves the main sequence is called its TURNOFF point. At this stage in a star’s development, the star has exhausted the hydrogen in its core and is on its way toward becoming a red giant, fusing helium in its core. If you can measure the point in the color-magnitude diagram of a star cluster where the most massive stars are leaving the main sequence and heading for the red giant region, you can estimate the age of the entire cluster - that is, the time since the first stars in the cluster began their lives on the Main Sequence. Let T = the life expectancy of a star on the main sequence, compared to the life expectancy of the Sun, T (. T = fuel / rate of fuel consumption ... but the fuel is just the mass, and the rate of fuel consumption is the luminosity, so... T = Mass / Luminosity ...but Luminosity = Mass3.5, so... 3.5 T = M / M = 1 / M2.5 ...and if we express the mass in terms of solar masses, the age will be in terms of solar lifetimes. To estimate the age from the luminosity alone, we work backwards: L = M3.5 ... so M = L1/3.5 ... so we can substitute this value for the mass back into the equation for the life expectancy, and get T = 1 / M2.5 = 1 / (L1/3.5)2.5 = 1 / L(2.5/3.5) = 1 / L.7143 where L is actually L/L( and T is T/T(. 1 So, to find the age of the open cluster M16 in terms of solar lifetimes, we must find the luminosity of the stars at the turnoff point for this cluster, in terms of solar luminosities. To do this, you need to determine absolute magnitudes for each star, using the accepted value of 2500 parsecs for the distance to the cluster, and then determine the luminosities. You also need to convert the B-V indices to effective Temperatures, then plot the log of the Luminosity as a function of effective Temperature, with the highest effective temperatures to the LEFT. 1. Calculating absolute visual magnitude using distance formula: Assuming a distance of 2500 parsecs for M16, calculate the absolute magnitudes from the apparent magnitudes you derived in IMAGINE-32, using the “distance formula”: 53 d = 10{( m - M + 5 ) / 5} yields M = m - 5 log d + 5 2. Correction for interstellar extinction: Now, recall that this cluster lies in a spiral arm, and there is a great deal of interstellar dust in the way. This dust actually makes the stars appear dimmer than they really are, a phenomenon which is called INTERSTELLAR EXTINCTION. The correction for interstellar extinction in our neighborhood is 1 magnitude for each kiloparsec; that is, for each kiloparsec (1,000 parsecs) a star is actually 1 magnitude BRIGHTER than it would otherwise appear. So, you have to apply this correction to your estimates of M above. distance to M16 = 2500 pc = kpc correction for interstellar extinction = all this yields : magnitudes M = (m - 5 log d + 5 ) - 2.5 (Note: we have not applied a correction to the B-V indices for interstellar REDDENING. If we did, would this correction make the B-V indices more NEGATIVE or more POSITIVE???) 3. Applying a Bolometric correction: The luminosity of a star is the TOTAL light output of the star at ALL wavelengths, but you only looked at visual and blue wavelengths, so we need to use an empirical correction factor... We must relate the absolute magnitude of the stars to the absolute BOLOMETRIC magnitude of the Sun, that is, the absolute magnitude of the Sun as measured at ALL wavelengths. The formula for this is given as M = 4.72 - 2.5 { log (L/L() } which yields: L/L( = 10{ (4.72 - M) / 2.5} 2 (you can fill in the steps yourself!) Suggestion: Use your favorite spreadsheet program to calculate the corrected absolute magnitudes, and then plug those values into the calculation for luminosity. 4. Converting B-V index to effective Temperature In order to compare your luminosity data with a standard “ZAMS” (Zero Age Main Sequence) model, from which you can attempt to find the turnoff point for this open cluster, you need to convert the B-V indices to effective temperatures. You can use the following table from Shu’s INTRODUCTION TO ASTRONOMY to interpolate effective temperatures for your B-V indices: B-V index T-eff. -0.45 35,000 -0.31 21000 -0.17 13500 0 9700 0.16 8100 0.3 7200 0.45 6500 0.57 6000 0.7 5400 (page 162, 1982 edition) You can use Graphical Analysis, by Vernier Software to plot T-effective vs. B-V index, then use the interpolation function between the data points to find the approximate temperatures for the B-V indices you calculated for M16. 5. Graphing L/L(: Finally you are ready to make your H-R diagram for M16! Plot the log of L/L( on the y axis, and the effective Temperature on the x axis, BEING SURE TO PUT THE HIGHEST TEMPERATURES 54 CLOSEST TO THE ORIGIN! Don’t have the program connect the dots; you do that by hand, using your best eyeball fit... 6. Attempting to find the age of the cluster from the turnoff point: Compare your graph with a standard ZAMS model in any astronomy reference book. Find the point on your graph where the stars with the highest luminosities appear to “head for the red giant region”. From the value of log (L/L() at that point, calculate L/L(. From the formula for T /T( = 1/( L/L().7143, calculate T /T(. This is the age of the star cluster in terms of solar lifetimes. Since T( = 1010 years, to find the absolute age of the cluster in years, multiply the value you derived for T/T( by 1010. __________________________________________________________________________ According to Burnham’s Celestial Handbook, the open cluster M16 is believed to be only about 800,000 years. The observations which support this young age are the presence of massive blue supergiants, small dark nebulae or “globules” which are thought to be protostars, and many faint, T-Tauri type variables, and other pre-main sequence stars still in the process of forming. * How close did you come to this value for the age of M16? * What errors do you think were inherent in this method? * What suggestions do you have for improving the technique? -------------------------------------------------------------------------------------------------------------------------------1. Seeds, M. FOUNDATIONS OF ASTRONOMY, Wadsworth Pub., 1994 2. Shu, F. THE PHYSICAL UNIVERSE: AN INTRODUCTION TO ASTRONOMY, University Science Books, 1982 55 VOLCANOES ON IO Analyzing the trajectory of ejecta from a volcano on Io, the innermost moon of Jupiter REMOTE ACCESS ASTRONOMY PROJECT UNIVERSITY OF CALIFORNIA, SANTA BARBARA and CENTER for PARTICLE ASTROPHYSICS Image Processing Curricula for High School and College Physics and Astronomy 56 Volcanoes on Io Jatila van der Veen, UCSB Physics Department and Adolfo Camarillo High School Philip Lubin, UCSB Physics Department THE FOLLOWING MAY BE REPRODUCED FOR USE IN A CLASSROOM IN ANY FORM, BUT UNDER NO CIRCUMSTANCES MAY ANY PART OF THIS BE REPRODUCED FOR PUBLICATION WITHOUT THE WRITTEN CONSENT OF THE AUTHOR. *************************************************************************************** In this activity you will: * Analyze the trajectory of ejecta from a volcano on Io that was discovered by the Voyager I space probe; * Investigate the geology of Io in images taken by Voyagers I and II. *************************************************************************************** This activity makes use of the program IMAGINE-32 by ISIS for processing digital images. -------------------------------------------------------------------------------------------------------------------------------References: "The Galilean Satellites" by Torrence Johnson, THE NEW SOLAR SYSTEM, Beatty and Chaikin, ed., Sky Publishing, 1990. -------------------------------------------------------------------------------------------------------------------------------Background: In 1979 when Voyager 1 passed Io, one of the four largest moons of Jupiter which were first observed by Galileo in the 1600's, scientists at JPL were surprised to find what was evidently a large plume rising from the surface. They confirmed that this was a volcanic eruption! Io was the first body in the solar system, other than the Earth, to have confirmed active volcanoes. Actually, Voyager I photographed eight volcanoes erupting, and when Voyager II flew by Io four months later, six of these were still erupting! IN THIS ACTIVITY, YOU WILL OBSERVE IMAGES OF IO SHOWING A VOLCANIC ERUPTION. YOU WILL BE ABLE TO ESTIMATE THE HEIGHT OF THE ERUPTION, AND THEN DO SOME CALCULATIONS ABOUT THE TRAJECTORIES OF THE EJECTA. ************************************************************************************** Go to the IMAGINE-32 program, and click on the “disk” icon. This will bring up a list of available images for you to choose from. Choose the file called “IO.FTS.” This shows an eruption of a volcano that has been named "Prometheus". (1) Finding the scale of the picture in km/pixel: We know that the radius of Io is approximately 1815 km. What is the diameter of Io? _____________________________________________km Click the left mouse button while the mouse is within the image. This will cause the arrow to disappear and a small cross-hair to appear in its place. Notice that the coordinates of that location are now displayed at the lower left-hand corner of the screen. The x and y values are the coordinates of that pixel, referenced to (0,0) at the upper left-hand corner, and the z value is the relative intensity of that pixel. 57 Place the crosshair as close to the top, center of Io as you can; now click the RIGHT mouse button, and drag the mouse to the bottom of Io. Notice that the cursor draws a line, ending with another crosshair. At the bottom of the screen the length of this line in pixels is displayed; the angle of the line from the starting point, referenced to 0-degrees along the positive x-axis, is also displayed. Find the diameter of Io in this picture, in pixels: diameter in pixels = _____________________________________________ Find the scale of this picture in km/pixel by dividing the actual diameter of Io in kilometers by the diameter of Io in the picture in pixels: scale = _______________________________km/pixel. Now we have a way to relate what we measure in the picture to "real life". *************************************************************************************** (2) Measuring the height of the volcanic plume. Click on the "scissors" icon, and make a box around the volcano, being sure to include the entire plume in your box. After the program has drawn the boxed image of the volcano, click on the "exploding arrows" icon, to expand this box. Then, holding the left mouse button down, drag the expanded image of the volcano so that it no longer covers the image of the whole Moon. To get rid of any image you wish to remove from the screen, just click on the name that appears in the upper right-hand corner of the image, then click on the "trash can" icon, and the unwanted image will disappear from your screen! (Unlike Macintosh systems, this “trash can” icon does NOT delete the file from your hard drive!) Click on the “Pal” icon to color-enhance the image. This will give you a better picture of the extent of the volcanic plume. Click the mouse inside the image of the volcano to find the (x,y) coordinates at the base of the plume (where the eruption comes out of the ground). base of plume, center: xo = _________ yo = _____________ Look carefully at the image...the eruption is like a fountain, coming out of the ground and going out in 3 dimensions. Of course, in the image, it looks 2 dimensional. It would be helpful at this point to sketch what you think the eruption really looks like. Imagine that stuff is coming out in all directions and that you are looking at a slice through it. Use the space at the right for your sketch.---> In the same way in which you found the diameter of Io, click the right mouse button and find the height of the plume, h, in pixels: h = _____________________________________________ Material that is shot straight up out of the ground will obviously go up the highest but fall back down closest to the base of the volcano. Now find the maximum range, R, along the surface of Io that material went. Starting again at the base of the plume, drag the mouse along the surface of Io to the farthest extent that material went. R = _______________________________________________ 58 From what we know of projectile motion, debris that are shot out at approximately a 45-degree angle will travel the farthest from the base of the volcano (in the absence of air friction). Now, using the km/pixel scale that we calculated, find the height and range in km, and also in meters. height in pixels x scale = height in km = ______________________________________ height in km x 103 = height in meters = ______________________________________ range in pixels x scale = range in km = ______________________________________ range in km x 103 = range in meters = ______________________________________ (3) Calculating the acceleration of gravity on Io. If we want to make predictions about the velocities of ejecta from volcanoes on Io, we need to get an estimate of the acceleration of gravity, g, on Io. We know that for any planet, g = GM r2 where G is the universal gravitational constant, 6.67 x 10⁻¹¹ Nm2/kg2, and r is the radius of the body in question. In order to calculate the value of g for Io, we need an estimate of the mass, M, of Io. What two parameters do you need to know in order to estimate the mass of Io? _________________________________________________________________________ If you said volume and density, you are correct! Based on images sent back by the Voyager space probes, scientists believe that Io's surface is composed mainly of sulfur and sulfur compounds and that it has a molten silicate interior. They estimate the average density of Io to be 3.55 grams/cm3, or 3.55 x 10³ kg/m3. Now we make the assumption that Io is a spherically-shaped body (not too bad an assumption from the picture, right?), and we can estimate the volume of Io. Recall that the formula for the volume of a sphere is Volume = (4 π r3)/3. Because the units of "g" are meters/sec2, we have to express mass in kilograms and volume in cubic meters to be consistent. radius of Io in km x 1000 = radius in meters = ___________________________________m and express this in scientific notation: ___________________________________________m volume = (4 π r3)/3 = ______________________________________________________m3 mass = volume x density =___________________________________________________kg 59 Now we can find the acceleration of gravity on Io: g = G x mass ÷ r2 = _______________________________________________m/sec2 (If you came out with around 1.8 m/sec2, your answer agrees with that of the NASA scientists!) (4) Estimating the initial velocities of ejecta from the volcano From the picture, it is difficult (if not impossible!) to measure the possible take-off angles of debris from this volcano; however we can make a few reasonable and simplifying assumptions, and rely on a bit of classical projectile motion theory. ...We know that velocity is a vector quantity; we can assume that all the material was shot out with the same initial velocity, although at varying angles. For each take-off angle, the x- and ycomponents of velocity would be different but add vectorially to the same total initial velocity. ...We can assume that the material that went the highest, directly over the base of the volcano, had a nearly-vertical take-off angle, and fell back down closest to the base of the volcano. ...We can assume that the material that went the farthest had close to a 45-degree take-off angle. For a particle thrown straight up, achieving a maximum height h, and landing at the same elevation from which it took off, we know that initial launch velocity, Vo = final landing velocity, Vf , and the velocity at the very top of its arc is zero. Refer to your physics text, and from among the equations for vertical motion, choose the appropriate one that will allow you to calculate the initial velocities of ejecta from the information you know. Write it on the line below: ________________________________________________________________________ Now re-arrange this equation to show how you can calculate the initial velocity of the ejecta coming out of the ground, for material that is shot straight up: If you came out with something like: Vo = 2gh you are correct. Now calculate Vo: ___________________________________________________________m/sec We also know the equation for the range, R, of a projectile is: R= V0 2 sin( 2θ ) g For what take-off angle will R be maximum? _____________________________________ 60 Re-arrange this equation to show how you will calculate the initial velocity of the material that is shot out at a 45o angle: Now, using the maximum range in meters that you calculated earlier, calculate the initial velocity: Vo = Rg = ___________________________________________________m/sec Your two answers should agree closely...Which method do you think is more accurate? _________________________________________________________________ For which measurement, maximum height or maximum range, did we make the greatest approximation, from what you can tell from the image? __________________________________________________________________ Suggest a method to correct for this approximation... _____________________________________________________________________________________ _____________________________________________________________________________________ Going further: IMAGINE YOURSELF ON IO... Because of the low gravity on Io, debris shot out of the volcanoes goes pretty far and high. Picture what it would be like on that little moon of Jupiter...no oxygen to breathe, only sulfur dioxide outgassing from the volcanoes, but not forming much of an atmosphere because of the low gravity...near the volcanoes the ground temperatures range from about 500 to 900 Kelvin, but away from the volcanoes it is as cold as 120 K (remember that 273 K is 0o C, the freezing point of water at 1 atmosphere on Earth)...Io is about the size of our Moon, and with at least 8 active volcanoes throwing debris out in 200-km or greater radii, it would be a pretty hostile environment! Now "trash" the images of Io you currently have on the screen, and click on the "disk" icon again. There are several more pictures of Io taken by Voyager I; look at them to get a closer view of what Io looks like. IOGEOL.FTS...shows surface features on Io. It is a very large picture, so you will have to scroll it up a bit to see the whole picture. Notice the large volcano in the middle of the picture. It is called Pele and is believed to erupt silicate magmas, similar to volcanoes on Earth. IOVOLC1.FTS...shows another eruption, of a volcano named Loki. Make a box around the volcano, and expand the box for a closer view. What do you notice about the eruption of Loki that is similar or different from the eruption of Prometheus that you studied in this lab? Loki and Prometheus are both believed to erupt sulfur and sulfur dioxide lavas. IOVOLC2.FTS and IOVOLCAN.FTS...more volcano pictures. Can you tell which volcanoes these are? *************************************************************************************** 61 Here are some ideas for further study: * Calculate the escape velocity for Io (refer to any standard physics text), and compare this with the initial velocity that you calculated for material ejected from the volcano you just studied. If the volcano you just studied is representative of volcanoes on Io in general, do you think any of the ejecta will end up in orbit around Io? Will any escape from the gravitational field of Io altogether? If so, where do you think that material will end up? * What do the names that scientists have given to the volcanoes on Io mean? What do these names have in common? Why were these names chosen for this hot little Moon? * Compare the different kinds of volcanoes on Earth (and there are many kinds on Earth!) with volcanoes on Io...and volcanoes on other bodies of the solar system. For example: ... Voyager 2 found what appear to be methane-ice volcanoes on Triton, a moon of Neptune; how are these volcanoes believed to have formed?... ... Our Moon is believed to have had volcanic eruptions at a distant time in its past; why are there no active volcanoes there now?... ... Mars has some of the largest volcanic structures in the solar system; how did they form, and are any still active?... ... Venus appears to have volcanoes, too; what new data about Venusian volcanoes have been collected by the Magellan probe? 62 63 CRATERS in the SOLAR SYSTEM REMOTE ACCESS ASTRONOMY PROJECT UNIVERSITY OF CALIFORNIA, SANTA BARBARA and CENTER for PARTICLE ASTROPHYSICS Image Processing Curricula for High School and College Physics and Astronomy 64 Craters in the solar system Jatila van der Veen, UCSB Physics Department and Adolfo Camarillo High School Philip Lubin, UCSB Physics Department THE FOLLOWING MAY BE REPRODUCED IN ANY FORM FOR USE IN A CLASSROOM, BUT UNDER NO CIRCUMSTANCES MAY ANY PART OF THIS BE REPRODUCED FOR PUBLICATION WITHOUT THE WRITTEN CONSENT OF THE AUTHOR. References: "The Collision of Solid Bodies", Eugene and Carolyn Shoemaker, in THE NEW SOLAR SYSTEM, Beatty and Chaikin, ed., Sky Publishing, 1990. "Killer Crater in the Yucatan", J. Kelly Beatty, in SKY AND TELESCOPE, v.82, no.1, July, 1991. EXPLORING THE COSMOS , Berman and Evans, Little, Brown and Company, 1986. *************************************************************************************** In the following activity, you will: * Compare the sizes of craters on some of the satellites of the planets in our solar system; * Calculate the energy released by a modest-sized meteorite impacting at an average speed. *************************************************************************************** The following activity uses the program IMAGINE-32, by ISIS, to process digital images. Background: Impact cratering is one of the most widely observed geologic processes in the solar system. In fact, there is strong evidence that asteroid or comet impacts have played a role in some of the major extinctions of plant and animal life in the Earth's history. It is estimated that at least 20 craters of diameter 10 km or larger form on the Earth per million square kilometers every billion years, based on craters found on Earth and the number of observed asteroids and comets whose orbits pass close to Earth. On a geologically active planet like Earth, impact craters get eroded relatively rapidly and are difficult to find. On bodies with no atmosphere, water, or active volcanoes, ancient impact craters are preserved. The surfaces of our Moon, Mercury, Venus, Mars, and many of the moons of Jupiter and Saturn are covered with craters. IN THIS ACTIVITY YOU WILL COMPARE IMPACT CRATERS ON TWO OF THE SATELLITES OF SATURN AND OUR MOON. Open the program IMAGINE-32 and click on the "floppy disk" icon to bring up a list of available files. Select the file MIMAS.FTS. This is a picture taken by Voyager I of Mimas, one of the satellites of Saturn. First expand the image so that you get a closer view; then click on the HIST icon, and adjust the intensity scale so that the bright side of Mimas is not "washed out" and you can see the details of the craters. Notice the very large crater in the northeast quadrant of Mimas. This crater is named Herschel, after the astronomer who first discovered this satellite of Saturn. 65 Estimating the size of the crater Herschel. First we need to determine the scale of this image - that is, how many kilometers are represented by each pixel in the image. We will assume that Mimas is a spherical body and measure the diameter in pixels from top to bottom. Click the left mouse button anywhere inside the image; this will change the arrow into a crosshair, and the coordinates of the pixel on which the crosshair lies will be displayed at the bottom of the screen. Now move the crosshair to your best estimate of the "north pole" of Mimas. Then click the right mouse button, and move the mouse so that the crosshair is on your best estimate of the "south pole" of Mimas. Notice that a line is drawn from the first point to wherever you stop moving and that at the bottom of the screen the length of the line and angle with respect to the x-axis are displayed. Determine the diameter of Mimas in pixels: diameter of Mimas = _______________________________________________ pixels We know from measurements taken by Voyager that the actual diameter of Mimas is 390 km. Now we can find the scale of this image in km/pixel: scale = (diam. in km)/(diam. in pixels) = ___________________________km/pixel Now we can estimate the diameter of the crater.... Notice that the crater is not oriented north-south; find the widest part of the crater, and measure the diameter in the same manner as you measured the diameter of the whole moon. diameter of crater = ____________________________________________pixels Now multiply by the scale factor to find the diameter of Herschel crater in kilometers: diam.(pix) x scale (km/pix) = diam. = _____________________________km What fraction of the diameter of Mimas is the diameter of Herschel crater? ____________________________________________________________ Herschel crater is one of the largest craters observed on any body in the solar system. If the impact had been much larger, Mimas would have broken apart. ************************************************************************************* Comparing Herschel crater on Mimas with craters on Dione: "Trash" the image of Mimas, and then click on the "disk" icon again. Retrieve the file DIONCRAT.FTS. This is an image of Dione, another satellite of Saturn, larger than Mimas. First adjust the intensity scaling of the image using the HIST icon, so that the bright side is not washed out and you can see the craters. Then scroll up once so that a little more than one quarter of Dione is showing in the picture. This image does not show the entire satellite, but you can get a fairly good estimate of where the center of Dione is by observing the curvature of the north and west sides in the image. Once again, we will need to estimate the scale of this image in kilometers/pixel. 66 Try to find the center of Dione from the image. Get as accurate an estimate of the radius of Dione in pixels as you can, using the same method as before. radius in pixels = ____________________________________ The actual radius of Dione is about 560 km. Now you can estimate the scale factor for this image in the same way you did for the image of Mimas. scale factor = (radius in km)/(radius in pixels) = __________________________________ Finding the largest crater on Dione. Scroll up the image as far as it will go. Look for the largest crater you can find, and estimate its diameter in the same way you did for Herschel crater on Mimas. diameter of crater in pixels = _________________________________________________ diameter of crater in km = (diam. in pixels) x (scale factor) = ________________________km What fraction of the diameter of Dione is the diameter of this crater? ______________________________________________________________________ Which crater is larger, this one on Dione, or Herschel on Mimas? _____________________ Which crater is larger IN PROPORTION TO THE BODY IT IS ON? ______________________________________________________________________ A closer look at some craters... Using the “scissors” icon, make a box around that crater on Dione that you just measured. Move the image of the crater to the left side of your screen, and "trash" the full image of Dione. Now retrieve the image of Mimas again, and move it under the image of the crater on Dione. Next retrieve the image called MOON.FTS. This is a close-up picture of a crater on our moon... Compare all three images of craters... Observe the surfaces inside and outside the craters; examine the appearance of the crater walls and the shapes of the craters... As you compare the craters on Dione, Mimas and the Moon, try to answer the following questions. Make your best guesses before looking up any answers! * Is there a difference in the appearance of the inside floor of a crater and the ground surrounding the crater? ________________________________________________________________________ * From what you know or suspect about the way impact craters form, would you expect there to be a difference? Why? ________________________________________________________________________ ________________________________________________________________________ 67 * The majority of craters are circular. Would you expect this? Why? __________________________________________________________________ * Have you observed any examples of impact craters of any kind? What were they, and how were they formed? (Craters can be formed by a variety of falling objects, not only meteorites!) _________________________________________________________________ _________________________________________________________________ * Why do you think so few meteorite craters are observed on Earth compared with other bodies in the solar system? _________________________________________________________________ _________________________________________________________________ * Many large impact craters have peaks in their centers. How do you think these central peaks formed? __________________________________________________________________ __________________________________________________________________ __________________________________________________________________ __________________________________________________________________ Here are some ideas developed by scientists about how craters form. Compare your best-guess answers to the descriptions given below: Bodies that crash into planets or satellites at high speeds create tremendous shock (pressure) waves that penetrate the surface of the planet. These extremely high pressures cause both the target material and the impacting body to get so hot as to melt. (The impacting body may even vaporize, if it is not very large!) The molten material moves outward from the location of the impact, as the shock front expands, and is pushed outward to form a crater rim. After the shock wave passes, material from the crater rim slumps inward and converges in the center to form a peak. Another mechanism which is believed responsible for the central peaks inside craters is simply the elastic rebound of the ground, after the pressure wave has passed. Much material is ejected from the excavated crater. While the floor of the crater is often smooth due to melting, the ground outside the crater is often littered with debris from the impact. The ejecta consist of material spattered out from the floor of the crater, and sometimes chunks of the impacting body itself (if it was massive enough that it did not all vaporize upon impact!). There are often secondary craters observed around large craters, which are made by the ejecta. Rays are observed around young craters on the Moon and other planets, which are made up of ejecta which was shot out from the crater. ************************************************************************************* Going further... estimating the energy released in a typical impact Scientists try to estimate the sizes of bodies that must have made the large craters that we observe on Earth and other planets. While this is actually a rather complicated process that involves doing impact experiments under controlled conditions in the lab, we can make some rough estimates of the amount of energy released by impacting bodies from some simple considerations... 68 1. Impact velocity. Impact velocities are estimated to range from about 5 km/sec for colliding asteroids to 40 km/sec for the body that collided with the Earth 65 million years ago and is thought to be responsible for the mass extinctions of animal and plant life at the end of the Cretaceous period. To be on the conservative side, let's assume an impact velocity of 10 km/sec for a small body that crashes onto the Moon. 2. Size of the impacting body. This is a tough one... A body that could cause a crater of 100-200 km diameter on the Earth is estimated to be 10 km in diameter... Let's be conservative and investigate a more modest body of 1 km diameter. 3. Mass of the impacting body. We need to estimate the density of a chunk of interplanetary material...If it was a rocky piece of material, it could have a density of around 3 - 5 gm/cm3, but if it was a chunk of an iron-nickel meteor, its density could have been 8 - 9 gm/cm3. If it was a piece of comet, on the other hand, its density could have been around 1 - 2 gm/cm3. Let's assume our hypothetical meteorite was a chunk of rock, with a density of 3.0 gm/cm3. Make sure your units are consistent: convert density in gm/cm3 to density in kg/m3 : ___________________________kg/m3 find the volume in m3 for a spherical body from V = (4 π r3)/3 : _________________________________m 3 Mass = (volume) x (density) =_________________________________________kg convert velocity to m/sec : ____________________________________________m/sec Now, let's consider how much kinetic energy is dissipated as heat and other forms of energy when this body of 1 km diameter, density 3000 kg/m3, and moving at a velocity of 10000m/sec impacts a body like the Moon (where we can neglect atmospheric effects). K.E. = 1 mv 2 = __________________________________________________Joules 2 To get an idea of how much energy this really is, consider that 1 megaton of TNT (that's 106 tons of TNT) is equivalent to approximately 4.2 x 10¹⁵ Joules. How many megatons of TNT are equivalent to the energy released by our typical hypothetical impacting body? ______________________________________________________________Megatons of TNT And this is just an average collision! Of course, there are many micro-impacts that are hardly noticed, and there are larger ones that make larger craters, too. 69 If you are interested in studying more about collisions of large and small bodies, you can look up the following items of interest... * The mysterious Tunguska meteorite that hit Siberia in 1908; * The evidence for a large impact that hit the Earth 65 million years ago, and its connection to the extinction of the dinosaurs; * Cosmic near misses: asteroids that have passed close to the Earth in the last decade; * The era of crater formation on the Moon and the history of the solar system; * Impact craters on other bodies of the solar system; * Comets, asteroids and meteors: what they tell us about the material from which the solar system is made; * Try making craters yourself: Get a plate with a rim around it, like a tin pie plate; put down several inches of alternating layers of different powdery substances, such as sand, flour, sugar, cinnamon-sugar (to make a brown layer), etc. Then drop projectiles of different masses from the same height and observe the types of craters you get. (You can also drop the same projectile from different heights.) Experiment with different types of projectiles: marbles or pebbles which do not break apart upon impact will create a different effect from mud balls that will break apart upon impact. Try various methods of obtaining different final velocities: dropping as opposed to throwing, or propelling your projectile through a blow gun or using a sling shot. Observe the structures that form: examine the inside floor of the crater and the ground around the crater for differences; notice the order of the layers of "sediment" that are exposed along the inside walls of the crater, and compare to the order in which the layers of ejecta are laid down; examine the crater wall and look for evidence of a central peak; calculate the energy released for each of your impacts; see if there is a correlation between the appearance of the crater wall and presence of a central peak with the energy of impact. 70 71 KEPLER'S LAWS AND THE ORBIT OF MERCURY A graphing and thinking exercise without images... REMOTE ACCESS ASTRONOMY PROJECT UNIVERSITY OF CALIFORNIA, SANTA BARBARA and CENTER for PARTICLE ASTROPHYSICS Image Processing Curricula for High School and College Physics and Astronomy 72 Kepler's Laws and the Orbit of Mercury A Graphical Demonstration of Kepler's First and Second Laws of Planetary Motion Written by Jatila van der Veen UCSB Physics Department and Adolfo Camarillo High School Data courtesy of Santa Barbara City College Department of Earth and Planetary Science The following may be reproduced in any form for use in a classroom, but under no circumstances may any portion be reproduced for publication without the written consent of the author. -------------------------------------------------------------------------------------------------------------------------------BACKGROUND: From the point of view of an observer on the Earth, it certainly does appear that the Sun and Moon are going around us, rather than the other way around. The noted Greek philosopher, Aristotle, correctly reasoned that the Earth must be round. He also proposed that the Earth was stationary, and the Sun, Moon, planets, and stars moved in circular orbits around the Earth. In the second century AD Ptolomey elaborated on Aristotle's model. He proposed his Eight Spheres of the Universe, in which the Earth was in the center of the universe, the Moon and each of the known planets moved around the Earth its own sphere, and the outermost sphere contained the fixed stars. The early Church adopted Ptolomey's model, as it was in keeping with their interpretation of the Bible, and left room for heaven and hell outside the sphere of the fixed stars. You know that any scientific model or theory must be able to explain observations, and that if a theory repeatedly fails to explain observations, it needs to be modified. Ptolomey's geocentric (Earth-centered) model of the universe failed to explain the observations that the planets appear at times to move backwards relative to us, and sometimes to overtake each other. To explain the apparent retrograde (backwards) motion of Mars, for example, Ptolomey proposed that superimposed on its overall circular motion, Mars underwent smaller circular movements called epicycles. Because Ptolomey's geocentric model supported the prevailing view of the Church, which controlled most of European civilization at the time, it was generally accepted. People who disagreed with this viewpoint had to keep silent or face excommunication or execution - or both. For this reason, when the Polish priest and natural philosopher Nicolaus Copernicus proposed his simpler heliocentric (sun-centered) model in 1514, in which the Earth and planets revolved about the Sun, he kept silent about it, circulating it anonymously. It wasn't until the early 1600's that Galileo, using a telescope which had just been invented, observed the orbit of Jupiter’s four inner moons and demonstrated that the Earth did not have to be in the center of everything. Galileo was forced by the Church to publicly retract his ideas and spent the latter part of his life under house arrest because of his views. (Ironically, it was not until 1992 that the Roman Catholic Church officially pardoned Galileo, and admitted that it was wrong to have imprisoned him!) The four innermost moons of Jupiter that were first observed by Galileo are now called the Galilean moons, after him. At about the same time that Galileo was publishing his observations of the moons of Jupiter and the Copernican model was gaining in popularity, Johannes Kepler, a young Danish astronomer, suggested that the planets revolve about the Sun in elliptical, rather than circular orbits. Kepler took over as Royal Astronomer from Tycho Brahe, inheriting Tycho's ingeniously designed observatory and his more than 20 years' of observational data. Based on Tycho's data and his own observations, Kepler proposed what are now known as "Kepler's Laws of Planetary Motion". These famous laws rank second only to Newton's Big Three in our understanding of classical physics and are studied by every beginning physics student. 73 In short, Kepler's Laws state: 1) The planets move in elliptical orbits with the Sun at one focus; 2) A radius vector from the Sun to a planet sweeps out equal areas in equal periods of time; 3) The ratio of the cube of the average distance of any planet from the Sun to the square of its period of revolution is a constant. It was not until the latter part of the 1600's that Sir Isaac Newton provided a correct explanation of Kepler's Laws, based on his own three force laws (inertia, F=ma, and action/reaction) and his law of gravitation . ************************************************************************************* Given the distance from the Sun of 18 positions of the planet Mercury, ACTIVITY 1: plot the orbit of Mercury around the Sun. First, look over the data, and make sure you understand what information is contained in these data points by answering the following questions. Each data point represents one observation of the position of the planet Mercury. Note: the time for Mercury to complete one complete orbit is 88 days. 1) How many days separate each observation? ________________________________ 2) Is there any interval which is different from the rest? If so, which two observations are separated by a different time interval?________________________________________ 3) How many days separate those two observations? ____________________________ The degrees represent the angular distance Mercury has traveled during each time interval, and the distance measurements tell how far from the Sun Mercury is at each observation. Note: 1 Astronomical Unit (A.U.) = 150 million km, or 1.5 x 10⁸ km, or 1.5 x 10¹¹ meters. observation # 1 2 3 4 5 6 7 8 9 10 11 12 13 14 15 16 17 18 degrees 4 31 61 92 122 149 172 192 209 224 239 252 266 280 295 311 330 350 distance from Sun (A.U.) .35 .32 .31 .31 .32 .35 .38 .41 .43 .45 .46 .47 .47 .46 .44 .42 .40 .37 74 PROCEDURE: 1. Holding a piece of graph paper sideways, put a dot for the Sun a distance about 5 inches from the bottom. (This choice of where to put one focus is so that your ellipse will fit on the paper.) 2. With a protractor, put dots at the angular distances indicated for each data point, going counter clockwise, with 0°° on the right. 3. Use the scale that 1 inch = .1 AU. Measure the distance from the Sun for each data point and put a dot at that distance. When you have plotted all 18 data points, connect the dots as smoothly as you can. You have now plotted the orbit of the planet Mercury! THOUGHT QUESTIONS: 1) Is the distance from the Sun to Mercury constant? ______________________________ 2) What shape is the orbit?___________________________________________________ 3) Is the orbit of Mercury highly elliptical or only a little elliptical? ___________________ ... You can see that the orbit is not highly elliptical. In fact, if you erase (for a moment) the dot you made for the Sun, and only look at the path of Mercury, the orbit looks like a pretty good circle, doesn't it? Actually, the farthest out planet, Pluto, has the most eccentric (elliptical) orbit, sometimes even coming inside the orbit of the second farthest planet, Neptune. ************************************************************************************ ACTIVITY 2: Given the orbit you just plotted (put the Sun back where it was), see if the area of a sector swept out by a vector from the Sun to Mercury remains constant between any two data points separated by EQUAL periods of time. PROCEDURE: 1. Choose data points 2 and 3 as one pair, and data points 10 and 11 as another pair. Draw the radius vector from the Sun to each data point. Call the sector formed by the radius vectors to points 2 and 3 "sector A", and the sector formed by the radius vectors to points 10 and 11 "sector B". 2. Label the distance in AU to each data point. Find the average radius for each sector as raverage = (r1 + r2)/2, and measure the central angle, Θ, for each sector. 3. Compute the approximate area of each sector as: (Θ Θ/360) x π (raverage)2 sector A: sector B: raverage = (r2+r3)/2 = ___________ Θ2-3 = area = ______________ _____________ AU2 raverage = (r10+r11)/2 = ________________ Θ10-11 = ________________ area = ________________AU2 75 THOUGHT QUESTIONS... 1) Compare the areas of sectors A and B. Are they approximately equal, considering the approximations we have made? _________________________________________________ 2) The time separating data points 2 and 3 is equal to the time separating data points 10 and 11. What relationship would you expect to find between the areas of the sectors A and B, as opposed to the area of a sector swept out by the radius vector between data points 18 and 1? (Look back at your plot and at the data table...) Give a reason for your statement. ___________________________________________________________________________ ___________________________________________________________________________ 3) When do you think Mercury is moving faster, from data point 2 to 3, or data point 10 to 11? Why? ___________________________________________________________________________ Now for a bit of calculations to check our hypothesis... Recall that for a body moving at a constant speed v, v = distance/time. We know from geometry that the distance s that Mercury travels between two points can be approximated as: s = raverage x Θ where r average is the average distance of Mercury from the Sun, s stands for arc length, and Θ is measured in radians. Let's see if we can calculate the average speed of Mercury as it travels the path between data points 2 and 3, when it is closer to the Sun, and then between data points 10 and 11, when it is farther from the Sun... Be sure to convert degrees to radians for this calculation. 1 radian = 57.3o approximately. Θ2-3 = _____________________radians Θ10-11 = _____________________radians Convert Astronomical Units to meters, also. 1 AU = 1.5 x 10¹¹ meters. r2-3av = ____________________ meters r10-11= ______________________ meters (a) Find the time separating data points 2-3 and 10-11 in seconds: 5 days = ___________________________________________________seconds (b) Find the distance Mercury travels between each pair of observations: r2-3av. x Θ 2-3 = ____________________________________________meters r10-11 x Θ10-11 = ___________________________________________meters (c) Find the speed of Mercury between each pair of data points: 76 v2-3 = _____________________________________________________m/sec v10-11 = ___________________________________________________m/sec SO...WHEN DOES A PLANET TRAVEL FASTER, WHEN IT IS CLOSEST OR FARTHEST FROM THE SUN? ________________________________________________________ ************************************************************************************* Bonus question: There is a connection between the observation you just made that a planet speeds up when it is closer to the Sun and an ice skater doing a spin and pulling in his or her arms in order to spin faster. What famous law of physics links these two observations and explains Kepler's Second Law? Explain in as much detail as you can on a separate sheet of paper. ************************************************************************************* ...The next activity in this series deals with the Saturnian system. Galileo showed that the satellites of Jupiter follow the same laws of planetary orbits as do the planets of the solar system in their paths around the Sun. In fact, you can show that any planetary system behaves like a mini solar system, obeying Kepler's Laws. In the following activity, "The Moons of Saturn", you will demonstrate Kepler's Third Law of planetary motion, using the distances and orbital periods of the moons of Saturn, and also learn about some of the new information revealed by the Voyager spacecraft regarding the Saturnian system... ************************************************************************************* 77 Supplemental Activity: Demonstrating elliptical orbits on paper. You can demonstrate how to draw increasingly elliptical orbits with a simple technique. Get two straight pins, a heavy piece of cardboard, a piece of paper, about ten or twelve inches of string, a pencil, and some tape or thumb tacks to fasten the paper to the cardboard. Fasten the paper to the cardboard, and put a dot in the center to serve as the Sun. Stick both straight pins into the center of the dot, as close together as you can make them. Tie the string into a loop, and loop it over the pins. Using the loop as a radius, put the pencil in the other side of the loop, and draw a circle, as you would with a compass. Now move one of the pins about an inch away from the "Sun", and again, putting the pencil in the other end of the loop, draw a "circle" around the pair of pins. Keep moving that pin by a little more each time, and draw a "circle" around the pins for each pin separation. Note how the shape of the "circle" changes as you increase the separation between the pins...it changes into an ellipse! You can calculate the eccentricity of each ellipse in the following way: Measure the short distance from your "Sun" to the edge of the ellipse for each pin separation; call this distance r1. Measure the long distance from your "Sun" to the edge of the ellipse for each pin separation; call this distance r2. The eccentricity of the ellipse is calculated as: e= (r2 − r1 ) (r2 + r1 ) 78 79 THE MOONS OF SATURN REMOTE ACCESS ASTRONOMY PROJECT UNIVERSITY OF CALIFORNIA, SANTA BARBARA and CENTER for PARTICLE ASTROPHYSICS Image Processing Curricula for High School and College Physics and Astronomy 80 THE MOONS OF SATURN Jatila van der Veen, UCSB Physics Department and Adolfo Camarillo High School Philip Lubin, UCSB Physics Department THE FOLLOWING MAY BE REPRODUCED IN ANY FORM FOR USE IN A CLASSROOM, BUT UNDER NO CIRCUMSTANCES MAY ANY PORTION BE REPRODUCED FOR PUBLICATION WITHOUT THE WRITTEN CONSENT OF THE AUTHOR. ************************************************************************************* In the following activity you will: * Demonstrate Kepler's Third Law for planetary orbits, using data published by NASA of the distances and rotation periods of the moons of Saturn; * Compare images of the moons of Saturn and investigate their surface features and possible origins. ************************************************************************************* References: “The Moons of Saturn,” Soderblom and Johnson, in EXPLORING SPACE, Scientific American special issue, 1990; The New Solar System, Beatty and Chaikin, ed., Sky Publications, 1990. Background: The large outer planets of our solar system have smaller bodies and rings in orbit around them, almost like mini solar systems themselves. When the Voyager missions flew by Jupiter, Saturn, Uranus, and Neptune, many more moons were discovered than had previously been observed from Earth. The moons of each planet are all very different from one another - in types and numbers of craters, composition, geologically active or not - and interact with each other and their planet in interesting ways. In this activity you will investigate the moons of Saturn. You will graph the relationship between the distance from Saturn of each moon and its orbital period, demonstrating Kepler's Third Law of planetary motion. You will also look at images of the moons taken by the Voyager cameras, using the IMAGINE-32 program, and study a bit about each one. ************************************************************************************* SATURN'S MOONS...ORBITAL DATA Name Atlas Prometheus Pandora Epimetheus Janus Mimas Enceladus Tethys Telesto Calypso Dione Helene Rhea Titan Hyperion Iapetus Phoebe Orbital Period (Earth days) 0.602 0.613 0.629 0.694 0.695 0.942 1.370 1.888 1.888 1.888 2.737 2.737 4.518 15.945 21.277 79.331 550.480 Ave. dist. from Saturn (km) 137,640 139,350 141,700 151,422 151,472 185,520 238,020 294,660 294,660 294,660 377,400 377,400 527,040 1,221,850 1,481,000 3,561,300 12,952,000 81 1) First of all, given these data, what do you immediately notice about the three moons Tethys, Telesto, and Calypso, and the two moons Dione and Helene? _________________________________________________________________________________ Right! These two groups of satellites are co-orbital, that is they lie at the same distance from Saturn, and have the same orbital period. In 1772, the famous mathematician, Joseph Louis Lagrange, discovered that, in a system which consists of a satellite in orbit around a larger body, there are five positions at which a third body can also maintain an orbit. These positions are now called Lagrange points after him. Three of these positions: inside the orbit of the satellite, outside the orbit of the satellite, and at the point in the orbit directly opposite the satellite, are unstable. The other two: at the same radius as the satellite, 60o ahead and 60o behind it, are stable. Telesto and Calypso occupy the stable Lagrange points in the orbit of Tethys, one about 60o ahead of Tethys, the other about 60o behind, all three at the same orbital radius. Similarly, Dione and Helene are co-orbital Lagrangian moons, with Helene orbiting about 60o ahead of Dione. 2) What do you notice about the two moons Epimetheus and Janus? __________________________________________________________________________________ Well, they are not exactly co-orbital, but they are close...close enough that their mutual gravitational attraction perturbs their orbits, causing them to change places with each other every few years. Epimetheus, in a slightly smaller orbit, and with slightly greater orbital velocity, slowly overtakes Janus. As Epimetheus approaches Janus, it gains angular momentum from Janus. This causes Epimetheus to swing into a wider orbit, where its orbital velocity is reduced. Meanwhile, as Janus loses angular momentum to Epimetheus, it moves into a smaller orbit, where its orbital velocity is increased! The two moons reverse places, and the "swing dance" begins again. Between the two inner moons Prometheus and Pandora lies one of Saturn's rings, the F ring, which appears to have a multi-strand or "braided" structure. These two moons are believed to confine the F ring with their gravitational fields and are called the "shepherd moons." ************************************************************************************* All but two of the moons of Saturn form what is called a regular system of satellites, which means that their orbits are nearly circular and lie within the equatorial plane of the planet. The two exceptions are Iapetus, inclined at 14.7o and Phoebe, whose orbit is inclined at 150o to Saturn's equatorial plane. Regular satellite systems and rings are now believed to form as a by-product of the accretion of giant planets and are also observed around Jupiter, Uranus, and Neptune. All but the three outermost moons of Saturn appear to be in synchronous rotation, which means they keep the same face turned toward Saturn all the time - like our Moon as it revolves around the Earth. These regular satellite systems are reminiscent of miniature solar systems - and should, therefore, obey Kepler's Laws. In particular, these data provide an opportunity to test Kepler's Third Law, which relates a planet's distance from the Sun to its orbital period. 82 Recall the derivation of Kepler's Third Law: We start with Newton's Second Law for a body undergoing uniform circular motion under the influence of a gravitational force: F = GMm/r2 = mv2/r (1) Because the speed with which the body orbits is fairly constant, we can substitute for v: v = 2π πr/T (2) where T is the period of the orbit in seconds, v is the velocity of the body in meters per second, and 2π πr is the circumference of the orbit, assumed circular for the purpose of simplifying our calculations. Eliminating the mass, m, of the orbiting body in equation (1), and substituting for velocity from equation (2) into equation (1), we have (after a bit of algebraic massaging) Kepler's Third Law of planetary motion, relating the distance, r, and the period, T, of a body in orbit around a larger mass, M: (3) r3/T2 = GM/4π π2 G is the Universal Gravitational Constant, 6.67 x 10⁻¹¹ Newton-meters2/kg2; M is the mass of the central body being orbited - Saturn, in this case - so the right side of equation (3) is equal to a constant! If, for a moment, we call that constant "k", then we can re-write equation (3) as: (4) r3 = kT2 You are going to make a graph of r3 vs. T2 for the moons of Saturn. That is, the values of T2 will be the x-axis values, and the values of r3 will be the y-axis values. WHAT DO YOU PREDICT THE GRAPH OF r3 vs. T2 WILL LOOK LIKE? _________________________________________________________________________________ TESTING YOUR PREDICTIONS... Go back to the list of distances and orbital periods for the moons of Saturn. Now you will use the program VGRAPH by Vernier Software, or any other graphing program you have, to graph these data. First you will enter the data for period in Earth days and distance in kilometers, as they are written in the data table at the beginning of this lab. The program will prompt you for the x- and y-axes values, and labels for these axes. For the x-axis values, enter the orbital period for each moon, in units of Earth days. For the y-axis values, enter the orbital distance for each moon, in kilometers. NOTE: FOR THE CO-ORBITAL MOONS, BE SURE TO ENTER ONLY ONE PERIOD/DISTANCE DATA PAIR! Now plot the graph of unmodified data. If you are using VGRAPH, select the options: grid on graph, line connecting points, and axis starts at (0,0). DOES THE SHAPE OF THIS GRAPH MATCH YOUR PREDICTION ABOVE? _________________________________________________________________________________ 83 Print out your graph, or make a sketch of it on a separate sheet of paper. Now go back to the main menu and select the option MODIFY DATA. The program will prompt you for how you wish to modify the data on each axis. For the x-axis (period), select RAISE TO POWER of 2; for the y-axis (distance), select RAISE TO POWER of 3. Now go back to the main menu and graph the modified data. You can keep the same settings for the graph. DOES THE GRAPH MATCH YOUR PREDICTION NOW? _______________________________ Print out your graph or make a sketch of it below the other graph. EXTRA CREDIT: Go back to the beginning of the program, and choose the option LOAD DATA FROM DISK. Choose the file called KEPLER3.DAT. Display the data table. What is this a table of? ________________________________________________________________________________ Right! This is a table of distance from the Sun and orbital period for the nine major planets of the solar system. Now graph these data with r on the y-axis and T on the x-axis. What does the graph look like? _______________________________________________________________________________ Now go back and modify the data in the same way you modified your data, and then re-graph. What does the graph look like this time? _______________________________________________ How does it compare to the shape of the graph of r3 vs. T2 for the Saturnian moons? ________________________________________________________________________________ What does this tell you about the behavior of the Saturnian moon system and the solar system? ________________________________________________________________________________ If you graphed the distances and orbital periods of the moons of Jupiter, how would you expect that graph to compare to your graphs of r3 vs. T2 for the solar system and the moons of Saturn? ________________________________________________________________________________ ************************************************************************************* FURTHER STUDY...OBSERVING IMAGES OF SATURN'S MOONS In the IMAGINE-32 program, click on the "floppy disk" icon. Choose the images, one at a time, to look at. There are no images of some of the moons; that is because they are not available in the data set which is published by NASA. For each image, comment on the following: overall shape - round, oval, irregular; sizes, appearances, and distribution of craters; any unusual features that are visible in the image. *************************************************************************************** Pandora: Mimas: Enceladus: Tethys: Telesto: Calypso: 84 Dione: Rhea: Titan: Hyperion: Iapetus: Phoebe: ************************************************************************************* The teams of scientists who have been analyzing the data brought back by Voyager I and II have found a wealth of interesting information about the moons of Saturn. Here are just a few features of interest, about which you might want to do some further research of your own: * All Saturn's moons have bright reflecting surfaces, except Titan, which indicates that their surfaces are probably made of water ice. Their densities range from about 1.2 gm/cm3 to about 1.9 gm/cm3, indicating that they are composed of ice and rock. At temperatures below 100 Kelvin, and under extremely low pressures, water ice behaves like rock. The surfaces of these moons are heavily cratered, looking much like the highland areas of Earth's Moon. * Titan is Saturn's largest moon, the only one that is larger than Earth's Moon. It is the only one of Saturn's moons that has an atmosphere, consisting mainly of molecular nitrogen (82-99%), methane, and argon, with minor amounts of hydrogen, some hydrocarbon compounds, some nitrogen compounds, and some trace amounts of carbon monoxide and carbon dioxide. * Enceladus appears to be the only moon which is geologically active, with much of its cratered surface being re-worked by what appears to be water volcanism. * Iapetus has the lowest density, about 1.1 gm/cm3, of Saturn's moons. Like most of the other moons, it keeps one face always turned toward Saturn. Iapetus' leading face, the side that always points in the direction of its orbital motion, appears dark, while the trailing face is very reflective. * Some of the smaller moons, such as Telesto and Calypso, are highly irregular in shape, suggesting that they may be brittle fragments of a larger body that broke up in the past. * Phoebe, the outermost moon, is very dark compared with the other moons, and it moves in a retrograde, tilted, eccentric orbit. * The satellites of Jupiter exhibit a trend of decreasing density with distance from Jupiter, similar to densities of the planets of the solar system with respect to distance from the Sun. The satellites of Saturn do not show such a trend, but icy bodies are distributed throughout the Saturnian system. 85 TRACKING SUNSPOTS REMOTE ACCESS ASTRONOMY PROJECT UNIVERSITY OF CALIFORNIA, SANTA BARBARA and CENTER for PARTICLE ASTROPHYSICS Image Processing Curricula for High School and College Physics and Astronomy 86 Tracking Sunspots Jatila van der Veen, UCSB Physics Department and Adolfo Camarillo High School Philip Lubin, UCSB Physics Department THE FOLLOWING MAY BE REPRODUCED IN ANY FORM FOR USE IN A CLASSROOM, BUT UNDER NO CIRCUMSTANCES MAY ANY PORTION BE REPRODUCED FOR PUBLICATION WITHOUT THE WRITTEN CONSENT OF THE AUTHORS. References: THE NEW SOLAR SYSTEM, Beatty and Chaikin, ed., Sky Pub., 1991; ASTRONOMY: FUNDAMENTALS AND FRONTIERS, Robert Jastrow, Wiley & Sons, 1977; EXPLORING THE COSMOS, Berman and Evans, Little, Brown & Co., 1986. ************************************************************************************* IN THIS ACTIVITY YOU WILL TRACK THE MOTIONS OF SUNSPOTS IN IMAGES OF THE SUN TAKEN AT THE N.O.A.A. SOLAR OBSERVATORY AT BOULDER, COLORADO, AND MEASURE THE ROTATION RATE OF THE SUN AT THE SOLAR EQUATOR. ************************************************************************************* This activity makes use of the program IMAGINE-32 by ISIS of Santa Barbara for processing of digital images. ************************************************************************************* Background: Recorded observations of sunspots date back 2000 years to ancient Chinese observers; Indian astronomers also recorded observations of sunspots, and there are references to them by Greek observers from around 400 BC. In western history, Galileo was among the first observers to look at the Sun through a telescope in 1610 and observe "dark spots" on its face. In ordinary visible light sunspots appear dark compared to the rest of the solar surface because they are cooler than the surrounding regions - "only" about 4000 K, while the average temperature of the photosphere (solar surface) is about 6000 K. The reason why sunspots are cooler than the rest of the Sun's surface has to do with the complicated interaction between the solar magnetic field, the convecting ionized gases that rise to the surface in the outer layers of the Sun, and the fact that the Sun does not rotate as a rigid body... Heat transport in the Sun... The Sun is made mostly of ionized hydrogen. In the core, where the thermonuclear reactions that make the Sun "shine" are taking place, the temperature is millions of degrees Kelvin. Heat is carried away from the core to the outer layers by the slow process radiative transport. It takes photons hundreds of thousands of years to travel from the interior of the Sun to the outer layers. Within the upper 100,000 km of the Sun, however, heat is transported to the surface more rapidly by convection. Magnetic fields in the Sun... The strong magnetic fields of sunspots keep the hot, ionized gases from reaching the surface and releasing their heat directly below the sunspots; this causes sunspots to be somewhat cooler than the rest of the Sun's surface and appear dark in comparison. (If you could isolate sunspots, however, they would appear far brighter than the full Moon, but somewhat red.) The Sun as a whole has a weak magnetic field, similar to that of the Earth, with the magnetic field lines emerging at the north pole and re-entering at the south. The overall intensity of the solar magnetic field is about 1 Gauss - the same as that of the Earth. (1 Gauss = 10-4 Tesla = 10-4 Newton/Amp⋅meter.) In sunspots, however, the local magnetic field can be several thousand times stronger. We know this is so because of the splitting of the lines in the absorption spectra of sunspots. This effect, called the Zeeman effect after the Dutch physicist who discovered it in 1886, was first observed for sunspots by George Ellery Hale in 1908, at the Mount Wilson Observatory. 87 Rotation rates of the Sun and formation of sunspots... The Sun behaves like a fluid. While planets are solid and rotate as rigid bodies, the Sun rotates faster at its equator than at its poles. As a result, the north-south magnetic field lines get stretched out in an eastwest direction at lower latitudes, eventually pinching off and forming intense localized fields, aligned roughly east-west. Sunspots tend to form in pairs, one a north magnetic pole where the local field lines emerge from the surface, and the other a south pole where the local field lines plunge back into the solar surface. Sunspots are often accompanied by towering arcs of ionized gases which follow these local field lines. New sunspots first appear at latitudes around 35° north and south of the equator. Occasionally sunspots are observed at higher latitudes. One way that astronomers have deduced the variable rotation rate of the Sun is by observing the motions of sunspots at different latitudes. (The other way is by observing the DOPPLER SHIFT of spectral lines in the photosphere at various latitudes.) Observing the Sun: You cannot observe the Sun directly in visible light! (You knew that...) However you can observe sunspots with a small telescope if you project the image of the Sun onto a screen. If there are any sunspots, they will appear as dark, hairy spots on the solar disk. Other ways to observe the Sun are with special filters or digital cameras that are sensitive at X-ray or other wavelengths. About these images: The images you will use in this activity were taken with an "H-α" (pronounced "H-alpha") filter. This is a special, very narrow-band red filter, centered on the 6563-Ångstrom line emitted by excited neutral hydrogen. Because the Sun is made up mostly of hydrogen, this 6563-Å line is one of the strongest absorption lines in the solar spectrum. Most of the photons of that wavelength coming from the surface of the Sun (the photosphere) are absorbed before they reach the solar "atmosphere" (the chromosphere). Only 6563-Å photons that originate in the chromosphere escape into space and are visible to us. So, when you look at these images, you are mainly looking at features in the chromosphere, or lower part of the solar atmosphere. Because sunspots are about 2000 K cooler than the surrounding photosphere, in the chromosphere directly above the sunspots, the ionized hydrogen actually cools down enough to capture a free electron and become neutral hydrogen (1 proton, 1 electron). This neutral hydrogen is heated and excited, causing the hydrogen to emit photons at its characteristic frequencies in the visible spectrum. The strongest emission is the one at 6563 Ångstroms, corresponding to red light. (In fact, if you are lucky enough to observe a total solar eclipse, you can see a faint red rim around the Sun at totality which is the red glow of the H-alpha photons in the chromosphere!) These images were all taken with a digital camera and appear in "black & white.” The parts that are dark in the picture are H-α absorbers, and the features that appear bright are H-α emitters. Locally intense magnetic fields in the photosphere often cause gases in the chromosphere to heat up and glow brighter than their surroundings. Called plages ("beaches" in French), these irregular bright patches of hot, disturbed gas usually precede the formation of sunspots and persist even after the sunspots have disappeared. You can see plages on some of the images; sunspots show through these plages as dark patches. To see them better, you can box off part of the solar image and enlarge it. You will also notice irregular, snaky, dark lines on these images; these are filaments of gas that stick up above the Sun. When these filaments approach the limb of the Sun as it rotates, they can be seen as bright curtains of gas that protrude many hundreds to thousands of kilometers above the surface. They are strong H-alpha absorbers and, hence, appear dark when seen through the 6563-Angstrom filter. 88 CALCULATING THE AVERAGE SPEEDS OF SUNSPOTS Go to the IMAGINE-32 program and click on the “disk” icon; retrieve one of the solar images called SUNxxxx.FTS. The four numbers after the word “SUN” indicate the month and day that each image was taken. You will need four or five images that were taken on consecutive days. Bring up each image, one at a time, on the screen. To get a better idea of whether there are sunspots near or in a bright region, you may need to make a box around a particular region, and enlarge it. Then click on the x:y:z: icon and record the x and y coordinates of each spot. Another way of getting a better idea of the coordinates of sunspots is to click on the "magnifying lens" icon. This brings up the zoom window. Move the mouse around your image and watch the zoom window! The coordinates of the cursor also appear at the bottom of the zoom window. First: set the coordinates for each image so that (0,0) is in the center... For the calculations that we will do, we need to have the coordinates of the center of each image be (0,0). Check the coordinates of the upper left-hand corner and lower right-hand corner of your image. "Raw" images usually have (0,0) in the upper left and (512,512) in the lower right. You can change these by clicking the left mouse button on the "*" in the upper left corner of the image title. This brings up a list of the display parameters of the current image. CRVAL1 and CRVAL2 are the x and y coordinates of the upper left-hand corner of the image. CDELT1 and CDELT2 are the increments by which the x and y coordinates change across the image. To change any of the values, click in the appropriate box and type in your number. Do this for all the values you need to change and then click on "Okay". Now change CRVAL1 to -255.5, CRVAL2 to 255.5, and CDELT2 to -1. This will put (0,0) in the center of your image and (-255.5, 255.5) in the upper left- hand corner. DO THIS FOR EACH IMAGE YOU WILL USE. Now find the same sunspot in each image. You may want to "shrink" each image and line them all up on the screen for comparison. Then look at each full size image again to get the coordinates of the same spot in each image. For each image record the date (the four numbers after the word "SUN" in the title of the image) and the x and y coordinates of the same spot as it appears in each image. **************************************************************************************** RAW DATA: #1___________ #2____________ #3______________ x:___________ ______________ ______________ #4____________ (If you use more than 4 images, _____________ use more paper!) y: __________ ______________ ______________ _____________ TRANSLATING FROM FLAT IMAGES TO THE REAL SUN... Now comes the tricky part: we have pictures that are a projection of a round object onto a flat plane. When we observe the motion of a feature going around the sphere of the Sun ON A FLAT IMAGE we may get the wrong idea about how fast the feature is moving. It will seem to us, from our point of view, that when a particular sunspot is near the edge of the Sun in our image it moves more slowly than when it is closer to the center of the Sun IN OUR PARTICULAR FIELD OF VIEW. So, we have to translate the motion we observe on the flat image to what is really happening on the spherical surface of the Sun... On a flat plane, like our picture, we find it most convenient to express the position of a point in terms of its x and y (Cartesian) coordinates. A sphere is 3-dimensional, so we have to add a third axis, z. Because our image of the Sun is a projection of 3 dimensions onto 2, we can translate what we observe in 2 dimensions back to 3 dimensional "reality" by using a bit of simple trigonometry... 89 We translate the motion we observe in 2 dimensions to motion on a sphere in terms of r, the distance from the center of the sphere, and two angles: Θ, the angle from north to south, and φ, the angle from east to west. Omitting the derivation (you can look that up yourself if you are interested!) we can find φ and Θ from our x and y measurements by: x φ = tan-1 2 2 2 R −x −y and y Θ = cos-1 r Here R is the radius of the whole Sun, and r is the projection of the vector R onto the x - z plane, and is found by: r= R 2 − y2 y y x x R x y θ y r z x ϕ 2-D SOLAR IMAGE 3-D SUN CALCULATIONS (1) Find the radius of the Sun in pixels by finding the diameter and dividing by 2. R = _________________________________________________________ 90 z (2) Find the coordinates on the sphere of the Sun for each of your sunspot measurements. #1____________ #2_____________ #3_______________ #4_________________ r: ____________ ______________ _______________ _________________ φ: ____________ ______________ _______________ _________________ Θ: __________ ____________ _____________ ______________ (3) Find how much your sunspot moved each day, then take the average, and compare. DELTA φ: φ2 - φ1 = _______________________________________________________________ φ3 - φ2 = _______________________________________________________________ φ4 - φ3 = _______________________________________________________________ average delta φ = _______________________________________________ This is the angle we are really interested in, and represents degrees/day that a sunspot rotated. Turn your calculations for the average delta ϕ of degrees/day into days/rotation: degrees/day x 1 rotation/360 degrees = rotations/day = _____________________________________________________________________ .... then invert this number to get days/rotation! (rotations/day)-1 = days for 1 rotation at the equator = ____________________________________________________________________ If you came out with an answer in the neighborhood of 25 to 27 days, you are correct! ANALYSIS 1. Measurement errors: About how many pixels, on the average, did you find that a sunspot moved in a day? __________________________________________________________________ What would you estimate your error in picking the same point on the sunspot in each image: + or - how many pixels? ___________________________________________________________________ What percent of the daily change in position of a sunspot is your error in picking the same point on that sunspot? ___________________________________________________________________ 91 How do you think your errors in measuring the coordinates of the sunspot in each image affected your estimates of the rotation rates? ___________________________________________________________________ The Sun is the closest star that we can study; the next closest star, Alpha Centauri, is about 4 light years away. (One light year is around 9 trillion kilometers). If these images have intrigued you, you may wish to study more about the Sun. Here are just a very few ideas for you to investigate: * The relation between sunspots, flares, and magnetic storms on Earth; * The solar corona, solar wind, and the aurora that is seen at high latitudes on Earth; * The production of energy in the Sun by thermonuclear reactions; * Heat transport in the Sun from the core to the surface, by radiation and convection; * Helioseismology: studying the interior structure of the Sun with acoustic waves that travel throughout the Sun like earthquake waves do on Earth; * The mission of the space probe Ulysses, which will sling-shot around Jupiter and return to the Sun in a polar orbit; * The X-ray Sun: what we can learn about the Sun by observing it in the "light" of X-ray photons; * The life cycle of the Sun: What is its ultimate fate? How long will it last? Will it ever become a black hole??? 92 93 COBE for (BIG) KIDS: Discovering how the results of the COSMIC BACKGROUND EXPLORER SATELLITE help us understand the early UNIVERSE REMOTE ACCESS ASTRONOMY PROJECT UNIVERSITY OF CALIFORNIA, SANTA BARBARA and CENTER for PARTICLE ASTROPHYSICS Image Processing Curricula for High School and College Physics and Astronomy 94 Discovering how the results of the COSMIC BACKGROUND EXPLORER SATELLITE (COBE) constrain models of structure formation in the EARLY UNIVERSE Jatila van der Veen, Adolfo Camarillo High School and UCSB Physics Department Alex Wuensche, UCSB Physics Department Philip Lubin, UCSB Physics Department; Director, Remote Access Astronomy Project August, 1993 The following may be reproduced in any form for use in a classroom, but under no circumstances may any part be reproduced for publication without the written consent of the authors. ************************************************************************************* The following series of image processing activities utilizes the program IMAGINE-32 by ISIS of Santa Barbara, which is a licensed, non-shareware program. ************************************************************************************* Recommended preparation: Computer-guided tutorials "Seeing the Universe with Other Eyes: An Introduction to Infrared Astronomy" and "Cosmology for Kids" (both by the same authors, and available from the ASTRO-RAAP bulletin board). The references we used include: THE BIG BANG by Joseph Silk, W.H. Freeman and Co., 1989 (for an excellent and understandable explanation without math); "The Cosmic Background Explorer" by S. Gulkis, P. Lubin, S. Meyer, and R. Silverberg in Scientific American Special Issue, September, 1990; STRUCTURE FORMATION IN THE UNIVERSE by T. Padmanabhan, Cambridge University Press, 1993 (for a complete mathematical treatment of the subject); and various COBE preprints. ************************************************************************************* NOTE: The maps you need for this activity are: SKY31.FTS, SKY53.FTS, SKY90.FTS, SKY408.FTS, ALLSKY.FTS, GAL53.FTS, DIPOL53.FTS and QUAD53.FTS. You will also need to be sure that the following files are loaded in the same directory as the IMAGINE-32 program: GAUS.MSK and COBE.PAL. All these files are available from the ASTRO-RAAP bulletin board, or from the University of California, Santa Barbara, Physics Department, Remote Access Astronomy Project. ************************************************************************************** BACKGROUND INFORMATION: The Cosmic Microwave Background Radiation (hereafter referred to as CBR), which was first detected in 1965 by Arno Penzias and Robert Wilson of Bell Labs in New Jersey, was found to be quite homogeneous and isotropic (looks the same in any direction) out to around a few parts in 104. The CBR is believed to originate from the era in the history of the universe when matter and radiation first separated, about 300,000 years after the initial singularity ("Big Bang"). It is the oldest electromagnetic radiation that we can detect, having a redshift of about 1000. It is difficult to reconcile the smoothness of the CBR with what we understand of how the universe could have come into existence. Several questions naturally arise: First of all, at the time of the decoupling of matter and radiation, the horizon (limit of what any single hypothetical observer could detect) would subtend 2o of angle today. Regions separated by 2o or more were not in causal contact, which means that a signal would have taken longer to travel between these regions than the time for light to cross that distance. So if the CBR is homogeneous to a few parts in 104, then that isotropy must have been in place at earlier times. This raises another question: if the initial big bang was completely isotropic, we would not be here today! We know that in the very early universe, when the temperature exceeded a few million electron volts per particle, there were particle/antiparticle pairs being created out of the intense radiation. At that time there was an equilibrium between particle pair creation and mutual annihilation. When the temperature dropped below this value, no more particle pairs could have been created; if there were equal amounts of particles and antiparticles, then there would not have been enough particles left over to form the matter we observe today. So the initial expansion is far more likely to have been chaotic than isotropic, which would lead us to expect far larger anisotropies in the CBR than we do observe today. 95 The models of creation that invoke what is called inflation explain how the expected anisotropies of a chaotic hot beginning could have been subsequently smoothed out, yet leave some small but widely distributed temperature variations in the CBR remaining today. (See Silk's book for an explanation of inflation in the early universe.) These variations in temperature of the background CBR (∆T/T) should be of order less than 10-4. Another problem is: how did the large scale structures that we observe in the universe, such as galaxies and clusters of galaxies, originate? You know that the farther away a galaxy is from us, the older it is, due to the finite time that light takes to travel great distances. Although the ages of galaxies are uncertain, based on primordial elemental abundances and what we know of how galaxies form, it seems certain that some temperature/density fluctuations should have been present at the time of the decoupling of matter and radiation. Otherwise, the large scale structures that we observe today would not have had time to form by gravitational collapse since the era of decoupling of matter and radiation. The quest for anisotropies in the CBR that would give clues about the origin of the universe is what prompted the launch of the COSMIC BACKGROUND EXPLORER satellite (COBE) in 1989. When the results of the first year of data analysis were announced in April, 1992, there was a great deal of excitement in the scientific community. It was apparent, for the first time, that an experiment had actually found extremely small but real anisotropies in the CBR, which are consistent with models of structure formation in the early universe based on other clues, such as cosmic elemental abundances and the growing evidence for dark matter. The images you will be using for this lab are not like the ones you have observed so far. None of them were taken with a CCD camera, whether optical or infrared or other wavelength. All of the images you will use in this lab are maps of the galaxy, as seen from our point of view, at microwave frequencies. They are in galactic coordinates. (If this coordinate system is unfamiliar to you, you should go back and review the computer-guided tutorial "Orientation in Space", or review the appropriate chapter in your astronomy text). In this series of activities you will see how the experiment to look for minute fluctuations in the CBR was designed and how the data were analyzed. ************************************************************************************* Part I. Looking for the optimal frequency window. Since the CBR is not visible, but is in the microwave part of the electromagnetic spectrum, in order to measure it we need microwave detectors. In order to design an instrument to measure very small-amplitude microwave signals, where the variation in temperature above background is a few parts in 105, it is important to find the right frequency window at which signals from all other possible sources are at their absolute minimum, and the expected CBR spectrum is maximum. There are a number of galactic and extragalactic sources that emit considerable radiation at microwave frequencies: interstellar dust, interplanetary dust, infrared galaxies, and interstellar electrons. Before we can look for very small microwave signals in the background radiation, we need to evaluate the spectrum of microwave emissions from foreground sources. That is exactly what the COBE scientists did before they designed their microwave detectors that flew aboard the satellite. 96 This graph, (Smoot, et al., 1992), shows the relative intensity of foreground emissions at various wavelengths in the microwave region compared with the spectrum of the CBR at 2.7 Kelvin and the expected spectrum of CBR anisotropies. In order to observe small anisotropies in the CBR, what range of frequencies would you design your instruments to measure in, where the CBR signal is maximum but the signal from dust, HII, and synchrotron emissions are minimum? ____________________________________________________________________________ If your answers came out somewhere between 30 and 90 gigahertz (GHz), you are correct. (A gigahertz is 109 Hertz.) The COBE team of scientists designed three differential microwave radiometers (DMRs) which measured the CBR signal at 31, 53, and 90 gigahertz, corresponding to wavelengths of 9.6, 5.7, and 3.3 millimeters. These instruments could resolve extremely small temperature differences down to about 50 microKelvin (10-6 Kelvin) per pixel, and to a few microKelvin where averaged over the sky. Now open the IMAGINE-32 image processing program, and load the following maps: SKY31.FTS, SKY53.FTS, and SKY90.FTS. These are Hammer-Aitoff projections of the emission from our galaxy, in galactic coordinates, at different microwave frequencies. Each map was compiled from a variety of sources, including data from the Infrared Astronomical Satellite (IRAS) sky survey, and the Haslam, et al., 1982 sky survey. ************************************************************************************* 97 Now, as you load each map, click and drag on the name and move them so that they do not overlap, and you can compare them to each other. After you have brought them all on the screen, you may wish to choose the BOX PALETTE to colorenhance them, so that the details of the galactic emission at each frequency are more apparent. Choose one of the maps...it does not matter which one you choose first. Click the left mouse button inside the map and move it around. Notice the coordinates: x is galactic longitude, with 0° at the extreme left and 360° at the extreme right; y is galactic latitude, with 0° in the middle, +90° at the top, and -90° at the bottom. In these projections, the center of the galaxy is at the left, at 0°. The z values are antenna temperatures in Kelvin (degrees above absolute zero). (The antennas record the power output of the galaxy for a particular frequency; this is then calibrated to the corresponding blackbody temperature for each wavelength.) For each map individually, click on the HISTOGRAM icon. This will bring up a plot of the relative intensities for all the pixels on the map. Click and hold down the mouse on the V Max. arrow, until only that portion of the spectrum that resembles a Gaussian curve lies within the two red lines. Then write down the maximum and minimum pixel intensities that appear for that map. Click on the Okay box, and the map will be redrawn so that the color scale is divided only between the max. and min. that you selected. Do this for each map, and write down the intensity range (max. and min.) that represents the range in which the majority of pixels fall for each map. After you have plotted each map, the program will show you the histogram again. The second time, just click on Okay, and it will disappear. 31 GHz: min. = ________________________max = ________________________________ 53 GHz: min. = ________________________max = ________________________________ 90 GHz: min. = ________________________max = ________________________________ Which frequency has the lowest maximum for the galactic emission? ___________________ Now, to compare the intensity of the galactic emission at each frequency visually, we need to normalize the maps to band limit each one to the intensity range you found for the map with the lowest maximum intensity. (...which should be the 53 GHz map!) So, once again bring up the HISTOGRAM for the 31 GHz map. This time, click the left mouse button in the box that says maximum, hit the backspace key to delete the numbers there, and type in the maximum you found for the 53 GHz map. Do the same for the minimum, and then click on Okay to make a new normalized map. Click on Okay once again to get rid of the histogram so you can look at the pictures. Repeat this procedure for the 90 GHz map. Now compare the way all three maps look, now that the 256 available colors are limited to the same range. You may want to change back to black and white now for comparison. The brightest regions represent the most intense microwave emissions from galactic sources for each frequency. Now that the maps are all colored at the same scale, which one would you choose for the least amount of total galactic microwave emissions at that frequency? _______________________________________________________________________ If you chose 53 GHz, your answer matches that of the COBE team. Actually, they did measure the microwave emissions of the whole sky at all three of these frequencies. Two more experiments on board the COBE satellite measured the infrared spectrum of the CBR: the Diffuse Infrared Background Explorer (DIRBE) and the Far Infrared Absolute Spectrophotometer (FIRAS). 98 Just for comparison, keeping these three maps on your screen, open one more file: SKY408.FTS . This is a map of the sky at 408 megahertz (MHz). If a gigahertz is 109 Hertz, what is a megahertz? Right! A megahertz is 106 Hertz. What wavelength does 408 MHz correspond to? _________________________________________________________________________ Click on the HIST icon for the SKY408 map, and try to normalize the maximum and minimum to the same values you used before. Plot - and describe what the image looks like when you attempt to normalize it to the same range of pixel intensities you used for the other three maps. _________________________________________________________________________ What can you conclude about the intensity of galactic emissions at 408 MHz as opposed to the emissions at 31, 53, and 90 GHz? ________________________________________________________________________ Locate where 408 MHz would plot on the x-axis of the graph. From the graph, what do you think the source(s) of the 408 MHz emissions is (are)? _______________________________________________________________________ The 408-MHz radiation is due to synchrotron emission by relativistic electrons, which are accelerated by magnetic fields in the galactic plane. The HII line on the graph shows the spectrum of Bremsstrahlung radiation from clouds of ionized hydrogen in the galactic plane. Now you can "trash" these maps (that is, click on the “trash can” icon to clear these maps from your screen), and you are ready to begin the next part of this lab... ************************************************************************************* Part 2. Analyzing the variations in the Cosmic Microwave Background Radiation Now in your IMAGINE-32 program, bring up the map called ALLSKY.FTS. This is a map of the microwave emissions from the whole sky at 53 GHz. Contained within this map are the microwave emissions from the plane of the galaxy, the various components of the cosmic microwave background radiation, or CBR, and the expected instrument noise levels. Before you begin the steps of image subtraction and filtering, we need to go into some detail as to exactly what we are looking at and looking for... Scientists develop a model or theory based on a number of consistent observations. In the case of the big bang model, the observations it explains well are the redshifts of galaxies, the cosmic abundances of hydrogen and helium, and the pervasiveness of the CBR. The one question that has remained unanswered is how to reconcile the smoothness of the CBR with models of galaxy formation and the anisotropies that would be expected to naturally occur in the big bang. Since the CBR comes to us from all parts of the sky, from our point of view it appears to form an imaginary sphere, at a redshift of 1000. This imaginary sphere is called the surface of last scattering, and represents a short period of time in the history of the universe when matter and radiation first separated. 99 We can model the temperature variations on the surface of last scattering in a manner similar to the way in which we model the shape of the Earth, based on its gravitational field. Overall, the Earth is spherical; if we look a bit more carefully, we find that the equatorial radius is somewhat larger than the polar radius, giving the Earth a flattened appearance. If we look in still more detail, we see that superimposed on this flattened shape, the north pole actually sticks out a bit, and the south pole is a bit indented, giving the Earth somewhat of a flattened pear shape. If we look in increasing detail, at smaller and smaller scales, we find more and more small scale bumps and lumps. Because a gravitational field results from a given distribution of matter, if we can model the gravitational field of the Earth with great detail, we can understand something about the way mass is distributed in the Earth. Let's digress for a moment to a one-dimensional analogy of a vibrating string.... You know that when you pluck a guitar string, for example, you hear a certain tone. If you pluck the string over the neck, or over the body, or over the hole in the sounding box, you hear a slightly different tone. This is because, depending on where you pluck the string, you excite different normal modes of vibration. You know that the fundamental or lowest note that you hear is due to the length, density, thickness, and tension of the string. You know that the shape of the fundamental is like half a sine wave, and the frequency with which that fundamental mode vibrates causes your ear to hear a particular note. Any mechanical system like a string has its preferred frequencies at which it responds to minor disturbances, such as being plucked, and the way in which such a system responds is called simple harmonic motion. When you pluck a guitar string the dominant note you hear is the fundamental, but there are many higher order harmonics, or normal modes that are also excited. Although your ear cannot distinguish all of them, if you had a microphone and hooked up the signal from the plucked guitar string to a spectrum analyzer, 100 you could see all the higher harmonics displayed on the screen. You can model these higher harmonics as a sum of sine and cosine waves of different frequencies. So, if you see a vibrating string, you can safely assume that someone or something has plucked it, and you can work backward to find the correct sum of sine and cosine waves that will give you the fundamental and all higher harmonics that are excited in that string. If you hear the tone, you can predict the amplitude of each frequency of vibration. The fundamental will generally have the greatest amplitude, and the higher order harmonics will have smaller and smaller amplitudes. Then all this information will tell you about the source of the disturbance - the way in which the string was originally plucked. Now back to the universe... We can model the temperature variations on the surface of last scattering as being due to disturbances on a sphere instead of a string. Although in the case of the string we are actually looking at a time-dependent phenomenon (waves), and in the case of our universe we are looking at variations in a gravitational potential field, the solutions are still like 2-dimensional sine and cosine functions, and are called spherical harmonics. By observing the amplitude of the CBR signal today, and making some educated guesses as to the density of the universe, we can model how we expect the temperature variations to appear today, and then try to correlate our observations with the expected values, based on our models. In modeling the expected anisotropies in the CBR today, there are two basic sources we need to consider: one is due to our motion relative to the background radiation; the other is due to inhomogeneities in the gravitational potential of the early universe. We would expect a zeroth order term (like the fundamental mode in our string), which would give us the 2.726 K background radiation. The first order term should yield a dipole anisotropy, which would have an expected amplitude of around 10-3, relative to the zeroth order term. The second order term would give us a quadrupole anisotropy, and have a relative amplitude 100 times smaller than the dipole anisotropy. (One would expect the higher order terms to have increasingly smaller amplitudes. It seems that for the COBE data, however, the higher order multipole terms do not decrease steadily, but stabilize at some amplitude below the quadrupole. This has interesting implications for cosmological models.) ************************************************************************************* Now, back to the map on your screen. The reddish or hot pink colors indicate temperatures warmer than the average background, and turquoise or cyan colors indicate temperatures cooler than average. Click the left mouse button inside the image: the x coordinate represents galactic longitude, going from 0° on the left (the galactic center) to 360° on the right; the y coordinate represents galactic latitude, going from +90° at the galactic north pole, and -90° at the galactic south pole. This type of map projection is called a Hammer-Aitoff projection, after the people who invented it. The z coordinate represents antenna temperature in milliKelvin (.001 Kelvin) which was recorded by the differential microwave radiometers (DMRs) on board the COBE satellite. The variations in temperature are with respect to a baseline of 2.726K, the average background temperature. (See the article by Gulkis, et al. in Scientific American, Special Issue, September, 1990 for details on how the DMRs work.) The way to read the z values is as temperatures above or below the 2.726K background radiation. 101 A. Subtracting the galactic signal from the background. The streak that runs across the middle of the map is due to the galactic emissions at 53 GHz. Even though the galactic signal at this frequency is a minimum, it is still present and must be subtracted out as an unwanted foreground signal. Click on the floppy disk icon and bring up the image GAL53.FTS onto your screen. This map represents only the galactic signal at 53 GHz. Click on the icon that looks like + | - \÷ | x symbols. On the pop-up window, select the feature "Array (+,-,etc.) array", and on the next popup window select the two maps you have on the screen, ALLSKY.FTS and GAL53.FTS. Then on the next window select the subtraction function; select ALLSKY.FTS as the first array, and label your resulting map something like "NOGAL.FTS". (The reason for this name is that you are going to perform a series of subtractions, and the program will give each one the default name "Mathfn" unless you specify otherwise!) The resulting map (after the subtraction) will probably appear washed out in color, so that you can't see the details. In this case, click on the HIST icon to display the histogram of pixel intensities. Hold the left mouse button down on the /\ and \/ arrows and limit the red lines to include only the pixels within the range of intensities that occur most frequently. This will scale the colors to highlight the details of the map. NOTE: You will have to adjust the histogram every time you perform a subtraction or filtering operation. Now the resulting map should not have the magenta streak across the middle, but should show a roughly bipolar, hot/cold temperature field, with the warmer area in the upper right (shown in magenta), the cooler area in the lower left (shown in cyan) and a dark wavy line going diagonally across the middle, separating the warm and cool areas. After subtracting out the galactic foreground signal, you can see that the CBR signal is dominated by the DIPOLE TERM. B. Interpreting the dipole map of the CBR. This warm/cool temperature distribution which is superimposed on the background radiation field was first discovered in the 1970's with detectors flown in high-altitude balloons or aircraft. The results of the COBE satellite confirmed the existence of the dipole anisotropy, and measured its amplitude with greater accuracy than had been done in previous experiments. Among the various causes of anisotropies in the CBR, the simplest is due to the motion of the observer with respect to the general expansion of the universe. If the observer is moving relative to the reference frame of the universe, then photons reaching the observer from different parts of the sky will be red or blue shifted, and this will lead to a dependence of temperature on cos θ, where θ is the angle between the direction of motion and the direction of observation. 102 C. Calculating our velocity with respect to the CBR from the dipole map. A measurement of the maximum temperature of the dipole anisotropy gives an estimate of our velocity with respect to the CBR, superimposed on the general expansion of the universe. In the last several years scientists have been measuring the streaming motions of galaxies, independent of the Hubble expansion, which has lead to inferences about the distribution of matter in our region of the universe. An observer moving relative to an isotropic radiation field will observe a Doppler-shift in the radiation that is expressed as: (1 - β 2 )2 T(Θ ) = TCBR (1 - βcos(Θ )) 1 where β is the ratio (1) v , v is the observer's velocity, c is the velocity of light, TCBR is the cosmic c background radiation temperature of 2.726K, θ is the angle between the direction of observation and the direction of motion of the observer, and T(θ θ) is the temperature, depending on which direction you observe. This expression can be expanded as a series of higher order terms in cos (θ θ): T(Θ Θ) = TCBR [ 1 + βcos(Θ Θ) + 1/2 β2 cos(2Θ Θ) + ...higher order terms] (2) The first two terms give the background isotropic field plus a dipole anisotropy due to our motion relative to it: T(Θ Θ) = TCBR + TCBR βcos(Θ Θ) (3) You can see that when cos(θ θ) = 0, i.e., when we are observing in the same direction in which we are moving, the observed temperature will be maximum. We define the quantity δT as TCBR - T(0). The pixel values within the map on your screen are actually δ T 's in milliKelvin (that's 10-3 Kelvin), relative to the baseline TCBR = 2.726K. Show how you derive an expression for calculating our velocity with respect to the CBR, and then calculate it: ____________________________ m/sec = _______________________________ km/sec If you obtained a value somewhere around 350 to 375 km/sec, you are in the right "ballpark". The published value given by the COBE team is 365 +/- 18 km/sec. Now, it would be really useful to be able to go out at night and point to a certain direction in the sky and amaze your friends with the information that we are moving in THAT direction at about 360 km/sec! 103 Again, click the mouse within the map and move the cursor around until you locate roughly the warmest of the pink part in the upper right. The x and y coordinates in the map correspond to galactic longitude and latitude. x = ___________________________ degrees (galactic longitude) y = ___________________________ degrees (galactic latitude) The location of the dipole axis (warmest point) in galactic coordinates published by the COBE team is 265°, 48°, with an uncertainty of +/- 2° for both. In celestial coordinates of RA and DEC, the location is given as 11.2 h +/- .2 h, -7° +/- 2°. This is in the direction of the Virgo Supercluster of galaxies. To locate the constellation Virgo in the sky, you follow the arc of the handle of the Big Dipper until you come to the nearest bright star. This star is Arcturus ("arc to Arcturus"); you then follow a direct line approximately south to the nearest isolated bright star, which is Spica ("drive a spike to Spica"). Spica is in the constellation Virgo, which is in the approximate direction of our motion. The dipole anisotropy can be eliminated by a Lorentz correction in the direction of our motion. It is not due to any intrinsic anisotropy in the CBR itself, so we shall subtract it out later... ************************************************************************************* D. Interpreting higher order terms in the temperature field of the CBR. 1. Interpreting the quadrupole map. Now click on the floppy disk icon again, and bring up the image entitled QUAD53.FTS. This is a map at 53 GHz of the quadropole term in the spherical harmonic expansion of the temperature field of the CBR. The quadrupole map contains a component due to our motion relative to the CBR, as well as a component that should be due to an anisotropy in the gravitational potential field of the early universe. The component due to our motion comes from the term 1/2 β2 cos(2θ θ) in equation 2. You can calculate it, and see that it is so small as to be below the limit of detectability. The more interesting component of the quadrupole anisotropy is due to a distortion in the gravitational potential of the universe at the time of decoupling of matter and radiation. This effect would cause some photons to overcome different gravitational potential wells, and hence experience differing gravitational redshifts, which would lead to a large-scale, low-amplitude angular dependence of temperature in the CBR. The quadrupole anisotropy in the CBR has been measured for the first time by COBE, and is about 2 orders of magnitude smaller than the dipole anisotropy, as expected. For comparison: the baseline background temperature is roughly 2.726 Kelvin; the dipole anisotropy is roughly 3.3 x 10⁻³ Kelvin; the quadrupole contribution is roughly 1.5 - 2.0 x 10⁻⁵ Kelvin. To see a graphical representation of the spatial variation of ∆T/T across the quadrupole map, click on the “squiggly lines" icon (second from the top, left column). Now when you move the mouse around within the map, you will see a plot of the variations in the temperature in milliKelvin across the map, at the ycoordinate of the cursor. Find the maximum, minimum, and average values of the δT 's for the quadrupole anisotropy: max.: ______________________ min.: _____________________ avg.: ________________ 2. Subtracting the dipole and quadrupole terms from the microwave signal. 104 Click on the floppy disk icon again, and bring up the image called "DIPOL53.FTS". This is a pure dipole map, without higher order terms. Using the same "math symbols" icon, subtract the dipole map from your map that you have called "NOGAL.FTS" and (for convenience and consistency, so you can keep track of what you are doing) call the resulting map "NODIPOL.FTS". Now subtract the quadrupole map from the NODIPOL map, and label the resulting map "RESID.FTS". Take a moment to review what you have done with all these maps: ALLSKY.FTS = total microwave signal at 53 GHz ALLSKY.FTS - GAL53.FTS = NOGAL.FTS, the microwave signal without the galactic contribution. DIPOL53.FTS = dipole term, due to our motion with respect to the CBR. QUAD53.FTS = quadrupole term, due to large-scale anisotropy in the gravitational potential of the universe at the time 300,000 years after the big bang. NOGAL.FTS - DIPOL53.FTS = NODIPOL.FTS NODIPOL.FTS - QUAD53.FTS = RESID.FTS, which contains instrument noise and smaller scale anisotropies in the CBR. The map you have left contains small temperature fluctuations in the CBR that contain information about the distribution of matter and energy in the early universe, and we also have instrument noise. The remaining problem is to show that the amplitude of the instrument noise is lower than that of the true signal and that these very tiny temperature anisotropies that COBE has detected are REAL. 3. Filtering the data. You know that every measurement that you ever make has some level of error, and you have to account for this in your data analysis. The way in which you handle noise in your data depends on what you believe about the nature of the expected signal and what you know about the instrument noise. We will assume that the instrument errors are random Gaussian fluctuations about some mean and that they average out to zero amplitude. We will use a technique in which we average the data by moving a 2dimensional Gaussian window across the map, one pixel at a time. We sum the values of all the pixels in our window, giving a weight of 1 to the center pixel, and decreasing the weight of each pixel from the center. We then divide by the sum of all the weights in the window. In this way we "smooth out" random fluctuations which are due to instrument noise. We choose the window to be slightly larger than the size of the beam width of the COBE DMR instruments (7°) to account for the way in which the instruments sampled the sky. To perform this digital smoothing of the data, click again on the "math symbols" icon. This time, select the choice "convolution with mask"; on the next pop-up window, select the option "load mask". From the list that comes up, choose the one called "GAUS.MSK". This is the filter that has been designed for smoothing this data set. If you want to see what it looks like, click on "view" before you filter. When the filtering operation is finished, you will have a map of ... 105 ...temperature fluctuations of the CBR in milliKelvin. Click on the HIST icon, and enclose the main part of the spectrum in the red lines, as you have done before. Click on "Plot", and you will see the details of the filtered residuals. What do you notice about the shape of the spectrum of the filtered residuals? ________________________________________________________________________ 4. Comparing the spectrum of δT's with the spectrum of instrument noise. Now bring up the image called NOISE53.FTS. This is a map of the noise per pixel for the 53 GHz DMR instruments. Just as you filtered the temperature residuals, you are now going to filter the noise. Use the same mask, “GAUS.MSK.” After the program has filtered the noise, click on the HIST icon, and limit the red lines to include the pixels that lie within the range of the most frequently occurring values. Click on "Plot" to see the details of the filtered noise map. What do you notice about the shape of the noise spectrum? _________________________________________________________________________ From the histogram, find the maximum and minimum values for the spectrum of the filtered residuals and filtered noise, and calculate the peak-to-peak amplitude for each, and the difference between their peakto-peak amplitudes. The units are in milliKelvin. resid: max. = _______________ min. = _______________ p-p amplitude = ______________ noise: max. = _______________ min. = _______________ p-p amplitude = ______________ difference = ______________________________ Using the "squiggly-lines" icon again, look at the variation in amplitude for the filtered residuals and the filtered noise. Find the mean value for each and the difference between the residual and noise mean values. residual mean: _____________________ noise mean: ___________________________ difference: _________________________ Is the amplitude of the pure noise less than that for the signal + noise? ______________________________________________________________________ It should be! 106 The COBE scientists have done intensive statistical analysis to determine the component of the signal that is really due to small-amplitude anisotropies in the CBR. According to some models of the early universe, we do expect the temperature anisotropies in the CBR to have a Gaussian spectrum, and the COBE results are consistent with these models. After careful removal of the instrument noise, the best measurement of the average amplitude of ∆T/T from the COBE data is 1.53 ± 3.7 x 10⁻⁵ , with a variance of ∆T/T = 3 x 10⁻⁵ for all anisotropies in the CBR at angular scales of 7° or more (Smoot, 1992). Now for the big question: how do these temperature fluctuations in the CBR constrain our models of how the universe formed and how galaxies evolved? The isotropic nature of the CBR to one part in 104, which was confirmed by COBE, does confirm that the general expansion of the universe is uniform to one part in ten thousand. This observation supports a hot rather than a cold big bang. The COBE data show that anisotropies in the CBR do exist, with a maximum signal amplitude of a few tens of microKelvins down to the spatial resolution of the DMR instruments of 7 degrees of angle. The spectrum of these temperature variations is consistent with that expected from smaller scale anisotropies that can be related to density fluctuations of the size necessary to collapse by gravitational attraction to form galaxies. The observation that higher-order anisotropies cannot be any larger than a few parts in 105 places constraints on the sources of these anisotropies. Large-scale anisotropies could come from initial anisotropies in the expansion of the universe, as discussed above. Other sources could include gravity waves from the initial big bang, or cosmic strings. While COBE does not absolutely support or refute such theories, it does place constraints on the amplitude of the signals we can expect due to such sources. The spectrum of anisotropies measured by COBE is consistent with inflationary models of the universe. In the inflationary scenario, large-amplitude anisotropies at large and small angular scales did exist in the early universe, but were smoothed out by a short burst of rapid expansion when the universe was less than 1 second old. (See Silk for a detailed explanation.) One of the key pieces of evidence is the presence of heavy elements in old stars and galaxies. The oldest galaxies we can observe lie at redshifts of 3 to 5, putting them at an age of more than 10 billion years old. The spectra of these galaxies indicate that they have heavy elements such as carbon and oxygen, which can only be synthesized in the cores of stars, and not in processes which could have occurred during the big bang nucleosynthesis. Therefore, these galaxies must have formed from an earlier generation of stars. The first time that clumps of matter could have begun to decouple from the general expansion of the universe and coalesce by gravitational attraction was about 300,000 years after the big bang, when the density of matter first dominated over the density of radiation. In order to have enough time to form galaxies, anisotropies in the density of matter and radiation must have existed prior to decoupling and must have been of a certain minimum size, in order to decouple from the general expansion of the universe and coalesce. Many questions remain unanswered: Was there enough time since decoupling for galaxies to form by gravitational collapse alone? Or, must there be some as-yet-undiscovered type of very heavy dark matter that could have speeded it up? The purpose of this lab has not been to provide you with answers, but to give you a glimpse into the exciting and complicated process of searching for clues that will enhance our understanding of how and why the universe came to be. If you are interested in further study of cosmology, we refer you to the many books and articles that have been written on the subject, including: 107 THE BIG BANG, J. Silk, W.H. Freeman & Co., 1989. STRUCTURE FORMATION IN THE UNIVERSE, T. Padmanabhan, Cambridge University Press, 1993. A BRIEF HISTORY OF TIME, S.W. Hawking, Bantam Books, 1988. and numerous articles in Scientific American, Sky and Telescope, Physics Today, The Astrophysical Journal, The Astrophysical Journal Letters, Astronomy, and Science News. 108 109 If It’s Not Dark It Doesn’t Matter Searching for MACHO’s in the Galactic Halo A brief examination of the theories surrounding “dark matter” and an image processing exercise looking for a microlensing event. REMOTE ACCESS ASTRONOMY PROJECT UNIVERSITY OF CALIFORNIA, SANTA BARBARA and CENTER for PARTICLE ASTROPHYSICS Image Processing Curricula for High School and College Physics and Astronomy 110 If it's not DARK it doesn't MATTER: Searching for Remote Dark Matter in the Galactic Halo Jatila van der Veen, Adolfo Camarillo High School and UCSB Physics Department Christopher H. Stubbs, UCSB Physics Department, and MACHO project Philip Lubin, UCSB Physics Department, Program Director, Remote Access Astronomy Project August, 1994 The following may be reproduced in any form for use in a classroom, but under no circumstances may any part be reproduced for publication without the written consent of the authors. ************************************************************************************* The following series of image processing activities utilizes the program IMAGINE-32 by ISIS of Santa Barbara, which is a licensed, non-shareware program. ************************************************************************************* INTRODUCTION: There is a growing body of evidence that suggests that over 90% of the matter in the universe is in some form that is not detectable by the emission of electromagnetic radiation. Because this matter is not "visible," it has been called DARK MATTER, yet its presence is apparent from its gravitational effects on visible objects. Scientists now believe that most galaxies are surrounded by extended halos of dark matter which may be a factor of 30 or more larger in mass and significantly larger in extent than the visible parts (Tremaine, 1992). Some of the dark matter in the universe may be baryonic, that is, made up of the ordinary stuff - like quarks, protons, neutrons, and electrons - with which we are familiar. This type of dark matter may take the form of compact objects such as brown dwarfs, neutron stars, or black holes, which are most likely to be found in the extended halos of disk galaxies. For this reason, these types of objects have been dubbed Massive Compact Halo Objects, or MACHOs for short. There is also evidence that most of the dark matter in the universe may be in some exotic, as-yetundiscovered form. By studying cosmic abundances of the isotopes of hydrogen, helium, and lithium, and understanding the processes of nucleosynthesis that probably took place during the first several minutes after the Big Bang, strict bounds can be placed on the upper and lower limits of the average baryon density in the universe, if we assume that the universe has the critical density. (This terminology is used by cosmologists to indicate that the gravitational potential energy of the matter in the universe is just enough to balance the kinetic energy of expansion.) Along these lines of reasoning, David Schramm of the University of Chicago and others have come to the conclusion that at least 90% of the mass of the universe is not baryonic, but rather in some form that we can only detect gravitationally, as it does not interact with ordinary matter. For this reason, these types of particles have been called Weakly Interacting Massive Particles, or WIMPs. In this series of exercises we will first review some of the evidence for the existence of dark matter, and see how scientists are conducting experiments to search for the baryonic component of dark matter in galactic halos. You will then attempt to find evidence for MACHOs in the Large Magellanic Cloud by performing photometry on a series of CCD images taken of a region of the LMC by observers at the Mt. Stromolo Observatory in Australia. The amount of apparent brightening of a star over a period of time gives an indication of the mass of the dark matter that could have caused this effect. ************************************************************************************ 111 Part I. ARGUMENTS IN FAVOR OF THE EXISTENCE OF DARK MATTER A) Estimating the CRITICAL DENSITY of the Universe In discussing the critical density of the universe it is necessary to review the Cosmological Principles of classical cosmology. These two principles state that: 1) The universe is isotropic, that is, it would look the same in any direction for an observer in any galaxy; and 2) The universe is homogeneous, that is if you look at sufficiently large scales of 100 Mega-parsecs (Mpc) or more, the universe appears smooth rather than lumpy, as it does on smaller scales. The critical density, then, is the density of the universe (taken to be homogeneous at sufficiently large scales) necessary so that the gravitational potential energy of the universe will just balance the kinetic energy of expansion. Such a universe is called “flat” and is favored partly because it makes the calculations easier, partly for symmetry reasons, and partly for technical reasons. It is quite simple to determine an order-of-magnitude estimate of what the critical density of the universe ought to be from energy considerations... Recall how to find the escape velocity from any body. (Refer to any standard physics text.) You start with the initial kinetic energy, Ko, necessary for a small mass, m, to escape the gravitational field of a large mass, M, with escape velocity, ve: K 0 = 12 mv 2e The kinetic energy at “infinity”, K∞ , is equal to zero for the mass m to just barely escape. The gravitational potential energy, Uo, of the mass, m, at the surface of the big mass, M, which has radius, r, is: U0 = - GMm r and the gravitational potential at infinity, U∞, is defined as zero. By conservation of energy, Ko + Uo = K∞ + U∞ = 0 so, 1 2 mv 2e = GMm r which leads to the expression for escape velocity, ve = 2GM r Now, consider a sufficiently large, spherical region of the universe in which the density is ρ. The mass M of this region is (density x volume), or M = ρV = 4 3 πr 3 ρ Substituting this expression for the mass M into our equation for escape velocity, we get ve = 8 πGρr 2 3 Now recall Hubble’s Law, which relates the recession velocity of any galaxy to its distance from us, r: v(r) = Hor where Ho is the Hubble parameter, in units of km/sec/Megaparsec. 112 Whether v(r) is equal to the escape velocity, that is the velocity necessary for the universe to escape its own gravitational influence (so to speak), depends on whether the average density, ρ, in our hypothetical volume of universe is equal to the critical density, ρc , necessary to balance the expansion at some time in the future. To estimate the critical density, we equate v(r) and ve , giving us: H 0r = 8 πGρ c r 2 3 which, after a bit of algebraic massaging, leads to an expression for the critical density of the universe in terms of Ho and the universal gravitational constant, G: ρc = 3H 20 8 πG Now, within this expression, the constant G is very well known, but the Hubble parameter, Ho, is believed to be between 40 and 100 km/sec/Mpc (see Padmanabhan, chapter 1). Taking a conservative value for Ho of 50 km/sec/Mpc, you can calculate the value of ρc in grams/cm3 to at least the correct order of magnitude. You should now do this yourself... First, you must put Ho into the same units as G, which is most commonly expressed in mks units. In mks units, G = 6.67 x 10⁻¹¹ N-m2kg-2... 1 parsec = 3.4 light years = _____________________________ meters 1 Megaparsec = 106 parsecs = ___________________________meters Recalling that 1 km = 103 m, you can get Ho now in units of sec-1: Ho = __________________________________ sec-1 (see Box: About the Hubble parameter) Now you substitute into the expression for critical density and get the value in kg/m3: ρc = ___________________________________ kg/m3 and finally, since 1kg/m3 = 10-3 gr/cm3, you can convert ρc into gr/cm3: ρc = ___________________________________ gr/cm3 If you came out with a value of around 5 x 10 -29 gr/cm3, you did your algebra correctly! ☺ All well and good, you say...so what? Well, the interesting part is that when we look at the abundances of all the light elements as determined from stellar, galactic, and intergalactic spectra, as well as the conditions under which the isotopes of hydrogen, helium, and lithium could have been produced during the first few minutes after the Big Bang, the density of all baryonic matter turns out to be only about 5 x 10 -31 gr/cm3 ! This value is around 2 orders of magnitude smaller than the critical density of the universe estimated from the observed Hubble expansion. It is now believed that only about 1% of the matter in the universe is observable by its emission of electromagnetic radiation, and the rest is some sort of DARK MATTER which is only detectable by its gravitational effects on the visible matter. Of this dark matter, about 5% is baryonic - the MACHO’s we have cited above. The rest of the dark matter is believed to consist of exotic, non-baryonic particles left over from the big bang. These WIMPs could be relativistic neutrinos that have a small rest mass, or slowmoving particles heavier than protons, or other exotic candidates like miniature primordial black holes and macroscopic “nuggets” of pure quarks, left over from the “quark era” of the first millionth of a second or so after the big bang. (See Schramm, 1991, for further discussion.) 113 Box: About the Hubble parameter... On the previous page we said that the units of Ho are km/sec/Mpc, and by converting Mpc to km you obtained a value for Ho in sec-1. * What number do you get if you invert Ho ? ____________________________ and the units are seconds. * Now convert this value to years: _____________________________________ WHAT IS THE SIGNIFICANCE OF THIS NUMBER??? _______________________________ (You can find the answer at the end of this lab...) B) Evidence for Dark Matter from Galactic Motions Galaxy Rotation By measuring Doppler shifts of nearby galaxies as a function of distance from the center of the galaxy, one can measure the orbital velocities of stars in the galactic disk. If all the mass in the galaxy were exactly what is visible, then the greatest mass should lie at the center of the galaxy, and the galactic rotation should be “Keplerian”; that is, the rotational velocity of the disk should decrease with distance from the center. (Refer to activities #3 and #4 of this manual, which deal with Kepler’s Laws and orbiting bodies.) For our own galaxy and those close by, it has been shown that the inner few kpc of galaxies do follow the expected velocity profile, which is calculated from only the visible mass. This would indicate that in the central regions of galaxies most of the mass is in the form of visible stars, gas, and dust. However, for the outer parts of galaxies the rotational velocities remain nearly constant. This surprising result is another indication that there must be a great deal of invisible mass in the outer portions of galaxies. In fact, observations of this sort have led scientists to the conclusion that stars and other luminous matter make up only about 10% of the total mass of a galaxy! (Tremaine, 1992) Peculiar Velocities and Galaxy Clustering Another such observation comes from the large peculiar velocities (that is, velocities relative to the general expansion of the universe) of the galaxies in clusters and super clusters. A group of astronomers sometimes called “the Seven Samurai” have determined the peculiar velocities of galaxies out to around 300 million light years. They found that in order to explain the unusually high peculiar velocities of distant galaxies, there must be a tremendous concentration of matter (which they called the Great Attractor) somewhere in the direction of the constellations Hydra and Centaurus. Measurements of redshifts of galaxies by Margaret Geller, John Huchra and others at the Harvard Center for Astrophysics have also shown that there are large concentrations of galaxies and apparent voids where the density of galaxies is very low. They suggest that perhaps these dark regions are not empty but filled with dark matter. C) Gravitational Lensing In his General Theory of Relativity in 1915, Albert Einstein predicted that large masses should bend light, acting as “gravitational lenses”. According to Einstein, a large mass in the path of light from a distant source to an earthly observer could cause both a distortion and brightening of the image, as light which otherwise would have missed the Earth is focused in our direction. The angle of deflection of the light is proportional to the intervening mass, which acts like a converging lens. In the early 1980’s astronomers began observing unusual images of distant galaxies which appeared distorted into arcs. It became apparent that these luminous arcs were images of background objects which just happened to be near the line of sight through a large cluster of galaxies. To test this idea, the red shifts of the spectra of the foreground cluster and distant object for several suspected lensing cases were compared, and it was indeed found that the distant objects had the spectra of spiral galaxies, at higher redshifts than the foreground clusters. Since then, numerous examples have been documented of images of distant galaxies being distorted due to gravitational lensing by foreground clusters of galaxies. Based on what we know of gravitational theory, 114 and what we observe of the velocities of galaxies within clusters, astronomers have been able to model the amount of mass contained within the volume of the foreground lensing clusters. The picture that has emerged is that there must be more mass in the cluster to cause the observed distortion of the distant galaxy than there is luminous matter in the same volume. The evidence is mounting that not only in galaxies is most of the matter in some non-luminous form, but also in the spaces between galaxies, as far as we can tell from observations of clusters of galaxies that span hundreds of megaparsecs. D) Microlensing: the technique of looking for local MACHOs If much of the dark matter in galactic halos is indeed in the form of small bodies less than .08 solar masses (the limit at which thermonuclear fusion can begin), then we would expect the halos to have a smallscale “lumpiness”. This lumpy mass distribution should have a detectable gravitational lensing effect on the light from background sources. Just as the large dark mass in clusters of galaxies has an appreciable effect on the images of distant galaxies which lie along the same line of sight, a similar effect should be observable when small dark masses in our galactic halo pass in front of our line of sight as we observe stars in our neighborhood. The temporary brightening of the light from a star when a mass passes close enough to our line of sight to act as a gravitational lens is called a microlensing event. Whereas in gravitational lensing of quasars or distant galaxies by intervening clusters of galaxies the brightness changes extremely slowly with time, the time over which a microlensing event should occur is a few days to a couple of months, depending on the relative position and mass of the lensing object. Another distinguishing feature of a microlensing event is that local lenses do not distort the images of background stars in the same way that extragalactic lenses do; instead, they simply produce a temporary brightening. 115 The criteria for distinguishing a true microlensing event, as opposed to intrinsic or other variations in a star’s luminosity, are: 1. 2. 3. 4. 5. that the image of the background star is not substantially distorted, but the brightness changes noticeably; that the brightness increases by at least a factor of 1.34; (The amplification factor depends on the distance of the MACHO from the line of sight, the distance to the star whose light is brightened, the mass of the MACHO, and the relative velocities of the MACHO, star, and observer. See Griest, 1991 for rigorous mathematical treatment of this parameter.) that the microlensing event occurs only once, generating a distinctive light curve, as opposed to variable stars in which there is a periodic fluctuation in brightness; that the brightening is achromatic, that is, the apparent brightening of the background source is the same for all wavelengths; that the light curve is symmetric and predictable. A team of researchers, using the 1.27-meter telescope at Mt. Stromlo in Australia, have been searching for MACHO microlensing events in the Large Magellanic Cloud, and after studying millions of images of stars, have detected what they feel are very likely candidates for microlensing events... The arrow highlights the star in the center of the images that was brightened by a supposed MACHO. (Data courtesy of OGLE project.) PART II: IMAGE PROCESSING OF CCD DATA DETECTING MACHOs PHOTOMETRICALLY Now open the program IMAGINE-32. You should have “unzipped” the images MACHO_r.ZIP and MACHO_b.ZIP into your IMAGES directory. These are images taken of a portion of the Large Magellanic Cloud over the period of about a month in 1993 with a high-resolution CCD camera attached to the 1.27meter telescope at the Mt. Stromlo Observatory in Australia. The “r” and “b” in the file names stand for “red” and “blue”; each set of images was taken with a red or a blue filter, so that any changes in magnitude can be checked to see if they are achromatic. Start by loading all the MACHO_r images onto your screen. Check the histogram of each image, and be sure that they are normalized to the same values, so that you can visually compare them. The images are numbered sequentially with respect to time. You can check the date of each image by clicking on the “*” in the upper left-hand corner of each picture, then in the box that appears, clicking on the words “View Header”. Use the sliding bar at the right side of the image box to scroll down to check the date. When you are finished looking at the header, click on the word “Quit” at the top of the header box. Do you notice any stars that change in apparent brightness over the time span in which these images were taken? If so, this is a candidate for a microlensing event! Note the x,y coordinates of this star in each image, on a piece of scratch paper. (Note: the x,y coordinates of the star change from image to image.) 116 It will also be necessary to find a reference star which appears fairly constant in magnitude in all the images. Compare the images on your screen, and select a reference star that appears roughly the same in all the frames, and note its x and y coordinates in each image, on a piece of scratch paper. Now that you have a suspected candidate and a reference star, you will use the PHOTOMETRY feature of the program to check the magnitudes of the stars in each image. USING IMAGINE-32 TO DO PHOTOMETRY: 1) Start with the first image chronologically; move it to the lower right corner of your screen by clicking and dragging on the name of the image. (The reason for this is that the pop-up windows for performing the photometric calculations will appear in the center and upper left of your screen, and will obscure the original image if you don’t move it out of the way first!) 2) Click on the PHOTOMETRY icon. Within the window that appears, click on MANUAL, then click on ADD STARS. A magnified window will appear in the upper left corner of your screen. The mouse “arrow” has now turned into a crosshair on your original image; within the magnified window, there is a red dot that corresponds to the location of the crosshair. Click the mouse on each star you wish to include in the photometric calculations. It is not necessary to be absolutely in the center of each star; the program will automatically put the red dot in the center of each star. After you have clicked on all the stars you wish to include, press the ESC key on your keyboard. 3) When the photometry window reappears, click on CALIBRATE. You do not need to know the actual magnitudes of any of the stars, because we are looking for the CHANGE in magnitude over the given time period. Click on the reference star you selected above; a small window will appear, with blinking cursor; type in an arbitrary magnitude of 0.0. Then click on OK. 4) Now the photometry window is gone, but your image should have lots of little red crosses on the stars you selected. Click on the MAGNIFYING LENS icon, and as you move your cursor over the selected stars, their calculated magnitudes will appear under the magnifier window. Recall that the smaller the magnitude, the brighter the star. Since we have assigned a value of 0.0 to the reference star, and we are looking for a BRIGHTENING with respect to our reference star, the program will assign NEGATIVE magnitudes to stars brighter than the reference. Since we are really only interested in the CHANGE in magnitude of our lensing candidate, you only need to record the CHANGE in magnitude in your data table. (In other words, record the absolute value of the magnitude displayed on the screen in your data table.) 5) Note the date (or sequence number) of the image, the color (red or blue) of the filter, and the apparent magnitude of your MACHO candidate in the DATA TABLE. 6) Now, here is the (somewhat) tedious part that comes with all data analysis: you need to repeat this procedure for ALL the red images, and again for ALL the blue images. You will then plot the change in magnitude with respect to time for your MACHO candidate in red light and in blue light. DATA TABLE Make a data table on a separate sheet of paper with the following headings: date filter (red or blue) change in magnitude of MACHO candidate relative to reference star --------------------------------------------------------------------------------------------------------------------------------------------------------------------------------------------------------------------------------------------------------------Be sure to leave 10 lines for the red images and 10 lines for the blue images. 117 GRAPHING THE CHANGE IN MAGNITUDE OVER TIME Now that you have the data of relative magnitude changes for your candidate microlensing event in both red and blue light, you will make two graphs (one for the red, and one for the blue) and compare the two. Plot the change in magnitude on the y-axis and the time in days on the x-axis. You can either do this the old-fashioned way (by hand) or by using your favorite graphing program that will fit a smooth curve through a series of data points. If you are graphing by hand, be sure NOT to just “connect the dots”, but to draw your best eye-ball-fitting SMOOTH curve through the data. CHECKING THE LIGHT CURVES Once you have obtained your light curves, check to see if they fit the criteria outlined above for a microlensing event: 1) Is the shape of the curve the same in red and blue light, within your estimation of measurement errors, thus showing that the brightening of the starlight is indeed achromatic? _____________________________________________________________________________ 2) Is the shape of the light curve symmetric? ______________________________________ 3) What is the maximum change in magnitude above the baseline? _____________________ 4) Does this qualify as a microlensing event? ______________________________________ ESTIMATING THE MASS OF THE MACHO FROM THE EVENT DURATION Estimating the mass of the MACHO that caused the microlensing event is not simple, and depends on several factors: * the distance to the MACHO and its position relative to our line of sight to the star; * the relative velocities of the Earth, star, and MACHO; * the density of dark matter and the probability of a MACHO of a given size entering our line of sight in a certain time period; * the particular model you choose for the galaxy; * the systematic errors in the survey. Given the uncertainties in all these parameters, scientists who study MACHOs in our galaxy have been able to estimate the likely probabilities of finding a MACHO of a given size, and approximately how long the microlensing event for a given size MACHO should last. (See Griest, 1991) In general, the duration of a microlensing event and the mass of the MACHO that caused it are related by the formula: t ≈ 100 (M/M()1/2 where t is the time in days that the lensing event lasted, M is the mass of the MACHO, and M( is the mass of the Sun. Now re-arrange this equation to get the expression for M, the mass of your suspected MACHO, in terms of the event duration in days and the solar mass M( : M = _________________________________________________________ 118 And calculate the approximate mass of your MACHO in terms of solar masses: M = ___________________ M( The task of looking for MACHOs in our galactic halo is an arduous one! Several groups around the world are trying to perform similar experiments, looking toward the Magellanic Clouds and also toward the galactic center. A number of microlensing candidates have been found, all of which seem to fit the model of what a microlensing event should look like. Other useful information is also coming out of these experiments, including refined velocity profiles of the galaxy and large data sets of variable stars. Meanwhile, several groups around the world are trying to find experimental evidence for the other type of dark matter, the exotic particles. ********************************************************************************** If the topic of dark matter interests you, here are some suggestions for further study: • The OGLE project: The Optical Gravitational Lensing Experiment - how microlensing events are being detected in the direction of the galactic center; • Gravitational lensing of quasars and distant galaxies: Einstein rings and crosses, and what the Hubble Space Telescope has found; • WIMPs - What are the likely types of weakly interacting massive particles, and how scientists are looking for them; • Hot vs. Cold Dark Matter in the universe...implications for Big Bang models and structure formation. And, if you are really interested in learning more about the MACHO and OGLE projects, and obtaining public-domain images of microlensing events, you can do so via INTERNET as follows: 1) “ftp” to sirius.astrouw.edu.pl using the anonymous login and giving your own e-mail address as your password; 2) World Wide Web: http://www/astrouw.edu.pl ********************************************************************************** Answer to Box: About the Hubble parameter: If you invert Ho and convert from seconds to years, you get the approximate age of the Universe in billions of years! ☺ Taking Ho to be 50 km/sec/Mpc gives an age of 20 billion years for the Universe. Here is a list of some of the references we have used, which you may find helpful: STRUCTURE FORMATION IN THE UNIVERSE, T. Padmanabhan, Cambridge University Press, 1993. PRINCIPLES OF PHYSICAL COSMOLOGY, P.J.E. Peebles, Princeton University Press, 1993, “The Dynamical Evidence for Dark Matter,” S. Tremaine, in PHYSICS TODAY, v. 45, no.2, Feb., 1992. “Searching for Dark Matter,” M. Mateo, in SKY & TELESCOPE, v.87, no.1, Jan., 1994. 119 “The Origin of Cosmic Structure,” D. Schramm, in SKY & TELESCOPE, v.82, no.2, Aug., 1991. “Particle Accelerators test Cosmological Theory,” D. Schramm and G. Steigman in SCIENTIFIC AMERICAN, v. 258, no. 6, June, 1988. “Possible Gravitational Microlensing of a Star in the Large Magellanic Cloud,” C. Alcock, and 16 others, in NATURE, v.365, no.6447, 14 Oct. 1993. “Galactic Microlensing as a Method of Detecting Massive Compact Halo Objects,” Kim Griest, in THE ASTROPHYSICAL JOURNAL, v.366, pp.412-421, 1991. “The Optical Gravitational Lensing Experiment: The Discovery of Three Further Microlensing Events in the Direction of the Galactic Bulge,” A. Udalski, and 5 others, in THE ASTROPHYSICAL JOURNAL, v. 426, L69-L72, 10 May 1994. 120 121 RAAP Introductory Astonomy Lab contributed by: Jatila van der Veen, Adolfo Camarillo High School, and UCSB / RAAP Measuring Angles in the Sky using the Fingers of your Hand Two of the most difficult questions to answer regarding objects you observe in the sky are, “How big is it?” and “How far away is it?” The second question is actually less difficult to answer than the first, and can be answered by a variety of methods, each of which is appropriate for a different distance range. The first question is very difficult to measure without an absolute standard of reference. For example, if you take a picture of a rock on a hillside, someone else who looks at your picture, without having seen the rock in its original surroundings, has no idea of the actual size of the rock. If, however, you put a ballpoint pen next to the rock when you take the photograph, when you show the photo to someone else, she can immediately judge the size of the rock by mentally comparing it with a familiar object - the pen - whose size is commonly known. )) Imagine you are stranded on a dark country road, and a car with its headlights on is approaching you. You can estimate its distance from you at any given instant by the apparent size and brightness of its headlights as they appear to you. However, if you had never seen headlights before, how could you judge their distance? It is only because you have a general idea of how big and bright the average car’s headlights are that you can estimate the distance to a car on a dark night... ...but, you have never seen a star up close, so how can you judge its distance and size, or the distance between stars, or the diameter of the Moon, when you observe them in the sky at night? Try this: Stand in front of a full-length mirror, and with a water-soluble marker, draw an outline around your face. Now step back from the mirror and observe whether or not your face still “fits” in the outline you drew when you were standing close to the mirror. Step back to the farthest wall, and observe your face in the mirror. Does it fit within the outline or not? % Did you ever get to a distance at which your face would not fit within the outline? % Formulate an explanation for your observations! The way we measure sizes and distances when we observe heavenly bodies is by using some simple geometry... Recall that there are 2π radians in a circle, and that the circumference of the circle is 2π times the radius: but if you sweep the radius through a smaller angle, the arc length is a portion of the whole circumference, and is equal to the central angle, θ in radians, times the radius: 2πR = circumference ... when the central angle is 2π radians θR = S ... where S is the arc length and θ is the central angle, in radians From this we can see that 2π = circumference and similarly that θ = S radius R Taking this idea further, you can see that if you draw a small circle of radius r, concentric with the larger circle of radius R, that for both circles the relationship 2π = circumference / radius is true. θ = S and θ = s so therefore S = s ☺ R r R r 122 (This has everything to do with the face-in-the-mirror experiment!) It is easy to visualize the sky as a tremendous dome, so rather than measuring absolute distances and arc lengths, we measure ANGULAR DIAMETER. There is a really easy way to measure approximate angular diameters in the sky by using the angular diameters of your fingers. You can calibrate your fingers using objects on the walls of your room, by knowing the distance from the wall and the absolute diameter of the object as follows: Select a picture on the wall, and step back from it. Hold your hand out at arm’s length. Close one eye, and hold up one finger, adjusting your distance from the picture on the wall so that your finger just blocks out your view of the entire picture. The angle subtended by your finger and the angle subtended by the picture, as seen from your eye, are the same. Again, letting s = the width of your finger, r = the horizontal distance from your eye to your outstretched hand, S = the linear diameter of the object on the wall, and R = the distance from your eye to the wall, the same angular relationship holds true: s=S=θ r R This works out because, for small angles which are less than 15o (or around .26 radians), the angular diameter and the linear diameter are very nearly equal. --------------------------------------------------------------------------------------------------------------------------------So, you will now proceed to find the angular diameter of your thumb, index finger, two fingers, three fingers, four fingers, fist, and open palm. You will then have your personal tool for measuring angles in the sky. When you go out observing with friends, and you are trying to point out a faint but interesting object, you will be able to communicate distances and directions in the sky in an understandable way instead of saying, “Look up and to the right from that tree...”. Procedure: 1) Find a suitable picture on the wall, or other conveniently flat object. Close one eye, and stand where your thumb just blocks out your view of the picture when you hold your thumb out at arm’s length. BE SURE TO HOLD YOUR ARM OUTSTRETCHED FOR EVERY MEASUREMENT! 123 2) Measure the distance from where you are standing to the wall (“R”). Measure the diameter of the picture (“S”). BE SURE TO MAKE ALL YOUR MEASUREMENTS IN CENTIMETERS. (or inches, it matters not - just be consistent!) Record all your measurements in a DATA TABLE as you make them. 3) Calculate the angular diameter of your thumb in radians as θ = S/R. (Since we already established that s/r = S/R = θ, you need only measure S and R.) 4) Convert your angular measurement from radians to degrees: 360o = 2 π radians, so 360o/2π = 1 radian, or 1 radian = 57.3o. DATA TABLE Make a data table in your journal; it should have the following headings: fingers S R θ (radians) θ (degrees) thumb index finger 2 fingers 3 fingers ... etc. Using your new-found tool: Now that you have a reference, go out tonight and measure the angular diameter of: the full Moon, if available the distance between the outermost stars in the constellations: The idea for the face-on-the-mirror trick was gleaned from SCAMPI mentors Larry Hilburn (Oxnard High) and Steve Davis (Channel Islands High), in a workshop sponsored by the Southern California Area Modern Physics Institute. (SCAMPI is directed by Dr.’s John Jewett and Roger Nanes and funded by the National Science Foundation.) 124 125 RAAP Introductory Astronomy Activity contributed by: Jatila van der Veen, Adolfo Camarillo High School and UCSB/RAAP Plotting the position of the sun at the same time each day Pre - lab thought - provoking questions: 1) How does the Sun appear to move in the sky? Does it appear to follow the same path each day, or does the apparent path of the Sun change? If so, HOW? 2) What, if anything, have you noticed about the location of the Sun at noon each day, over the course of a year? Is it the same, or does it change? 3) How many days of observation do you think would it take to notice whether or not there were any changes in the path of the Sun across the sky? Does it matter what time of year you make these observations? 4) Be sure you know the definitions of the following terms: zenith, horizon, altitude, azimuth Write down your answers in your journal or lab notebook before doing the lab! In this project you will find the altitude and azimuth of the sun every day at the same time for one month. You will make a data table and record the date, time of observation, and altitude and azimuth of the Sun, being sure to do this at the same time every day. At the end of a month you will plot the position of the Sun for each observation. Food for thought: You know that the Earth revolves around the Sun along a path which is called the ecliptic. The ecliptic is an imaginary plane in space which slices through the Sun’s equator, and in which the orbits of all the planets (except Pluto) lie. You also know that the Earth’s axis of rotation is tilted at an angle of 23.5o with respect to the plane of the ecliptic. With this in mind, would you like to revise any of your answers to the pre-lab questions? PROCEDURE: 1) Setting up your Data Table Make a data table in your notebook. Your data table of date, local time, azimuth, and altitude should look like the example below. Be sure to leave enough room for 30 measurements or more. date day number local time azimuth altitude 2) Measuring Azimuth: a)Finding the direction to North, using a compass: Hold the compass level, and note the direction in which the needle lines up; that is North. Now move the compass around so that the letter N is lined up under the tip of the needle. Set the compass down on the ground, and draw a North-pointing line with a meter stick. b) Hold your meter stick perpendicular to the ground, at the south end of your north-pointing line. Mark the line where the meter stick touches the ground, and then mark the top of the shadow cast by the meter stick along the ground. c) Now lay the meter stick down on the ground along its shadow, and connect the two marks with a straight line. This is the direction of the shadow of the meter stick. d) The shadow of the stick will be directly opposite the sun, so that if you drew a line from the sun to the shadow of the stick, it would be a straight line. Extend your shadow line so that it points toward the position of the Sun. The angle between your north-pointing line and the Sun gives you the AZIMUTH angle to the Sun, as measured clockwise from North, with North being 0o. 126 Measuring Altitude: a) Measure the length of the shadow of the meter stick in centimeters (cm). The height of the meter stick is 100 cm. Divide the height of the meter stick by the length of its shadow, and this is the tangent of the altitude angle, θ. The angle θ (“theta”), the altitude of the Sun, is the angle whose tangent is h/l. To calculate θ, simply divide the height of the meter stick, which is 100 cm, by the length of the shadow in cm, hit the “=“ button, then hit the INV TAN or TAN-1 button on your calculator, and you have the value of the angle. (If you are unfamiliar with calculators, ask someone to show you; also, be sure you have your calculator set to DEGREES and not radians. Now do this at the same time every day for the next month. Keep the data table in your notebook, being sure to leave enough space for all the entries you will need to make. 4) Graphing your results After you have obtained your altitude and azimuth measurements for the month, make two graphs: one graph showing altitude as a function of day number, and the other showing azimuth as a function of day 127 number. Connect the points in as smooth a curve as you can. After you have completed this activity, re-evaluate your answers to the pre-lab questions and see what you have discovered! 1) Well, was the Sun in the same place in the sky at the same time each day? If not, how did it change - in terms of north-south variation and altitude variation? 2) Did your observations match your initial predictions, or were you surprised at the results? 3) Although from our point of view on Earth we see the Sun appear to move, what would an outside observer from Mars, for example, offer as an explanation for why we see the Sun at a different position for the same time each day throughout the year? Use a sketch to help illustrate your point. ✺✺✺✺✺✺✺✺✺✺✺✺✺✺✺✺✺✺✺✺✺✺✺✺✺✺✺✺✺✺✺✺✺✺✺✺✺✺✺✺✺✺✺✺✺✺✺✺✺✺✺✺✺✺✺✺ Extra credit for the ambitious: 1) If you plotted the noontime position of the Sun each day for an entire year, what would the graph look like? What particular name does this figure have? 2) Suppose you live somewhere within the continental United States, Canada, or Europe, and you have just done this activity. If you lived at the North Pole, how would the apparent path of the Sun be different from what you observed for the time of year in which you actually performed the experiment? How would the path of the Sun in the course of just one day look from the North Pole in: January? June? September? March? What about if you lived in Antarctica? 3) Imagine that you lived on the planet Uranus, at the same latitude with respect to the Uranian equator as you do here with respect to the Terrestrial equator, and you just performed the same experiment. Would your answers differ? If so, HOW? (Why Uranus and not Mars or Jupiter? {he,he,he}) 128 RAAP Introductory Astronomy Activity: Investigating Impact Craters Jatila van der Veen, Adolfo Camarillo High School and UCSB Remote Access Astronomy Project data: NASA images from Voyagers I and II Meteorites are chunks of rock left over from the early stages of planet formation. The Background: oldest meteorites have been dated at 4.6 billion years old, giving an upper limit to the age of the solar system. Earlier in the history of the solar system, there were a great many more collisions of small planetessimals with the larger bodies of the solar system. We see the evidence for this in the heavily cratered surfaces of Mercury, our Moon, and the moons of the outer planets. Even today, impact cratering is still one of the most widely observed geologic processes in the solar system. In fact, there is strong evidence that asteroid or comet impacts on Earth have played a role in the evolution of plant and animal life. A large comet or meteor impact is thought to be responsible for the extinction of the dinosaurs and other life forms at the end of the Cretaceous period, about 65 million years ago. It is estimated that at least 20 craters of diameter 10 km or larger form on the Earth per million square kilometers, every billion years. This estimate is based on the numbers of craters found on Earth and the number of observed asteroids and comets whose orbits bring them close to the Earth. On a geologically active planet like the Earth, impact craters get eroded relatively rapidly, and are difficult to find. The most recently formed crater is Berringer Crater, outside Flagstaff, Arizona, which thought to have formed 50,000 years ago. On bodies with no atmosphere, water, or geologic activity, ancient impact craters are preserved. In the following activity you will compare craters on the satellites of Earth, Jupiter, and Saturn from digital images taken by the Voyager I and II Space Probes. You will then investigate features of impact craters by making them yourself! Before starting this activity, be sure you have the following images: MIMAS.FTS, DIONCRAT.FTS, MOON.FTS, CALLISTO.FTS, GANYMEDE.FTS - all of which are available from the web page of the Remote Access Astronomy Project at the University of California, Santa Barbara: http://www.deepspace.ucsb.edu/ Mimas - a satellite of Saturn that almost was blasted apart 1. Click on the ! (“floppy disk”) icon to bring up the list of images; find the one called MIMAS.FTS and double click on that name. 2. Click on the HIST icon to bring up the histogram of all the pixels in the image. Notice the red lines; you can move them up or down by clicking on the up and down arrows of the maximum and minimum. Move the right line farther to the right to include more of the pixels, and move the left line so that it is at the lower end of the maximum intensity bunch of pixels. This is like adjusting the exposure on your camera. Click on 129 the word Plot to see how you have adjusted the picture. Adjust until you have the clearest image; then click on the Okay button. 3. Click on the “exploding arrows” icon to make the image bigger so you can get a better look at that crater. * Relative size of crater “Herschel” on Mimas: Click the left mouse button inside the image to bring up the cross hair. Notice that in the lower left-hand corner of your screen there are numbers! Those are the coordinates of where your mouse is, within the image. By clicking the right mouse button and then moving the mouse, you will cause a line to be dragged within the image. Notice that at the bottom of the screen the length in pixels of the line, as well as its direction, are displayed. Draw a line across the widest part of the crater, and write down on a separate sheet of paper the diameter of the crater. Now draw a line from top to bottom of Mimas, and write down the diameter of Mimas. *WHAT IS THE RATIO OF THE DIAMETER OF THE CRATER TO THE DIAMETER OF THE SATELLITE? Yes, this crater is so big that, had it been just a little bigger, Mimas would have completely broken apart! *Features of the crater Click on the ✄ “scissors” icon to cut out the crater for a closer look. Within the image, click on the upper left corner of the box you want to cut out; drag the mouse to the lower right corner of the box you want to cut out, and click again. An image of just the crater will appear on the screen. Now click on the “exploding arrows” icon to expand the image of just the crater. *DESCRIBE THE FEATURES OF THE CRATER THAT YOU OBSERVE. LOOK FOR EVIDENCE OF A RIM AROUND THE EDGE, A CENTRAL PEAK, AND THE APPEARANCE OF THE FLOOR OF THE CRATER AS WELL AS THE GROUND OUTSIDE THE CRATER. Now clear your screen by clicking on the “trash can” icon until all the images on your screen are gone. Dione - a heavily cratered icy moon of Saturn 1. Click on the ! icon again to bring back the list of available images. Double click on the file DIONCRAT.FTS. 2. Again, click on the HIST icon and adjust the gray scaling of the image so you can see all the craters. 3. Since the entire image does not fit on the screen, click on the “shrinking arrows” icon to shrink it so you can see the whole image at once. 4. Click on the name of the original image, and then click on the trash can icon to remove it from the screen. * Comparison of Craters Cut out the two largest craters you find. Expand each of them once or twice, so you can see the features of each clearly. * DESCRIBE THE FEATURES OF EACH CRATER, INCLUDING THE APPEARANCE OF THE RIM, CENTRAL PEAK, AND CRATER FLOOR. * WHICH CRATER IS OLDER? HOW CAN YOU TELL? Now “trash” these images and clear your screen. 130 A look at a crater on Luna, the one and only moon of Earth 1. Click on the ! icon again, and bring up the image MOON.FTS. Adjust the Histogram of this image so that the features of the crater are easily visible. * DESCRIBE THE FEATURES OF THIS CRATER, INCLUDING THE PRESENCE OF A RIM, CENTRAL PEAK, AND THE APPEARANCE OF THE FLOOR OF THE CRATER AND THE GROUND AROUND THE OUTSIDE OF THE CRATER. * IS THIS A RELATIVELY OLD OR YOUNG CRATER ON THE MOON? HOW CAN YOU TELL? Now trash this image, and bring up the image called CALLISTO.FTS. Callisto - a moon of Jupiter with giant rayed craters 1. As before, adjust the histogram. 2. Cut out the section of the image that contains the big crater, and expand it one level. * DESCRIBE THE CRATER AND THE GROUND AROUND IT. WHAT NEW FEATURES ARE EVIDENT ON CALLISTO THAT WERE NOT EVIDENT IN THE OTHER IMAGES? WHAT DOES THIS TELL YOU ABOUT THE SURFACE OF CALLISTO? Trash the image of just this crater, and examine other craters. * DESCRIBE ANY UNUSUAL FEATURES OF THE CRATERS ON CALLISTO THAT YOU DID NOT OBSERVE ON MIMAS, DIONE, OR LUNA. WHAT DOES THAT TELL YOU ABOUT THE SURFACE OF CALLISTO AS OPPOSED TO THE SURFACES OF THE OTHER SATELLITES? Trash the image of Callisto, and bring up the file GANYMEDE.FTS. 131 Ganymede - another unusual-looking moon of Jupiter 1. Once again, click on the ! icon, and bring up the image GANYMEDE.FTS. Use the techniques you learned from the other parts of the lab to adjust the shading with the HIST icon, cut out craters you want to investigate with the ✄ icon, and expand features with the exploding arrows. * DESCRIBE THE FEATURES OF CRATERS ON GANYMEDE, PAYING ATTENTION TO THE PRESENCE OF BRIGHT RAYS OF EJECTA AND DOUBLE RINGS. WHAT CAN YOU SAY ABOUT THE SURFACE OF GANYMEDE FROM THE FEATURES OF THE CRATERS? * WHAT CLUES ABOUT THE MATERIAL THAT MAKES UP THE SURFACE AND THE MATERIAL JUST BELOW THE SURFACE CAN YOU INFER FROM THE BRIGHTNESS OF THE CRATERS AND THE EJECTA? Summary: write an essay in which you... Discuss the features of impact craters you have observed, including: the general shape of most craters; the appearance of the rim and central peak; the condition of the floor of the crater and the surrounding ground outside the crater, and what the appearance of the inside and outside of the crater can tell you about the age of the crater; the presence of ejecta around the crater, and what the brightness of the rays can tell you about the material on the surface and below the surface; why some craters have double rings; and anything else you have learned! Now you are ready to do the messy part: making craters yourself! 1. Prepare a small box or pie plate, or other container, with about three inches deep of layered white flour and flour mixed with cinnamon, to get alternating light and dark layers. 2. Drop a marble from the following heights: 1 meter, 1.5 meter, 2 meters, 2.5 meters, 3 meters, 3.5 meters, and 4 meters. You will have to stand up on the lab tables to accomplish the larger distances. 3. For each drop, record the height of release, the depth in cm. of the crater, the extent of the ejecta (measured in cm.) and the appearance of the crater. Note any unusual features! DATA TABLE: the height of release the depth of the crater extent of ejecta (meters) (centimeters) (cm) other features 4. Conclusion: Make a statement which relates the height of release, the energy of the impact, the depth of the crater, and the extent of the ejecta! ☺ NOW CLEAN UP YOUR MESS!!! 5. EXTRA CREDIT FOR THE AMBITIOUS: Calculating the energy released by your impacts. We know from our study of basic physics that within any closed system, the total amount of energy is conserved. If you consider your hand + marble + flour to be a closed system, you can find the energy released by the impact by knowing the energy you gave to the marble by lifting it up to a given height. The energy you store in the marble - flour system is called the POTENTIAL ENERGY of the system, and is 132 equal to the product of the mass of the marble, times the height above the ground, times the acceleration of gravity near the surface of the Earth.* When you release the marble, this potential energy is gradually converted into KINETIC ENERGY until the marble smacks into the flour. At that moment, all the potential energy you stored in the system has been converted into kinetic energy, and is released in the form of the splash of the ejecta, the excavation of the crater (work done to move the flour), the sound you hear, and a tiny amount of heat which is released. (*or the surface of whatever planet you happen to be on!) Potential Energy is found from the formula : P. E. = mgh where m is the mass in kilograms, h is the height of release in meters, and g is the acceleration of a freely-falling object near the surface of the Earth, which is 9.8 meters/second2. This is equal to the amount of energy released when your marble hits the flour. Physicists measure energy in units of JOULES. 1 Joule is equal to 1 Newton-meter, or 1 kg x meter2 x second-2 For each height of release of your marble, calculate the energy released upon impact. 1) Find the mass of your marble on a laboratory balance: mass in grams = ________________________ 2) Convert this mass into kilograms: mass in grams / 1000 = mass in kilograms = __________________ 3) Calculate the energy released by each impact in Joules by multiplying the mass of the marble in kilograms x the height of release in meters x 9.8 meters/second2. Your Data Table should look something like this: height of release (meters) energy (Joules) {= mgh} If you are interested in doing further research about craters, here are some items of interest: * The mysterious Tunguska meteorite that hit Siberia in 1908; * Comet Shoemaker/Levy #9 that crashed into Jupiter in July, 1994; * Evidence for a large comet or asteroid that hit the Earth 65 million years ago, and its connection to the extinction of the dinosaurs; * The formation of the Solar System, and recent observations of possible solar systems around other stars. 133 Lab Activities for the Macintosh Environment The following lab activities have been modified from their original format, and are intended to be used with MAIA, a shareware image processing program written by a student at the Massachusetts Institute of Technology REMOTE ACCESS ASTRONOMY PROJECT UNIVERSITY OF CALIFORNIA, SANTA BARBARA and CENTER for PARTICLE ASTROPHYSICS Image Processing Curricula for High School and College Physics and Astronomy 134 135 Craters in the Solar System An exercise in astronomical image analysis by Jatila van der Veen and Philip Lubin Department of Physics, UCSB Revised by Roger Freedman — September 1994 • PURPOSES OF THIS EXERCISE: • To learn how astronomers analyze digital images; • To investigate the sizes and shapes of craters on some of the bodies of our Solar System; • To calculate the energy released when a modest–sized meteorite impacts a moon. • INTRODUCTION The solar system is a fascinating place, with nine very different planets, dozens of moons orbiting those planets, and thousands of small bodies called asteroids. In this Exercise, you will explore impact cratering, one of the most common surface features of planets, moons, and asteroids. You will study the surfaces of three of the moons of the solar system, using images obtained by the Voyager 1 spacecraft that flew past Saturn in 1980 and by telescopes on Earth. You will also study the surface of an asteroid, using an image obtained by the Galileo spacecraft in 1993 while en route to Jupiter. These images were recorded electronically, using much the same technology as is found in television cameras and camcorders. You will analyze these images with a computer program developed at the University of California’s Lick Observatory for use by professional astronomers. This program is in a version called MAIA (Macintosh Astronomical Image Analysis), written by MIT undergraduate Tim DeBenedictis. • IMPACT CRATERING An impact crater occurs when a body crashes into the surface of a planet or moon. The bodies that create these craters are debris “left over” from the formation of the solar system, about 4.6 × 10⁹ years ago. Most of this debris is in the form of very small bodies. But the solar system also contains numerous asteroids and comets which are several kilometers in size. (An asteroid is a body that is mostly made up of rock; a comet is primarily made of ice. When a comet comes close to the Sun, it partially evaporates; the evaporating material forms the “tail” of the comet.) If one of these large bodies hits a planet or moon, the impact crater can be quite large. It is estimated that at least 20 craters of diameter 10 km or greater form on the Earth per million square kilometers every billion years, based on craters found on Earth and the number of observed asteroids and comets whose orbits pass close to Earth. There is strong evidence that the Earth suffered a massive impact of this kind 65 million years ago, triggering a chain of events that lead to the extinction of the dinosaurs as well as many other species. If this is indeed what happened, then the world we see around us today is a direct result of impact cratering. On a geologically active planet like Earth, impact craters are difficult to find, because they are eroded relatively rapidly by wind, rain, or geologic upheavals. On bodies with little or no atmosphere, water, or active volcanoes, ancient impact craters are preserved. The surfaces of our Moon, Mercury, Mars, and many of the moons of Jupiter and Saturn are covered with craters. IN THIS EXERCISE, YOU WILL COMPARE IMPACT CRATERS ON TWO OF THE MOONS OF SATURN, ON THE EARTH’S MOON, AND ON AN ASTEROID. 136 • WHAT YOU ARE TO HAND IN The write–up that you are to hand in will consist of your answers to the questions posed in this handout. The questions that you are to answer are denoted by the symbol for the MAIA program, shown to the right. Your instructor will announce the due date for handing in your write–up. • VIEWING AN IMAGE USING MAIA FIRST MAKE SURE THE COMPUTER IS TURNED ON! Start up the MAIA program by double–clicking on its icon. Once the program has started up, you will see a display at the top of the screen as shown below. Now move the mouse until the cursor is over the word File. Hold the mouse button down, and keep holding it down as you move the mouse so that the cursor is over the phrase Open FITS..., as shown in the picture to the right. (FITS is an acronym for Flexible Image Transport System, which is the astronomical community’s standard means of storing images and data.) Then release the mouse button (this is called “selecting” the command Open FITS...). You will now see a box on the screen which lists various files. Point the cursor to the one labelled Crater Images and click the mouse button (this will highlight the phrase Crater Images). In the same way use the mouse to click the button labeled Open. Then point the cursor to the name Mimas – Craters, click the mouse button to highlight it, and again use the mouse to click on the Open button. After 20 to 30 seconds you will see a new window on the screen showing an image of Mimas, one of the moons of Saturn. This image was taken by the Voyager 1 spacecraft in December 1980. The image will probably not be centered on the computer screen, however. To see the image properly, point the cursor to the title Mimas — Craters at the top of the image window, hold down the mouse button, and move the mouse to the left. This “drags” the entire window to the left. Keep moving the window until you can see the “zoom box” at the upper right of the window, as shown here. Then release the mouse button. Point the cursor to the zoom box and click the mouse button. This will cause the image window to fill the screen of your computer’s monitor. “zoom box” The entire image is larger than the monitor screen. You can view different parts of the image by using the scroll bars at the bottom and right edges of the window. Use these to center Mimas in the field of view. You can “zoom in” on Mimas by using the Zoom In command in the Display menu, as shown here. Try using this several times, and try the Zoom Out command as well. Use these commands so that the image of Mimas fills most of the screen. You can see that Mimas has many craters on its surface. Notice the very large crater in the northeast quadrant of Mimas. This crater is named Herschel, after the astronomer who first discovered this satellite of Saturn. Your first task is to determine how big this crater is. (In addition to Mimas itself, you will also see a grid of regularly–spaced black dots on the image. This grid was built into the camera on Voyager 1 to assist in making measurements from the images. We won’t make use of them, however.) • MEASURING THE SIZE OF THE CRATER HERSCHEL ON MIMAS 137 To make measurements from an image using MAIA, you must first understand how the image is recorded and displayed. The image is made up of pixels (short for “picture elements”), each of which was recorded by a separate part of an electronic detector. Each pixel has a value, which is a measure of how bright the image is at that point. It also has coordinates, which measure where on the image the pixel is located. Pixel coordinates are measured from the upper left–hand corner of the image. As you move the cursor over the image, it changes into a crosshairs. The MAIA display shows you the value and coordinates of the pixel that is underneath the center of the crosshairs. An example of this is shown below. “value” of the pixel under the crosshairs (a measure of the brightness): in this case, 66.00 coordinates of crosshairs: in this case, (101, 73) 101 pixels to the right 73 pixels down Making measurements is a matter of counting the number of pixels from one point on the image to another. MAIA makes this easy for you to do. To see how this works, use the mouse to point the crosshairs to any point in the image. Then, holding the mouse button down, move the crosshairs to a different position. Then release the mouse button. The result will be a box drawn on the image, with a diagonal line connecting the points where the crosshairs began and ended its journey. An example of this is shown to the right. To find the distance between the beginning and end of the diagonal line, select the command Separation... in the Analysis menu as shown below. A data window will then appear telling you the distance between 138 these two points (in pixels). In this example, the two points are 85.00 pixels apart. (The other data shown isn’t relevant for the task at hand.) You can get rid of the data window by clicking the mouse on the OK button, and you can get rid of the box you drew on the image by clicking the mouse anywhere in the image. You can use this technique to measure the diameter of Herschel, the largest crater on Mimas. But first we must determine the scale of this image – that is, how many kilometers are represented by each pixel. We’ll assume that Mimas is spherical, and measure the distance in pixels from the “north pole” of Mimas (at the top of the image) to its “south pole.” QUESTION 1: Use the technique described above to draw a line from your best estimate of the “north pole” of Mimas to your best estimate of the “south pole.” Then find the distance (in pixels) from pole to pole. What is the diameter of Mimas, in pixels? We know from measurements made by Voyager 1 that the actual diameter of Mimas is 390 km. QUESTION 2: Find the scale of the image of Mimas, in kilometers per pixel: scale = (diameter in km)/(diameter in pixels) = _______________ km/pixel. Now we can find the actual diameter of Herschel. Notice that the crater is not oriented north–south. QUESTION 3: Find the widest part of the crater, and measure the diameter of this widest part in the same manner as you measured the diameter of the whole moon. What is the diameter of the crater, in pixels? QUESTION 4: Multiply your answer to Question 3 by the scale factor you found in Question 2. This gives you the diameter of the crater Herschel, in kilometers: diameter (in pixels) × scale (km/pixel) = diameter in km = _____________________ km. Compare your answer to the size of San Francisco Bay (80 km long from north to south). QUESTION 5: What fraction of the diameter of Mimas is the diameter of the crater Herschel? 139 QUESTION 6: Use the same technique as in Question 1 to estimate the depth of Herschel crater, in pixels. Then, using the scale factor you found in Question 2, find the depth of the crater, in kilometers: depth (in pixels) × scale (km/pixel) = depth in km = _____________________ km. Compare your answer to the height of tall mountains on Earth such as Mt. Everest, which rises to a height of 8,848 meters (29,028 feet). Herschel crater is one of the largest craters observed on any body in the solar system. Had the impact that created Herschel been much larger, Mimas would have broken apart. • COMPARING CRATERS ON MIMAS WITH CRATERS ON DIONE Use the Close command in the File menu to get rid of the image of Mimas. Then use the command Open FITS... again, as described on page 2 of this handout, and open the file named Dione — Craters. This is a Voyager 1 image of Dione, another moon of Saturn. Dione is larger than Mimas. As you did for the image of Mimas, move the window and use the “zoom box” so the image of Dione fills the screen. Use the scroll bars so that a little more than one quarter of Dione is showing in the picture. This image does not show the entire moon, but you can get a fairly good estimate of where the center of Dione is by observing the curvature of the north and west sides in the image. To measure the sizes of craters on Dione, we once again need to estimate the scale of this image in kilometers per pixel. QUESTION 7: Try to find the center of Dione from the image. Using the same method as before, measure the radius of Dione (the distance from the center to one pole) in pixels. How many pixels is the radius? The actual radius of Dione is about 560 km. Now you can get an estimate of the scale factor for this image in the same way you did for the image of Mimas. QUESTION 8: Find the scale of the image of Dione, in kilometers per pixel: scale = (diameter in km)/(diameter in pixels) = _______________ km/pixel. QUESTION 9: Scroll up the image as far as it will go. Look for the largest crater you can find, and estimate its diameter in the same way you did for Herschel crater on Mimas. diameter of crater in pixels = _____________________ diameter (in pixels) × scale (km/pixel) = diameter in km = _____________________ km. QUESTION 10: What fraction of the diameter of Dione is the diameter of the crater you described in Question 9? Which crater is larger, this one or Herschel on Mimas? Which crater is larger IN PROPORTION TO THE MOON IT IS ON? • CRATERS ON THE ASTEROID IDA Use the Close command in the File menu to get rid of the image of Dione. Then use the command Open FITS... again, as described on page 2 of this handout, and open the file named Craters — Ida. This is a Galileo image of the asteroid Ida, a small body whose orbit around the Sun lies between the orbits of Mars and Jupiter. Ida is not a sphere — its dimensions are 56 by 24 by 21 kilometers. Ida is special because it is the first asteroid confirmed to have a moon of its own. The moon is very tiny, only about 1.5 km (1 mile) across. At the end of this handout is a copy of a NASA press release that describes how this moon was discovered. This image shows very fine detail on the surface of Ida, so we can examine very small craters. To measure the sizes of these craters, we must once again estimate the scale of the image in kilometers per pixel. 140 QUESTION 11: Using the same method as before, measure the long axis of Ida (from upper left to lower right) in pixels. How many pixels is the distance along the long axis? The actual distance along the long axis of Ida is about 56 km. Now you can get an estimate of the scale factor for this image in the same way you did for the images of Mimas and Dione. QUESTION 12: Find the scale of the image of Ida, in kilometers per pixel: scale = (long axis in km)/(long axis in pixels) = _______________ km/pixel. QUESTION 13: Look for the smallest crater you can find, and estimate its diameter in the same way you did for Herschel crater on Mimas. You will probably want to “zoom in” on Ida by using the Zoom In command in the Display menu. You may want to use this command several times. (If you “zoom in” more than you wanted to, use the Zoom Out command.) diameter of crater in pixels = _____________________ diameter (in pixels) × scale (km/pixel) = diameter in km = _____________________ km. QUESTION 14: Compare the size of the crater you found in Question 13 to the size of a typical school auditorium or lecture hall (about 30 meters across). Would the auditorium fit in the crater? How many craters can you count on Ida that are of roughly the same size as the one in Question 13? (There are probably smaller craters, too, but you can’t really tell for sure from this image because such tiny craters would appear to be less than 1 pixel across.) QUESTION 15: Do you see any craters on Ida’s moon? (Again, use the the Zoom In and Zoom Out commands in the Display menu.) How can you tell? • A CLOSER LOOK AT SOME CRATERS Questions 16–21, given below, are some general questions about craters. To help you decide what the answers might be, first read the questions, then look carefully at the image of Ida that’s currently on the screen. Observe the surfaces inside and outside the craters; examine the appearance of the crater walls and the shapes of the craters. After you’ve done this, use the Close command in the File menu to get rid of the image of Ida, and use the Open FITS... command in the File menu to open the file Craters — Moon. This is a close–up picture of a crater on our Moon, made with a telescope on Earth. Examine these craters like you did those on Dione, with the same questions in mind. Then get rid of the image of the Moon (again, use Close in the File menu) and use the Open FITS... command to open the file Craters — Mimas which you studied previously. Then get rid of the image of Mimas (again, use Close in the File menu) and use the Open FITS... command to open the file Craters — Dione which you studied previously. Finally, answer the questions below. Make your best guesses before looking up any answers! QUESTION 16: Is there a difference in the appearance of the inside floor of a crater and the ground surrounding the crater? Describe the difference. QUESTION 17: From what you know or suspect about the way impact craters form, would you expect there to be a difference in Question 16? Why or why not? QUESTION 18: The majority of craters are circular. Would you expect this? Why or why not? QUESTION 19: Have you observed any examples of impact craters of any kind? What were they, and how were they formed? (Craters can be formed by a variety of falling objects, not just meteorites!) 141 QUESTION 20: Compared to other bodies in the solar system (like Mimas, Dione, Ida, and our Moon), only a few impact craters are observed on Earth. Why do you think this is? QUESTION 21: Many large impact craters have peaks in their centers. How do you think these central peaks form? Here are some ideas that scientists have developed about how craters form. Compare them to your best– guess answers: • Bodies that crash into planets or satellites at high speeds create tremendous shock (pressure) waves that penetrate the surface of the planet. The extremely high pressures cause both the target material and the impacting body to get so hot as to melt. (If the impacting body is not too large, it may even vaporize!) The molten material moves outward from the location of the impact, as the shock front expands, and forms a crater rim. After the shock wave passes, material from the crater rim slumps inward, and converges in the center to form a peak. • Another mechanism which is believed responsible for the central peaks inside craters is simply the elastic rebound of the ground, after the pressure wave has passed. • Much material is ejected from the excavated crater. While the floor of the crater is often smooth due to melting, the ground outside the crater is often littered with debris from the impact, called ejecta. The ejecta consist of material spattered out from the floor of the crater, and sometimes chunks of the impacting body itself (if it was massive enough that it did not all vaporize upon impact!). There are often secondary craters observed around large craters; the secondary craters are made by the ejecta. Rays are observed around young craters on the Moon and other planets, which are made up of ejecta which was shot out from the crater. • QUITTING THE MAIA PROGRAM When you are done with using MAIA, select the command Quit in the File menu. • ESTIMATING THE ENERGY RELEASED IN A TYPICAL IMPACT (NOTE: This part of the exercise does NOT use the computer.) Scientists try to estimate the sizes of bodies that must have made the large craters that we observe on Earth and other planets. While this is actually a rather complicated process that involves doing impact experiments under controlled conditions in the lab, we can use a few simple considerations to make a rough estimate of the amount of energy released by a typical impacting body. 1. How fast is an impacting body moving when it hits a moon or planet? Impact velocities are estimated to range from about 5 km/sec for colliding asteroids to 40 km/sec for the body that is thought to have collided with the Earth 65 million years ago, and which is thought to be responsible for the mass extinctions of animal and plant life at the end of the Cretaceous period. To be on the conservative side, let’s assume an impact velocity of 10 km/sec for a small body that crashes into the Moon. 2. How big across is a typical impacting body? This is a tough one. A body that could cause a crater of 100–200 km diameter on the Earth is estimated to be 10 km in diameter. Let’s be conservative and investigate a more modest body of 1 km diameter. For simplicity, we’ll assume the body is spherical. 3. How much mass is in a typical impacting body? To answer this, we need to estimate the density (mass per volume) of a chunk of interplanetary material. If it was a piece of asteroid, it could have a density of around 3.5 grams per cubic centimeter = 3.5 grams/cm3 (1 gram is 1/1000 of a kilogram). But if it was a chunk of a comet, which is mostly ice, its density may be only 1.1 or 1.2 grams/cm3. Let’s assume our hypothetical meteorite was rocky rather than icy, with a 142 density of 3.0 grams/cm3. To determine the mass of the impacting body, we take the density (in grams per cubic centimeter) and multiply it by the volume of the body (in centimeters). QUESTION 22: What is the radius of the impacting body, in centimeters? (There are 100 cm in 1 meter, and 1000 meters in 1 km.) What is its volume, in cubic centimeters (cm3)? The formula for the volume V of a 4π 3 sphere that has radius R is V = R . 3 QUESTION 23: What is the mass of the impacting body, in grams? Use the following formula: Mass (in grams) = density (in grams/cm3) × volume (in cm3) = _______________ grams. To determine how much energy is released in the impact, we need to calculate the kinetic energy of the impacting body. This is a measure of how much damage a body can do when it hits a target and stops. It depends on the mass of the body and on its velocity. The greater the mass or the greater the velocity, the greater the kinetic energy and the greater the amount of damage the body can do. The formula for kinetic energy is Kinetic energy (in ergs) = 1 mv2, where m = mass (in grams) and v = velocity (in cm/sec). 2 QUESTION 24: What is the velocity of the impacting body, in cm/sec? What is its kinetic energy, in ergs? To get an idea of how much energy this really is, consider that 1 megaton of TNT (that’s 106 tons of TNT) is equivalent to approximately 4.2 × 10²² ergs. QUESTION 25: How many megatons of TNT are equivalent to the energy released by our hypothetical typical impacting body? And this is just an average collision! Of course, there are many micro–impacts that are hardly noticed, and there are larger ones that make larger craters, too. • FOR FURTHER LEARNING If you are interested in studying more about collisions of large and small bodies, look up the following items of interest... • The mysterious Tunguska meteorite that hit Siberia in 1908. • The evidence for a large impact that hit the Earth 65 million years ago, and its connection to the extinction of the dinosaurs. • Cosmic near misses: asteroids that have passed close to the Earth in the last decade (there have been quite a few!). • The era of crater formation on the Moon, and the history of the solar system. • Impact craters on other bodies of the solar system. • Comets, asteroids and meteors: what they tell us about the material of which the solar system is made. • JUST FOR FUN: TRY MAKING CRATERS YOURSELF Get a plate with a rim around it, like a tin pie plate. In the pie plate, put down several inches of alternating layers of different powdery substances, such as sand, flour, sugar, cinnamon–sugar (to make a brown layer), etc. This represents the surface of a planet, moon, or asteroid. 143 Then drop projectiles of different mass from the same height and observe the types of craters you get. (You can also drop the same projectile from different heights.) Experiment with different types of projectiles: marbles and pebbles which do not break apart upon impact will create a different effect from mud balls that do break apart. Try various methods of obtaining different impact velocities: for instance, dropping versus throwing, or propelling the impacting body through a blow gun or using a sling shot. Observe the structures that form. Examine the inside floor of the crater and the ground around the crater for differences. Notice the order of the layers of “sediment” that are exposed along the inside walls of the crater, and compare to the order in which the layers of ejecta are laid down. Examine the crater wall and look for evidence of a central peak. Calculate the energy released for each of your impacts. Correlate the appearance of the crater wall and presence of a central peak with the energy of impact. THINK OF OTHER INVESTIGATIONS YOU WOULD LIKE TO DO! • FOR FURTHER READING • Eugene and Carolyn Shoemaker, “The Collision of Solid Bodies,” in The New Solar System, edited by J. K. Beatty and A. Chaykin, Sky Publishing, 1990. •David A. Rothery, Satellites of the Outer Planets, Oxford University Press, 1992. •J. K. Beatty, “Killer Crater in the Yucatan,” Sky & Telescope, July 1991. 144 PUBLIC INFORMATION OFFICE JET PROPULSION LABORATORY CALIFORNIA INSTITUTE OF TECHNOLOGY NATIONAL AERONAUTICS AND SPACE ADMINISTRATION PASADENA, CALIFORNIA 91109 TELEPHONE (818) 354–5011 Contact: Franklin O’Donnell FOR IMMEDIATE RELEASE March 23, 1994 The first–ever photograph of a moon of an asteroid, sent to Earth by NASA’s Galileo spacecraft, was released by the space agency today. The photo, of asteroid 243 Ida and its newly discovered natural satellite, was taken by Galileo as the spacecraft flew past Ida last August 28. It was not transmitted to Earth until recently because the spacecraft is sending back data at a very slow rate. According to team scientists at NASA’s Jet Propulsion Laboratory, the image together with data from Galileo’s near–infrared mapping spectrometer are the first conclusive evidence that natural satellites of asteroids exist. The discovery gives scientists an intriguing new clue in deciphering the origins and evolution of these ancient, rocky bodies, most of which orbit the Sun in the main asteroid belt between Mars and Jupiter. Even so, many pieces of information on the newly found moon – where it came from, how it came to be orbiting Ida and the details of that orbit – are still unclear. “It was previously thought that natural satellites of asteroids could form, but they probably weren’t common,” said Dr. Torrence Johnson, Galileo project scientist. “Having found one fairly quickly, we can say that they’re probably more common than previously thought.” From the photo and spectrometer data, team scientists estimate that the natural satellite is about 1.5 kilometer (1 mile) across in this view, and appears to be at a distance of about 100 kilometers (60 miles), plus or minus 50 kilometers (30 miles), from Ida’s center. The position will be more accurately determined as new data are analyzed. Ida itself is about 56 by 24 by 21 kilometers (35 by 15 by 13 miles) in size. As yet they do not know the parameters of the object’s orbit – critical information that can reveal Ida’s mass. Combined with measurements of Ida’s size and volume, that can tell scientists the asteroid’s density, offering more clues as to what it is made of. The data from Galileo’s near–infrared mapping spectrometer – which scans space objects at a variety of wavelengths to reveal their chemical composition – suggest that Ida’s moon is made more or less from the same kind of material as Ida. As an S–type asteroid, Ida is composed mostly of silicate rocks. Scientists are certain, in any event, that the moon’s surface is not composed mostly of carbonaceous material, as are the many asteroids that are termed C–type asteroids. Further information on the object’s composition will become available as color pictures and more detailed data from the spectrometer are transmitted to Earth over the next few months. Galileo scientists believe the moon may have been created at the same time as Ida – when an older, larger asteroid was shattered in a collision with another asteroid, giving birth to dozens of smaller asteroids. Ida is a member of the Koronis family of asteroids, which scientists believe was created when a larger body perhaps 200 to 300 kilometers (120 to 180 miles) in diameter was smashed relatively recently – at least considerably after the solar system formed some 4.5 billion years ago. (The family was named for Koronis, one of the asteroids that belongs to it.) Alternatively, it is possible that Ida was hit by a smaller object even more recently, leaving a crater on the asteroid and throwing off the material that became the small moon. “Ida’s age is baffling, because the craters visible on its surface suggest that it is old, but being a part of the Koronis family suggests it is younger,” said Johnson. “In any event, we don’t believe that Ida and its moon could go back to the formation of the solar system,” he added. “It’s generally thought that a small object like that moon could not survive this long; sooner or later it would itself be broken up in a high– speed collision with an even smaller object.” Galileo scientists also believe it is virtually impossible that the moon is a “captured object,” something created completely separately from Ida that happened to wander near the asteroid and be caught by its gravitational field. According to the laws of celestial mechanics, such an event would deflect the smaller object, but it would not be captured into orbit unless a third force of some kind slowed it down. “Once we have determined the object’s orbit, we can estimate time scales and make better guesses as to where it came from,” said Johnson. 145 Launched in October 1989, Galileo made its closest approach to Ida at a distance of 2,400 kilometers (1,500 miles) last August while flying through the asteroid belt en route to its final destination – the giant planet Jupiter, where it will go into orbit in December 1995. Because Galileo is sending data back to Earth through its low–gain radio antenna, it must transmit at slow rates. One portrait of Ida – a mosaic of five separate frames – was received shortly after the flyby, but later pictures had to wait because telecommunications conditions became unfavorable as Galileo’s distance from Earth increased. In the meantime they were stored on Galileo’s onboard tape recorder, awaiting playback this spring. Scientists say that the newly found moon was outside the boundaries of the picture of Ida released last September. Ground controllers instructed Galileo to send back more portions of photos and other data beginning in February as the spacecraft’s distance from Earth decreased and radio communications with the spacecraft improved. In preparation for complete playback, they commanded the spacecraft to transmit strips of each image – called “jail bars” by the project’s engineers and scientists – so that they could locate Ida accurately in images stored on Galileo’s recorder. Later, portions of an image containing Ida could be selected for playback in their entirety. On February 17 – a day after the first of these “jail bars” was sent back from Galileo – evidence of the natural satellite was noticed in one set of image strips by Ann Harch, a Galileo imaging team associate at JPL. It took several days to verify that what appeared to be a moon was not, in fact, an artificial effect of some kind. On February 23, scientists examining similar preliminary data from a chemical map obtained by the near–infrared mapping spectrometer discovered an unusual object in their data. By February 28, scientists from both the camera and spectrometer teams concluded that they had a confirmation. Amateur astronomers for many years have observed the light of stars blinking off and on as objects such as asteroids pass in front of them in events called stellar occultations. Some have reported “blinkouts” that suggest that some asteroids have moons, but such reports have never been confirmed by definite second sightings. Galileo’s discovery is thus the first unambiguous evidence of an asteroid moon. Other images that may show the asteroid moon are still stored on Galileo’s tape recorder, and will be played back later this spring. Among them is an image that is expected to be at least three times sharper than the first image received. The newly found moon has been provisionally designated “1993 (243) 1” – meaning that it is the first natural satellite discovered in 1993 at Ida, which was the 243rd asteroid discovered over the past two centuries. The moon will be formally named later by the International Astronomical Union. JPL manages the Galileo Project for NASA’s Office of Space Science. 146 147 Tracking Sunspots An exercise in astronomical image analysis by Jatila van der Veen and Philip Lubin Department of Physics, UCSB Revised by Roger Freedman — September 1994 • PURPOSES OF THIS EXERCISE: • To observe sunspots on the surface of the Sun; • To calculate the rotation rate of the Sun at the solar equator. • INTRODUCTION In this Exercise, you will get a chance to observe sunspots on the surface of the Sun, and use your observation to measure the rotation of the Sun’s equator. You will use images of the Sun made at the Boulder, Colorado solar observatory of NOAA, the National Oceanic and Atmospheric Administration. You will analyze these images using a computer program developed at the University of California’s Lick Observatory for use by professional astronomers. The version you will use, called MAIA (Macintosh Astronomical Image Analysis), was developed by MIT undergraduate Tim DeBenedictis. • SUNSPOTS Recorded observations of sunspots date back 2000 years to ancient Chinese observers. Indian astronomers also recorded observations of sunspots, and there are references to them by Greek observers from around 400 B.C. In western history, Galileo was among the first observers to look at the Sun through a telescope in 1610 observe “dark spots” on its face. In ordinary visible light sunspots appear dark compared to the rest of the solar surface because they are cooler than the surrounding regions. The temperature of sunspots is “only” about 4000 K, while the average temperature of the photosphere (solar surface) is about 6000 K. The reason why sunspots are cooler than the rest of the Sun’s surface has to do with the complicated interaction between the solar magnetic field, the convecting ionized gases that rise to the surface in the outer layers of the Sun, and the fact that the Sun does not rotate as a rigid body. • HEAT TRANSPORT IN THE SUN The Sun is made mostly of ionized hydrogen. In the core, where the thermonuclear reactions that make the Sun “shine” are taking place, the temperature is millions of Kelvin. Heat is carried away from the core to the outer layers by the slow process radiative transport. It takes photons hundreds of thousands of years to travel from the interior of the Sun to the outer layers. Within the upper 100,000 km of the Sun, however, heat is transported to the surface more rapidly by convection. • MAGNETIC FIELDS IN THE SUN The strong magnetic fields of sunspots keep the hot, ionized gases from reaching the surface and releasing their heat directly below the sunspots; this causes sunspots to be somewhat cooler than the rest of the Sun’s surface and appear dark in comparison. (If you could isolate sunspots, however, they would appear far brighter than the full Moon, but somewhat red.) The Sun as a whole has a weak magnetic field, similar to that of the Earth, with the magnetic field lines emerging at the north pole and re–entering at the south. The overall intensity of the solar magnetic field is about 1 gauss – the same as that of the Earth. In sunspots, however, the local magnetic field can be several thousand times stronger. We know this is so, because of the splitting of the lines in the absorption spectra 148 of sunspots. This effect, called the Zeeman effect after the Dutch physicist who discovered it in 1886, was first observed for sunspots by George Ellery Hale in 1908, at the Mount Wilson Observatory. • ROTATION RATES OF THE SUN AND THE FORMATION OF SUNSPOTS The Sun behaves like a fluid. While terrestrial planets such as the Earth are solid, and rotate as rigid bodies, the Sun rotates faster at its equator than at its poles. As a result of the differences in rotation rates at different latitudes, the north–south magnetic field lines of the Sun get stretched out in an east–west direction at lower latitudes (i. e. closer to the equator). The field lines eventually pinch off and forming intense localized fields, aligned roughly east–west. Sunspots tend to form in pairs, one a north magnetic pole, where the local field lines emerge from the surface, and the other a south pole, where the local field lines plunge back into the solar surface. Sunspots are often accompanied by towering arcs of ionized gases which follow these local field lines. New sunspots first appear at latitudes around 35° north and south of the equator. Occasionally sunspots are observed at higher latitudes. By observing the motion of sunspots at different latitudes, astronomers have been able to observe the rotation rate of the Sun at different latitudes. (Another way to do this is by observing the Doppler shift of spectral lines in the photosphere at various latitudes.) • SAFELY OBSERVING THE SUN You CANNOT observe the Sun safely by looking directly at it, either with the naked eye or with a telescope! However, you can observe sunspots with a small telescope if you project the image of the Sun onto a screen. If there are any sunspots, they will appear as dark, hairy spots on the solar disk. Other ways to observe the Sun are with special filters or digital cameras that are sensitive at X–ray or other wavelengths. • THE IMAGES OF THE SUN USED IN THIS EXERCISE The images you will use in this exercise were taken with an “H–α” (pronounced “H–alpha”) filter. This is a special, very narrow–band red filter, centered on the 6563–Ångstrom line emitted by excited neutral hydrogen. Since the Sun is made up mostly of hydrogen, this 6563–Å line is one of the strongest absorption lines in the solar spectrum. Most of the photons of that wavelength coming from the surface of the Sun (the photosphere) are absorbed before they reach the very thin outer atmosphere of the Sun (the chromosphere). Only 6563–Å photons that originate in the chromosphere escape into space and are visible to us. So, when you look at these images, you are mainly looking at features in the chromosphere, or outer part of the solar atmosphere. Since sunspots are about 2000 K cooler than the surrounding photosphere, the ionized hydrogen in the chromosphere directly above the sunspots actually cools down enough to capture a free electron, and become neutral hydrogen (1 proton, 1 electron). This neutral hydrogen is heated and excited, causing the hydrogen to emit photons at its characteristic frequencies in the visible spectrum. The strongest emission is the one at at a wavelength of 6563 Ångstroms, corresponding to red light. (If you are lucky enough to observe a total solar eclipse, you can see a faint red rim around the Sun at totality, which is the red glow of the H–alpha photons in the chromosphere!) The images in this exercise were all taken with a digital camera and appear in “black & white.” The parts that are dark in the picture are H–α absorbers; the features that appear bright are H–α emitters. Locally intense magnetic fields in the photosphere often cause gases in the chromosphere to heat up and glow brighter than their surroundings. Called plages (“beaches” in French), these irregular bright patches of hot, disturbed gas usually precede the formation of sunspots and persist even after the sunspots have disappeared. You can see plages on some of the images; sunspots show through these plages as dark patches. To see them better, you can box off part of the solar image and enlarge it. You will also notice irregular, snaky dark lines on these images; these are filaments of gas that stick up above the Sun. When these filaments approach the limb of the Sun as it rotates, they can be seen as bright curtains of gas that protrude many hundreds to thousands of kilometers above the surface. They are strong H–alpha absorbers, and hence appear dark when seen through the 6563–Ångstrom filter. 149 • WHAT YOU ARE TO HAND IN The write–up that you are to hand in will consist of your answers to the questions posed in this handout. The questions that you are to answer are denoted by the symbol for the MAIA program, shown to the right. Your instructor will announce the due date for handing in your write–up. • VIEWING AN IMAGE USING MAIA FIRST MAKE SURE THE COMPUTER IS TURNED ON! Start up the MAIA program by double–clicking on its icon. Once the program has started up, you will see a display at the top of the screen as shown below. Now move the mouse until the cursor is over the word File. Hold the mouse button down, and keep holding it down as you move the mouse so that the cursor is over the phrase Open FITS..., as shown in the picture to the right. (FITS is an acronym for Flexible Image Transport System, which is the astronomical community’s standard means of storing images and data.) Then release the mouse button (this is called “selecting” the command Open FITS...). You will now see a box on the screen which lists various files. Point the cursor to the one labelled Solar Images and click the mouse button (this will highlight the phrase Solar Images). In the same way use the mouse to click the button labeled Open. You will see a list of all the available images of the Sun, which are labelled by the date on which the image was recorded. In this exercise you will look at four or more images of the Sun made on different days. Select the first image you want to study by clicking the mouse button to highlight it. (Don’t be boring and simply choose the first image in the list!) Again use the mouse to click on the Open button. After 20 to 30 seconds you will see a new window on the screen showing an image of the Sun. The image will probably not be centered on the computer screen, however. To see the image properly, point the cursor to the title at the top of the image window, hold down the mouse button, and move the mouse to the left. This will “drag” the entire window to the left. Keep moving the window until you can see the “zoom box” at the upper right of the window, as shown here. Then release the mouse button. Point the cursor to the zoom box and click the mouse button. This will cause the image window to fill the screen of your computer’s monitor. “zoom box” The entire image is larger than the monitor screen. You can view different parts of the image by using the scroll bars at the bottom and right edges of the window. Use these to center the Sun in the field of view. Repeat these steps for each of the images of the Sun that you study in this exercise. • MEASURING SUNSPOT POSITIONS ON THE FACE OF THE SUN You should see one or more sunspots in each image. To get a better idea of whether there are sunspots near or in a bright region, you may need to “zoom in” on the image of the Sun by using the Zoom In command in the Display menu, as shown here. If needed, you can use this command several times, and you can use the Zoom Out command as well. On the image you’re looking at, locate a sunspot. IMPORTANT HINT: If you can, choose a sunspot on the LEFT–HAND SIDE of the image. You’re going to track the position of this sunspot over several days, and the sunspot will move from left to right across the face of the Sun — if you choose a sunspot that’s too close 150 to the right–hand edge of the image, over a few days it may move to the back side of the Sun and be lost from view. Move the mouse to center the crosshairs on the sunspot you’ve chosen. The display at the top of the window tells you the coordinates of the crosshairs, as shown on the next page. The coordinates are measured from the top left of the image. The first number tells you how many pixels to the RIGHT of this corner the crosshairs is located, and the second number tells you how many pixels BELOW this corner the crosshairs is located. “value” of the pixel under the crosshairs (a measure of the brightness): in this case, 66.00 coordinates of crosshairs: in this case, (101, 73) 101 pixels to the right 73 pixels down RECORD THE COORDINATES of the sunspot in the table on the next page, along with the DATE of the image and the TIME shown in the image. (The time shown is “UT” or “Universal Time,” formerly known as “Greenwich Mean Time” because it was measured at the Royal Observatory in Greenwich, England. Universal Time is used by astronomers because it is a standard that makes no reference to the time zone of the observatory at which the image was recorded.) Then use the Open FITS... command in the File menu to open up the next day’s image, and record the coordinates of the same sunspot (which will have moved to the right). Each sunspot is larger than one pixel across, so try to record the coordinates of the same point on the sunspot for each image (say, the center or one edge of the sunspot). In addition, record the DIAMETER OF THE SUN (in pixels) in the image. Use the mouse to point the crosshairs to the extreme left–hand edge of the Sun. Then, holding the mouse button down, move the crosshairs to the extreme right–hand edge of the Sun. Then release the mouse button. This process draws a horizontal line on the image, connecting the points where the crosshairs began and ended its journey. To determine the distance between the beginning and end of the line, select the command Separation... in the Analysis menu, as shown below. When you do this, a data window will appear telling you the distance between these two points (in pixels). In this example, the two points are 85.00 pixels apart. (The other data shown isn’t relevant for the task at hand.) 151 You can get rid of the data window by clicking the mouse on the OK button, and you can get rid of the line you drew on the image by clicking the mouse anywhere in the image. REPEAT THE ABOVE STEPS until you have measurements of the Sun for at least four consecutive dates. QUESTION 1: Record your raw data: Date: Time (UT): # of pixels RIGHT: # of pixels DOWN: Diameter of Sun (pixels): Image 1 _________ _________ _________ _________ _________ Image 2 _________ _________ _________ _________ _________ Image 3 _________ _________ _________ _________ _________ Image 4 _________ _________ _________ _________ _________ (If you feel motivated, make measurements for more than four consecutive dates.) IMPORTANT NOTE: You may find that after opening a few images, MAIA gives you an error message saying that it doesn’t have enough memory to continue. If this happens, just close one of the images from which you’ve already taken measurements. To do this, click the mouse on the window you want to close, then use the Close command in the File menu. QUESTION 2: In each image, the north pole of the Sun is at the top of the image. Does the sunspot move across the face of the Sun from east to west, or from west to east? Explain how you selected your answer. QUESTION 3: Since sunspots are fairly large, they appear as more than one pixel across in your image. Estimate your uncertainty in picking exactly the same spot on the sunspot from one image to the next. That is, by how many pixels (+ or –) do you think your measurements could have potentially been in error? • CHANGING COORDINATES The sunspot positions you’ve recorded are measured from the upper left corner of the image. However, for the next step in the analysis, we need to measure coordinates from the CENTER of the image of the Sun. Here’s how to convert the coordinates. The pixel numbers in each image run from (0, 0) at the upper left corner to (511, 511) at the lower right corner. Therefore the center of the image, which coincides with the center of the image of the Sun, is at (255.5, 255.5). We’ll use the coordinates x and y to refer to the position of the sunspot relative to the center of the image of the Sun. In terms of the “# of pixels RIGHT” and “# of pixels DOWN” that you recorded in your answer to Question 1, the coordinates x and y are x = (# of pixels RIGHT) – 255.5, 152 y = 255.5 – (# of pixels DOWN). QUESTION 4: The sketch below shows the pixel numbers for each corner of an image and for the center of an image. For each of the labelled points, convert the pixel coordinates using the formulas given above for x and y. On a copy of the sketch below, label each of the corners and the center with its x and y coordinates. (0,0) y (511,0) (255.5,255.5) (0,511) x (511,511) QUESTION 5: Using the raw data that you recorded in Question 1, calculate the x and y coordinates of the sunspot in each image. Record these in the table below. Date: Time (UT): x–coordinate: y–coordinate: Diameter of Sun (pixels): Image 1 _________ _________ _________ _________ _________ Image 2 _________ _________ _________ _________ _________ Image 3 _________ _________ _________ _________ _________ Image 4 _________ _________ _________ _________ _________ (If you made measurements for more than four dates, calculate the x and y coordinates for these dates as well.) • TRANSLATING FROM FLAT IMAGES TO THE SPHERICAL SUN Now comes the (only slightly) tricky part! The images you have been looking at are two–dimensional: they are projections of a round object (the Sun) onto a flat plane. When we observe the motion of a feature going around the sphere of the Sun on such a flat image, we may get the wrong idea about how fast the feature is moving. In particular, when a sunspot is near the edge of the Sun, it will appear in our two–dimensional images to be moving more slowly than when it is near the center of the Sun’s disk. For this reason, we have to translate the motion we observe on the flat image to what is really happening on the spherical surface of the Sun. On a flat plane, like our images, it’s most convenient to express the position of a point in terms of its x and y coordinates. But on the surface of a sphere, it’s most convenient to express the position of a point in terms of two angles. One angle describes how far north or south of the equator the point lies, and the other angle describes how far east or west the point lies. This is how geographers and navigators describe positions on the Earth’s surface: the first (north–south) angle is called “latitude,” and the second (east–west) angle is called “longitude.” As the Sun rotates, it carries sunspots with it, so that the east–west angle of a sunspot changes. So to study the motion of a sunspot across the face of the Sun, we need only keep track of this east–west angle. (Sunspots move very little over the surface of the Sun, so a sunspot won’t move appreciably to the north or 153 south.) We’ll call the east–west angle φ (the Greek letter “phi”). The definition of φ is shown in the figure below. View of Sun as seen from Earth View of Sun from above Sun’s north pole N Sunspot N φ Negative φ in this hemisphere Positive φ in this hemisphere To Earth Note that φ is positive for positions in the right–hand hemisphere of the Sun (as seen from Earth), and φ is negative for positions in the left–hand hemisphere. A position at the center of an image of the Sun is at φ = 0. In order to translate the sunspot coordinates x and y that we observe in our two–dimensional images to the angle φ, we first need to know the radius of the Sun (in pixels). QUESTION 6: For each image from which you made measurements, find the radius of the Sun (in pixels) by dividing the diameter by 2. Record your answers in the table below. Image 1 Date: _________ Time (UT): _________ R = Radius of Sun (pixels): _________ Image 2 _________ _________ _________ Image 3 _________ _________ _________ Image 4 _________ _________ _________ (If you made measurements for more than four dates, calculate the radius for these dates as well.) To find the angle φ of a sunspot, use the following formula: x R 2 − x2 − y2 . −1 φ = tan 154 In this formula, R is the radius of the Sun (in pixels) that you found in Question 6, and x and y are the coordinates of the sunspot that you found in Question 5. The function is the square root, and the function tan–1 is the “inverse tangent function.” When using this function, make sure that your calculator is configured to give you an answer in degrees. If you’re not sure how to do this, look in the manual for your calculator, or check with your instructor. QUESTION 7: Using the above expression for φ, the data you recorded in Question 5, and the radius R you found in Question 6, find the coordinates of the sunspot on the Sun’s spherical surface for each image. Record these in the table below. Date: Time (UT): x (pixels): y (pixels): R (pixels): Image 1 Image 2 Image 3 Image 4 _________ _________ _________ _________ _________ _________ _________ _________ _________ _________ _________ _________ _________ _________ _________ _________ _________ _________ _________ _________ R2 – x2 – y2 (pixels) : x : R 2 – x2 – y2 φ (degrees): _________ _________ _________ _________ _________ _________ _________ _________ _________ _________ _________ _________ (If you made measurements for more than four dates, calculate r, Θ, and φ for these dates as well.) QUESTION 8: The relevant quantity for measuring the rotation rate of the Sun is the change in the coordinate φ. Using your calculations in Question 7, find the change in φ between each image and the one that precedes it, and also find the elapsed time between images. When calculating the elapsed time, remember that the times are expressed using a 24–hour clock, and express your answer in hours. For instance, if the elapsed time is 23 25 hours and 25 minutes, you would first express this as 23 hours = 25.42 hours. Record your results in the 60 table below. φ2 – φ1 (degrees): φ3 – φ2 (degrees): φ4 – φ3 (degrees): _________ _________ _________ T2 – T1 (hours): _________ T3 – T2 (hours): _________ T4 – T3 (hours): _________ (If you made measurements for more than four dates, calculate the change in φ and the elapsed time for these dates as well.) QUESTION 9: Convert the elapsed times in Question 8 from hours to days: ( T3 – T2 (days) = T3 – T2 (hours) × ( T4 – T3 (days) = T4 – T3 (hours) × ( T2 – T1 (days) = T2 – T1 (hours) × 1 day 24 hours ) = _________ ) = _________ ) = _________ 1 day 24 hours 1 day 24 hours (If you made measurements for more than four dates, convert the corresponding elapsed times as well.) 155 QUESTION 10: Using the results of Questions 8 and 9, calculate the rotation rate of the sunspot using the (change in angle φ, in degrees) formula (rotation rate) = . For example, the rotation rate (elapsed time, in days) φ – φ1 . Then take the AVERAGE of the three between the first image and the second image is equal to 2 T2 – T1 rotation rates. φ2 – φ1 (degrees per day) : _________ T2 – T1 φ3 – φ2 (degrees per day) : _________ T3 – T2 φ4 – φ3 (degrees per day) : _________ T4 – T3 AVERAGE rotation rate (degrees per day): _________ (If you made measurements for more than four dates, calculate the rotation rate for these dates as well, and include them in your average.) QUESTION 11: Convert your average rotation rate from Question 10, which is in degrees per day, into rotations per day: (Number of degrees per day) × ( 1 rotation 360 deg rees ) = ______________ rotations per day. QUESTION 12: Finally, take the reciprocal of the result of Question 11 to find the number of days per rotation. This is the rotation period of the Sun! 1 = ______________ days per rotation. (Number of rotations per day) QUESTION 13: According to your astronomy textbook, what is the rotation period of the Sun’s equator? How does this compare to the answer you found in Question 12? (If your answer agrees to within a couple of days, you’re doing just fine. For instance, your answer may be different because your sunspot was not precisely at the equator.) • ANALYSIS QUESTION 14: On the average, about how many pixels did you find that a sunspot moved in a day? QUESTION 15: In Question 2, you estimated your uncertainty in picking exactly the same spot on the sunspot from one image to the next. What percent of the daily change in position of a sunspot (from Question 14) is your error in picking the same point on that sunspot (from Question 2)? QUESTION 16: Do you think that your uncertainty in measuring the coordinates of the sunspot in each image affected your estimates of the rotation rates? Why or why not? • QUITTING THE MAIA PROGRAM When you are done with using MAIA, select the command Quit in the File menu. • FOR FURTHER INVESTIGATION The Sun is the closest star to the Earth; the next closest star, Alpha Centauri, is about 4.3 light years away. (One light year is around 9 trillion kilometers.) If the images you’ve seen of the Sun have intrigued you, you may wish to study more about the Sun. Here are just a very few ideas for you to investigate: • The relation between sunspots, flares, and magnetic storms on Earth; 156 • The solar corona, solar wind, and the aurora that is seen at high latitudes on Earth; • The production of energy in the Sun by thermonuclear reactions; • Heat transport in the Sun from the core to the surface, by radiation and convection; • Helioseismology: studying the interior structure of the Sun with acoustic waves that travel throughout the Sun like earthquake waves do on Earth; • The mission of the space probe Ulysses, which traveled beyond Jupiter and is returning to the Sun in a polar orbit; • The X–ray Sun: what we can learn about the Sun by observing it in the “light” of X–ray photons; • The life cycle of the Sun: What is its ultimate fate? How long will it last? Will it ever become a black hole? 157 Appendix A SAMPLE RESEARCH PROJECT OBSERVATIONS OF SN1993J The following is a paper by an undergraduate physics student at UCSB. The student utilized the Remote Access Astronomy Project and Robotic Telescope to undertake a study of Supernova 1993J complete with UBVRI light curves and analysis. 158 Supernova Search In the Virgo Cluster Shea Lovan Background Of the many phases of stellar evolution, perhaps the most spectacular is the supernova. These fall into the Type I and Type II supernovae. Type I are caused when excess matter is accumulated by a white dwarf star, normally taken from a larger companion star. This increase in mass eventually heats the star enough to ignite carbon burning. In more massive stars, the stellar envelope provides enough pressure to keep this burning under control. On the white dwarf, carbon burning soon becomes a runaway reaction, which will culminate in an explosion that reaches an absolute magnitude of -19. Type II supernovae are created by a different mechanism. In this case a high mass star (more than three solar masses) exhausts the fuel in its core. The shells surrounding the core burn outward creating heavier elements. These eventually fall into the core increasing its density. Normally the core is supported by degenerate electron pressure. As the density increases, eventually the electron pressure fails and the core collapses. It stops when the core becomes neutronium that is almost entirely incompressible. The stellar envelope rebounds when it hits this incompressible core. This creates a shock wave that expands outward, blowing off the envelope in an explosion that normally reaches an absolute magnitude of -17. In either case, the progenitor star normally becomes a neutron star or white dwarf in the center of a planetary nebula. Experiment and Equipment This project consisted of two parts; the observation of the supernova 1993J and a search for new supernovae. SN1993J is a Type II supernova in one of the spiral arms of NGC 3031 (Messier Catalog number 81) that exploded March 28, 1993. It provided a bright (maximum magnitude of 11.5) example which could be followed during the entire quarter. The main thrust of the quarter, however, was a search for new supernovae. The best approach to this was a systematic survey of galaxies, then compare the new images with older, high resolution plates. This time of year, the Virgo Cluster is visible for most of the night providing hundreds of galaxies bright enough to observe. An acceptable rate of occurrence for supernovae is one supernova per galaxy per century. If pictures of 100 galaxies could be collected and analyzed during a three month period, there should be a 33% chance of detecting a new supernova. The next problem was to determine what length of exposure to use. The system being used consists of a 14" reflector telescope with a 1.63:1 field expander coupled with a 576x384 pixel CCD 159 (Charged Coupled Device). Empirical tests for the read noise, dark current, and system efficiency yielded: Nr = 6.37e e− I dc = 6.141 sec − Qe = 0.02 Furthermore, it was necessary to determine the sky background flux for the region. Unfortunately, the telescope is in a poor location. The FBMax = 0146 . γ cm2 arcsec2 sec FBMin = 0.025 γ cm arc sec 2 sec background flux varied greatly based on the telescope's orientation. In order to determine an optimum integration time, both the best case and worst case scenarios were considered. These values are given in the 2 equations at right. At first, a signal-to-noise ratio of 300 was explored. The Virgo Cluster is approximately 5x10⁷ light years away and 7x10⁶ light years in diameter. These distances provide photon counts of: FII Near = 20.1 γ cm2 sec FII Far = 15.5 γ cm2 sec for Type II supernovae and: FI Near = 105 γ cm 2 sec FI Far = 811 . γ cm2 sec for Type I supernovae. S = N F ⋅ A ⋅ QEε ⋅ τ N + ( F ⋅ A ⋅ QE ε + IDC + FB ⋅ A ⋅ QE ε ⋅ Ω)τ 2 R Signal to Noise SN Type I I I I II II II II Background Flux Good Bad Good Bad Good Bad Good Bad Distance (Mly) 50 50 57 57 50 50 57 57 Exposure (sec) 44 50 58 68 263 443 358 662 Exposure Lengths Necessary to Provide S/N=300 Under Various Conditions As the table above indicates, it is not feasible to collect images with a signal-to-noise ratio of 300. With this telescope, a 45 second exposure is the best compromise between S/N and tracking problems. This yields a signal-to-noise ratio of 78 under the worst conditions while it gives a maximum of 300. Using this exposure, it should be possible to collect 20 images per evening or observe the target list of 120 galaxies three times during the quarter. 160 Experiment and Collected Data The observation of supernova 1993J went smoothly. In order to get a better idea of what was happening in the supernova, the images were gathered through I, R, V, and B filters (corresponding to infrared, red, green, and blue spectra). Performing photometry on the data showed that the light curve behaved, in general, as expected. These light curves are included in Appendix A. Unfortunately, our data started too late to include the double peak reported after the supernova's first seven days. One aspect of the observation of note is the result of using a CCD with the B-band filter (notice the large error bars in the plot with that filter). While the 45 second exposure was long enough for the longer wavelengths, the quantum efficiency drops rapidly in the blue. In order to counter this, several images were added together to get a longer, effective integration time. Only the last point was evaluated using this technique, but it shows the improvement in quality clearly. The data on the supernova has one other flaw, these magnitudes are not correct. There were no stars in the immediate vicinity of the target with well observed magnitudes in all of the spectra. Therefore, a nonvariable star in the frame with the supernova was used as a reference star with constant magnitude in all bands. This allowed the light curves to be generated, but it is not possible to analyze them with respect to each other (i.e. determining color indices). The search for new supernovae did not proceed as smoothly as expected. The largest problem stemmed from a lack of foresight. The telescope sits with a five story building to the west. By the end of the quarter the Virgo Cluster was only observable for two hours before transiting the zenith and being obscured by the building's lights. The other mistake was to underestimate the time required to find and image the galaxies. While they were chosen for large angular sizes and magnitudes of not higher that 12.5, it took a significant amount of time to align the telescope. Also, the aforementioned building has a timer controlled ventilation system. At intervals during the night this system would engage and cause the telescope to oscillate. This oscillation varied from a slight blurring to enough to change the scope's alignment. Each time this occurred the exposure would have to be retaken. Rather than the projected rate of 20 galaxies per session, only five to twelve galaxies per evening were collected. Out of the target list of 120 galaxies, only 37 were actually imaged; and of these pictures, only 12 were imaged twice. One other factor slowed the experiment. By its nature, a CCD is more responsive to longer wavelengths (red and green) than to the shorter ones (blue and violet). However, this is exactly the opposite of the response of photographic plates. When the CCD images were compared, it was common to find an object registering as 14th magnitude where nothing was visible on the plates, which went through 16th. These objects did not fit the profile of asteroids, artificial satellites, or anything else local. However, when viewed under a V-band filter, the objects vanished. This led to a conclusion that the objects were large, luminous, red stars (red giants or supergiants) in the arms of the galaxies, not supernovae. Conclusion 161 Clearly, this supernova search fell short of its goals. The small amount of data collected made it very unlikely that a new supernova would be observed, and none were. However, two positive things came from the data collection process. First, it was shown that this telescope system is capable of conducting this sort of project, once it is in a better location. Secondly, CCD astronomy provides a very good tool for selecting stars likely to become Type II supernovae. This is most likely to occur during one of the blue loops of a red supergiant. By comparing CCD images to reference photographic plates, it would be possible to compile a catalog of stars likely to become supernovae. While the lifetime of the stars could still be millions of years, this type of catalog should provide a starting point for other supernova searches. References Lubin, Philip, Physics 134 Lectures: Spring quarter, University of California, Santa Barbara, 1993. Peale, Stanton, Physics 133 Lectures: Winter quarter, University of California, Santa Barbara, 1993. Schwarzschild, Martin, Structure and Evolution of the Stars, Princeton University Press, Princeton, 1958. 162 163 Appendix B TECHNICAL INFORMATION The following is information pertaining to the technical nature of the telescope. The Remote Observation Telescope (ROT) is capable of recording high quality images with a theoretical dark sky sensitivity of 18th - 20th magnitude. Exposure times are under one minute for 18th magnitude, depending on the sky conditions (signal/noise ratio) of a particular night. Some typical objects that can be studied with this system are asteroids, binary and variable stars, galaxies, novae, and supernovae. Multi-element filter wheels are available for photometry. UBVRI filters, hydrogen lines, and polarizers can be selected for any image. The telescope, itself, is a 14" reflector with the CCD camera, filter wheels, and thermo-electric cooler mounted at the back. The CCD camera is kept at a temperature of about -60° C which limits the thermal noise or "dark current" to about one electron/second under optimum conditions. The filter wheels allow the user to select band passes from 3000 to 10000 Å or polarizing filters. By superimposing images made with different filter combinations, it is possible to produce a color image. 164 165 RAAP Technical Overview Telescope Computer Controlled Celestron C-14 Aperture Size: 14 inches Image Size: 15.4 arcmin x 10.2 arcmin Photometrics Star I CCD Camera Array Size: 576x384 Operating Temp.: -45 F Readout Noise: ~12 eDark Current: ~1 e-/second Weather Station Davis Weather Monitor Infrared (10 micron) sky opacity sensor Central File Server Intel 486DX2-66 CPU Novell Netware 9 gigabytes disk storage 10 megabit/second Internet connection Telecommunications World Wide Web Server Intel 486DX4-100 CPU OS/2 Warp Go Serve HTTP Server Bulletin Board Service Intel 80386 CPU Supra FaxModem 28.8 Wildcat 4.01 BBS Software Dial Up Internet Line Intel Pentium 90 Microsoft Windows NT Advanced Server 3.51 SupraExpress 288 PnP Modem 166 167 Appendix C PUBLISHED ARTICLES on RAAP The following are articles written or published about the Remote Access Astronomy Project. 168 169 170 171 172 173 174 175 176 177 178 179 180 181