1
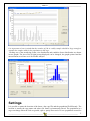
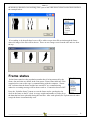
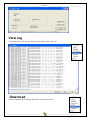
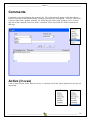
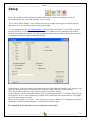
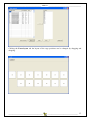
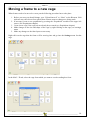
VAKI Biomest Daily Software User manual (English) __________________________________ _________________________________ Software version 3.11 - March 2010 ___________________________________________ Vaki Ltd. ___________________________________________ Vaki Aquaculture Systems Ltd. Akralind 4 IS-201 Kópavogur Iceland Tel. + 354 - 595 3000 Fax. + 354 - 595 3001 e-mail: [email protected] Internet: www.vaki.is ___________________________________ _______________________________ 1 ___________________________________________ Vaki Ltd. ___________________________________________ CONTENT 1. USING THE SOFTWARE ............................................................................................. 3 Data chart .................................................................................................................................................................. 4 Settings ...................................................................................................................................................................... 5 Visual test .................................................................................................................................................................. 7 Frame status .............................................................................................................................................................. 8 View log ..................................................................................................................................................................... 9 Populations ...............................................................................................................................................................10 Setup .........................................................................................................................................................................11 2. WEB-BASED REPORTING PROGRAM .................................................................... 17 ___________________________________ _______________________________ 2 ___________________________________________ Vaki Ltd. ___________________________________________ 1. USING THE SOFTWARE The main screen shows the overview of the farm. All cages are displayed with the cage name and population name for the fish in this cage. Also displayed is the last 3 digits of the MAC address for the wireless sending box for the cage. If there has been a valid sample measured, then the average weight is also shown for each cage. Colours are used to indicate the status. White means there is connection to the frame and the sample is large enough. Yellow indicates there is connection to the frame but the sample is too small to be valid Red indicates there is not a complete connection between the frame, connection box and base station computer. Grey, indicates there is no frame in the cage or the frame has been set to inactive. By right clicking one of the cages, the following box appears. ___________________________________ _______________________________ 3 ___________________________________________ Vaki Ltd. ___________________________________________ Data chart Data chart shows the daily measurements for a selected period, the bars indicate the number of fish measured each day, and the points show the average weight for every day. By clicking on the “Calculate SGR” button the percentage daily growth is calculated for the period. ___________________________________ _______________________________ 4 ___________________________________________ Vaki Ltd. ___________________________________________ It is important to bear in mind that the number of fish in a daily sample should be large enough to consider the sample valid for the population in the cage. Clicking one of the measuring points, size distribution and condition factor distribution are shown in two graphs. The size of the weight groups displayed can be changed, the graphs printed and the measurement saved into excel for further analysis. Settings It is possible to name the location of the frame, (the cage ID) and the population ID differently. The location is usually the cage name and where the frame is permanently placed. The population in a cage can change when the fish are graded, split or partly harvested or a new population created for ___________________________________ _______________________________ 5 ___________________________________________ Vaki Ltd. ___________________________________________ the cage. The population can be selected for each cage using the “Fish population” drop down menu listing all populations available. (See Populations section for creating new populations) Tick the “Active” box to activate the frame in the Location indicated. The measurements from the frame in this location will be sent to the database for the population indentified. The shape and size of the cages can be adjusted. Choose between round or square cages of different sizes, all according to the layout of your site. ___________________________________ _______________________________ 6 ___________________________________________ Vaki Ltd. ___________________________________________ The MAC addresses are unique for each connection box and are set in the radio network (see below). The Minimum and maximum weight settings exclude all fish outside these limits from the weight calculations. Visual test (System check) A visual test is used for checking that the 3 infrared LED arrays in the frame are operational and functioning. The check will also identify if something is blocking any or part of the diode arrays. If ___________________________________ _______________________________ 7 ___________________________________________ Vaki Ltd. ___________________________________________ the diodes are blocked or not working, then a part of the white boxes below become black similar to the example below. If everything is ok then all three boxes will be white except when fish swim through the frame where an image of the fish will be shown. There are two images seen from the side and one from the top. Frame status In the frame status box the population number that is being measured by the frame, date and time are shown in the first square. Frame status indicates if the connection box out on the cage is communicating with the computer. “Frame OK” indicates that the frame and the base station PC are communicating otherwise a warning message will be shown such as “Connection box not OK”. Press the “Initialize frame” button to reset the frame and to synchronise the clock in the frame to the PC clock. Average weight and number of fish refer to the data that has been uploaded during the last hour. After each upload (See Upload interval under setup) the frame is automatically reset. ___________________________________ _______________________________ 8 ___________________________________________ Vaki Ltd. ___________________________________________ View log To display the log file for each download from the frame to the PC Download Used to manually download the data from the frame to the PC ___________________________________ _______________________________ 9 ___________________________________________ Vaki Ltd. ___________________________________________ Comments Comments can be stored during the growth cycle. The comments will appear on the data chart in Biomest 3000 and in the Biomass Daily reporting system growth trend graph. This may include the removal of the frame, grading, splitting, etc. Select the type (harvesting, grading, starve or other) and date of the comment, write text in the "Comment" field. Also listed are all the comments for this cage. . Active (In use) Used to inactivate the frame when not in use or reactivate the frame when deployed in the cage for measuring. ___________________________________ _______________________________ 10 ___________________________________________ Vaki Ltd. ___________________________________________ Populations Use the Population button to register new populations and new cages. It is important that the MAC address is corresponds to the correct wireless sending box connected to the frame. Here you can administer the cages, create new locations (cages) and populations and link the correct population to every cage. Add new population when needed, e.g. when grading, splitting or harvested from one population. ___________________________________ _______________________________ 11 ___________________________________________ Vaki Ltd. ___________________________________________ Setup Here it is possible to set the upload interval for data transfer from the sending box to the PC. Recommended to use 1 hour and typically, Com 1 is used. If you select "Show all data" (view all data) the average weights of the cages are displayed even when there are very low fish numbers in the measurement. It is recommended to use www.biomassdaily.com for analysis of the data. It is possible to choose between the MAC or IP address, most systems use MAC address as the communication method between the sending box and PC. It is also possible to choose between salmon and trout, since there is a difference between weight calculation formula. Radio network is used to connect each connection box to the right cage number in the software. By pressing “Reset Net” all the connection boxes send their MAC addresses to the computer. Then it is possible to link each cage location to the correct MAC address. By pressing the “Check connection" button, the LQI (Link Quality Index) is refreshed. The LQI can be between 0 and 127 and indicates the strength of the signal from the connection box. The higher the index, the stronger the signal. Below 20 the signal is too weak. , this could be too great a distance or misalignment between sending box and base station antennae or and obstruction of the signal. ICA should be 0, if 1 then there is not a connection to the frame. ___________________________________ _______________________________ 12 ___________________________________________ Vaki Ltd. ___________________________________________ Clicking the Farm layout tab the layout of the cage positions can be changed by dragging and dropping. ___________________________________ _______________________________ 13 ___________________________________________ Vaki Ltd. ___________________________________________ Moving a frame to a new cage When frames need to be moved to a new pen the following procedure has to take place. 1. Before you start you should change your “Upload interval” to “None” as the Biomest 3000 software may close down if an upload from a frame starts as changes are being made. 2. If necessary create a new population by pressing the “Population” module in the upper left corner. (See Populations chapter) 3. Create a new cage if the cage has not already been created (see Populations chapter) 4. Make changes to the size and shape of the cage by right clicking on the cage (see settings) menu 5. Make any changes to the farm layout as necessary Right click on the cage that the frame will be moving into and go into the Settings menu for that cage. In the MAC / IP tab, select the cage from which you want to use the sending box from. ___________________________________ _______________________________ 14 ___________________________________________ Vaki Ltd. ___________________________________________ Activate the new cage making sure that the original cage location for the frame is not active. . 1. It is very important to check the MAC address (last three digits shown in blue in each cage on the image above) match between the new cage and the actual sending box out on that cage. 2. Close and restart application since cage and population are stored in the program itself 3. Right click on the original cage who had the farm and under Settings MAC / IP you have to manually delete the MAC address so it does not exist in two places in the system 4. Under Setup and radio network check the connection LQI (Line Quality Index) and Reset net to establish the search for all the MAC addresses from the sending boxes. 5. Close and restart the Biomest 3000 application ___________________________________ _______________________________ 15 ___________________________________________ Vaki Ltd. ___________________________________________ Restarting the sending box On top of the black box (next to the cable plug) are three diodes, the green tells us there is power on the box, the red that it is in contact with the base and at the yellow / orange flashes when data is transferred to the base / PC. The orange button turns on and off the modem (black box) This is the power supply, green light if it is powered from 230V Internal wireless antennae The gray / silver box shows the status of the battery. Green light indicates there is 230V supply, Yellow is the status of the battery; Red indicates that the voltage is too low and the battery must be charged. 12V Battery ___________________________________ _______________________________ 16 ___________________________________________ Vaki Ltd. ___________________________________________ 2. WEB-BASED REPORTING PROGRAM Main Screen The main screen for each system indicates the current status of all the frames in addition to the average weight and number of fish measured from each cage. The overview of the farm shows all the cages and uses three colors for reporting the status. White indicates the frame is active and more than 200 fish are in the measurement. Yellow indicates that the sample is to small to be valid for the population (below 200 fish) Red indicates that there has been no data sent from the site for that cage within last 72 hours. In each box is Population ID Average Weight Number of fish in the sample The time since the last fish was measured Visibility check that tells of the frame diodes are blocked and to be cleaned. Connection status indicated is contact between the sending box on cage and PC base station. ___________________________________ _______________________________ 17 ___________________________________________ Vaki Ltd. ___________________________________________ The system automatically displays the Alarm if there is something wrong with Visibility or Connection. The most common reasons for alarm in the Connection status is power problems on cage supplying the sending box. If there is no connection with the sending box (Alarm on Connection) the status of the Visibility is indicated as Unknown. If the Connection is OK but Visibility has ALARM that the frame must be cleaned. When the status has changed (the frame has been cleaned or contact restored) the alarm disappears automatically and the status is shown as OK. It is also possible to manually remove the alarm, press ALARM and write a comment and clear alarm. There are also two other alarms in the system, these displays Site Connection which indicates that the PC on the base is switched on and has is in contact with the Internet. The second is Bio3000 status which indicates that the measurement program on the base PC is running. These alarms are also automatic, but again it is also possible to manually delete the alarm. ___________________________________ _______________________________ 18 Graphical overview On the main screen, press the "Click here for graph view" to display the daily measurements of average weight and number of fish measured every day in all cages over the past 4 weeks. In addition calculated daily % growth (SGR = Specific Growth Rate). It may be interesting to compare at a glance, the growth and number of fish over a certain period of time, and to look at the estimated SGR again for comparisons over time. Clicking on one of cages in the main screen or the graphical overview gives a detailed view of that cage. The following is a typical graph for 30 days. The bars show the number of fish per day and each point in the blue line is the average weight on that day. The green line shows the average condition factor for each day. Placing the mouse over a point or bar on the graph will show the value If the number of fish per day is less than 200 the daily point is shown gray. Today's measurement is always gray as it is not completed before until midnight. __________________________________ _________________________________ Software version 3.11 - March 2010 ___________________________________________ Vaki Ltd. ___________________________________________ Below is the growth trend shown over a longer period. Calculation of daily growth (SGR = Specific Growth Rate) By the use of Biomass Daily Select “Yes” to show the daily growth. has the Select the date range (Start and End Date.) opportunity to Click View Report calculate the first real growth over a specified The SGR line is the best fit line through all period. When the valid measurement points. used all SGR = daily growth over the chosen period. measurements over selected time and then subtracted the best line through all the daily measurements. It is only taken into account the blue dots (more than 200 fish a day) when the best line is calculated. It is important to take into account the number of fish measured per day since, as the calculations are based on a larger sample, the better they become. Below is how the daily growth is calculated for the selected period. ___________________________________ _______________________________ 1 Calculation of biological feed factor (bFCR) Biological feed factor is based on measured growth, the number of fish and the amount of feed used during the time period. There are many factors that can affect the calculations and it is important that the measurements are accurate with a large number of fish measured each day. Low numbers of fish measured can lead to greater fluctuations in the measurements and reduce the quality of the calculations. Below is how the biological feed factor is calculated for a selected period. To calculate the biological feed conversion ratio input the average number of fish in the cage during this period. This would be the number of fish at the start of the period less half the losses during the period (morts) Then press View Report Control bar In all screens the control bar can be shown or hidden using the double chevrons In the control bar using the Farm tab you can choose between sites within the same company. The Start Date and End Date buttons select the time interval to be displayed on the trend graph. Remember to press the View Report at the top right to display the new data. Use the Show SGR and SGR Start Date End Dates options to view the SGR. __________________________________ _________________________________ Software version 3.11 - March 2009 ___________________________________________ Vaki Ltd. ___________________________________________ Population selects the cage to be viewed. Note: Only populations who have valid measurements in the selected date range are displayed in the drop down list. Choosing a longer date range will increase the number of populations in the drop down list. Select Yes in the Show CF tab to display the condition factor on the graph. Use SW allows a pre set starvation weight to be displayed instead of live weight. Note: This function needs to be activated specifically for each company. It is important to use the Min Weight and Max Weight settings to ensure that the sample reflects the fish population you wish to measure. E.g. To prevent populations of other species having an effect on the average weight. In the report the number of fish that are excluded from the measurement are shown (see section below). Total number of fish in the cage (Population size) and feed consumption (Feed Mass.) are used for the calculation of the feed factor (see above). The bottom bar contains functions to: Scroll to the next page, Enlarge the screen, Find text in the report Export data in another format (pdf, excel, word, html, tiff ...). There are also buttons for "refresh" and printing. ___________________________________ _______________________________ 1 ___________________________________________ Vaki Ltd. ___________________________________________ Automatic reporting Under "New Subscription" it is possible to subscribe to automatic status reports via e-mail. Click the "New Subscription" and the following menu will open. Type in the e-mail address and press "Select Schedule" to select when the report will be sent automatically to selected e-mail. Select how often automatically report to be sent to selected e-mail. ___________________________________ _______________________________ 2 ___________________________________________ Vaki Ltd. ___________________________________________ Comments By clicking on one of the bars (which shows the number of fish per day) it is possible to write comments on this selected date, for example to indicate, grading, splitting, starve, slaughter, removal of the frame, service, etc. The comments appear as a blue note, place the mouse on the column to read the comment. ___________________________________ _______________________________ 3 ___________________________________________ Vaki Ltd. ___________________________________________ Size Distribution Clicking one of the blue measurement points in the trend graph will open the size distribution and condition factor report for the selected day. In this report the distribution of size and condition factor of live or gutted fish, is shown both graphically and in table form. ___________________________________ _______________________________ 4 ___________________________________________ Vaki Ltd. ___________________________________________ Input the number of fish in the cage (Population Size), insert the lower weight limit ("Min Weight" to exclude small fish such as pollock and wrasse from the sample) and use "Gutting Factor" to re calculate the weight of gutted fish. Remember to press "View Report". "Min / Max Weight" and "Min / Max CF" are used to exclude fish or fish-like shadows which may cause a measurement under or over these limits. Min weight is the most important to be aware of since young fish, pollock and wrasse can have a major impact on the average weight of a large fish population if they swim in large quantities through the frame. Max weight, and min / max CF are used to exclude the few cases where the fish-like shadows that can occur when two fish swim at the same time through the frame and the shadow is not automatically discarded. "Bin Size" is selected to set the weight groups on the X-axis, "Gutting Factor" is used to calculate the gutted weight "Population Size" is the number of fish in the cage to calculate the total biomass and the biomass in each weight group. Remember to press the "View Report" for changes. "Use SW" must be activated by Vaki IT specialists for each user, this is to display starved weight instead of live weight. Below is an example of a report made by the Export button. ___________________________________ _______________________________ 5 ___________________________________________ Vaki Ltd. ___________________________________________ Note the settings that are the preconditions for the report. "Excluded fish" is the number of fish discarded from the sample due to. Min / max weight and min / max CF. ___________________________________ _______________________________ 6