1
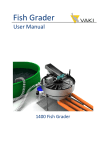
Version: March 2014
Biomass Daily System Manual
VAKI Aquaculture Systems Ltd.
Akralind 4
IS-201 Kópavogur
Iceland
Tel. +354 - 595 3000
Fax. +354 - 595 3001
e-mail: [email protected]
Internet: www.vaki.is
Biomass Daily System Manual
CONTENTS
1.
INSTALLATION INSTRUCTIONS .................................................................................... 4
1.1 The Frame ........................................................................................................................................................................ 5
1.2 Setting up the frame in a sea cage .................................................................................................................................... 5
1.3 Remote Box...................................................................................................................................................................... 6
1.4 Base antenne ................................................................................................................................................................... 8
1.5 PC ..................................................................................................................................................................................... 8
1.6 Risk assessment according to Nytek Regulation for Fish Escapes ..................................................................................... 8
1.7 Operation and maintenance of frame: ............................................................................................................................. 9
1.8 Restarting the older type of Remote Box ............................................................................................................................. 9
2.
USE OF THE PROGRAM ............................................................................................. 10
2.1 Web chart (Link to Biomass Daily website)..................................................................................................................... 11
2.2 Data graph ..................................................................................................................................................................... 11
2.3 Voltage ........................................................................................................................................................................... 13
2.4 Settings .......................................................................................................................................................................... 13
2.5 Visual test ...................................................................................................................................................................... 15
2.6 Frame status .................................................................................................................................................................. 15
2.7 Download....................................................................................................................................................................... 16
2.8 Comments ...................................................................................................................................................................... 16
1.9
Active ...................................................................................................................................................................... 16
2.10 Setup ............................................................................................................................................................................ 17
2.11 Farm Layout ................................................................................................................................................................. 17
2.12 Cages ............................................................................................................................................................................ 18
2.13 Populations .................................................................................................................................................................. 18
2.14 Communications .......................................................................................................................................................... 19
2.15 Farm ............................................................................................................................................................................. 19
2.16 Directories.................................................................................................................................................................... 19
3.
WEB-BASED REPORTING PROGRAM /WWW.BIOMASSDAILY.COM ........................... 20
3.1. User Dashboard ............................................................................................................................................................ 20
3.2. Trend Graph All Cages ................................................................................................................................................... 21
3.3. Distributions ................................................................................................................................................................. 23
3.4. Monthly Summary ........................................................................................................................................................ 25
3.5. Weight & Time Chart ..................................................................................................................................................... 27
3.6. Custom Trend Graph ..................................................................................................................................................... 28
3.7. Create Subscription ....................................................................................................................................................... 30
3.8. Benchmarking ............................................................................................................................................................... 30
Biomass Daily System Manual
VAKI Aquaculture Systems Ltd. thank you for choosing the Biomass Daily size estimation and fish growth
monitoring system.
Accurate knowledge of the average weight, size distribution and growth trends of fish in each cage are
vital for improved profitability in today’s fiercely competitive environment.
Increasingly more companies in the aquaculture industry are employing Biomass Daily in management
of their daily operations and production control.
Biomass Daily has been developed in collaboration with some of the world's leading fish farms, and is
used for the size measurement of salmon (Atlantic and Pacific), trout, cod, tilapia and halibut.
VAKI are continuously working on the development for more fish species e.g. sea bream and
incorporating additional features such as automatic feed conversion trends and bench marking.
The measuring frame has a grid of LED´s that transmit infrared light beams in both the horizontal and
vertical plane. When fish swim through the frame the grid is broken and an image of the measured fish
is produced. Software measures the length and height of the fish images, which is then used to calculate
the weight.
The first part of this guide will provide an introduction and set up of the hardware and the Bio3000
program used to gather the fish weights and maintain the hardware.
The final chapter on using the online reporting system www.biomasssdaily.com where the fish data and
measurements is presented.
Biomass Daily System Manual
1. Installation Instructions
To ensure the best possible results it is important that the equipment is set correctly with the
requirements of each individual site but essentially the procedure should be as described below.
Although the installation is simple we recommend that a VAKI trained technician carries out installation.
Please contact VAKI to offer any advice or assistance on installation if required.
Biomass Daily System Manual
1.1 The Frame
The frame is largely pre assembled directly from VAKI. The bracket used for attaching the hanging ropes
must be assembled on to the frame. You will need a 10mm Allen key and shifting spanner and ensure
the plain plastic washer is mounted between the 2 triangles.
1.2 Setting up the frame in a sea cage
Layout Diagram:
The figure below left shows the frame placement looking down on the cage with a recommended
distance from the net side wall around 3 m to ensure the frame does to become caught on the net. The
frame should be positioned so as the main current /tide will pass through the frame. In this picture, the
main current would be right to left.
The dotted line indicates a tow rope/line to be able handle/pull in the frame once in the water.
The centre diagram shows the side view with the water surface dotted and the hanging ropes from the
railing and down to the frame.
The diagram on the right shows the frame with the tube in the hanging bracket to thread the rope
through.
For optimal placement of the frame fish depth, swimming patterns and current direction must be taken
into account.
It is important that the opening in the frame is positioned across the fish swimming direction so that fish
will naturally swim through the opening.
The tow line can also be used to track frame depth.
Biomass Daily System Manual
The Main Cable is connected to the frame before placing in the water, use silicone grease inside the
connector to protect the connection pins and screw the connector firmly by hand.
To protect against damage to the connector, frame and cable attach the strain relief rope fixed on the
cable to the eyelet on the frame.
1.3 Remote Box
The Remote Box is mounted on the cage using a suitable mounting pole and
should be positioned pointing toward the base antenna.
Ensure the cable gland for the power cable is screwed firmly to avoid leaks into
the Remote Box.
The Remote Box has an internal 12v battery and requires to be supplied with
220/240v external power.
The Remote Box is delivered with the internal battery disconnected; the
battery must be re connected before the Remote Box can be used.
The main power cable must be connected to the AC / DC internal power supply
unit inside the Remote Box. The VAKI main cable connects the frame to the
Remote Box. Use the integrated strain relief on the cable to prevent damage to
the connector.
Once everything is connected correctly, the green light should be illuminated on the AC / DC box and
check the 3 LEDs on the R.H.S. of the front panel should indicate green AC Power on, Red to show
contact with the base , and flashing Orange light when there is activity (data transmission) between box
and base.
AC/DC
Power Supply
12V Battery
Connection for the VAKI cable
to the frame
220V AC power in thru cable gland
AC power in
Cable to Scanner
Biomass Daily System Manual
Green light
Battery power
ON
Orange light
Bulk charge
Green light
Float charge
Green light
AC power ON
Red light
linked
Orange light
Active
Red light
Battery fault
Battery power on:
Bulk charge:
Float charge:
Battery fault:
AC power on:
Linked:
Active:
Power is supplied to Scanner.
Battery is being charged.
Battery is fully charged.
Battery is dead (replace?)
AC power is applied to the unit, Transmitter is ON.
Unit is connected to a Base in the area.
Unit is communicating with a Base.
Biomass Daily System Manual
1.4 Base antenne
The Base Antenna should be mounted in a suitable
location on the feeding barge or at shore base.
It is important to position the antennae for good
uninterrupted contact with the Remote Boxes
mounted on the cages.
To improve the signal strength it may be beneficial
to place the antenna in an elevated position or on
the roof.
The base cable runs from the antennae to the
base connection box.
The base box should also be connected to mains
power and the Biomass Daily PC included with the
system.
1.5 PC
The PC is delivered from VAKI should only be used as a management tool for the Biomass Daily system
and to enter the biomass daily online website.
It is important that the PC has good internet connection for data transfer without interference. The base
connection box is connected to the serial port on the Biomass Daily PC with the cable supplied.
All VAKI software to run Biomass Daily is pre installed but please contact VAKI. (Tel No. in PC pop up
screen on start up) when using the system for the first time, and one of our technicians will then enable
establish the system connection to the VAKI Biomass Daily online database.
When moving the equipment to a new site the same procedures apply.
1.6 Risk assessment according to Nytek Regulation for Fish Escapes
VAKI does not consider the base and Remote Box to be equipment that in any way may result in risk of
fish escapes, so we concentrate on the assessment of the frame.
In recent years significant design changes have been made in the frames to minimize wear on the net.
Bolts were replaced with rounded lens screws and protruding edges on the steel hanging frame
removed.
It is important to ensure that the frame is not in contact with the net wall, as over time this may lead to
weakening of the net material and at worst tears or holes.
Also make sure that the frame does not catch on the net wall when raising and lowering the frame into
the cage.
Beyond the dangers mentioned above, only if the frame is dropped down into the net can there be any
danger of escapes. However considering that the frame is secured with both with hanging and tow
ropes as well as the main cable to prevent this, we consider the risk to be small.
Biomass Daily System Manual
1.7 Operation and maintenance of frame:
To guard against any accident, it is recommended that you always have two people handling the frame
together. The frame should be cleaned regularly to prevent fouling.
Store the frame safely and securely until reinstalled in the cage when the frame is temporarily removed
from the cage (e.g. net cleaning, treatments, etc.) and please also make a note in the comments
function in Bio300 or online in Biomassdaily.com.
Check regularly for signs of wear on the rope and cable.
To prevent corrosion and connection issues please regularly use silicon grease on all cable connections.
1.8 Restarting the older type of Remote Box
There are 3 LED´s on the top of the black modem box (next to the cable connector) Green indicates
power to the modem , Red that these is contact with the base and Yellow / Orange flashes when data
is transmitted between base and Remote Box.
This is the power supply, green light indicates
powered by 230V.
The orange button turns power on and off the
black box, try turning it off and on again.
.
The gray / silver battery charger unit shows the
status of the battery. Green light should
illuminate if there is contact with 230V, yellow
lights show the status of the battery charge,
red light is a warning that the voltage is too low
and the battery needs to be re charged.
Biomass Daily System Manual
2. Use of the program
The main screen shows an overview of the site.
All cages are displayed with the names of the cages and last three digits of the MAC address of the
Remote Box (small numbers in parenthesis) are shown on the first line.
The population ID´s are the capital letters in the middle line the bottom number is the measured
average weight for each cages based on the number of fish that have been approved.
Five colours are used to indicate the status of
the frame additionally there can be
descriptive text above the frame e.g. (frame
not ok, frame blocked etc.):
White indicates that there is contact with the
frame and there is an acceptable number of
fish in the sample.
Yellow indicates that there is contact with the
frame but number in the sample is too small
Red is a warning that there is no contact to
the Remote Box at the cage
Pink is a warning that there is no contact to
the frame.
Gray indicates an empty cage without a frame
or the frame has been made inactive.
Biomass Daily System Manual
Right - clicking on the cages, shows the following menu.
2.1 Web chart (Link to Biomass Daily website)
Web chart
Provides a direct link to www.biomassdaily.com
Enter your username and password to log in to the website and use all
available reports. For more information go to the “Web Based Reporting” in
this user manual.
2.2 Data graph
Data graph shows the daily measurements
for the selected time period, the bars
show number of fish measured daily, and
the points show the measured average
weight. Select the time period to be
displayed and temperature to show the
daily temps gathered by the sensor in the
frame.
Biomass Daily System Manual
It is important to remember that the number of fish
in the sample each day must be large enough to be
representative of the entire population.
Clicking on one of the daily measurements will
display both the size and C-factor distribution
graphs. It is possible to save these individual
measurements in Excel for further analysis and to
print the graphs.
Data analysis is used to determine the statistical
reliability of the sampling.
Showing the time of day and number of fish
measured at these times.
It also shows if there is wide variation in the size
and whether there is a difference in average weight
throughout the day versus average weight
measured over four hour period.
Moving Average graph shows the weight and time of each fish measured. Each point represents a fish
with the horizontal axis shows the date and time and vertical axis gives the fish weight. This graph can
be useful to show effective placement of the frame and the time of day most of the fish are being
measured.
.
It is possible to use the mouse to zoom in on the graph. Hold down the mouse button and drag it to the
right. To zoom back hold down the mouse button and drag the left.
Biomass Daily System Manual
2.3 Voltage
This graph shows the voltage of the
battery in the Remote Box. The battery
will charge when 220V power is
connected to the Remote Box. The
battery can power Remote Box for 16
hours before it needs recharging.
2.4 Settings
The cages (location) and populations
must have different name.
Cages (locations) where the frames are
located are given a name / number. The
Population may change when the fish
are split or sorted or part-harvested. It is
possible to create a new population and
select from a list of populations for any
cage.
Shape and size of cages can be selected.
MAC address is specific to each Remote Box, the
correct Mac address must be selected for each cage
/location. This is the location the computer system
user to separate the information from the different
frames.
Biomass Daily System Manual
Minimum and maximum weight excludes all fish
outside these limits from the data chart.
It set minimum and maximum weight of 3-dimensional
graph that appears in a separate program.
If the cages are equipped with winch frame, then
select the MAC address of the winch control box here.
Biomass Daily System Manual
2.5 Visual test
A visual test is used to check whether all infrared LEDs in the chassis are operational and working or if
there is something blocking the diodes for example growth and algae on the scanner plates. If any of the
diodes are blocked then it will appear in the white boxes as black lines.
If everything is in order then all three boxes are shown white. Above to the left is the shadow image of a
fish swimming through the frame, two images from the side and one from the top. On the right hand
picture the frame is blocked and needs to be washed. It is important not leave the Visibility on as it will
block the data sending from the frames.
2.6 Frame status
Status of the frame is shown in box below. Population ID is shown on the top left
and the date / time in the frame. The Number of fish is the number of fish
measurements currently in the frame.
Frame status messages:
• "Frame OK" tells us that everything is fine and the frame can "talk" to your PC.
• "Low sample" means that there are too few fish measured but functionally everything is in order.
• "Clean frame" the frame is blocked and needs cleaning.
• "Connection box NOT OK" means that there is no connection between the Base PC and Remote Box.
See also the section on troubleshooting.
• "Frame NOT OK" means that there is contact between the PC and send the box, but not to the frame.
It can mean a problem with cable or the frame itself.
"Initialize frame" resets the frame and synchs the frame clock with the time/date on Base PC.
Biomass Daily System Manual
If you do not have contact with the frame try to initialize. "Get frame status" updates the status in the
"frame status". Last uploaded shows the time /date when the last data was sent from the Remote Box
to Base PC.
For the frames with built in temperature sensor the frame status shows temperature. Voltage shows the
voltage of the battery in the Remote Box. "Frame depth" displays the current depth for the latest
frames with built depth gauge. Serial number is the unique frame identification code.
2.7 Download
Used for manually downloading data from the Remote Box to Base PC.
2.8 Comments
It is useful to record comments which may be relevant to the measurements. This may include noting
the removal of the frame, sorting, splitting, starve, treatments, etc. Select Type (harvesting, sorting,
starve) and the date of comment, enter text in the "Comment" box. The list of all comments is shown
for this population.
1.9 Active
Used to activate the frame, when the frame is not in use should be set to inactive.
Biomass Daily System Manual
2.10 Setup
In this section you will find settings that apply to the entire system.
"Radio network" shows all active Remote
Boxes their connection strength and the
cage ID they are linked to.
"Reset net" to refresh the list.
"Check connection” refreshes the LQI (Link
Quality Index) which indicates the strength
of signal from each Remote Box. Higher
index indicates a stronger signal. Below 20
then it is too low, then the distance between
the sending and the receiving antenna box
be too long or that they are not pointing in
towards each others.
ICA should be 0, 1 indicates then there is no
contact with the Remote Box.
2.11 Farm Layout
Use the "Farm layout" to set up the position
of the cages as desired.
Biomass Daily System Manual
2.12 Cages
Use the "Cages" button to register the new cages into the system. It is essential that the MAC address
(communication number on each transmission box) is connected to the correct cage in the Bio 3000
program.
2.13 Populations
Use "Populations" button to create and register new populations.
Biomass Daily System Manual
2.14 Communications
Here you choose how often data is
transmitted from the transmitting box to the
PC, it is recommended to set to 1 hour.
Select the Com port for connection with
Base PC. Typically, Com 1 is used.
2.15 Farm
Here you can select the Fish Farm name that
will use the equipment. When moving sites
you must notify so we can connect properly
set up the Biomass Daily database. "Global
position" is used to log the correct
sunrise/sunset in the 3D graphs.
2.16 Directories
Here you select the where 3D files
will be stored and Dropbox location.
Biomass Daily System Manual
3. Web-based reporting program /www.biomassdaily.com
Biomass Daily is a unique tool that provides the user with accurate information on the average weight,
size distribution, growth rate and general condition in all cages with minimal effort.
However, it is important to be able to read and interpret the data for best results. This manual provides
an introduction to how the Biomass Daily online reporting system is used. Remember that all settings
and changes that you make in the program will in no way change the original data stored on the
Biomass Daily server, no data is deleted or changed.
3.1. User Dashboard
The login from www.biomassdaily.com opens the main dashboard showing the status of all frames at all
fish farm sites for the company, in addition there are quick links to various reports in the system.
Organization displays the name of the mother company.
Farm shows the name of the site with active measurement frames in the Biomass Daily network.
Clicking on the blue coloured name to open the report will be used to the greatest extent, "Trend Graph
All Cages".
Reports displays icons for the main reports "Trend Graph All Cages", "Weight & Time Chart", "Custom
Trend Graph", "Distributions", "Site Dashboard" and "Monthly Summary".
Under Populations three colours show the status of all frames active at the site.
• White : the frame is active and more than 200 fish have been approved in the sample
• Yellow : too few fish measured, less than 200 fish in the sample
• Red : The online web application has not received any fish for at least 72 hours but the frame is still
active
Biomass Daily System Manual
3.2. Trend Graph All Cages
This report shows the daily weights and growth in all cages over a selected time period. Browse through
all the cages use the scroll bar on the right. View Report button to bring up the report after any changes
made to the parameters settings.
Number of Days: number of days the displayed in the graph with the End Date the last day in the graph.
Min Weight excludes any fish the selected size from the calculation of average weights, can be used if to
exclude non target fish e.g. Pollock, wrasse which may pull down the average weight. Max Weight can
be used to exclude any measurements not within the accepted limits.
Biomass Daily System Manual
The shaded bars show the number of fish measured by the frame. Points show the average weight for
each day, over 200 fish a day shown blue, less than 200 fish are grey. The green line shows the condition
factor and the red line shows the temperature. The blue squares indicate that there are comments that
day.
Show SGR displays the best line drawn through all the measured fish with the end weight for the line
value shown below the SGR value.
SGR stands for Specific Growth Rate is the percentage of daily growth e.g. 1.75 indicates that the fish
grown 1.75% of their weight per day over the selected period.
Clicking on one of the blue dots opens the size distribution report for that measurement with other
information useful for planning and harvesting. It is of course important to choose a day’s measurement
with that is most representative. See more detail in the next section.
It is also possible to export data from any report, into PDF, Excel, Word, etc...
Note also this little arrow button used to open / close the selection menu.
Biomass Daily System Manual
3.3. Distributions
This report shows details of the size and condition factor of live or gutted fish, both graphically and in
tabular form. Remember to open the selection menu with this little button and press the View Report.
Biomass Daily System Manual
"Min / Max Weight" and "Min / Max CF" can be used to exclude fish or fish-like shadows below or above
these limits. Min weight is most important to be aware of as small fish like Pollock and Wrasse can have
a major impact on the average weight.
These settings can also preclude fish-like shadows formed when two fish swim simultaneously through
the frame and the shadow is not rejected automatically by the algorithm.
"Bin Size" is selected to set the fish size groups shown on the X-axis,
"Population Size" is the number of fish in cages used to estimate total biomass and the biomass in each
size group.
Insert a % Gutting Factor" for the calculation of harvested fish.
Remember to press the "View Report" after changes.
Excluded fish shows how many fish are removed from the sample because of the selected min / max
weight and min / max Cf parameters.
CV: Coefficient of Variation is the standard deviation divided by average weight; a rule of thumb says
that the closer to 0.2 the closer graded the fish. When the CV is above 0.3, the fish sizes are widely
spread.
Use the Export button to print the report in PDF format.
Biomass Daily System Manual
3.4. Monthly Summary
Monthly report shows trend graphs, for 30 and 90 days, and the weight / time graph.
Biomass Daily System Manual
Use Min and Max Weight as previously described. Start Date Short is first date in Graph No. 1 to show a
shorter period, usually around 30 days. Start Date Long's first date in Graph No. 2 for a longer period.
END DATE is the date you want as the end date for both graphs.
Weight and Time Chart shows the size of each fish and the time of day the fish measured. Each blue
coloured point represents one fish and using this graph the swimming patterns of the fish through the
frame can be analysed for optimum frame placement.
Biomass Daily System Manual
3.5. Weight & Time Chart
This graph shows the size and the time of day of each fish measured for all cages.
This chart can also indicate if there is any difference in fish size at different times of the day.
In the example below reveals a high number of Pollock in the cage. The program is easy to correct for
this, just increase the Min weight to 500 gr. and these measurements are excluded.
Biomass Daily System Manual
The following shows how this can affect the daily readings and average weight.
These two graphs are from the same cage, but in the bottom chart the Min weight is set at 500 grams,
you can see how the smaller Pollock reduced the true average weight by 644 grams. Growth trend is
also much smoother.
3.6. Custom Trend Graph
This report can show the Trend Graph for any 2 dates and can be used to calculate biological feed
conversion over a specific period.
Periodic FCR is calculated here based on the measured growth, the number of fish and feed amount
during the period.
There are many factors that can affect the calculations and it is important that the measurements are
good with large numbers of fish measured every day. Low fish numbers can lead to significant
fluctuations in measurements and reduced quality of the data.
Biomass Daily System Manual
The following shows periodic feed conversion ratio calculated for the selected period (Population Size
and Feed Mass numbers are fictitious in this example).
To calculate biological FCR enter the Population as the average number of fish during the period (start
number of fish minus half of the number of dead fish). Be sure to click View Report.
Biomass Daily System Manual
3.7. Create Subscription
It is possible to subscribe to reports to be sent weekly or monthly as PDF attachments to any selected email address. Click the Create Subscription button within the report and the following appears.
Enter the recipients e-mail address, for multiple email addresses use a semi-colon ; between the
addresses.
We recommend you choose weekly e-mail for The "Trend Graph All Cages" and "Weight & Time Chart"
and monthly report for "Monthly Summary"). The reports are sent as PDF attachments and each email
includes a link to cancel the subscription e.g. the site is harvested.
3.8. Benchmarking
It is possible to compare the growth any population to all similar measurements in Biomass Daily
database with the corresponding fish size. Click on the SGR and End Weight with the mouse button to
open the window for the comparison.
Biomass Daily System Manual
Below is the comparison of the SGR lines that have an average weight + / - 10% from our end 2.953g on
a 60 day trend line. You can further filter the results to the same month. In this case, there are1400, 60day trend lines in the database with an end weight between 2.658 and 3.248 g 69% of which have lower
SGR than our 0.76.
3.9. Comments
By clicking on one of the columns showing the number of fish per day, it is possible to insert a comment
on the selected date, for example by sorting, splitting, starving, harvesting, moving frame, servicing, etc.
The comments will appear as a blue diamond mark on the trend graphs, read the comment by moving
the mouse over the column.
.
Error
No connection to remote box
I can contact the Remote Box but frame status
shows Remote Box not ok
I get the message
that frame connection not ok
Possible cause
No power to the remote box
2
Line of sight between Remote Box and the base
receiver is blocked
3
Base not connected
4
Cannot establish the issue with Remote Box
1
Not enough power in the battery inside the
Remote box
2
Remote Box has stalled/frozen
3
Cannot establish the issue with Remote Box
1
Not enough power in battery in Remote Box
2
Remote Box has stalled/frozen
Contact VAKI
Turn power off and on again to frame and remote box , use the reset button on
the remote box , once this is done press frame status and see if it has changed
As for point 1
3
Cable error
Test frame with a known good cable from another cage
4
Frame error
Connect cable and remote box to a good frame in another cage
5
Cannot establish the issue
The frame is dirty or something is
located inside the frame and blocks the view
Contact VAKI
Take the frame out of the water and wash it thoroughly. When you put it out
again make sure it is not placed close to wrasse hide
Re connect the power supply to the frame and the remote box, use the reset
button on the remote box
1
The frame is cleaned and still shows
" blocked "
1
frame has frozen/stalled
3
There is something wrong with software on your
frame
There is something wrong with your frame
1
The frame can be dirty without alarm given
2
2
3
Fish are swimming through the frame but all
measurements are discarded
Check the mains power is connected, check the power unit and the battery
state and that sending unit /modem is powered correctly. Once this is done go to
the radio network and press the reset net and then check connection
Check the LQI index in the Radio Network.
Ensure there is a clear view between Remote Box and base, if the base is located
indoors, curtains, blinds etc might disrupt the transmission
Go to radio network and press initialize base
1
Frame blocked
No error messages but the frame does not
measure any fish
Action
1
2
3
The frame can be positioned incorrectly in the
cage
I see on the camera and the visual test that fish
passes through the frame but nothing is
registered
The frame can be dirty without alarm given
There is something wrong with the settings in Bio
3000
There is something wrong with your frame
Contact VAKI
Check that the power to the Remote Box is connected and that all lamps
in Remote Box light are as they should, if not then
reset box and un plug the power supply off and on again
As for point 1
Contact VAKI
Contact VAKI
Use visual test and see if you get a clear picture of all three routes , if all looks
alright go to step 2
Try to place the frame in the swimming pattern of the fish and at a depth where
there are a lot of fish
Contact VAKI
Use Visual test and see if you get the clear picture of all three routes, if you
see unusual images this is normally dirt
Go to settings and check that Min weight, CF and species is set up
Contact VAKI
33 | S i d e