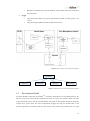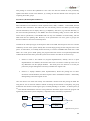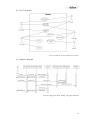
1
University of St Andrews CS3099 Software Team Project: Group 5 Gregory Bigwood (gjb4) Duncan Fowler (df15) Angus Macdonald (adm15) Ewan Summers (es54) 1. Abstract The stock market is a fast paced environment through which trading may be conducted from anywhere provided a market maker can be contacted. We were asked to create a portfolio management system allowing users to manage their own shares and providing market making facilities for them and for the other groups taking part in the project. We developed a user interface that allows the users to buy and sell shares distributed amongst the project groups, where each user had a persistent account within our system. The system was designed to be easy to use for new traders. We built a fully functional system that we believe fulfils the customers‟ requirements, and gives good insight into the development of commercial portfolio management systems. 2. Declaration We declare that the material submitted for assessment is our own work except where credit is explicitly given to others by citation or acknowledgement. This work was performed during the current academic year except where otherwise stated. The main text of this project report is words 22,413 words long, including project specification and plan. In submitting this project report to the University of St Andrews, we give permission for it to be made available for use in accordance with the regulations of the University Library. We also give permission for the title and abstract to be published and for copies of the report to be made and supplied at cost to any bona fide library or research worker, and to be made available on the World Wide Web. We retain the copyright in this work. Gregory Bigwood (gjb4) Duncan Fowler (df15) Angus Macdonald (adm15) Ewan Summers (es54) 2 Contents 1. 2. 3. Abstract ..................................................................................................................................... 2 Declaration................................................................................................................................ 2 Introduction .............................................................................................................................. 5 3.1. The Team .............................................................................................................................. 5 3.2. The Task ................................................................................................................................ 5 3.3. Aims of Report ...................................................................................................................... 6 4. Context Survey ......................................................................................................................... 8 5. Project Details ........................................................................................................................ 10 5.1. Development Model ............................................................................................................ 11 5.2. Standards Meetings ............................................................................................................. 13 5.3. Design Decisions ................................................................................................................. 14 5.4. Design Overview ................................................................................................................. 14 5.4.1. User Interface ...................................................................................................................... 15 5.4.2. User Management System (UMS)....................................................................................... 19 5.4.3. Financial Data Centre .......................................................................................................... 21 5.4.4. Database .............................................................................................................................. 26 5.4.5. Logger ................................................................................................................................. 28 5.5. Security ............................................................................................................................... 29 5.6. Allocation of Tasks ............................................................................................................. 31 5.7. Novel Features .................................................................................................................... 33 6. Testing ..................................................................................................................................... 34 6.1. General Testing ................................................................................................................... 34 6.2. TUP Testing ........................................................................................................................ 35 6.3. Robustness Testing .............................................................................................................. 35 7. Evaluation ............................................................................................................................... 38 7.1. Project Evaluation ............................................................................................................... 39 7.2. Integration Test ................................................................................................................... 39 7.3. Objectives ............................................................................................................................ 40 7.4. Requirements....................................................................................................................... 42 7.5. Design Decisions ................................................................................................................. 44 7.6. Comparison With Other Groups.......................................................................................... 45 7.7. Comparison With the Public Domain .................................................................................. 45 8. Conclusions ............................................................................................................................. 47 8.1. Achievements of Team........................................................................................................ 47 8.2. Future Direction of Work .................................................................................................... 48 User Management System (UMS) ..................................................................................................... 48 User Interface (Flash) ........................................................................................................................ 49 Database (Java / mySQL) .................................................................................................................. 49 9. Bibliography ........................................................................................................................... 50 10. Appendices .............................................................................................................................. 51 3 List of Figures Figure 1: Relationship between user and market maker. ........................................................................ 5 Figure 2: Group Communication Model ................................................................................................. 6 Figure 3: Abstraction of Model from Users ............................................................................................ 6 Figure 4: System structure split into logical components ...................................................................... 11 Figure 5: Graphical Overview of Threaded System Operation. ............................................................ 11 Figure 6: Spiral Model Diagram ........................................................................................................... 12 Figure 7: Sectors as allocated to groups. ............................................................................................... 13 Figure 8: State and server interaction model. ........................................................................................ 16 Figure 9: Method for sorting shares. ..................................................................................................... 18 Figure 10: Parsing Process. ................................................................................................................... 22 Figure 11: Proposed Query Request Structure (i) ................................................................................. 23 Figure 12: Proposed Query Request Structure (ii) ................................................................................ 23 Figure 13: Solution to Buffer Problem .................................................................................................. 24 Figure 14: Data flow for query requests. ............................................................................................... 25 Figure 15: Abstraction of VSTM from UMS, in buy requests .............................................................. 25 Figure 16: Interfaces with Databases .................................................................................................... 26 Figure 17: Database Schema ................................................................................................................. 27 Figure 18: Data flow through the logging package. .............................................................................. 28 Figure 19: Flow of control within attack programs. .............................................................................. 38 4 3. Introduction This report represents the body of work completed as part of the software team project, and combines previously published documents [1] [2] [3] with expanded detail and conclusions. 3.1. The Team We, group five, chose to name ourselves „Defero‟ – Latin for communication – as we feel this aptly conveys the aims of the project, and the attributes that are needed for a successful team. 3.2. The Task “Stock exchanges exist to provide the facilities of a marketplace where potential investors can put their money to work by purchasing securities and those who already own securities can equally, freely and speedily turn them into cash.” [4] The customer wanted a simulation of trading on a stock market to be created. He appointed five teams to each create independent simulation systems which co-operate to form a virtual stock trading marketplace (VSTM). We envisage this as a network of systems upon which simulated stocks may be traded. Each team is responsible for one of these „systems‟, and acts as a market maker, that is a body that maintains and trades in shares allocated to it by the market. Shares are allocated by sector, which is a grouping approximately describing the operations of a company (for example Tesco is in the Food & Drug Retailers sector). A list of the sectors allocated to each team can be found on page 96. Buy at Offer Price Sell back at Bid Price User Market Maker Figure 1: Relationship between user and market maker. The above illustration shows how users interact with the market maker (individual teams), by buying and selling shares through them. In addition, each team maintains accounts for the users of their system, with teams unaware of users other than their own. Such accounts are called the Clients Stock Portfolio. The stock market is a complex environment that new users could be expected to find difficult to understand. We prioritised a highly usable interface, designed to enable inexperienced users hesitant to deal with real money, or not comfortable with the market procedure. 5 The customer provided a data feed supplying historic stock information, used by the groups to simulate a stock market. This data is updated periodically reflecting changes in stock prices. Initially the customer had the following requirements of the system: Ability to use the provided a data feed, containing historical stock information so that all groups are trading on a liquid market. This can be seen as the ability to buy or sell a stock quickly and in large volume without affecting the stock‟s price. Ability for user accounts, allowing at least one user access to the market via our system. Ability to manage a portfolio containing shares held by the user; a portfolio being a collection of investments held by user(s) to the system. Figures 2 and 3 show how groups are expected to network, with clients abstracted from the VSTM through each groups user interface. 1 1 User Interface 2 5 2 User Interface User Interface 5 3 User Interface 4 4 3 Figure 2: Group Communication Model Figure 3: Abstraction of Model from Users The diagram to the right of the two shows how details of the distributed nature of the market are abstracted away from the user. They are only aware of their interface, and never know which group they‟ve bought or sold shares from – only that it was from within the market. 3.3. Aims of Report This report aims to provide a description of our team strategy to solving the problem, and an analysis of the resultant system. To accomplish this, we have included the following sections; Project details The achievements of the project are discussed within the project details section, along with the main features of the design and justifications for these ideas. Key features are discussed in context of the component they belong to. 6 Testing The testing section covers unit and team level testing, as well as integration testing between all the separate groups. The team conducted robustness testing with every group in the system, including ourselves, during the “final demonstration” at the end of the module. This is also covered in the testing section. Evaluation We conducted a concise evaluation of our system, and this is discussed in the evaluation section. Our implementation is compared to our original objectives to determine whether we accomplished all we intended. We go on to contrast our system with various products discussed in the context survey conducted during the early stages of development. Conclusion Our conclusion summarises what we have learnt and achieved whilst working on the project. Drawbacks of the system are also discussed in order to show where we believe the project could be taken in the future. Appendices The groups previously published documents – the project specification and plan – are included in the appendix. In addition, a maintenance document is included, to aid in any future updating of the system. Also included are the teams User Manual, XML Schema, and other reference documents. The results of a user survey carried out by the team. 7 4. Context Survey This section gives an overview of domain research the team carried out[5] [6] [7] to show what we are going to model, what has been done before, and what areas of the domain can be explored. There are various systems that allow clients to manage their portfolio – we inspected a few such applications, with hope of learning from the strengths and weaknesses of these. 4.1 FINESSE [8] [9] [10] Finesse (Finance Education in a Scalable Software Environment), is an educational tool created for university-level economics students. Finesse simulates real-time stock trading using a computer system to manage a portfolio of stocks and shares. It has a number of sponsors including Reuters who provide a real-time data feed of stock information from the London stock market. By using real stock data as opposed to simulated stock data Finesse makes the trading experience very true to that of a real stock trader. Finesse has been designed to be very scalable as it is used in many different institutions, and in practise can work as well with tens of students as with hundreds of students. There is no minimum number of students that need to be using the system to make a realistic simulation as real data is being used. Finesse uses a web based interface which simplifies deployment and makes it platform independent on the client side. This web based interface has been criticised by developers working with finesse who have found it limits the flexibility for presenting the data. 4.2 Virtual Stock Exchange [11] Virtual Stock Exchange is a web-based stock trading simulator provided by the financial news website MarketWatch.com. Areas of the functionality in marketwatch.com – such as for displaying stock information - are used by the Virtual Stock Exchange. Of particular note is the code to display graphs, which are clear and easy to navigate. The “trading toolbox” provides quick access to buying and selling from any page. In our evaluation of the virtual stock exchange we found the trading procedure to be badly designed. Although the “trade stock” helpfully displays the cash available to buy stocks, it doesn‟t state the current price of the stock being bought; the user has to remember this from the previous screen. 4.3 TSimLite [12] Virtual TSimLite is a Windows-based stock trading simulation program developed by a professional stock trader to help improve his trading. It is a freeware program and uses a free financial data stream from DukasCopy. Having a Windows-based user interface makes it easier to organise data relevant to a transaction onscreen however it is less intuitive interface. Due to the lack of documentation trial and 8 error had to be used to discover the programs functionality. Additionally there were a few bugs in the user interface where prices were displayed behind buttons; not surprising given the complexity of developing such a user interface. 4.4 Summary From our context survey we found that no current stock trading portfolio management systems have provided a user interface we felt was truly intuitive. Web based user interfaces struggled to show all relevant data on a single page; the user often having to swap between pages to find what they require. This highlighted the importance of layout in displaying content. Little user interaction is required in the form of data entry; consequently the layout of the user interface is a driving factor for an intuitive system. However the TSimLite system suffered from similar problems, leading us to conclude that neither system is ideal. The scope of the project limits the depth of our program from areas such as dynamic graphing and advanced transaction types, making it easier to fit relevant information into one page. 9 5. Project Details The system delivered by Defero manages to meet the majority of the system requirements – this section explains the methods used to achieve these goals. Early in the design stage the team decided to focus on a number of core components (as explained in Interim Report, appendix page 76) identified as crucial to the operation of the system. These core components were: Feed Parser – parsing of the data feed provided. Basic Request Handling – enabling the system to communicate with others at inter-group tests. Basic User Interface – a command line interface allowing us to request from ourselves and other groups. Implementation of these components was prioritised over others ensuring a solid foundation for later work. Before designing specific components of the system the group agreed on the global system structure, as illustrated in the project plan (see appendix, page 64). These components were created upon analysis of our objectives and requirements. For reasons of space we can‟t incorporate these here – they can be found in the requirements specification on page 60. The implemented components reflect these requirements: User Interface The interface for the teams‟ portfolio manager; used by users of the system to trade in shares over the market. Financial Data Centre (FDC) o Feed Parser Parses stock data from the feed provided by the customer, and sends to our database. The timing of updates is controlled by a server thread within the FDC. o Request Handler Handles requests made from other groups, and our User Management System. User Management System (UMS) o The interface between the user interface and the rest of the system. This component handles requests from the user interface, performing necessary modifications on the data and routing relevant requests onwards. Database 10 o Handles all communication with the database. This includes both share information and user details. Logger o Logs transactions made by the group and transactions made by other groups to our sectors. o Logs the timing of updates from the feed and their success. Figure 4: System structure split into logical components SystemStartup UpdateServer RequestServer UMS_Server JDBC_Connector Figure 5: Graphical Overview of Threaded System Operation. 5.1. Development Model The team decided to adopt the spiral model [13] of software development (see the diagram below). We felt this system best represented the timescale and targets set out by the customer. While the major project milestones tend to suit the waterfall model, this model of development lacked the flexibility required for a project where the risk of requirements slippage was high. We assumed this, as the customer appeared to be unsure about the exact nature of the product they wanted, and was vague 11 about exact requirement details. The spiral model allowed for this kind of evolutionary development, whilst maintaining the documentation structure of the waterfall model. [3] Figure 6: Spiral Model Diagram "The main difference between the spiral model and other software process models is the explicit recognition of risk in the spiral model." [14] While there were fewer changes to the original specification than anticipated, the spiral model was integral to our success in creating operational prototypes for each inter-group test. Development on the first prototype focussed on the FDC, as this functionality was required for the first TUP1 in week six of the first semester. Following this test the FDC was developed further, adding functionality and improving reliability of the feed parser. Work on the UMS began in earnest prior to the start of the second semester; however this component was not used in any TUP‟s until week 8. Meanwhile the request handling component of the FDC was re-written, improving robustness and adding additional functionality needed for future TUP‟s. Design evolved with each prototype, ensuring a solid foundation for further development 1 Testing of Universal Progress; the name given inter-group tests. 12 5.2. Standards Meetings All groups involved in the project sent a representative to weekly standards meetings. These meetings were designed to create agreement on protocols for communication between groups. Communication out-with meetings was possible via email ([email protected]), but decisions on standards issues could only be made and verified during the meeting. It was agreed that no person could represent his or her group in consecutive meetings. Good, efficient decision making in these meetings was identified as critical to our teams‟ success. As a result the team actively took a lead in decision making, presenting several comprehensive proposals. The XML schema which defines the format of communication was created and maintained by our team. We took note of all schema related issues raised; however we were solely responsible for all significant changes. All schemas were designed with simplicity in mind, to prevent confusion on such a vital area. The schema went through several iterations, gradually adding functionality, with the final version shown in the appendix, 7.10.6. Tow types of requests are specified here. The first, the queryRequest is used to request share details, with the latter tradeRequest used to buy and sell shares within the system. The format for sending XML was a more divisive issue, with our group arguing for the use of TCP over HTTP requests. This decision was justified by the success of inter-group communication in later TUP‟s, and in the final integration test. Groups created a standard list of errors based on the SHEEP system. This concept is explained, and the codes are listed in the appendix, page 89. Following a number of customer meetings it became clear that secure communications were needed. Our team took a lead on this issue, proposing 1024-bit RSA encryption (using SSL). As a result of our research on the topic this was adopted as a standard in a subsequent meeting, and successfully implemented by all groups. Due to mistakes made out-with our control our team were allocated 42 sectors; more than all other groups collectively. 12% 1 12% 2 3 52% 4 12% 5 12% Figure 7: Sectors as allocated to groups. Our implementation was well capable of handling the extra load entailed. 13 Groups made good progress initially, and in order to maintain the goodwill amongst them we offered to bring cakes to the subsequent committee meeting. This proved successful and the practice continued, with groups taking turns to bring the confectionary. By taking an active lead in standards meetings we managed to implement our preferred solution to a number of problems, such as the use of TCP and the format of XML communications. This helped bring about an efficient decision making process. The subsequent success of inter-group communications at the integration test is a testament to this. 5.3. Design Decisions The group allocated tasks, where possible, to group members who had previous experience in each area. This is explained in more detail in the Allocation of Tasks section (see page 31) however the specific design decisions are justified here. The choices of implementation languages were based on the team‟s strengths. The entire team had programmed in Java for over two years, thus it was a clear choice. Other languages such as C were considered, however through discussion it was decided that with Java a more robust and modular system could be created [15] [16]. This is possible through its use of classes – housing functions – and objects, allowing for true object-oriented design. MySQL was selected over PostgeSQL, Oracle or file storage since it provided most of the features we required. As an open source implementation already installed in the lab it was available, and it offered high performance and functionality for simple communication with Java (using JDBC). It was also the only DBMS that team members had experience in, an important factor in our decision, allowing more time to be spent implementing features than learning the language mechanics. We realised from our context survey (page 8) that it would be advantageous to have a web-based user interface. The obvious solution for this would have been PHP, the team had previous experience using Flash MX – meaning a more graphical interface could potentially be made. Although connecting Flash with Java was more challenging than connecting PHP and Java, the team felt that flash was the more adventurous choice, giving us greater control of graphical content. 5.4. Design Overview Design of the aforementioned components began in earnest prior to the start of the second semester. This section summarises the achievements of the project, discussing aspects of particular interest and explaining implementation details deemed interesting. The teams‟ project specification identified the following use case; 14 The user will want to be able to login to the system to trade shares, view their portfolio, and to query share information. The following example gives an idea of how a user might wish to use the system: The user wants to check how their portfolio is performing. They login to their account and view a list of shares they own, with relevant details. Wanting to know more about a particular share they choose to view expanded information on it. Having looked at the data shown they decide they want to sell all their shares in the given company. Having sold these shares the user wishes to buy some more in a different company. They query the shares available over the VSTM to find one of relevant interest to them. Later, having found a share they wish to purchase they are able to buy the share. This is then added to their portfolio. This will be used as an example throughout this section, highlighting the functionality and purpose of each module used. Our fictional user will be called Alice. 5.4.1. User Interface The Flash MX developing environment is primarily designed towards movie design or animation. It includes the ActionScript scripting language. Underlying Design As mentioned previously, Flash MX is geared towards producing movies. Graphical user interfaces have multitudes of states which are changed based on user interaction. A movie has two states – playing and not playing. Thus to use flash as a GUI we must build a state based system. This was implemented by making specific frames in the main timeline states, and by using control between states by calling ActionScript library movie functions. To halt on a specific state we again call a movie function to stop the main timeline. Although we now have strict state control, we used persistent elements by allowing that element to span across the frames. This keeps one instance of elements such as backgrounds that should exist in every state. This creates a consistency across the whole interface by allowing features such as changeable colour schemes. By breaking the ActionScript into functions code can be found quickly, and is better formatted. 15 Tomcat server 1001 1003 6001 4 2003 2004 3001 2001 Login Portfolio Options Logout Search Failed login Sell selection Buy Fail Sell Main menu Search results Buy Success Buy selection Buy Fail Buy Success Legend 1234 Communication with state code 1234 Forced transition All states are connected to the main menu state apart from the login state Transition by user interaction Figure 8: State and server interaction model. Graphical Design The graphical design of the Flash GUI was aimed to make any user instantly comfortable with the layout. The original design stemmed from the login screen of mandrake Linux, with a lighter coloured pane on top of a darker one. As versions progressed, a bar was added to the top to indicate which section the user was in. In the final version this area has been used to display the logo and the indicating text was moved to light coloured panel, giving it a more prominent position on the page. To avoid making the interface confusing simple buttons were used for a number of in-page buttons, similar to Windows where Okay and Cancel buttons are simple boxes. In contrast the main menu buttons are highly graphical, so as to make common tasks instantly recognisable. Again this is an attempt to make a user comfortable with the system through their previous experiences with modern operating systems interfaces. When hovering over these menu buttons a small movie is played. This gives indication to what this button does (the portfolio button looks like a folder, and when hover over occurs the folder opens), and it uses functionality in flash that is difficult to achieve with say, a Java implementation. The team followed a number of HCI principles including the “golden rules” by Schneiderman [17]. Most of these rules were applied during development, but these rules in particular were consulted throughout development: 16 1. Consistency – Colours, the main menu, text style and screen layout are consistent through the states. 2. Offer Informative Feedback – Buy and sell requests display a message whether or not the request was successful. 3. Reduce Short Term Memory Load – The main menu has only five menu items; at the low end of the 7 2 band used as guide to the number of items a user should deal with at a time. Additionally when a confirm window appears the back and forward buttons temporary disappear to reduce the number of buttons on the entire page, further reducing confusion. 4. Allow Reversal of Actions – when a share is selected in the buy or sell screen a back button exists to return to the previous page. Additionally when the confirm window appears the user can close this window by clicking the top right x or by the cancel button. Additional design principles [18] [19] used included: 1. Colour association – Red was used to cancel things and logouts whereas green was used for forwarding actions. 2. Quick logout – the logout button is always present in the main menu Communication Communication between the interface and the rest of the system is achieved through a Tomcat server. The Flash is embedded in html which is viewed in a secure HTTP environment. This ensures that data passed between Flash and Tomcat is secure. Data is sent by the post method to the tomcat server URL which then forwards the data. A listener is set up to act upon data sent from tomcat, which has been URL encoded. As the reply is placed in another object, variables can be accessed using specific notation. For example if name=5& was sent from tomcat myreturnvars.name would give the value 5. ActionScript needs to be told what to take from each LoadVars object. To resolve this, state codes are sent from the Flash to the UMS and variables are sent by comma separation. For example the code of the shares is sent as: code=firstcode,secondcode,thirdcode…&. The team wrote a method to convert the data from comma separated to an array of strings that could then be indexed into to display, or act on the data. Design Issues Our initial method of communication was unfortunately unsuitable for sending large amounts of data (flash has a fixed buffer size of two-thousand – we required twenty-six thousand), but the team iterated on our initial design and found a solution. The solution was simple; another state was created to request the number of 2000 requests to make. Then using a loop we make all the requests – using the looping count as an index into an array on the UMS side. Each request is then stored in a matrix. By making 17 use of the function to convert comma separated data to an array we can concatenate the resultant array with the matrix – making use of Flash‟s loose typing system. Unfortunately there is no easy way to make Flash “wait” for the end of the transmission. Using a while loop for this will simply cause the Flash to crash, as does recursion, as due to a bottleneck of 256 levels of this solution. The solution was to set an interval and then display the results this period had elapsed. Such an interval can only be hardwired, making it problematic and potentially causing information be cut off if the network and/or server are under heavy load. The team chose an interval that was successful in displaying all share details during the demonstration, while the lab (including our server) was attacked by our security program. The ideal solution to this problem, given enough time, would be to essentially use the UMS to make the Flash wait. This would be achieved by a new state request to the UMS which would not complete until the other requests were finished. On reply of this new request we would then display the full results. Another issue that was tackled was with sorting data when displayed in the matrix – the table showing the results of queries. When we request all shares for example, the first share to be displayed is placed in the first index of the matrix. Data is then taken from this structure and placed in the table, in the same order as the array, so when a user clicks on the share or “row”, the row number is used to index into the matrix and show that share in detail. This solution works until data in the table is sorted (for example, by sector name). Instead of trying to deal with a demanding mapping between the matrix index for that share and the row number, or sorting the matrix according to how the table is sorted, an alternative approach is used. Upon clicking, the row number is retrieved, and from this row number the script gets the share code for that row. Then, by looping, we can find the index for the matrix that contains this unique share code. Thus we can index into the correct portion of the matrix to retrieve the specific share details, independent of how the data is visually sorted. Data is displayed A share is selected Share 1 Share 2 Share 2 Share 3 Share 3 Row number found Share 1 The row number is collected and used to look up the share code from the datagrid Sort Share 4 Share 4 Share 5 Share 6 Share 6 Share 5 Share code of selected share Search for the share code in all the share elements in the global structure Use the index to display all the details of the chosen share. Shares can now be displayed no matter how they are sorted. [ [a,2,7],[b,3,4],[c,8,4]... ] Index Return the position of this share in the global structure Figure 9: Method for sorting shares. 18 Walkthrough Beginning our example, Alice wishes to login to view her portfolio. On pressing the login button the password function is called which uses a method to send an object to UMS. A listener function is activated to wait for a reply. If the reply is positive Alice has will be forwarded to her portfolio page. Otherwise an error message will be displayed on the login screen to show login has failed. Upon entering the portfolio page ActionScript is called to request portfolio details of this user. This involves sending another request to the UMS. Upon receipt of the reply the URL encoded reply to arrays. These are then used to populate the table which displays the share details. Alice can sell some of her shares by clicking on the sell button on the main menu at the bottom of the page. On pressing this button Alice is forwarded to a new portfolio view, allowing her to select a share to sell. Once selected, Alice is forwarded to the sell share page, which uses another table to display the full details of the share. Assuming Alice has selected the correct share she can now enter the number of shares she wishes to sell, and press the next button which will produce a confirm window. If Alice is happy with this trade she can click the submit button; otherwise she can close the window by the cancel button or by pressing the cross in the top right of the window. On pressing submit a function is called which again sends the data to the UMS and waits for a reply. 5.4.2. User Management System (UMS) As the example of Alice shows, the UMS links the user interface with the rest of the system. It allows the user-interface to interact with the VSTM and the database (both through the FDC), providing the functionality required to allow the end user to utilize the system to manage their portfolio. The UMS performs relevant operations on the data as it passes through this section, formatting and performing necessary calculations, such as comparing an accounts balance to the cost of a requested transaction. In this example this involves either forbidding the transaction or informing the user-account database control classes of the required update to make, followed by sending the request to the FDC. Connections The user-interface and the UMS exchange URL-encoded data; the servlet encodes the data and sends it to the interface via a TCP connection. Every time the user-interface needs to send data to the system the servlet is run, connecting to a new thread on the UMS. The lifetime of such a thread is the length of time it takes to receive the request and return a response, before it is automatically garbage collected. This allows a variable number of users to use the system at any one point, but as a result of this implementation only active users need to have running threads, freeing up system resources. 19 This component connects to the FDC (for making requests) through a single factory class invocation, making communication a simple process. The FDC replies in an XML format, meaning the UMS has to reformat into URL encoded data to be sent to the user interface. The connection to the user-account database interface is done via method invocation. The UMS calls the methods of the control class when it needs access to the database. This takes the form of adding data to the database or retrieving data stored within the database. The UMS has no direct access to the data or the user-account database itself, thereby abstracting away from the idea of a database entirely a design decision that allowed for a more modular structure, benefiting the team if problems occurred on a particular component. Structure The UMS is built around a switch-statement within the statemachine class. When a message is received from the user interface the statemachine class is invoked. The message from the user-interface contains a state number, as well as various fields and parameters. Depending on the state, different fields and parameters will be present in the message from the user-interface. The statemachine reads the state from the input, and then takes appropriate action, for example when in the “login” state the data sent from the user interface also contains a username and password. The username and password are forwarded to the database control class and the return value of this call is an integer that is returned to the user-interface. The user-interface interprets this value to decide what action to take next. The UMS was created without any persistent values between invocations, thus removing a lot of the state management required – a decision team felt this would make the system simpler and easy to expand. All the state information comes from the user interface, in an effort to distribute processing and to reduce server load. Servlet The user-interface communicates with the UMS via a servlet. This servlet is run on the Apache Tomcat platform. The Flash interface, hosted by Tomcat, is returned to the user when they connect to the webserver. The flash interface sends secure messages to the servlet which wraps up the data and forwards it to the UMS. Users are assigned a session in order to limit the strain on the web server, and to give a degree of client-side security. Currently the session persists until 30 minutes of inactivity, reducing server load as clients can‟t logon indefinitely. This allows for a greater total amount of users which is highly beneficial if the system goes into widespread use. The team decided to use a servlet for communication between the user-interface and the UMS as the various alternatives, such as XML sockets would have required extra software that would have increased cost for the customer. As a result we decided on Tomcat as it is a freely available product. 20 The team decided to abstract away from Tomcat, as it can be difficult to debug, meaning the servlet simply formats the data passing between the user interface and the UMS. This meant that we could debug our system without concerning ourselves with the servlet, after initial setup and testing. When a user invokes a user interface function requiring data from out-with the user interface, the servlet is invoked. For example, if our sample user Alice decides to log-in, the information from the user interface arrives at the Java servlet running on Tomcat and is then converted into a form that can be sent out to the UMS. The information is sent to the UMS via a secure TCP connection. The UMS receives state information from the user interface and therefore knows which of the methods within the UMS to call. It then invokes a method from the database control class that deals with validating login details. The reply from the database control class is then wrapped up and the result sent out to the servlet which forwards the result to the user interface, informing Alice that she logged in successfully. The only difference between the behaviour for „login‟ and any other message type is the method that it invoked within the UMS to process the data or results. For example if Alice searches for every possible share in the database, due to a buffer issue in Flash the shares must be wrapped up into small dynamically sized blocks that can be sent without worry of overloading the user interfaces‟ character read buffer. Similarly if Alice were to buy shares, her balance must be retrieved from the database, and the total cost of the shares compared to this balance, a buy request made and if all of this is successful then the UMS can return to the user-interface that Alice‟s purchase was successful. 5.4.3. Financial Data Centre This section describes the operation of the financial data centre (FDC) incorporating request processing and the reading of the data feed. These functions are both called through a central start-up class so we will observe this first. System Start-up (systemStartup.SystemStartup) This class is responsible for starting up the entire system. It starts server threads for every distinct division of the system. Included in this are the two core features of the FDC, beginning with the data update package. Data Update Package (fdc.dataUpdate) This package deals solely with updates to the database. In the first prototypes created the package also contained a makeshift database – a linked list consisting of share objects in Java. For the purposes of this documentation the prototype using a linked list database will be called the original implementation, and further prototypes identified as latter implementations. 21 This package is run from the UpdateServer class. Once this has been started the class periodically updates information stored in the database, by running the relevant method in the feed parser, and requesting from other groups. Feed Parser (fdc.dataUpdate.feedParser) The data feed was provided by the customer, with groups having no control over its format or contents. Share information was available as comma separated values, XML, or MFML – invalid XML, but with additional share information. The XML feed was used initially, however this didn‟t provide enough relevant information, such as display name (e.g. Vodaphone), and sector (e.g. Telecoms Wireless), so the team switched permanently to the MFML feed. Since finishing coding we have learnt that this wasn‟t done to specification, as the MFML feed was only ever intended to be used initially, with the XML feed used for updating data. However, as the specification was never given to groups, this decision could never have been reasonably taken. Created for the initial prototype, the feed parser reads in the XML feed and parses this into a format readable by the rest of the system. Initially this involved simply parsing the file using the Xerces Java parser. As stated above, it eventually became necessary to switch to an MFML feed which wasn‟t valid XML. As a result, prior to XML parsing, the program must filter out the un-escaped ampersands that rendered the feed invalid. Once parsed the system can be used to store data in one of two ways: 1. Stored as within a Java linked list (original implementation). Initially used as a quick implementation of a database, this function still exists to be used as a back-up in the case of any difficulties with the mySQL database. The initial parser was based on a second year practical by Angus although this now barely resembles the original code. 2. Stored in a mySQL database (latter implementation). While this package has no direct interaction with the database, this feature requires calls to the database interface – functionally distinguishing it from the original version. Once the need to store share data locally was eliminated it became clear that parsing the XML file using Xerces was not the most effective method of altering the feed format. Consequently, the group looked into other means of achieving this goal, eventually deciding to use Xalan – an XSLT parser [20] [21] .This method eliminated the need for storing numerous Document objects within the program and significantly reduced the systems complexity, computation time, and memory requirements. MFML Feed MFML Remove Invalid Characters XML XSLT Processor Schema Defined XML DB Add to Database Linked List Convert to Internal Format Figure 10: Parsing Process. 22 The flexibility of the conversion theoretically allows for another, different, data feed to be connected, and used to update the database. Only the XSLT file would need to be adjusted to fit the format of the feed. The one remaining issue is that of real numbers – the feed stores fractions in a human readable format (e.g. 2 1/2), but one which is not easily readable by computers. In compliance with the standards meeting ruling on this, these fractions are decimalised correct to five decimal points. This is done immediately prior to the data being entered into the database. Group control of sectors adds another factor of complexity to the update operation, as the feed can only be used for sectors which the group controls – shares allocated to other groups must be obtained through the VSTM. Updating from Other Groups To abstract the distributed nature of the stock information from the UMS side of the system, the team had to create a system for compiling the results of, what amounted to, requests to a number of other groups. Having explored the problem a number of possible solutions were found: 1. Every time a request is made route this to all 5 groups (including our own request handler), and combine what results are received. 1 2 Request Processor Co-ordinate Search 3 Compile Results Results 4 5 Figure 11: Proposed Query Request Structure (i) 2. Every time a request is made get the results solely from our own database. This assumes that we attempt to update our database as often as is reasonably necessary. Request Processor Search DB Results Figure 12: Proposed Query Request Structure (ii) While the first solution potentially gives up-to-date data, it suffers if not all groups are operating, and so large chunks of data could be omitted from results – not an acceptable situation. Updating stock information from other groups frequently (every minute) reduces the problem of old stock data, while timestamps inform the user if this is the case. 23 The group decided that the second option was the better of the two. We felt that omitting certain stock information could potentially be detrimental to a user, and this situation should not occur. Where historic stock information is viewed, the user is informed through the timestamp field. As this issue only affects queries, and not transactions, this decision doesn‟t affect the user financially. To implement this solution the team had to rewrite our Update Server in order to request from other groups periodically. The team encountered difficulties when a buffer problem meant that large parts of requests were being truncated before completion. To solve this problem the following method of multiple requests was created: Query: Shares ≥ A 1. Search for all shares 2. If the queryReply end tag is not received, remove all characters after the last valid share data (i.e. remove <queryReply> … </mi everything after the last </share>) 3. Find the code for the last share received. In the example shown this is MNR. 4. <queryReply> … <code>MNR</code> … </share> Search for all shares not yet received. In this case this is all shares greater (alphabetically) than MNR. This Query: Shares > MNR works as all groups return shares in sorted alphabetically by code. 5. Continue this process until the <queryReply> … </tim queryReply end tag is received – this signifies that all shares have been read. Figure 13: Solution to Buffer Problem Using this method updates are received from other operating market makers every minute, along with the feed. Request Handler Package (fdc.requestHandler) All queries and transactions involving shares are handled within this package, whether they‟re from within the system or the wider VSTM. 24 In order to make requesting data as simple as possible requests are handled by way of factory classes. This means that, from the view of the calling module, all requests are handled with the same call; improving program modularity. This code (shown below), initiates the request process as the following diagram illustrates. RequestFactory rfactory = new RequestFactory(); RequestProcessor rp = rfactory.getProcessor(input); Document doc = rp.start(); RequestFactory getProcessor() RequestProcessor start() Reply Process Request request Database Interface Figure 14: Data flow for query requests. Send to Relevant Group To VSTM 1–4 Request Call Reply Check Share Sector 5 Process Request Figure 15: Abstraction of VSTM from UMS, in buy requests This implementation handles requests from both the VSTM and the UMS with the same interface. This is possible as the request processor has three constructors; two which handle internal Requests and Buy Requests, and another which takes in text requests (from the VSTM). As the latter diagram illustrates this happens irrespective of the group in control of this sector. This control is completely abstracted away from the UMS, consequently the User Interface. In our example Alice has just requested to view some share details. The FDC receives this request from the UMS, knowing nothing about Alice. As the model updates from other groups periodically this request is automatically handled through our database (for the FDC this is a call to the database interface), with the result returned as a XML Document object (as shown in figure 13). When Alice wants to buy a share she will first search for the company she wants, using the same type of query as the previous example. When the FDC receives a request to buy a share (through the same call as the queries) the system checks the database to find the group controlling this shares sector (shown in figure 14). If another group is in control, the system sends a request to the relevant group; if our team is in control we handle the request; otherwise an error message is returned. When our team handles the request a query is made to the database, confirming the price of the stock. If confirmed a confirmation is returned to the calling class – in our example this is the UMS, but when other groups request the reply is sent back to the server, ready to be sent back across the VSTM. 25 Server (fdc.requestHandler.server) As with the UpdateServer class in feedParser, a new thread is created to run an instance of this class on start-up (as in figure 4). This allows the package to open a listening socket ready for inbound connections from the VSTM. In addition, all requests from the systems users are filtered through here. Often requests are handled internally, through a request to the database interface. There are however a number of situations requiring communication with other groups in the VSTM. In this situation a new secure (SSL) TCP socket is opened for communication with the relevant group, and the request sent. The connection is closed once a reply is received. 5.4.4. Database The problem of storing, manipulating and retrieving large quantities of structured data is central to this project. A number of strategies exist for dealing with this problem, in memory storage, flat file storage and database oriented storage. Using in-memory storage would make data manipulation and retrieval a simple and fast process. Unfortunately in the event of power loss all data would be lost, and the data size may exceed total memory available on the system. Flat file storage provides a simple mechanism for data storage and retrieval however it can lead to slow data access times when the data is being searched upon. Using a database management system it is possible to store large amounts of structured data in a way that allows data to be searched very quickly by using a technique known as indexing. Like an index in a book, the index is a small, and can be quickly searched to find the data required. User Interface Stock Price Feed Reader Database Trading Server Figure 16: Interfaces with Databases As the above diagram shows, many sections of the project require the use of structured data storage. These sections are developed in both Java and Action-script and communicate using various combinations of XML, URL encoded strings and Java function calls. To communicate successfully to these different modules, it was decided to write the database management engine in Java. 26 Java is a flexible programming language which has good support for database engines, XML parsing and data manipulation. MySQL was chosen as the database management system as it is available on the junior honours laboratory server, it can be accessed from Java using a JDBC (Java Database Connectivity) database driver, and the team already had experience in using it. To design the structure of the database, it first has to be considered what data it needed to store. All team members were consulted about what data their modules needed to store, access and perform operations on. From this it was found that four main tables were needed – users, stocks, transactions and portfolio, as the following diagram illustrates; users PK username password fullname access_level stocks PK code currency timestamp bid mid offer exchange sector official_code disp_name dividend div_pay_code transactions PK transaction_id username stock buy portfolio PK portfolio_item_id username stock quantity Figure 17: Database Schema The underlying SQL was based on these diagrams, along with the database management engine that has similar data structures into which data is formatted for communication with the database. This highlights the benefits of using an object oriented programming language - the data structures could be constructed from a number of forms (XML, Java arrays and URL encoded strings), and vice-versa. Communications with other modules were fluent and effective. When our customer Alice wishes to view her portfolio, the UMS invokes a method in the Database Manager that looks up her details, and then retrieves her portfolio. This is formatted as a URL encoded string and returned to the UMS. This is done by sending an SQL query to the JDBC Connector, with the result being returned as a linked list. The JDBC Connector manages mySQL specific parts of the implementation, further abstracting the database implementation from other sections of code. Due to the consistent structure of the system, all other database accesses follow the same pattern. Such operations include validating Alice‟s login, retrieving stock information and adding data from the XML feed. Where data is updated, the relevant data type is constructed from its source data then passed to the Database Manager which will ask the JDBC Connector to find the relevant records in the database and then to update them. 27 5.4.5. Logger FDC Logger (eventLogger.fdcLogger) This package is responsible for the creation of logs; a function requested by the customer postrequirements specification. The package allows for logs to be created for – requests and replies to requests, updates to the database, and errors. The former request log is required by the customer; however other functionality was added for the logging of errors to exploit this feature for debugging. All logs are written to a schema defined XML file, allowing them to be transformed into HTML tables using XSLT. Later in development a similar logging feature was added to the database, helping to ensure the accuracy of our records. The system is built with robustness in mind, and as a result errors shouldn‟t affect the continued operation of the system. While this is a positive feature it also means that any errors occurring during the integration of components are difficult to spot, hence the error logging function. Used correctly the system should create a log every time an exception is thrown, not interrupting the programs operation. group_num, transaction_id, data update_type, success type createRequestLogEntry() createUpdateLogEntry() createErrorLogEntry() UPDATELOGFILE, element_data, element_name ERRORLOGFILE, element_data, element_name REQUESTLOGFILE, element_data, element_name This method adds the time & date to the entry appendLog() <log document object>, log_type outputToFile() The log file that is written to is determined by log_type Log File Figure 18: Data flow through the logging package. This diagram shows a simplified version of the module. A number of other methods were created to log buying and selling, both to other market makers and to ourselves. To avoid duplication of code these 28 methods then use two others; one to append the new log onto proceeding ones, and another to save this to disk. To limit the number of parameters required in calls, as much work as possible is done within this package. This includes finding the origin of an error automatically – done by throwing an exception and using the resulting stack trace to get the name of the calling method and class. As logs are designed to be created frequently all possible causes of errors had to be checked and tested. The system is able to cope with the following abnormal behaviour: Key methods within the class are synchronised, preventing probable concurrency errors. If the system tries to write to a log file that doesn‟t exist, a new log file is created and all future updates are written to this. If the system tries to write or create a log file that doesn‟t exist, a new file is created and future updates are written to this. If a new log entry includes characters which may invalidate the XML file (for example, ampersands), the parser escapes these characters with the official escape characters. Planned Updates While there is currently no functionality to view these logs within the system, XSLT is used to display the logs in a readable HTML table. We hope to be able to allow administrators to view these files remotely from a browser window. 5.5. Security In any system that is implemented there is a threat of attack or exploitation. Even in a simulation such as our project there is a necessity to provide security to give the system credibility. This security is provided by the use of data encryption and user identification at various points in the program. This has the effect of making the system more robust, by creating secure connections that can be relied upon to deliver data efficiently and without error. Inter-Group Security Our team were put in charge of security for the VSTM making our group the standard for other groups to ensure compliance. This charge ensured that there were few problems with secure communications at TUP‟s, or the final integration test. Communication between groups in the VSTM is created by a TCP connection. The life cycle of this connection is defined by the communications protocol - usually as long as the time it takes to send a message and receive a response. Security between groups in the VSTM is provided by 1024bit RSA encryption using a Secure Socket Layer that – for our team – was provided by Java. Each group has provided a virtual certificate that was given to all other groups. This ensures communication only takes place between groups that have the private key that matches the 29 corresponding certificate, and the only certificates in use are those provided by the project groups. This guarantees that anyone out-with the five groups cannot trade over the VSTM as they can‟t have a valid certificate. Non-Repudiation This system also provides non-repudiation because each project group has a corresponding certificate that only they should be able to use. This means that a group cannot deny that a transaction occurred from their group, because the IP-port combination of a connection can be monitored, and if the correct certificate is used then we know that a legitimate party has made a connection. This ensures that the transactions that take place in the VSTM are noted by both parties and prevents inconsistencies and disputes occurring. Each group is responsible for maintaining secure control over its private key, because if this is compromised then an attacker could theoretically impersonate a group by using the port that the group is set up to use. In the context of this project this is unlikely to because the we use a password to access the private key and only members of our project group know this password. Security breaches If a group‟s private key was compromised, then that group would notify the other groups, and the relevant private key would be removed. Whoever had breached the system would no longer be able to operate over the system because other groups would no longer recognise accept connections from the certificate used. In the event of another of the project groups attempting to defraud the system by not updating a clients balance following a transaction it would be possible to prove since we maintain multiple logging functions which could then be used by an auditor to reconstruct the transactions and show that the other group had not correctly updated their clients balance. If all groups use the logging system correctly then it shouldn‟t be possible for any single group to defraud any of the groups in the VSTM. Our system defends itself against Distributed Denial of Service attacks in two ways. Firstly by implementing a socket timeout after 8 seconds, leaving time for incoming or outgoing connections to finish reading or writing, then freeing up the port for legitimate connections. This prevents attackers from opening a connection and not sending any information, with the intention of using up system resources, and it also defends against problems caused when other groups crash but leave a connection. Extensive testing highlighted this as the only event which caused our system to cease handling requests. The timeout is set to 8 seconds and not sooner to allow for other groups to process our requests and format a response – at high system load times this value is still fair. Each socket connection is placed into a synchronized map that provides a vector for each connected IP address, providing a second defence against DDoS attacks. Each array has a size of 4, meaning that a 30 maximum of 4 connections per IP address are allowed at any one point. This defends against a multitude of connections coming in from a machine with the intention of overloading out system resources, whilst allowing a reasonable number of requests through. Each time a new connection is made from an IP address, the corresponding vector contents are analysed, and provided there is space, the thread is created and inserted. If the vector is full, the system iterates over to find any dead threads, which are removed, allowing a new connection to be added. If the vector is full with live connections then a thread will not be created and a connection will not be made. Through the eight second timeout, the system ensures a constant turnover of threads to prevent any individual thread persisting for extended periods of time, and denying service to incoming connections. User Interface to Java Security To support user confidence in the system and to prevent malicious activity, the User Interface uses an HTTPS connection to our web server; the Tomcat system we use to run our servlet uses a 1024 bit RSA encryption system for these connections. The user is given a certificate upon connection, and must first tell the browser to accept this certificate to able to securely communicate to our web-server. A different private key and certificate on the User Interface side of the system to the one that is used communicating with other groups on the VSTM. This increases security as, in the event that security is breached on one side of the system, the other side is not compromised. When a servlet session times out the user is returned to the login screen and is asked to re-enter their password. This improves security since it means if a user leaves their workstation for an extended period of time whilst connected to our system, a malicious party cannot use the system without having to login, thereby preventing them from pretending to be a legitimate user. 5.6. Allocation of Tasks Tasks were initially allocated to team members in the project plan (page 72), and with a few minor exceptions this is how the system was implemented. The following table elaborates on this: Group Member Tasks Angus Financial Data Centre, temporary database (initial prototypes), XML Schema (for all groups) Duncan Database, Database Interface, URL encoder method Ewan User interface, flash – tomcat connection Greg User Management System, tomcat, server (initial prototype), Secure Communications (for all groups) 31 “The greatest improvement in the productive powers of labour, and the greater part of the skill, dexterity, and judgment with which it is anywhere directed, or applied, seem to have been the effects of the division of labour.” [22] We feel that the allocation of tasks to group members constituted a successful division of labour that matched individual talents and experience to system components. Angus Tasked with both the creation of the FDC and with the format of inter-group communications, Angus was able to focus on XML manipulation in Java, developing a strong understanding of the tools used (Xerces, Java XML tools). In addition to developing his knowledge of XML and XML Schema, he learnt XSLT - used in a number of areas to improve efficiency. The temporary database, used in all but that last TUP, represented a large part of the system code before being replaced by the mySQL database. Duncan As the only group member with previous experience with mySQL Duncan was a clear choice for creating the database. He helped out in other areas where necessary, but his experience was most apparent with the successful creation of the database. Ewan A number of members had previous experience in designing websites; however Ewan‟s previous experience with Flash, and the languages suitability to our task, made him a clear choice for interface design. During development he built upon his knowledge of action-script to develop a clear, well designed interface. Greg Having worked with Java sockets before, and been introduced to Java security in CS2003, Greg was chosen to focus on the User Management System – the component which utilised this experience best. His work on security led the standards committee to appoint him Security Co-ordinator, a role which saw him help other groups create certificates and set up their SSL connections. We feel that this division of labour enhanced the teams overall productivity, and produced a robust, developed system. This was in part due to our approach to the analysis of group members‟ relative strengths, as developed by Belbin [23] [24], and use of other management techniques [25] [26] [27]. Members of the team took it in turns to attend standards meetings, and all major decisions were made as a group. Team members freed their time on Wednesday to allow for at least one day of project work a week. In practise all team members spent time out-with this, often at nights and weekends. 32 Every group member participated in writing documentation, with Angus editing submissions and compiling the complete document. 5.7. Novel Features In this section we highlight a number of the most interesting features that our system possesses. When considering possible solutions for interface design, Flash - regularly used for animation and games - is not a solution that springs to mind. However its tight state control coupled with ActionScript allows it to deliver stylish graphics to produce an impressive graphical user interface. Connecting securely to our Java-based UMS implementation proved difficult, however it was achieved using a tomcat server. We felt the benefits far outweighed the connectivity issues, resulting in a fresh, creative implementation - unique amongst our peers. The teams‟ earliest documentation (project plan and specification) stated a desire for a loosely coupled, highly modular system. We feel that this aim has more than been achieved, with each team member initially designing their components in isolation, testing internally, and then integrating at a later stage. In order to achieve this, a number of techniques were used, including factory classes and independent processes. The former are used for requests, meaning that the UMS and the VSTM interface only need to know one call to the FDC, irrespective of the type of request they are making. This single call is applicable to all requests, irrespective of their source. The latter, independent processes, refers to the Tomcat servlet, flash, and the main system, all of which run separately. In addition to these measures, components in the system are structured into well-defined packages, with private and protected keywords being used where possible. Not only did this help with modularity, but also with the integration of various components, ensuring conflicts were unlikely. To prevent individual component failure affecting the whole project the team had numerous contingency plans for potential problems: A secondary temporary non-persistent database structure was built early on, and this can be used in the event of a database failure. The UMS and the FDC work independent of each other, meaning failure in one doesn‟t seriously affect operation of the other. Updates from the feed parser are executed periodically with the Update Server written in such a way as to make it easy to modify the timing. As noted previously, the flexibility of the feed conversion theoretically allows for another, different, data feed to be connected, and used to update the database. Only the XSLT file would need to be altered, to fit into the format of the new feed. 33 As a multi-user system, design had to allow for multiple requests concurrently. To achieve this aim the program makes extensive use of threads, beginning with an initial „start-up‟ thread. This initiates other server threads in the program, responsible for handling requests from other groups, and for handling user requests. In addition, multiple concurrent requests are made possible as a new thread is spawned to deal with every request. This and the strategic use of the „synchronised‟ keyword (giving mutual exclusion at key points in the program) allow our program to truly be a multi-user system. To test these measures the team used a number of creative testing methods, including offering prizes to anyone able to crash our system, and creating a Denial of Service Attack program (see testing, page 34). 6. Testing 6.1. General Testing The team recognised software testing as a vital part of the software development process – revealing problems in design, and errors made during the implementation. Testing in its various forms was performed progressively from the initial planning stage right through to the project demonstration. When the system was first designed, a set of scenarios were drawn up and used to analyse data flow and code dependencies. These helped demonstrate that no components where missed from the plan, and data required by each component was passed at the appropriate time. Next came function level testing where the logical path of each function was followed through by the programmer, and appropriate measures were inserted to handle boundary, exceptional and erroneous inputs. Test routines, written to test each function as black box units, are typically in the main methods of each class. The team found that most programming faults were found at this level. With these problems removed, faults found later in testing were typically small implementation-specific issues that were traceable and fixable. Following on from this component level testing was used, where components are large sections of the system such as the Financial Data Centre, and the User Management System. One technique used for this involved writing stubs that emulated the behaviour of other components. For example, before the user interface was connected to the user management system it was not possible to test how the database would react to various user input scenarios, particularly that of many concurrent transactions. To achieve this, a stub was written to emulate these scenarios to ensure faults were found and corrected as early as possible. Our system is itself part of a larger system - the VSTM. To test the system as an entire unit, two testing strategies were used. Firstly, the system was tested against itself, buying and selling shares from our sector and ensuring all components work together. Secondly, the system was tested against other 34 groups systems during the twice monthly TUP tests. These were important in gauging how all groups were interacting, but two weeks is a long time between test runs given the short timescale of the project. At TUP tests the team encouraged other groups to leave a stable version of their market maker running so we could test our system with theirs. Likewise, the team left our market maker running so other groups could test their system with ours. We became confident from test runs that our server was very stable, so in an effort to find any bugs, the team offered a reward of two cans from the Computer Science vending machine to any individual who - through malicious means or otherwise - could cause our server to crash. The offer lasted for two weeks in which time our server remained active, giving us reassurance that our software was stable, and providing invaluable testing data. The offer of a reward encouraged other teams to do more destructive against our server, which also helped verify that the system was able to work under high loads. 6.2. TUP Testing Between the groups there were Testing Universal Progress (TUP) tests. These tests were held twice every month between all groups, and ensured that throughout development, new and existing methods of communication were fully functional. Such tests were useful as they effectively provided black-box testing, with each team trying hard to show up others. This allowed for stability analysis and robustness checking of the core system which, coupled with our distributed attack program (see „Robustness Testing‟ below), improved the quality of the implementation. Some of the bugs that were found, and resolved, through these tests were: Issues with the server hanging – a socket timeout was added. Without new-lines at the end of requests some groups would not respond. Some groups changed their assigned port. Since then our text based user interface had the ability to specify port. 6.3. Robustness Testing The threat of malicious attack by outside parties is always a threat against distributed financial services. With this in mind we created a distributed attack program [28] [29] (called DAP) to test robustness of all the teams. Instead of focussing on the inherent weaknesses in the protocol, such as defrauding a group by mimicking a different group, we decided to attack teams (including ourselves) based on holes in our system found through testing. This ensured that all problems found early in development were continually stress tested by this testing module. 35 Given our knowledge of the underlying communication model, the team knew that each group would listen on a particular port. If an attacker were to create a large amount of connections to this port either the systems memory would be filled with a large amount of connection processing routines, or the available ports would all be filled and legitimate connections would not be accepted – producing to a successful DDoS attack. For our teams system to be seen to be reliable, robust systems they would have to defend against such attacks. We constructed two separate programs to test system robustness; the first - a control program is used to launch attacks from the second - a program that sits idly on a machine awaiting incoming TCP connections, before attacking a designated target IP. Control This program consisted of a simple command line user interface that asked for a group number and an IP address, and attack type and a quantity of attacks to make. Upon receiving this information from the user it spawns a large number of threads that all try and connect to a different machine in the third year lab – in the hope of connecting to a running „zombie‟ program. Zombie This sub-system consisted on many small integrated parts. The main program itself is called „xml_redirect‟ in an effort to remain incognito to anyone checking processes currently running on their machine. This spawns a small server-system that listens for incoming connections from the „control‟ program. The server spawns a number of threads equal to the quantity number received, via the message from the „control‟ program. The attack type is passed to the thread upon creation, where the relevant attack is carried out. It should be noted that if the user entered „20‟ into the quantity field in the „control‟ program then twenty attacks will be carried out by each machine running the zombie process. This means that a large number of connections can be made against the target without having to create a large amount of shares in an individual „zombie‟ instance. This feature is especially useful when attacking all groups systems at once. Attack types During the year at the TUP tests we would learn about different groups‟ problems, and problems we had encountered ourselves, constantly updating our parsing to protect against them. As an example, incorrect XML formatting would cause some groups XML parsers to malfunction and therefore crash their system. In every message sent to the other groups we declared out team name to be that of the group we were attacking, the idea being that the victim would read the request and return the response to themselves, causing extra processing, not to mention confusion. 36 Throughout testing we saw the biggest loophole in the communication protocol as being the lack of security - a connection could come from anyone. For this reason we suggested that SSL be implemented for inter-group communication. This meant that only authorized groups could make connections to each other. As a result our zombie program had to use an SSL connection and therefore our groups‟ certificate. This meant it could be traced back to us if the certificate was examined, but as the object of the testing was to point out weaknesses, this was not of any importance. The following attacks were implemented: Request all: Creates an SSL TCP connection to the target and requests all the shares in their system to be returned, the connection is then dropped. This is intended to cause extra load on their system to slow it down as well as creating a large number of threads within their system. Malformed request: Creates and transmits a malformed query request (invalid XML) by leaving out some brackets. This is designed to crash a poorly implemented parser. Incorrect order: Sends a message containing xml tags incorrectly nested in order to crash a poorly implemented parser. Junk data: This sent a string saying “connection error” to the group rather than XML. Extra New lines: A number of groups had problems parsing incoming messages if they contained new line characters. This was designed to see if they could be handled. Infinite connection: This connected to the target and didn‟t send a message. This meant that if they didn‟t have socket timeout that the connection would permanently remain open and a large number of these connections would cause the memory to fill up or the ports to be fully allocated. Ill-Formatted Trade Request: Try to buy some shares using a badly formatted trade request. Slowdown: Used to demonstrate the superiority of our web based system compared to other user interfaces that were slower and based unnecessary strain on users systems. This attack spawned a very small C program that allocated as much system memory as possible. It was allowed on a machine running the „zombie‟ program with the intention of disrupting the demonstration of anyone using the computer. When first tested some computers ran so slowly the mouse was periodically freezing on the screen. Setup In order to set up the robustness check it was necessary to run the „zombie‟ process on all lab machines. In order to do this we created 2 bat files, the first connected to every lab machine in turn and ran the program, the second connected to every lab machine and killed all active jobs in our user space. This meant we could very quickly turn the system on and off if necessary. The attack control program was run off of one of these machines and called when necessary, to send an attack. 37 Control Zombie Runner Attack Control Controlslave Xml_redirect Controlslave Attacklistener Attacklistener DoS DoS Xmlrouter Figure 19: Flow of control within attack programs. The above diagram illustrates the method of setting up attacks. Multiple objects or lines indicate that this section of the code creates many more instances, expanding the attack further. Testing When it came testing the distributed attack program it was necessary to not alert the other groups that we were constructing such a program as this would probably have resulted in them to create far more secure systems than they otherwise would have. With this in mind we only tested the DAP on our own system throughout development, with two exceptions prior to the integration test. This ensured that we learnt a lot about how to defeat the attacks; We developed a strong parser which could the various types of attack (shown above) without crashing the system. We developed methods of defending against system resources being used up by the creation of multiple threads, and the starvation of IP addresses by such a large amount of incoming connections. These are documented in the security section, page 29. 7. Evaluation The section provides a critical evaluation of the teams work, based on targets set in the project specification, and the final state of the system. 38 7.1. Project Evaluation We assessed our work on several: Deadlines and hand-in dates o Personal goals o Were the deadlines set by the module co-ordinator met? Were the teams objectives met? System requirements o The team drew up functional and non-functional requirements; did the implemented system fulfil these requirements? Standards committee requirements o Did the team adhere to all of the standards drawn up by the standards committee? The system was tested in a variety of ways, the majority internal testing within the group. Other than this testing took place during TUP‟s and the final integration test - attempting functionality with the other groups. On an individual component level the components were tested using unit level testing by the developers and then an inter-component test would be conducted to ensure that the components were functioning correctly. Once this testing had been carried out it was possible for the system to be taken to a TUP test and tested against the other groups systems. This allowed us to ensure that the code we were writing was compatible with the rest of the projects. The TUP tests were designed to prepare us for the final demonstration at the end of the course. We felt that we would benefit more at the final demo if we could maximise the lessons learned from the TUP tests and take a fully working, tested project into the final demo. 7.2. Integration Test Our final – official - integration test was held on 21st April. Lasting just over an hour, the team successfully traded with all operational market makers, whilst answering questions from members of staff. The team invited staff members to trade in some shares; some making a distinct effort to test the robustness of the software. Towards the end of the test we were given permission to deploy our groups testing tool, name Crasher, to test the robustness of all groups servers. As stated in testing (see page 34) Crasher launches a number of different Distributed Denial of Service [28] [29] (DDoS) attacks. Ironically the effectiveness of the attack was muted by the already high server load. We believe the attacks would have been more effective were the lab machines not under the stress of demonstration, as not many of the attack threads 39 were spawned due to high system utilization, and the server all the groups were running on has a lower specification than any individual lab machine. Despite this at least one group were forced to restart their server due to load problems caused by the attack. With respect to individual components of the system we can say the following: User Interface Users were able to buy and sell shares, view their portfolio, and customise their view. However due to some problems the team could not create user accounts during the test – this can be easily fixed. Financial Data Centre (FDC) o Feed Parser Updates were successfully carried out from other groups. However due a problem with our feed reader we couldn‟t update automatically from the feed. This problem can be easily fixed. o Request Handler To our knowledge all requests were successfully processed, whether from within our group or from other. User Management System (UMS) Correctly dealt with requests from the User Interface and effectively passed relevant information to both the database and the FDC. Database All requests to the database were successfully executed, and logs were taken of transactions. However there were some issues logging the price of sales back to the market. Logger Successfully logged all transactions (as a back-up mechanism to the database), and the result of all updates and exceptions. 7.3. Objectives This section assesses the objectives given in the teams Project Specification (see page 56), and states whether we were successful in achieving them. Portfolio Management System Primary “To create a system which allows a user to buy, view and sell shares.” This aim was achieved fully, our system successfully allowed users to view share information, and to successfully buy and sell these shares within the VSTM “The user should be able to query stock details from within our system and the wider VSTM.” Users can perform various queries on the stock data in order to select the shares that they wish to buy or sell, or even just for basic browsing. More specific data is also available to the user including all the 40 information we were able to access from the feed and also extra information such as the current amount of a particular stock held by our group. “Graphical user interface for the end user.” We created a graphical interface that allowed the user to perform the actions specified above and also extra features not laid out in the requirements. Functionality within the user interface is described on page 15. Secondary “System should be able to support multiple users with individual logins. They should be able to have personalised portfolios.” The Defero system allows for multiple users; and each of these users has an individual portfolio that they can buy and remove shares into and out of respectively. Tertiary “The system should support concurrent connection oriented requests.” Our system supports many concurrent connection orientated requests, from one or more different parties. This number is limited only by the hardware upon which the software runs and network capacity. “The system should support concomitant users logged in.” It is possible for many users to be logged in using the system at the same time, from a variety of locations, ranging from a single machine to any machine that can access our web-server. This is all done securely via https. Co-Operation Primary “To exchange stock information with other groups.” Our system exchanges a variety of information with the other groups including and not limited to the stock information that was provided to all groups by the customer. “Implement all standards agreed to by standards committee.” We adhered to and implemented all standards agreed to by the committee. Secondary “To be able to buy and sell shares, where there are a limited number of shares available (over the whole VSTM).” The shares were limited to a maximum quantity of 100000 per share, and we are able to trade with these shares over the VSTM. 41 Tertiary “The number of shares within the VSTM remains constant.” Due to factors out-with our control the feed can periodically add new companies to its data, making this aim infeasible. 7.4. Requirements Non-functional Requirements Reliability “The user will be able to login within the JH Lab, John Honey Building.” Yes. It is possible for users to login within the JH lab, and also from any location that is able to access our web-server via the school network or internet. “The system will have a mean time to failure of greater than one hour.” Yes. Throughout development the system was tested over extended periods of time and remained functional for well over the one hour requirement. During the project demonstration the system was active for over an hour without failure. The original one hour requirement was intended to mirror the time frame of the project demonstration. Usability “A user new to the system will be able to use the systems core functionality (viewing portfolio, buying / selling shares, querying) without reference to documentation.” Yes. We believe so since, buttons are labelled and messages are given to the user. This has been confirmed by our user survey, carried out once the interface was functional. All surveys returned are shown in the appendix on page 92. “A user new to the system will be able to use the remaining percentage (from 4.1.2.1) with documentation provided.” Yes. As above our user survey appeared to confirm that this objective was achieved. Robustness “The system will be able to restart in less than 10 seconds, upon any fatal exceptions.” Yes. 42 It is possible to restart the system in less than 10 seconds upon a fatal exception, though we found that most problems that cause errors merely caused an exception in a given thread and could not cause the entire system to crash. “Data and transaction histories will be logged.” Yes. Our system used dual logging to corroborate the details of transactions. This ensures that if the system crashes or a discrepancy occurs that the information will be output in a hard copy and in the database history so that the origin of the discrepancy is for more easily locatable. All transactions were logged in the database and also as xml output by the FDC. Historical data is logged by the database for use with queries within the system. Efficiency “User event response time will be less than 2 seconds, assuming normal load conditions on the host server.” Partially. Whilst the system does respond in less than two seconds to user actions under normal load conditions within the VSTM, at the project demo the query to return all shares took some time to be returned. This is mainly because we had to wait for the other groups to process our request and reply. All user events pertaining to our own system were handled within the two second time frame. Action Approximate Response time Loading flash Login Portfolio Sell Logout View all shares <1s with ADSL <0.3 s <1.2 s <1 s <0.5 s 4 s* Co-operation “The system will implement all standards agreed to by the standards committee.” Yes. We successfully implemented all of the standards proposed by the committee. Functional Requirements Portfolio Management System “The user will be able to buy shares from any group over the VSTM.” Partially. We successfully purchased shares from every group with a market maker capability. “The user will be able to sell shares to the market-maker over the VSTM.” Yes. We successfully sold shares to all groups within the VSTM. “The user will be able to view their portfolio.” Yes. Our system allows users to view their portfolio using the user interface. 43 “The user will be able view expanded details of their shares, including, but not limited to: Code Currency Timestamp Mid price Bid price Offer price” Yes. When a user receives the result of a query, only a small part of this information is visible in the results screen; however expanded details are available on the “buy” and “sell” screens to give the user all the relevant information to help them decide if a transaction is required. “The user will able to query stock details (listed in 4.2.1.4) within the system and the wider VSTM.” Yes. It is possible for a user to query any stock details within the VSTM and also from our teams system. “The system will have a graphical user interface. This will: Relay all aforementioned data to the user. Inform the user of any errors, should they occur.” Yes. The user interface is the gateway for the user into our system and also into the VSTM, although the VSTM is abstracted away from the user interface implementation. Data is returned to the user interface in a helpful table format, with errors displayed if transactions fail. “The system should support multiple users.” Yes. There are several account types, each with different access privileges. There can be multiple users of different types using the system concomitantly. Co-operation “The system will be able to transfer stock data (including, but not limited to 4.2.1.4 bullet list) over the VSTM.” Yes. We can successfully transfer data to the other groups over the VSTM using SSL encrypted TCP connections that provide a robust secure communication data transport layer to our system. 7.5. Design Decisions Taking into account the challenges the team encountered during development we feel that our choice of development languages allowed us to provide a robust solution to the customers‟ problem. Java provided the ideal framework for the creation of robust, object-oriented code; justified by robustness testing, documented on page 35. By using Java libraries, coding was focused on functionality, and based on a tried and tested core of code. The team feel that the choice of Java hastened development by utilising previous experience, and allowed for the production of robust code. 44 MySQL provided everything required for our database implementation, ably storing everything required, and searching efficiently and reliably for the duration of the project. Despite various issues with Flash (see page 15) this choice of interface provided an inventive graphical solution to the problem. Most issues stemmed from the Macromedia (developers of Flash) implementation of Flash, something relatively common with this kind of closed source system. Despite these issues the feel that the choice was justified, as it allowed us to widen our objects beyond the norm. 7.6. Comparison With Other Groups Given the closed-source nature of the project our comparison with other groups is based only on progress made, and the respective interfaces chosen. All groups were able to communicate successfully using our schema, marking a great success for the team. We successfully managed to keep up with the implementation schedule effectively created by the numerous TUPS‟ during the second semester, keeping us ahead of other groups implementations. This gave us numerous advantages in testing our system, and Evaluating other groups‟ software gave us a post-project insight into other ways we could have made our software. Some other groups managed to incorporate features which we did not, for instance group 3‟s software was able to show a graph of stock prices. This is a feature we would like to implement if we did further work on the project. We felt that it was better to concentrate our efforts on a good software framework, reliable and robust code throughout. Due to the modular structure of our code it would be easy to add additional functionality to our project in the future. 7.7. Comparison With the Public Domain Due to time constraints, experience, and budget, our system cannot compete with commercial or industrial examples of a portfolio management system. However the team worked hard to resolve weaknesses seen whilst carrying out our context survey. Finesse had various issues displaying data due to the amount of detail that needed to be displayed. In this regard our team had relatively few details that need to be displayed, however share details were deliberately limited when viewing lists of shares to prevent confusion – these details such as offer and bid price are shown later when the user views a particular shares information. By doing this we reduced the risk of having to display too many details at any one time. If increased detail is required our implementation will be able to support displaying far larger amounts of data. 45 Similar to Finesse our implementation is viewed through a browser, meaning the GUI is platform independent. It can also support multitudes of users since each Flash page is instance independent. The Virtual Stock Exchange was also researched for this project, with the team noticing that although the web-based stock-trading simulator had advanced features such as graphing, it failed to display all the details we wished to view at particular points of transactions. Our implementation shows the most share details are at critical times, such as buying and selling. Confirmations are shown in windows allowing the customer to view the details the previous page if necessary. TSimLite lacked an intuitive interface, and our implementation recognised this - attempting to make the interface as recognisable to a user as possible by using icons and data layout similar to major operating system. We didn‟t suffer from alignment issues with our data since it is displayed in a firm table that, when set up correctly, will display the data in the same manner every time. User interface aside, the project our team took part in was substantially different to all public domain work that had been researched. The distributed nature of our stock market created various unfamiliar challenges, and a different focus for the system implementation. Given the resources available for the task the team feel we have competed admirably against professional competition. 46 8. Conclusions 8.1. Achievements of Team The main goal of our teams‟ project was “to create a system that simulates buying and selling shares over a virtual stock trading marketplace (VSTM). This is an abstract notion representing the network of group project systems over which users will trade.” We feel we were successful in this aim and produced a product we are proud of. On analysis of the requirements we feel that we have fulfilled our aims, and created a successful system that users would benefit from using. This is due our creating a solid plan and sticking to the design drawn up. We found the modular structure we followed enabled us to create a system that came together well and that was easily expandable. We played to our individual strengths in regards to assignment of tasks and distribution of sections. Our team fit well into the spiral development model chosen, and the use of CVS and our project space for the constant creation of iterations meant that all separate modules were developed in parallel and functioned together as a whole. Constant contact with our supervisor kept us up date with progress, solidifying in our own minds the status of the project, and leading everyone in the team to put aside a set time each week for development work, as well as committing extra work when necessary. We handled the varying nature of the customers needs by making sure to keep in mind as many possible paths project development as possible, and this wide scope coupled with the adventurous decision on the interface design meant we could cater for a variety of possible challenges whilst still allowing our own creativity come through. With any project there will be problems that need to be overcome, but we feel we handled the emerging challenges well and developed dynamic solutions based on our communications models that enabled us to progress beyond the initial scope of the project. Improvements can be made to any software system as there is not usually a definitive solution to any given challenge, especially one of the scope and size of the software team project. We feel we created a system that is capable of handling the addition of a great deal more functionality on its existing software model. It would be possible to add a multitude of features very simply with only a minor amount of implementation, meaning that the customer could take the system and advance it as they see fit. Communication between team members was good at all times. By ensuring that each team member felt useful and had the correct assignments we built up trust and good relationships without becoming to 47 team orientated. Each team member feels as though their abilities in software engineering, communication and forethought have improved as a direct result of the project. Communication between groups was generally good, with groups working together during standards meetings; each team committed to seeing the year succeed as a whole. Having contributed a significantly large amount to the standards for the year we were able to oversee the development of many of the standards and were thereby able to keep all of the groups on fairly good terms and up-todate with each others progress. Due to time constraints, experience, and budget, it would be irrational to think that the product we created would best any commercial or industrial example of a portfolio management system. However, our project - light on functionality in comparison to large commercial systems - shows how a simple, robust and secure model could be built upon by a small team, to create a powerful tool, aiding in software portfolio management. We learnt a lot of transferable skills whilst developing and implementing our project; skills not only transferable to later computing projects but also for any project we may tackle in the future. Ability in project management and communication is useful throughout academia and the business world. Additionally, the importance of documenting and presenting a project is also now far more evident to all team members. We would recommend to any team implementing the same project in the future that they make be sure to analyse their development and system models before implementation to ensure that they are the correct choices for their team. Maintaining good communication between members and other teams is vital, as is ensuring that team members are aware of and understand the progress in the other areas of the team. We did not have a formal or informal management hierarchy, with development decisions made democratically, but crucially however each team member retained control of the implementation of their individual component. This promoted growth and creativity within individual sections as well as for the whole project, as all parties were allowed to bring ideas to the table. 8.2. Future Direction of Work This section gives details of the functionality the team would add given more time on the project. It is split up into the main components of the system. User Management System (UMS) A better „shutdown‟ routine should have been developed in co-ordination with the user-interface. The currently implemented method for destroying threads when the servlet timed out works; however a more robust system would be preferable. 48 User Interface (Flash) As with any project more functionality would be added given more time. In particular, data passed between Java and Flash is URL-encoded; in the other parts of the program XML is used. Ideally we would like to use XML sockets; however communication by XML is too convoluted without installing additional software such as Flash Remoting [30][31] , allowing Flash to parse the XML. The team considered that the Java component parse XML instead, as it should be faster than ActionScript. In the end this wasn‟t researched as, without Flash Remoting, the team had no option but to parse in Java. A survey of the system was carried out (see page 92), and from this several improvements were extracted. They were as follows: Loading time for displaying all shares – solution as discussed in previous “Issues” section of user interface documentation. Being able to search for the display name of a share – the choice bar would be modified and a new case in a switch statement would need to be added. Indication of how well the share is doing – extra variables sent to Flash to be displayed to the user. In addition to these, the team would like to add a number of other features to the user interface. Due to the structure of the code-base this is a relatively simple task, as all that needs to be created is a new state code and another case statement in the UMS. This makes maintenance easier for the user interface. Some considerations for improvements were: Tool-tips Graphing More detailed stock information Regular calculations displayed – For example, how many shares the user owns in all companies. Database (Java / mySQL) The database itself is efficient, scalable and dependable and is unlikely to require major changes to adapt to having to store additional data. To extend the database functionality by adding the ability to store previous stock prices, data warehousing techniques would need to be used. Changes to stock prices could be logged on change and snapshots of stock prices could be taken at intervals such as every hour. If Java 1.5 had been available on the lab machines used for developing the system, some of its features could have been used to improve the implementation of the JDBCConnector. Variable numbers of arguments for functions and generic data types would have made passing data from the DatabaseManager to the JDBCConnector neater and more extendable. 49 9. Bibliography [1] Group 5 (Defero) Project Specification (2005), see page 55. [2] Group 5 (Defero) Project Plan (2005), see page 62 [3] Group 5 (Defero) Interim Report (2006), see page 76. [4] Hamilton, J. Dundas, Stock-broking Today (MacMillan Press Ltd. ISBN: 0-333-24237-8) [5] Greenwald & Associates, McGraw-Hill Dictionary of Modern Economics (McGraw-Hill) [6] Sir Stephen Killik, The Work of the Stock Exchange (E. Couchman & Co. Ltd.) [7] Charles R. Geisst, A Guide To Financial Markets (MacMillan Press Ltd.) [8] http://finesse.ac.uk/tags/finesse.html [9] Helliar & Michaelson, Evaluating Finesse: Experiences from the First Year [10] DM Power, R Michaelson, C Allison (1998), The Finesse Portfolio Management Facility (9th CTI-AFM Conference) [11] http://game.marketwatch.com/ [12] http://www.tradingsimulation.com/tsimlite/ [13] Spiral Model Diagram, taken from http://www.stsc.hill.af.mil/crosstalk/2001/05/boehm.html [14] Pressman, R (2004) Software Engineering: A Practitioner's Approach (McGraw Hill Higher Education), Page 35. [15] Knudsen, J. (1998) Java Cryptography, O‟Reilly. [16] Burke, E.M. & Coyner, B.M (2003) Java Extreme Programming Cookbook, O‟Reilly. [17] http://www.cs.umd.edu/~ben/ [18] Norman, D. and Draper, S. (1986) User Centred Systems Design. [19] Lauesen, S. (2005) User Interface Design, Addison Wesley. [20] Burke, E. (2001) Java and XSLT, O‟Reilly. [21] Mangano, S. (2002) XSLT Cookbook, O‟Reilly. [22] Adam Smith (1776) The Wealth of Nations, P17 [23] Belbin, R.M. (1981) Management Teams: Why They Succeed or Fail, London, Heinemann Books. [24] Belbin, R.M. (1993) Team roles at work, Oxford, Butterworth Heinemann. [25] Kanter, R. M. (1994) `Collaborative Advantage: The Art of Alliances'. [26] Berkun, S (2005) „The Art of Project Management‟, O‟Reilly. [27] Argyris, C. (1976) Increasing Leadership Effectiveness, John Wiley and Sons Ltd. [28] http://nds.dcs.st-and.ac.uk/pic_details.php?pic_file=posters/ddos.pic_info [29] http://en.wikipedia.org/wiki/DDoS [30] Muck, T. (2003) Flash Remoting: The Definitive Guide, O‟Reilly. [31] http://www.macromedia.com/software/flashremoting/ [32] Sommerville, I (2004) Software Engineering 7 (Pearson Addison Wesley). 50 10. Appendices 10.1. Maintenance The system was designed to be loosely coupled and easily modifiable, an aim that was adhered to throughout implementation. This, along with the following documentation, makes the system highly maintainable. This section is further split up by system component, with each subsection explaining how maintenance of that component should be carried out. For details on the purpose of each component please refer to the project details section on page 10. This is a technical document. Requirements Java 1.4.2 Tomcat 5.5.15 Web-browser with flash plug-in Deployment To start-up the system, run the jhProject-Jan files by entering… java -cp .:mysql-connector-java-3.1.12-bin.jar:xerces.jar systemStartup.SystemStartup …at the command line in the jhProject-jan folder. This will start the java program running. It is possible to leave this program running by entering an ampersand at the end of the previous command line call. The java program will then load up a small user interface that can be ignored, in terms of normal operation and should only be used for debugging output. Next the servlet will need to be deployed, in order to do this enter your tomcat manager and select the defero.war web-app - deploy this webapp. The servlet will then attempt to contact the java program. Once these steps have been followed the system should be set-up and ready to use. User Interface (Flash) This section should be easily modifiable to anyone with experience in Flash and ActionScript coding. 51 Low cost maintenance of the GUI is achieved by the modular design of the Flash. All ActionScript is attached to frames through functions instead of being attached to elements in the frame. This allows graphical elements to be altered at will, providing they are given the same instance name. The entire User Interface can be visually altered without needing to alter the communication structure or ActionScript. Adding new functionality is just as simple. This is achieved by adding a new „state‟ or frame, with additional ActionScript added to this, and graphical elements placed in their relevant layers. To set up new communication with the User Management System a new state code is required along with the relevant details of the functionality – the User Management System must be updated to cater for these changes. User Management System (Java) The UMS is simple to maintain due to the simple design. This was a conscious design decision since we planned to have to add lots of features towards the end of the development once the data routing between the separate components was set up. The servlet would not need updating via maintenance unless the URL encoding communication interchange format was altered – this would require a different implementation of the wrapper class inside the servlet java class. The session timeout can be altered by adjusting the web-xml file within the web-app. This is a simple modification. In order to add extra functionality to the UMS, simply add a new state code, and a new case within the switch statement. This will provide the UMS with a new state. New parameters to be received from the user interface can be added to the InputParser class. There are comments inside the source to tell the programmer where to update in-case of necessary maintenance. It would be required that the necessary functionality be provided within the FDC; database control classes and the user interface for support of the new functionality, since the UMS has no data storage or direct involvement with the user. Financial Data Centre (Java) The FDC is logically split into three sections; updates from the feed, a server handling communication from and to other groups, and a request handling package. Maintenance for these sections is made easier by the availability of JavaDoc for every class. This document shows how to add functionality for a number of probable cases: Addition of Another Type of Request 52 Requests are processed in the fdc.requestHandler.processing package. Here the BuyRequestHandler.java and QueryRequestHandler.java classes handle trade requests and query requests respectively. All requests are received as text, but converted to XML Document objects. Firstly RequestFactory.java needs to be updated with calls to constructors in your new class. This can be done by… } else if (name.equals (“requestName”)) { return ( new NewRequestHandler(doc) ); } … Where “requestName” is the name of your new request in the root object of the XML request, and „NewRequestHandler‟ is the name of you request handling class. Now that the factory returns an active instance of your request handler you need to implement this class. Begin by creating the constructor used in the above call (it passes in a Document object). In this constructor the current implementation converts the query into a Java object, simplifying later processing. However this is by no means required. To methods are required within request classes; o „public Document start()‟ This essentially processes the request. This should return a Document object containing the reply. If you need to return one of the standard system SHEEP errors simply make a call to the error creation class, common.types.SHEEPErrors. o „public boolean isSuccess()‟ Returns whether the reply was successful, or if an error was returned. Alter the Frequency of Data Updates. To do this the following line must be changed in systemStartup.SystemStartup: new fdc.dataUpdate.UpdateServer (2,fdc.dataUpdate.UpdateServer.MINUTE).start(); The second highlighted text („MINUTE‟) indicates the time period for updates. The following are available: SECOND, MINUTE, HOUR, DAY. The first highlighted text („2‟) specifies the frequency of the update. For example, in the above code example updates are carried out every two minutes. Allocate New Sectors Sector allocation is stored within common.types.SectorAllocation. To add new sectors to a specific group‟s allocation simply add the name of the sector (as it is within the feed) to the relevant groups String array. Each string array is named after the group number for a given group, so our sector allocation is in the array, five. 53 Database / Database Interface (Java / mySQL) The data management engine uses abstraction to divide its functionality and reduce the complexity of its implementation. This helps its portability and extendibility as one component can be replaced with another without impacting on the rest of the system. The database itself is set up though a set of SQL scripts which can be quickly deployed on another compatible database server. The SQL syntax was written in a standard manner, close to ANSI SQL-92, so would require only minor changed to port to another database system such as PostgreSQL or Oracle. All code related to connecting to the database is in its own class db.JDBCConnector, which would be the only point in the program where changes would be made if the database was ported to another database platform. Extra functionality can be added to the data management engine without modifying the code that connects to the database. The db.DatabaseManager class has methods for retrieving, adding, removing and updating information in the database using the JDBCConnector. If additional data structures are added to the database the relevant Java data structures will need to be added. These can be added as new Java Classes in the common.types package, which is used across our system. If the structure of the system grows, it may be necessary to output data in new formats, such as SGML or CSV. One of the strengths of the design of the data management engine is that the data type classes can contain their own code to mutate themselves into the required format. Currently code is available for adding data into the database from XML files and Java Arrays and code is available to output data as XML files, Java Arrays and URL encoded Strings. The framework provided for this code makes adding support for other data formats a straightforward task. 54 10.2. Project Specification 55 1. Problem Definition 1.1. Introduction “Stock exchanges exist to provide the facilities of a marketplace where potential investors can put their money to work by purchasing securities and those who already own securities can equally, freely and speedily turn them into cash.” 2 The customer would like a simulation of trading on a stock market to be created. They have appointed five teams to each create independent simulation systems which can co-operate to form a virtual stock trading marketplace (VSTM). This is a network of systems upon which simulated stocks can be traded. Each group is responsible for one of these „systems‟. The stock market is a complex environment that new users could find difficult to understand. Inexperienced users may be hesitant to deal with real money when they don‟t feel comfortable with the market procedure. The customer shall provide a data feed containing historical stock information; hence the groups will be trading on a liquid market. This should be seen as ability to buy or sell a stock quickly and in large volume without substantially affecting the stock‟s price. They expect at least one user to be allowed access to the market via our system. They expect the ability to manage a portfolio containing shares held by the user. A portfolio is a collection of investments held by user(s) to the system. 1.2 User Use Case The user will want to be able to login to the system to trade shares, view their portfolio, and to query share information. The following example gives an idea of how a user might wish to use the system: The user wants to check how their portfolio is performing. They login to their account and view a list of shares they own, with relevant details. Wanting to know more about a particular share they choose to view expanded information on it. Having looked at the data shown they decide they want to sell all their shares in the given company. 2 Stock-broking Today, J. Dundas Hamilton (MacMillan Press Ltd. ISBN: 0-333-24237-8) 56 Having sold these shares the user wishes to buy some more in a different company. They query the shares available over the VSTM to find one of relevant interest to them. Later, having found a share they wish to purchase they are able to buy the share. This is then added to their portfolio. We hope to model this system. 2. Objectives The objectives have been split into sections in order to show distinctions between various aspects of the project. These have been further refined as primary (essential), secondary (preferred), and tertiary („optional extras‟) goals to prioritize our specification and aid our design. 2.1 Core Aim To create a system that simulates buying and selling shares over a virtual stock trading marketplace (VSTM). This is an abstract notion representing the network of group project systems over which users will trade. Users will have their own accounts allowing them to view their details and details of other shares. 2.2 Portfolio Management System We view a portfolio as a collection of investments held by our user(s). 2.2.1 Primary To create a system which allows a user to buy, view and sell shares. The user should be able to query stock details from within our system and the wider VSTM. 2.2.2 Graphical user interface for the end user. Secondary System should be able to support multiple users with individual logins. They should be able to have personalised portfolios. 2.2.3 Tertiary The system should support concurrent connection oriented requests. The system should support concomitant users logged in. 57 2.3 Co-Operation 5.3.2 5.3.3 Primary To exchange stock information with other groups. Implement all standards agreed to by standards committee. Secondary To be able to buy and sell shares, where there are a limited number of shares available (over the whole VSTM). 5.3.4 Tertiary The number of shares within the VSTM remains constant. 3. Context Survey In this section we give an overview of domain research we carried out to see what we are going to model, what has been done before in previous projects and what areas of the domain can be explored. Stock exchanges are organised marketplaces where shares are bought and sold. Stockbrokers act as agents to clients in the buying and selling of shares, since no outside investors can deal on the stock exchange directly. Shares that a client owns are contained within their stock portfolio. There are various systems that allow clients to manage their portfolio. Finesse, Virtual Stock Exchange and TSimLite are examples of projects which model this portfolio management; we hope to learn from the strengths and weaknesses of these. 4.2 FINESSE Finesse (Finance Education in a Scalable Software Environment), is an educational tool created for university-level economics students. Finesse simulates real-time stock trading using a computer system to manage a portfolio of stocks and shares. It has a number of sponsors including Reuters who provide a real-time data feed of stock information from the London stock market. By using real stock data as opposed to simulated stock data Finesse makes the trading experience very true to that of a real stock trader. Finesse has been designed to be very scalable as it is used in many different institutions, and in practise can work as well with tens of students as with hundreds of students. There is no minimum number of students that need to be using the system to make a realistic simulation as real data is being used. Finesse uses a web based interface which simplifies deployment and makes it platform independent on the client side. This web based interface has been criticised by developers working with finesse who have found it limits the flexibility for presenting the data. 58 3.2 Virtual Stock Exchange Virtual Stock Exchange is a web-based stock trading simulator provided by the financial news website MarketWatch.com. Areas of the functionality in marketwatch.com – such as for displaying stock information - are used by the Virtual Stock Exchange. Of particular note is the code to display graphs, which are clear and easy to navigate. The “trading toolbox” provides quick access to buying and selling from any page. In our evaluation of the virtual stock exchange we found the trading procedure to be badly designed. Although the “trade stock” helpfully displays the cash available to buy stocks, it doesn‟t state the current price of the stock being bought; the user has to remember this from the previous screen. 3.3 TSimLite TSimLite is a Windows-based stock trading simulation program developed by a professional stock trader to help improve his trading. It is a freeware program and uses a free financial data stream from DukasCopy. Having a Windows-based user interface makes it easier to organise data relevant to a transaction onscreen however it is less intuitive interface. Due to the lack of documentation trial and error had to be used to discover the programs functionality. Additionally there were a few bugs in the user interface where prices were displayed behind buttons; not surprising given the complexity of developing such a user interface. 3.4 Summary From our context survey we have found that no current stock trading portfolio management systems have provided a user interface we find to be truly intuitive. Web based user interfaces struggled to show all relevant data on a single page; the user often has to swap between pages to find what they require. This highlighted the importance of layout in displaying content. Little user interaction is required in the form of data entry. Consequently the layout of the user interface is a driving factor for an intuitive system. However the TSimLite system suffered from similar problems, leading us to conclude that neither system is ideal. The scope of the project limits the depth of our program from areas such as dynamic graphing and advanced transaction types, making it easier to fit relevant information into one page. 3.5 References Stock-broking Today, J. Dundas Hamilton (MacMillan Press Ltd. ISBN: 0-333-24237-8) McGraw-Hill Dictionary of Modern Economics, Greenwald & Associates (McGraw-Hill) A Guide To Financial Markets, Charles R. Geisst (MacMillan Press Ltd. ISBN: 0-333-30919-7) The Work of the Stock Exchange, Sir Stephen Killik (E. Couchman & Co. Ltd.) Bulls, Bears, and Microcomputers: Programming for Successful Investment, G. T. Childs (Sigma) http://finesse.ac.uk/tags/finesse.html 59 http://game.marketwatch.com/ http://www.tradingsimulation.com/tsimlite/ 4. Requirements Specification 5.4.1 Non-functional Requirements 5.4.1 Reliability 4.1.1.4 The user will be able to login within the JH Lab, John Honey Building. The system will have a mean time to failure of greater than one hour. 4.1.2 Usability 4.1.2.1 A user new to the system will be able to use the systems core functionality (viewing portfolio, buying / selling shares, querying) without reference to documentation. 4.1.2.2 A user new to the system will be able to use the remaining percentage (from 4.1.2.1) with documentation provided. 4.1.3 Robustness 4.1.3.1 The system will be able to restart in less than 10 seconds, upon any fatal exceptions. 4.1.3.2 Data and transaction histories will be logged 4.1.4 Efficiency 4.1.4.1 User event response time will be less than 2 seconds, assuming normal load conditions on the host server. 4.1.5 Co-operation 4.1.5.1 The system will implement all standards agreed to by the standards committee. 5.4.2 Functional Requirements 4.2.1 Portfolio Management System 4.2.1.1 The user will be able to buy shares from any group over the VSTM. 4.2.1.2 The user will be able to sell shares to the market-maker over the VSTM. 4.2.1.3 The user will be able to view their portfolio. 4.2.1.4 The user will be able view expanded details of their shares, including, but not limited to: Code Currency Timestamp Mid price Bid price Offer price 60 4.2.1.5 The user will able to query stock details (listed in 4.2.1.4) within the system and the wider VSTM. 4.2.1.6 The system will have a graphical user interface. This will: Relay all aforementioned data to the user. Inform the user of any errors, should they occur. 4.2.1.7 The system should support multiple users. 4.2.2 Co-operation 4.2.2.1 The system will be able to transfer stock data (including, but not limited to 4.2.1.4 bullet list) over the VSTM. 5. Terminology 5.1 Project Terminology System: A collection of components organized to accomplish a specific function or set of functions3. In our case this includes all the software our group writes. User: A person that uses the system. Virtual Stock Trading Marketplace (VSTM): This is an abstract notion representing the network of group project systems over which users will trade. 5.2 Domain Terminology Stock Market: Where stocks and shares are bought and sold; a market in which the shares of corporations are traded. Stocks / Shares: A stock, also referred to as a share, is commonly a share of ownership in a corporation. Code: Share code. The 1 – 5 letter abbreviated a company uses for listing on the stock exchange. Mid Price: The mid point between the bid and offer price quote in the market. Buy Price: the price at which another party will buy the stock. Offer Price: The price an investor can buy from the market, also called the ask price. Data Feed: Stock data supplied by the customer. Timestamp: The time that the stock information was taken from the data feed. Portfolio: a list of the financial assets held by an individual (the user). Liquidity: ability to buy or sell an asset quickly and in large volume without substantially affecting the asset's price. 3 IEEE Standard 610.12 61 10.3. Project Plan 62 1. Document Overview 1.1. Introduction to Problem The customer would like a simulation of trading on a stock market to be created. They have appointed five teams to each create independent simulation systems that can co-operate to form a virtual stocktrading marketplace (VSTM). This is a network of systems upon which simulated stocks can be traded. Each group is responsible for one of these „systems‟. Please refer to the project specification for a more comprehensive explanation of the problem. 1.2. Development Model We have decided to adopt the spiral model4 of software development (see figure 1). This system best represents the timescale and targets set out by the customer. While the major project milestones tend to suit the waterfall model, this model of development lacks the flexibility required for a project where the risk of requirements slippage is high. We can assume this, as the customer appears to be unsure about the exact nature of the product they want, and is vague about exact requirement details. The spiral model allows for this kind of evolutionary development, whilst maintaining the documentation structure of the waterfall model. 5 4 5 Software Engineering: A Practitioner's Approach, Roger S Pressman (McGraw Hill Higher Education, 2004), Page 35. Spiral Model Diagram, taken from http://www.stsc.hill.af.mil/crosstalk/2001/05/boehm.html 63 Figure 1. "The main difference between the spiral model and other software process models is the explicit recognition of risk in the spiral model."6 1.3. System Software modules From a high level perspective the system can be divided into two components, the Market Maker component and the user management component. The Market maker component consists of the following modules, the database module, the financial data centre module, the VSTM interfacing module and the feed Parser. The User management component consists of the accounts module, the user management system, the web interface and the accounts module. These modules are designed to implement specific parts of the requirements, (as seen in our requirements document) with the intention that when the modules and components are viewed as a whole system, all the requirements outlined in our requirements document will have been fulfilled. The modules have been divided into 3 unique areas based on the language of implementation that we intend to use. These have been assigned to members of the group according to experience and ability in the language of implementation and the expected size of the module. 1.4. Communications & Standards Being a distributed system communication between nodes is critical to the operation of the system. To ensure tight communication each group has agreed to hold weekly meetings to discuss protocols for communication. These are known as Standards Meetings. In these meetings only issues involving inter group communication can be debated, thus avoiding discussion on implementation details. These meetings among others are discussed in section in 3.3. 1.5. Testing & Documentation In this section of the document we discuss unit tests, function test, white box system testing, black box alpha testing, black box beta testing. We also discuss maintaining a high quality of documentation by allocating various tasks to individual group members to increase productivity, and staging regular meetings to bring our material together and through discussion and review of the material ensure that it is of high quality. 1.6. Project Monitoring We have allocated tasks to individual group members, with deadlines for those tasks. From this we have constructed a Gantt chart that details the deadlines of the project modules and the group members assigned to them. 6 Software Engineering 7 - Ian Sommerville (Pearson Addison Wesley, 2004). 64 2. Module Overview and Implementation This section looks at the structure of the envisaged system, describing the purpose of each module. The following diagram shows an overview of this system. Another diagram split into languages of implementation is shown below this. Additionally, a use case model and sequence diagram based on this system can be found in sections 8.2 and 8.3 of the appendix. High Level Overview 65 Language Based Organisation Diagram. 2.1. Market Maker Component 2.1.1. Financial Data Centre This is the core of the stock trading simulation. Unlike other modules described here its size requires it to be sub-divided into sub-modules. These are described here: Interfaces The data centre should be loosely coupled with the rest of the program. We aim to achieve this by having two interfaces - one for incoming data and one for outgoing data. Financial Data Processing The data provided from the feed doesn‟t contain all the information users will need for their portfolio. The aim of this sub-module is to provide this extra information – for example, commission - by processing the available data. Another use of this module would be the calculation of indices for given shares – the 100 most valuable shares in the London Stock Exchange would be in the FTSE 100. Share prices can be used to calculate overall market performance and other indicators of this nature. Logging To provide means of testing and auditing of market and user data a logging function is needed. This should simply log the actions of the module (such as the selling of shares) and save these logs to an external file. 66 Updating The database needs to be updated periodically with the latest share prices. The updateDB module controls the timing of these updates, and ensures that historical data is stored and accessible. Its design should allow the timing of these updates to be altered, as no information has yet been given on how the data feed is updated. 2.1.2. Feed Parser This parses stock data from the feed provided and presents it in a format that the financial data centre can interpret; a DOM tree (an xml file rendered as an object within our application). 2.1.3. VSTM Interfacing Module Transmits and receives XML over the VSTM to other groups. This should have the ability to handle multiple incoming and outgoing connections concurrently based on a TCP socket system. This should be designed to be easily modifiable as a result of changes agreed in standards meetings. 2.1.4. Database This encompasses the actual implementation of the database and the functions required to parse data between it and the data centre module. The database will store current and historical share information for our market, and a transactions history. We intend to use the JDBC package in JAVA to communicate with the database, having received data from the Financial Data Centre Module (2.1). 2.2. User Management Component 2.2.1. User Management System As can be inferred from the title this module administers user accounts and manages all communication from this component to the Market Maker section of the system (2.1). Interaction with the user interface is its other main function. All user requests go through this module to avoid issues with access rights taking place. This is designed so as to abstract the issue of multiple users away from the Market Maker Component (2.1). 2.2.2. Web Interface The user interface should be viewable on a graphical web browser which has a flash plug-in installed. The interface will be created on a Windows XP computer, but should be tested on the Linux distribution installed in Labs at the time of the acceptance test. The focus of this module is on providing a reliable, easy to understand interface that can accurately display and interpret the information created in other areas of the system. It should show a dynamic representation of data on the fly. This module is one of the key elements of the system, as the presentation of stock data is vitally important in its understanding. 67 Section 8.1 in the appendix shows mock-up drawings of a possible user interface. 2.2.3. Accounts This, like 2.1.4, encompasses the implementation of the user accounts database and the functions required to parse data between it and the User Management System (2.2.1). The database needs to store user details (username, password, access level etc.) and their portfolio data. The latter will need to include references to any company shares, stored in the share database (2.1.4). We also plan to store transaction histories here, in order to be able display more relevant information to users. 3. Communications 3.1. Group Meetings During term-time the group intends to meet a minimum of one afternoon a week for project work. The actual time spent in this activity is dependant on the workload of other modules at any given time. During, but not limited to these meetings, we will discuss progress made since the last meeting and any problems encountered or anticipated. At the end of these meetings the group will crosscheck notes to ensure that no member is unsure of their charge. Out-with these meetings communication should preferably be verbal, however failing that, e-mail through the group mailing list ([email protected]) is available. 3.2. Supervisor Meetings During term-time the group will meet at least once a week with our supervisor to discuss progress and ensure that we are on target with our implementation and timescale. The supervisor has stated that he can reply to e-mails for any problems requiring immediate attention. 3.3. Standards Meetings As stated in 1.4 the groups involved in this project have agreed to send a representative to weekly standards meetings. These meetings are designed to create agreement on protocols for communication between groups. Other groups can be contacted out-with this meeting (in person or via [email protected]), but decisions on standards issues can only be made and verified during the meeting. It has been agreed that no person can represent his or her group in consecutive meetings. 3.4. Customer Meetings When requested or granted by the customer, one representative from the group will attend a customer meeting. The customer can be contacted via the module co-ordinator out-with these meetings. 68 4. Standards 4.1. Header Standards Given that code written by one group member will often be reviewed or modified by another we feel that it is essentially to create a standard for comments within code. Class File Header Class Name Author Name (Author e-mail address), Group Name / Number Date of Creation „See also‟ field Summary of Class Functionality Example /** Title: FeedParser Author: Angus Macdonald (adm15), Group 5 Created on 29/11/05 See: Other related documents This parses stock data from the feed provided and presents it in a format that the financial data centre can interpret; a DOM tree. */ In areas where JavaDoc can be appropriately used we will endeavour to utilize this. Specific functions or methods within the class should be commented with a summary of functionality and comments on parameters and return values. 4.2. Inter Group Communication (Standards) This section partially deals with decisions already made in standards meetings, as described in 3.3. The groups have agreed to use TCP sockets as a means of communicating between groups, along with the SHEEP protocol7 for error handling. 7 http://en.wikipedia.org/wiki/Standard_for_Handling_of_Exception_Error_Protocol_%28SHEEP%29 69 5. Testing 5.1. Testing Strategies Software testing is a vital part of the software development process that can reveal both pitfalls with the design and errors made during the implementation. Testing will be performed progressively through the implementation in order to identify problems as soon as possible. With this in mind we will be using a number of levels for testing, starting at individual functions and gradually integrating the various components until the entire system is in scope. Function Level Testing At design level, the inputs and outputs of each function (known as methods in Java) will be tested but not necessarily documented. Creating documentation at this level would result in an unnecessarily verbose testing document. Unit Level Testing The units (known as classes in Java) provide a logical way of dividing up the tasks between team members. These tests essentially integrate related functions to test their compatibility. The purpose of unit level testing is not to check the contents of individual functions (this should have been done previously), but to test the interactions between functions. As this testing progresses, it will be used at an increasingly high level. First functions are tested together, then the modules that they form, until eventually the connectivity of system components has been tested. As various deadlines are reached and prototypes created unit level testing may at times involve communications with other groups. However the majority of this testing will take place at system level. System Level Testing Once the units have been completed and tested individually, full integration of the software can be performed. Tests performed at system level are carried out through the user interface, using tests to show that the system performs correctly over possible inputs. As the software is part of a distributed system, it should be tested that it performs correctly under correct, incorrect and malicious behaviour from other systems. This aspect of system level testing is most important, as previous levels of testing will be unable to account for this aspect. Alpha and Beta Testing Once internal testing has been performed and the system appears to be correct, to widen the scope of the testing, alpha and beta tests will be performed. Alpha testing involves using the software over a 70 period of time within the organisation - in this case the group. The software will be tested in the Junior Honours lab where the integration test will take place. Beta testing involves distributing the software to a small group of testers. These testers should preferably not be computer scientists to simulate use by a non-expert user. 6. Documentation Following the conclusion of the JH project in April team members will not be available to provide support for the system. The system is likely to be deployed worldwide by our customer who wishes to provide educational establishments and corporate training facilities with a stock-trading marketplace. For this, both user and technical documentation needs to be produced so the software can be installed, configured and used. Based on these assumptions we have identified four types of users, all requiring documentation - managers, system technicians, programmers, and users. We intend to create documentation for each of these levels. 6.1. Management Level Documentation will be a functional overview of the system. This document should clearly specify the purpose and scope of the project. As an example of usage, a company manager could use this document to justify usage of the system. This documentation should be created towards the end of development when it is clear what functionality the system has, and what aspects are particularly noteworthy. 6.2. User Level A manual aimed at beginner users to the system, describing how to use the various features available. After the software has been completed and tested internally, a user manual will be written. The focus of this documentation will be the user interface as this is the area users will come into contact with. The user manual will be tested for clarity when it is given to beta testers along with the software. Ideally the testers should only require help should a bug be encountered. A team member other than the coder for a given section will ideally create this level of documentation. This is based on the theory that programmers tend to miss out small but significant sections of their module, that they deem too trivial to mention. 6.3. System Technician Level Documentation will comprise of instructions on setting up the system. This document should provide give step-by-step instructions for installing, configuring and troubleshooting the software. The nature of this document means that it may be written in a more technical style to the user manual, and will be tested by peers of reasonable IT skills. To make this testable we define the latter statement as meaning someone studying second year computer science or lower. 71 6.4. Programmer Level This should be documentation on the code structure of the program. If a developer wished to expand on the implementation following the integration test they could use this documentation to familiarise themselves with the code, program structure and other relevant implementation details. This level of documentation includes commented code and Javadoc created during implementation. We have designed standards for comments, detailed in section 4.1. 7. Project Monitoring 7.1. Gantt Chart AM = Angus Macdonald, GB = Gregory Bigwood ES = Ewan Summers, DF = Duncan Fowler As the project report includes other documents created throughout the project this is listed as starting at once. 7.2. Risk Identification Risk Probability Tolerability Agreed Action Loss of team Low Low Redistribution of workload evenly – loss of 72 member Dramatic increase in functionality High Low scope Identify main goals, attempt to achieve them, prioritise goals, allow more time for deadline, due to inadequate time allowances Personal factors Med High Redistribution of tasks Change in High Med Use spiral model – flexible to have prototypes requirements (to show customer) and maintain communication. In event of change the previous cycle can be visited. External factors dept Low Catastrophic problems System security flaw Attempt best case solution extend deadlines is possible Medium Low Pool all resources to combat flaw. 73 8. Project Plan Appendix 8.1 Graphical User Interface Diagrams These diagrams are indicative of the appearance of the interface. Not all planned screens are shown here (these screens show views for the stock trader). Login page Portfolio page Query page Sell page Buy page 74 8.2 Use Case Model Use case model for system visualised in section 2. 8.3 Sequence Diagram Sequence diagram for Stock Trading Using their Portfolio. 75 10.4. Interim Report 76 This report aims to illustrate the progress made by the group since we outlined our schedule in the project plan. Progress since submitting the report was initially slow, in part due to the increased focus placed on exam revision. The group spent some time researching various technologies needed to achieve a reliable and secure connection between our flash interface and Java implementation. In addition we looked at more imaginative methods of parsing, as the current Xerces implementation is computationally expensive. While we are reluctant to alter fully functional modules at this stage, initial parsing may in future be altered to a partial XSLT (Xalan-J) implementation. Once exams were completed the group took advantage of the inter-semester break, spending a week implementing the core system. These areas, identified as critical to the systems operation, included the parsing of XML, the database, and a secure connection between Java and Flash. In addition, the group created formal plans for the structure of the User Management System, and Financial Data Centre (introduced in the project plan). Progress with XML parsing and the creation of a system update module was relatively unhindered; however the creation of a request-handling module was restrained by a lack of agreement on intergroup standards. As a result proposals were drawn up to present to the standards committee at the next meeting. The group is currently in charge of all inter-group standards as we control the XML schema for communication and are responsible for updating it. Group members working on the Flash-Java connection made slow progress initially due to difficulties in connecting securely to the interface via Apache Tomcat - the servlet handler being used. Following further focus on this problem the connection is now secure and fully functional. Despite these setbacks we are satisfied with the progress that has been made since November, and are confident that our implementation is adaptable enough to cope with further requirements changes. These changes were identified in the project plan as having high-risk exposure, and so all subsequent design has taken this into account. As a result we have been able to adhere to deadlines as laid out in our project plan Gantt chart. As our plan was drafted on the vague description initially provided by the customer, the evolution of his requirements has slowly rendered a number of our requirements incomplete, and produced others. As a result of these changes a logging ability (for transactions) has been added to the initial requirements. While intended for financial auditing, this function also provides us with an additional tool for debugging. Development to date has been modular, with each team member working on their own modules constructively. The following table shows the areas in which group members have been involved. 77 Task Group Members Involved User Interface Ewan Tomcat (Flash – Java connectivity) Greg User Management System Greg Logging Function Angus Database and Database interface Duncan Request Handling Angus Feed Parsing Angus XML Standards (Schema) Angus Our work towards the end of week 3 focussed on the creation of another prototype, to be used in the next class integration test – formally called a TUP. The test was designed as a trial for our updated communication schema, and was successful bar a number of minor problems. The next milestone for the project is the unofficial class integration test on 10 th March, and we have been working to this end. 78 10.5. User Manual The Defero stock trading system allows secure, multi-user access from anywhere in the world with Internet access. Through your Internet browser with a flash player installed, you can buy, sell and search for shares. You can manage your portfolio without ever having to leave your computer. Installation Please ensure you have flash player installed in your desired Internet browser. Open the Internet browser and enter the following URL and press return / enter: https://138.251.213.23:20065/defero You will be greeted with the login page. If you have a user account setup please refer to the logging in section, otherwise please read the accounts section. Accounts To manage your portfolio you must have a valid account. If you already have an active account you can skip this section. To setup a new account please contact the system administrator. You will be given a username and password which you can then use to access your portfolio. If you wish to change your password, you can do so from user options while logged in. Logging in To login please enter your user name into the user name field and your password into the password field. 79 Click on the login button to login. If login is successful your portfolio will be displayed otherwise a friendly login failure message will be shown. If a timeout occurs you will be taken to this screen. A timeout after five minutes. Portfolio Your shares will be displayed in a scrollable table with the following information: Code: This is a word with maximum length of 4 letters that represents the share. Mid price: This is a rough average of the bid price and the offer price. Bid price: This is the highest price that the market maker is willing to pay for a specific security. Offer: This is the lowest price acceptable to a market maker for a specific security. Held: This is the number of shares you hold for a particular share. Available: This is the number of shares available for a particular share. Note on available: This is not implemented across the share network. All shares controlled by the Defero sector will have this value, shares controlled by other market makers will have value N/A. You can sort this table ascending or descending order by clicking on the Code column. Below the table your balance will be displayed, portfolio worth (the amount you would earn by selling all the shares in your portfolio), the currency and the exchange. 80 Main menu The main menu is the set of buttons located at the bottom of the portfolio, options, buy and sell screens. The options button displays the user options. View portfolio displays the user portfolio details. The Buy shares button allows you to search for and select shares to buy. The Sell button allows you to sell shares from your portfolio. By clicking the Logout button you will be logged out from your account. Options The interface colour scheme can be changed by selecting a scheme and pressing the change scheme button. There are 5 schemes to choose from, the default is blue. The account password can be changed by entering your old password, a new password and the new password again as confirmation. Click the change password button to set the new password. 81 Buy To buy a share you must first search for it. You can do this by selecting the code, or price less than, less than equal to, equal to, greater or equal to or greater than a value that is entered. As shown on the screenshot on the left, click on the search button to retrieve the search result. If you wish to display all shares you can simply click on the display all shares button. After a period of time the search results page will be displayed (as shown on the screenshot on the right). The share results will be displayed in a scrollable table which contains the following details: Code: This is a word with maximum length of 4 letters that represents the share. Display name: This the name of the company in which the share is held. Price: This is the highest price that the market maker is willing to pay for a specific security. Sector: This is the sector the share is grouped in. Last updated: This is the time the share details were last updated. The scrollable table can be sorted by code, display name and sector in ascending and descending order. To proceed buying a share, click on the share you wish to purchase. 82 After clicking on a share you will be forwarded to the buy selection screen ( as shown on the screenshot on the left). This displays extra details about a share and allows a number of shares that you want to buy to be entered. Clicking on the back button will take you to the search results. If you click on the next button a confirm window will appear displaying the official share code, offer price and number ( as shown on the screenshot on the right) To close the window, press the cross in the top right of the window or click the cancel button. This will take you back to the buy selection screen. Click submit to buy the share. If the buy is successful you will be forwarded to the success screen, otherwise an error will be displayed in the top right. Sell When the sell button is clicked your portfolio details are shown. You can click a share to forward to the sell selection screen as shown above. Click on the next button and a confirm window will appear. Click submit to sell the share. If the sell is successful you will be forwarded to the sell success screen, otherwise an error message will be displayed in the top right of the screen. By clicking back you will return to sell view of your portfolio. 83 Logout To logout from the system click the logout button. This will take you to the login page. 84 10.6. XML Schema Query Request Schema <?xml version="1.0" encoding="utf-8"?> <!-- Written by Angus Macdonald, Group 5 --> <xsd:schema xmlns:xsd="http://www.w3.org/2001/XMLSchema" version="1.3"> <xsd:element name="queryRequest" type="queryRequest"/> <xsd:attribute name="type"> <xsd:simpleType> <xsd:restriction base="xsd:string"> <xsd:enumeration value="EQ"/> <xsd:enumeration value="LT"/> <xsd:enumeration value="GT"/> <xsd:enumeration value="LEQ"/> <xsd:enumeration value="GEQ"/> </xsd:restriction> </xsd:simpleType> </xsd:attribute> <xsd:attribute name="group"> <xsd:simpleType> <xsd:restriction base="xsd:integer"> <xsd:minInclusive value="1"/> <xsd:maxInclusive value="5"/> </xsd:restriction> </xsd:simpleType> </xsd:attribute> <xsd:complexType name="queryRequest"> <xsd:choice> <xsd:element name="code" type="xsd:string"/> <xsd:element name="currency" type="xsd:string"/> <xsd:element name="timestamp" type="xsd:string"/> <xsd:element name="bid" type="xsd:decimal"/> <xsd:element name="mid" type="xsd:decimal"/> <xsd:element name="offer" type="xsd:decimal"/> <xsd:element name="exchange" type="xsd:string"/> <xsd:element name="sector" type="xsd:string"/> <xsd:element name="official_code" type="xsd:string"/> <xsd:element name="disp_name" type="xsd:string"/> <xsd:element name="dividend" type="xsd:string"/> <xsd:element name="div_pay_date" type="xsd:string"/> </xsd:choice> <xsd:attribute name="group" use="required"/> <xsd:attribute name="type" use="required"/> </xsd:complexType> </xsd:schema> 85 Query Reply Schema <?xml version="1.0" encoding="utf-8"?> <!-- Written by Angus Macdonald, Group 5 --> <xsd:schema xmlns:xsd="http://www.w3.org/2001/XMLSchema" version="1.3"> <xsd:element name="queryReply" type="queryReply"/> <xsd:complexType name="queryReply"> <xsd:choice> <xsd:element name="share" type="share" minOccurs="0" maxOccurs="unbounded"/> <xsd:element name="error" type="error"/> </xsd:choice> <xsd:attribute name="group" use="required"> <xsd:simpleType> <xsd:restriction base="xsd:integer"> <xsd:minInclusive value="1"/> <xsd:maxInclusive value="5"/> </xsd:restriction> </xsd:simpleType> </xsd:attribute> </xsd:complexType> <xsd:complexType name="share"> <xsd:sequence> <xsd:element name="code" type="xsd:string"/> <xsd:element name="currency" type="xsd:string"/> <xsd:element name="timestamp" type="xsd:string"/> <xsd:element name="bid" type="xsd:string"/> <xsd:element name="mid" type="xsd:string"/> <xsd:element name="offer" type="xsd:string"/> <xsd:element name="exchange" type="xsd:string"/> <xsd:element name="sector" type="xsd:string"/> <xsd:element name="official_code" type="xsd:string"/> <xsd:element name="disp_name" type="xsd:string"/> <xsd:element name="dividend" type="xsd:string"/> <xsd:element name="div_pay_date" type="xsd:string"/> </xsd:sequence> </xsd:complexType> <xsd:complexType name="error"> <xsd:sequence> <xsd:element name="number" type="xsd:integer" /> <xsd:element name="description" type="xsd:string" /> </xsd:sequence> </xsd:complexType> </xsd:schema> 86 Trade Request Schema <?xml version="1.0" encoding="utf-8"?> <!-- Written by Angus Macdonald, Group 5 --> <xsd:schema xmlns:xsd="http://www.w3.org/2001/XMLSchema" version="1.3"> <xsd:element name="tradeRequest" type="tradeRequest"/> <xsd:attribute name="group"> <xsd:simpleType> <xsd:restriction base="xsd:integer"> <xsd:minInclusive value="1"/> <xsd:maxInclusive value="5"/> </xsd:restriction> </xsd:simpleType> </xsd:attribute> <xsd:attribute name="type"> <xsd:simpleType> <xsd:restriction base="xsd:string"> <xsd:enumeration value="buy"/> <xsd:enumeration value="sell"/> </xsd:restriction> </xsd:simpleType> </xsd:attribute> <xsd:complexType name="tradeRequest"> <xsd:sequence> <xsd:element name="official_code" type="xsd:string"/> <xsd:element name="currency" type="xsd:string"/> <xsd:element name="price" type="xsd:decimal"/> <!-- This will be the OFFER price for buyRequests and the BID price for SellRequests --> <xsd:element name="quantity" type="xsd:integer"/> <xsd:element name="transaction_id" type="xsd:string"/> </xsd:sequence> <xsd:attribute ref="group"/> <xsd:attribute ref="type"/> </xsd:complexType> </xsd:schema> 87 Trade Reply Schema <?xml version="1.0" encoding="utf-8"?> <!-- Written by Angus Macdonald, Group 5 --> <xsd:schema xmlns:xsd="http://www.w3.org/2001/XMLSchema" version="1.3"> <xsd:element name="tradeReply" type="tradeReply" /> <xsd:attribute name="group"> <xsd:simpleType> <xsd:restriction base="xsd:integer"> <xsd:minInclusive value="1" /> <xsd:maxInclusive value="5" /> </xsd:restriction> </xsd:simpleType> </xsd:attribute> <xsd:attribute name="type"> <xsd:simpleType> <xsd:restriction base="xsd:string"> <xsd:enumeration value="buy"/> <xsd:enumeration value="sell"/> </xsd:restriction> </xsd:simpleType> </xsd:attribute> <xsd:complexType name="tradeReply"> <xsd:choice> <xsd:element name="confirmation" type="confirmation" /> <xsd:element name="error" type="error" /> </xsd:choice> <xsd:attribute ref="group" use="required" /> <xsd:attribute ref="type" use="required" /> </xsd:complexType> <xsd:complexType name="confirmation"> <xsd:sequence> <xsd:element name="official_code" type="xsd:string" /> <xsd:element name="price" type="xsd:string" /> <xsd:element name="quantity" type="xsd:string" /> <xsd:element name="transaction_id" type="xsd:string" /> </xsd:sequence> </xsd:complexType> <xsd:complexType name="error"> <xsd:sequence> <xsd:element name="number" type="xsd:integer" /> <xsd:element name="description" type="xsd:string" /> </xsd:sequence> </xsd:complexType> </xsd:schema> 88 10.7. SHEEP Codes All groups agreed to use the SHEEP system for maintaining inter-group error message. Our team was responsible for maintaining this list. The following document specifies and explains every SHEEP code used. 100 – Invalid 110 – Invalid XML 120 – Invalid Request Format 130 – Invalid Request Content 200 – No Deal 210 – Price too low 220 – Price too high 230 – Not enough shares available (what?) 240 – Too many shares requested 250 – Wrong Market Maker 300 – Internal Difficulties 310 – Not Ready 400 – Feed Difficulties 410 – Data Incomplete 500 – Not Found 510 – No Shares Found Intentions 100 – Invalid 110 – Invalid XML <queryRequest <code>BT</code> </queryRequest> 120 – Invalid Request Format <tradeRequest> <code>BT</code> <currency>GBp</currency> … 89 </tradeRequest> This doesn‟t match the schema. Code isn‟t an element in a tradeRequest. 130 – Invalid Request Content <tradeRequest> … <quantity>12.33523522</quantity> … </tradeRequest> This matches the schema but the contents of the elements are flawed. 200 – No Deal Designed to be used when the answer to a tradeRequest isn‟t a confirmation. 210 – Price too low The price a group has tried to buy at is lower than the offer price. E.g. trying to buy shares in BT at 12.00 when the offer price is 13.66. 220 – Price too high The price a group has tried to sell at is higher than the bid price. This might occur if you try to sell shares in BT at 12.00 when the bid price is 10.35. The other group tells you this is too high by sending this sheep code. 230 – Not enough shares Alice tries to break the system by selling shares she doesn‟t own; the system replies with „230‟. This tells her that she can‟t sell this many shares, as she doesn‟t own enough. 240 – Too many shares requested Undeterred by her last attempt Alice tries to break the system again - by buying 2,000,000,000,000,000 shares in BT. Your group replies with 240, and includes the number of shares available in the description element. 250 – Wrong Market Maker You don‟t go to a cheese shop to buy a television, so why go to group 3 when you want to buy shares in a software company? Terrible analogy aside, this is the tag you return when you someone requests to buy shares from you, and you‟re not in control of that sector. 300 – Internal Difficulties 90 310 - Not Ready Send this when your code isn‟t working, or if you just can‟t be bothered. 400 – Feed Difficulties 410 – Data Incomplete Use this code if access to the feed is required, and it is displaying an error message. In addition this can be used to indicate that the bid and/or offer price is at 0 so you can‟t trade on this share at the moment. 500 – Not Found 510 – No Shares Found You‟ve searched for „GAME‟ when this isn‟t a share code. The other group replies to tell you that no shares matching this were found; 510. For further information on SHEEP please refer to: http://en.wikipedia.org/wiki/Standard_for_Handling_of_Exception_Error_Protocol_%28SHEEP%29 91 10.8. User Survey Throughout development the creation of a simple, easy-to-use interface was a priority. In order to ensure this the team tested the interface on a number of naïve users – all students who don‟t study Honours Computer Science or Economics. This section contains the results of the survey; 92 93 94 95 10.9. Sector Allocation Group 1 Asset managers Group 5 Banks Biotechnology Building materials Brewers Food processors Builders merchants Inv.tst international Clothing + footwear Inv.tst.geog.speclsts Computer hardware Med equip + supplies Consumer electronics Media agencies Diversified industry Pharmaceuticals Education + training Shipping and ports Electrical equipment Eng. Contractors Group 2 Environmental control Airlines + airports Food + drug retailers Business support Forestry Chems.advanced mats. Furn. + Floorcovering House building Gambling Life assurance Gas distribution Other construction Gold mining Real estate dev. Hospital management Tobacco Hotels Water Hsehold apps+hsewares Insurance brokers Group 3 Aerospace Consumer finance Distillers + vintners Inv.tst.european Investment banks Investment trust uk Leisure equipment Publishing + printing Transaction + payroll Internet Inv.tst.emerging mkts Inv.tst.venture + dev Investment cos.(6) Oil + gas expl/prod. Other financial Other health care Other inv. Trusts Paper Personal products Photography Property agencies Group 4 Security and alarms Auto parts Semiconductors Computer services Software Electricity Electronic equipment Insurance non-life Leisure facilities Other mining Restaurants and pubs Subscr. Entertainment Telecom equipment Telecom fixed line Telecom wireless Textiles+leather gds Venture capital trust Retailers e-commerce 96 10.10. Terminology Economics Terminology This section explains terminology used with reference to the mechanics of stock markets. Stock Market Where stocks and shares are bought and sold; a market in which the shares of corporations are traded. Market Liquidity Market liquidity refers to the ability to quickly buy or sell a share without causing a significant movement in the price. We wanted large sales or purchases to affect stock prices, but this was unachievable given the resources and time we have. Market Maker A group authorized to create and maintain a market; one that stands ready to buy or sell shares at bid or offer prices throughout the business day. Market makers attempt to profit from the bid/offer spread. We are not a complete market maker as we can‟t provide liquidity (see above); however we maintain allocated sectors in a market. Bid / Mid / Offer Prices The bid is the highest price that market maker is willing to pay for a specific share. The offer is the lowest price acceptable to a market maker of the same share. The highest bid and lowest offer are quoted, and the difference between the two prices is called the “spread”, giving the market maker (us) commission. We, the market maker: Sell you shares at the offer price (asking price) – the lowest price acceptable to us. Buy shares back from you at the bid price – the highest price acceptable to us. The offer price is the higher of the two, meaning you lose money if you sell back to the market maker (us) straight away – this is the spread, and its our method of getting commission. The mid price is the price quoted if not otherwise stated (i.e. in the view all shares list). This is a rough average of the other two – the mid. 97 Selling Short A technique employed by investors who believes the market price of a share will drop. The investor borrows stock, which he then sells (even though he doesn't own it). If the price of the stock drops, the investor can buy the same stock for less than what he originally sold it for, and make a profit, after paying the market maker commission for borrowing the stock. The investor must return a like number of shares of the borrowed stock to the stock lender. If you believe the market price of a share will drop you can sell short: „Borrow‟ shares, and then sell them – even though you don‟t own them. If the price of the stock drops the investor can buy the stocks back for less than they sold it making a profit. Buying Long This term refers to when a person owns a share, with a view to it increasing value. This long position would be established by buying, and would profit when the price of the share goes higher. It is the opposite of a short position. This is what most people would consider normal activity on the stock market. Sector The category in which funds or companies are grouped – essentially the type of work they operate in. For example, Tesco are in the Food & Drug Retailers sector. Project Terminology This section explains terminology used in the context of the project. Virtual Stock Trading Marketplace (VSTM) An abstract notion representing the network of group project systems over which users will trade. Distributed Attack Program (DAP) The term used to describe the program(s) the team wrote for use in robustness testing, also performing various types of distributed attacks on groups‟ servers during the final project demonstration. Testing Universal Progress (TUP) This is the name given to the fortnightly integration tests all groups participated in. Protocol The formal description of message formats and the rules that groups of computers must follow in order to exchange those messages. Schema A description of the structure and rules for an XML document type. 98 Concurrent Versioning System (CVS) Used to back-up and store a history of the changes made to a document or source code file during development. System A collection of components organized to accomplish a specific function or set of functions 8. In our case this includes all the software our group writes. User A person that uses the system. Virtual Stock Trading Marketplace (VSTM) An abstract notion representing the network of group project systems over which users will trade. Feed Terminology This section explains terminology used within the data feed provided by the customer. This data is also sent in inter-group communications, specified within the XML Schema (see page 85). Code Share code. The 1 – 5 letter abbreviated a company uses for listing on the stock exchange. Mid Price The mid point between the bid and offer price quote in the market. Buy Price The price at which another party will buy the stock. Offer Price The price an investor can buy from the market, also called the ask price. Data Feed Stock data supplied by the customer. Timestamp The time that the stock information was taken from the data feed. 8 IEEE Standard 610.12 99