1
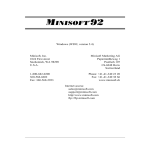
POWER QUALITY MONITOR
ENGLISH
User‘s manual
1
C.A 8352
2
Meaning of symbol:
WARNING! Consult the user’s manual before using the instrument.
In this user’s manual, instructions preceded by this symbol, if they are not carried
out as shown, can result in a physical accident or damage installations.
Thank you for purchasing a C.A 8352 Power Quality Monitor.
To get the best service from this instrument:
• read carefully this user’s manual,
• respect the safety precautions.
SAFETY PRECAUTIONS
• It is essential to avoid all possible obstruction of the ventilation grills situated
on the left side of the monitor.
• Respect the environmental conditions for use.
• Respect the value and type of fuse or risk damaging the instrument and
rendering the warranty void.
• This instrument may be used on category III installations, for voltages not
exceeding 500 V in relation to the earth for the current measurement inputs,
1000 V in relation to the earth for the Amp FLEX flexible sensor inputs and 600
V in relation to the earth for the voltage measurement inputs (as per IEC 664-1
Ed. 92).
• Category III equipment is fixed installation equipment, where reliability and
availability of the equipment are subject to particular specifications.
• Make sure to only use accessories of overvoltage category and voltage rating
at least equal to those of the product.
• Connect or disconnect USB devices only when system is completly initialised.
WARRANTY
Our warranty is applicable, except for expressed stipulation otherwise, for twelve
months after the date on which the equipment is made available (extract from our
General Conditions of Sale, available on request).
3
4
CONTENTS
1
Introduction ......................................................................... 9
2
Presentation ...................................................................... 10
2.1
2.2
OVERVIEW OF THE UNIT ....................................................................10
SCREEN...........................................................................................11
3
Setting-up .......................................................................... 11
4
Specifications.................................................................... 11
4.1
4.2
4.3
4.4
4.5
4.6
5
C.A 835 2 SPECIFICATIONS ..............................................................11
INPUT SPECIFICATION .......................................................................13
MAIN SYSTEM ..................................................................................14
GENERAL SPECIFICATIONS ................................................................14
ENVIRONMENTAL CONDITIONS...........................................................14
COMMUNICATIONS ...........................................................................14
Specifications for sensor and pad................................... 15
5.1
SPECIFICATION OF THE AMP FLEX A195 WITH C.A 8352 (ACCESSORIES)
15
5.2 SPECIFICATION OF THE CLAMPS C 145..............................................16
5.3 SPECIFICATION OF THE CLAMPS MN95..............................................18
5.4 SPECIFICATIONS FOR THE ANALOGUE INPUTS FOR PAD (PROGRAMMABLE
ACQUISITION DATA)....................................................................................19
6
Maintenance ...................................................................... 21
6.1
6.2
6.3
6.4
REPLACING THE MAINS FUSE .............................................................21
CLEANING THE INSTRUMENT’S CASING ...............................................21
METROLOGICAL VERIFICATION ..........................................................21
REPAIRS ..........................................................................................21
7
To order ............................................................................. 22
8
Appendix............................................................................ 24
8.1
8.2
8.3
8.4
8.5
8.6
CONTROLS AND CONNECTORS ..........................................................24
INPUT CONNECTORS .........................................................................25
CONNECTOR PINS FOR CURRENT MEASUREMENT ...............................25
REAR CONNECTORS .........................................................................26
ACCESSORIES..................................................................................27
MATHEMATICAL FORMULAS FOR THE CALCULATION OF DIFFERENT
PARAMETERS .............................................................................................28
9
Setting procedure before measurement ......................... 33
9.1
OVERVIEW OF GENERAL SETUP-OPTIONS (MOP) ...............................33
5
9.2
9.3
9.4
10
Measurement ..................................................................... 92
10.1
10.2
10.3
10.4
10.5
10.6
10.7
10.8
10.9
10.10
10.11
10.12
11
SYSTEM SETTINGS ...........................................................................34
STORING .........................................................................................69
SYSTEMTOOL (SYSTEM TOOL SETTINGS) ...........................................80
OVERVIEW OF THE MEASUREMENT OPTIONS (MOP)...........................92
HARMONICS ANALYSIS .....................................................................94
OSCILLOSCOPE ..............................................................................106
VECTOR DIAGRAM ..........................................................................112
POWER AND ENERGY ANALYZER.....................................................119
FLICKER METER .............................................................................128
EN 50160 .....................................................................................134
TRANSIENT RECORDER ..................................................................150
RIPPLE CONTROL SIGNALS, TELEGRAMS ..........................................167
UNBALANCE ANALYSIS ....................................................................174
IMPEDANCE MEASUREMENT ............................................................180
HALF CYCLE MEASUREMENT (RMS HP) ...........................................184
C.A 8352-Post (Data analysis)........................................ 189
11.1 STARTING C.A 8352-POST ............................................................189
11.2 START SCREEN ..............................................................................190
11.3 ANALYSIS OPTIONS.........................................................................199
6
1st Partxxx
The Power Quality Monitorxx
7
8
1
Introduction
The C.A 8352 Power Quality Monitor is a self-contained instrument in a hard case
with lid, operating on AC networks to enable the following parameters to be
measured:
Analysis parameters according to EN 50160 standard in effect
• Network frequency
• Supply voltage
• Fast and slow voltage variations
• Short and long interruptions in supply
• Voltage dips and asymmetries
• Harmonic and interharmonic voltages
• Temporary voltage swells at 50 Hz
Flicker analysis
• Flicker analysis as per EN 61000-3 and EN 61000-4-15: short-term (Pst) and
long-term (Plt) flicker
Voltage and current analysis
• TRMS and average values
• Peak value and crest factor
Power analysis
• Generated and consumed active power
• Inductive and capacitive reactive power
• Apparent power, power factor, cos ∏
• Calculation of energies on each phase
Harmonics break-down up to 50th order
• Harmonics: current, voltage, active and reactive power in relation to the
fundamental and in absolute
• Phase shift for each harmonic
• THD: overall and order by order
• Direction recognition for each harmonic order
• Interharmonics spectral analysis
9
Unbalance and system symmetry analysis
• System symmetry measurement: positive, negative and zero sequence
components
• Phase shifting
• Absolute value of voltage and current for the complete spectrum
• Fresnel diagram representation in 3U and 3I
• Overall unbalance of three-phase network
HV network analysis (high voltage)
• Records “short-circuit” events (faultograph function)
• Remote control signal analysis: definition and verification of the frame
Using the instrument is self-explanatory, thanks to a Windows® operating system
and an LCD “touch screen”, further aided with:
• simultaneously available functions, for improved display
• data storage in internal memory (up to 6 months recording capacity),
• open and easy-to-use file structure,
• aptitude to monitoring and connection to networks,
• writing of protocols and the creation of test reports,
• data processing and report publishing software,
• real-time synchronisation via an external clock input (optional).
2 Presentation
2.1
Overview of the unit
• Colour LCD touch screen
• USB interface connectors enabling the connection of USB: mouse, screen,
back-up memory, modem, printer...
• Voltage inputs: UL1, UL2, UL3 and UN : 8 safety terminals, marked in black and
blue
• Current inputs: IL1, IL2, IL3 and IN : 4 input connectors for current clamp use
(clamp C, Amp FLEX...) (refer to connector-pin diagrams)
• Mains supply connector with incorporated fuse
On the LH side at the back of the unit are the ventilation grills, designed to cool
the instrument. It is essential that these ventilation holes remain unobstructed.
The ventilator openings should be kept open to avoid overheating.
10
2.2
Screen
The colour LCD touch screen enables the instrument to be used without an
external keyboard or mouse. Simply touch on the part of the menu screen of
interest with your index finger, or other pointed object that does not risk damaging
or scratching the screen.
The different menus displayed enable:
• setting of the different parameters,
• display of measurements in different forms,
• data analysis and printing,
• transfer of data to a back-up memory or another computer.
3 Setting-up
The instrument runs an operating system based on Windows® 98.
Connect the instrument to the electrical mains network using connector Å, the
Power Quality Monitor takes an 85 to 265 V~ mains supply input that does not
require switching. Turn the instrument ON.
4 Specifications
4.1 C.A 835 2 specifications
4.1.1 Electrical specifications
v Reference conditions
•
•
Temperature: 25°C
Relative humidity: 50% RH
v Voltage measurement inputs
•
•
•
•
•
•
•
Measurement range :
- Phases L1, L2, L3 : 4 programmable ranges: 70, 150, 300 and 700 VAC
- Neutral : 4 programmable measurement ranges: 5, 10, 50 and 100 VAC
Bandwidth: 10 Hz to 50 kHz
Accuracy: < 0.5 %
Input impedance: 1 MW, 5 pF
Input divider: 1:1000 (1:100 Neutral)
Type of inputs: 1 phase, 3 phase, 3 phase + N, delta connection, star
connection,
Transient response: 10 kV/µs
v Current measurement input
•
Measurement range: 0,05 A to 5 A programmable on phases L1, L2, L3
and the neutral
11
Current range
0,05...0,5 A
Accuracy
Phase shift
•
Bandwidth: 10 kHz to 25 kHz
•
Max. current: 20 A continuous, 500 A at 1 ms
•
Accuracy: < 1 %
•
Phase shift: 0.2°
•
Input impedance: < 2.5 mW
•
Input inductance: < 1.5 µH
•
Temperature drift: 0.08 % / °K
•
Insulation voltage: 2.5 kV rms, 50 Hz, 1 min
•
Transient response: > 50 A / µs
0,5 A...5 A
v Frequency: 47 to 63 Hz ± 0.01 Hz
v Power: DFWLYH UHDFWLYH DQG DSSDUHQW
v THD-U: < 1%
•
•
THD-I: < 1%
PF: < 1%
With triangle connection, only the global powers are significant
v System specifications
•
•
•
•
•
•
A/D converter: 12 bits
Sampling rate: 6.4 kS/s to 25.6 kS/s with anti-aliasing filter (3 kHz, 80 dB)
autoscanning, synchronisation to 50 Hz
Display: 7.5” (19.05 cm) color liquid crystal touch screen
User interface: Touch screen
Other interfaces: 1 USB port, 10 Mbit transfer rate, 30 V cat III
v Data storage intervals
•
•
Start / Stop : manual, external command or calendar
Measurement rate: 160 ms, k * 160 ms, 3 s, 1 min, 10 min, 15 min, 60
min
•
•
•
Recording time: function of the storing interval (1 week to 3 years)
Hard disk: 10 Gbytes
Data storage intervals for the min / max / average values: 160 ms, k * 160
ms, 3 s, 1 min, 10 min, 15 min, k * 1 min
•
Recording length:1 week to 3 years (for 3 s to 10 min intervals)
v Power supply
•
•
Mains supply: 90 to 260 VAC (47 to 63 Hz) without switching (see § 3)
Consumption: 35 VA typ.
12
4.1.2 Mechanical specifications
v Vibrations : MIL-STD 810C 514.2 Procedure X
v Index of protection : IP 43
v Shocks : MIL-STD 810C
4.1.3 Construction specifications
v 'LPHQVLRQV [ [ FP
v :HLJKW NJ DSSUR[
4.1.4 Climatic conditions
v Operating temperature: -10 to +50°C
v Storage temperature: -30 to +70°C
v Humidity: 10 to 90 % RH without condensation
4.1.5 Conformity with international standards
Electrical safety (as per EN 61010-1)
v Pollution level: 2
v Installation category: III
v Max voltage in relation to earth:
- Voltage measurement inputs: 500 V
- Current measurement inputs: 500 V
- Current measurement inputs for flexible Amp FLEX sensors: 1000 V
Electromagnetic compatibility
v Emission: NF EN 50 081 -1 (Ed 92)
v Immunity: NF EN 50 082 -1 (Ed 95)
Analysis procedures
EN 50160 (Ed 98)
IEC 61000-4-15
4.2 Input specification
Voltage inputs:
Current inputs:
Analogue inputs:
4 channels up to 2 kVpp
4 channels, range depends on sensors used:
MN 95: 0.2 to 6 A
C145 clamp: 2 to 1200 A
AmpFLEX A195: 25 to 3000 A
Accuracy: < 1%
Up to 16 channels, max.1 Hz (optional)
For recording environmental conditions,
depending on the application
13
Binary input:
With transient option:
1 external 24 VDC channel
for recording start-up
1 binary output, dry contact,
100 V max (for “transient triggering” status)
1 external 24 VDC binary input
(for “transient triggering” mode start-up)
4.3 Main system
Main processor:
Working memory:
Display:
User interface:
Equipment interface:
Sampling rate:
256 Mbyte RAM for recording start-up
10 Gbytes
10" LCD color screen
touch screen
1 USB port for keyboard,
2 x RS232 ports: data logger (optional),
printer, binary I/O
9.6 kHz/channel maximum
(38.4 kHz in transient mode, be it 25 µs)
4.4 General specifications
Analysis standards met: EN 50160
EN 61000-2, -3, -4
EN 61000-4-15
EN 61000-4-30
Electrical safety: IEC 61010-1, 500 V,
category III pollution degree 2
4.5 Environmental conditions
Operating temperature:
Storage temperature:
Relative humidity:
Dimensions:
Weight:
Supply voltage:
-10°C to +50°C
-20°C to +70°C
10% to 90% (with no condensation)
360 x 300 x 150 mm
4 kg
85 to 135 VAC and 180 to 265 VAC
4.6 Communications
Via modem as per publication: CCITT V90 56 kbds
Via Ethernet
14
5 Specifications for sensor and pad
5.1 Specification of the Amp Flex A195 with C.A 8352
(accessories)
5.1.1 Electrical data
•
Nominal range: 3000 A AC
•
Measurement range: 25 A to 3000 A AC
•
Input/Output ratio: 140 mV AC/3000 A AC at 50 Hz
Note: the output is proportional to the amplitude and the frequency of the current
measured.
•
EN 61010-1 and 2 (electrical safety) 1000 V, CAT III, POLL 2
5.1.2 Reference conditions
Temperature
Humidity
Position of conductor for measurement
Continuous magnetic field
External alternative magnetic field
External electric field
Frequency from
Type of signal measured
18°C to 28°C
20% to 75% of RH
centred within the air-core
< 40 A/m (earth's magnetic field)
none present
none present
10 Hz to 100 Hz
sinusoidal
•
Error in the reference conditions
Primary current (in A AC)
25 A...3000 A
Accuracy (as % of the ouput signal)
≤ 1%
Phase shift at 50 Hz (in °)
≤ 1°
•
Influence of adjacent conductor :
≤ 1% of interference current at 50 Hz
(≤ 2% near catch)
•
Influence of conductor position in the loop : ≤ 1% (≤ 4% near catch)
•
Influence of sensor shape : ≤ 1% for an oblong shape
5.1.3 Climatic conditions
•
Working temperature :
-10° to +55°C, (maximum temperature for sensor is 90°C)
•
Storage temperature : -40° to +70°C
•
Temperature influence : ≤ 0.5% of output signal per 10 K
•
Operating humidity :
from 0 to 95% of RH with linear decrease beyond 35°C
•
Influence of humidity :
15
•
< 0.2% of output signal from 10% to 85% of RH
Non operating altitude : 0...12000 m
5.1.4 Mechanical specifications
•
Casing protection :
Flexible sensor : IP65 (IEC 529)
•
Dimensions :
Case : 140 x 64 x 28 mm
Connector lead : 2 m (connects sensor to case)
Flexible sensor :Ø 12 mm ±0.5 mm (450 mm)
Ø 20 mm ±0.5 mm (800 mm)
•
Weight :
Flexible sensor : approx. 30 g per 10 cm length
5.2 Specification of the clamps C 145
5.2.1 Reference conditions
•
•
•
•
•
•
•
•
•
Conductor centred inside jaws
Temperature :
20…26°C, see diagram
Relative humidity :
20…75% RH, see diagram
Sinusoidal current :
frequency 48…65 Hz
Distortion factor :
< 1%
Continuous magnetic field:
Earth’s magnetic field (40 A/m)
Alternating magnetic field:
none present
Proximity of external conductors:
no direct or alternating current
Intrinsic error or phase displacement
AC current to be measured
Intrinsic error
Phase displacement
2...200 A
≤ 1%
≤ 1.5°
200...1000 A
≤ 1%
≤ 1°
5.2.2 Conditions of use and affecting factors
The clamp must be used within the following parameters to ensure user safety
and measurement accuracy.
5.2.3 Measurement parameters
•
•
•
•
Measurement range :
Output/input ratio :
Frequency range :
Normal current :
2…1200 A ~
1000 A / 5 A
30…5000 Hz
1000 A ~
16
5.2.4 Environmental parameters
•
•
Climatic conditions
Transport altitude: ≤ 12000 m
5.2.5 Effect of frequency variation
Values to be added to those in References Conditions
Frequency
Measurement error
30…48 Hz
< 1% I ouput
65…1000 Hz
< 0.5% I ouput
1 kHz…5 kHz
< 1% I ouput
5.2.6 Effect of peak factor
•
Effect on measurement: < 1% I ouput, for peak factor ≤ 6 and I ≤ 3000 A
peak
5.2.7 Effect of load
•
Effect of load (0.2…0.6 Ω):
< 0.5% on measurement
< 0.5° on phase
5.2.8 Effect of temperature variation
•
< 0.1% of I ouput/10°C, from -10°C to +50°C
5.2.9 Overloading
Restrict usage time above 1000 A ~
•
For frequencies ≤ 1 kHz
Current I
≤ 1000 A ~
Operation
Continuous
1000 A ~ < I < 1200 A ~
< 30 min in use
17
> 15 min break
•
For frequencies > 1 kHz
Frequency derating above 1 kHz, following the formula :
Continuous maximum I (A) =
1000
f (in kHz)
5.2.10 Mechanical specifications
•
•
•
•
Dimensions: 216 x 111 x 45 mm
Weight: 550 g
Maximum jaw opening: 53 mm (patented opening system)
Clamping capacity:
- Cable: Ø max 52 mm
- Busbar: 1 busbar of 50 x 5 mm / 4 busbars of 30 x 5 mm
5.2.11 Compliance with international standards
Electrical safety
As per NF EN 61010-2-032 -6: 600 V - Cat. III
Electromagnetic compatibility
as per NF EN 61326-1 - industrial environments
5.3 Specification of the clamps MN95
5.3.1 Reference conditions
•
•
•
•
•
•
•
•
•
Temperature: +20... +26°C
Humidity: 20... 75% RH
Conductor centred in jaws
Sinusoidal current: 48... 65 Hz
Distortion factor: < 1%
Direct current: no
Continuous magnetic field: earth field (< 40 A/m).
Proximity of external conductors: no current
Measuring device impedance: > 1 MΩ
5.3.2 Specifications
•
•
•
Nominal range : 5 A~
Measurement range : 10 mA...6 A
Output/input ratio : 1 A~ / 60 mV~
5.3.3 Precision and dephasing
NB : Intrinsic error as % of output signal
Intensity in A~
0.2 to 0,5 A
0.5 to 1 A
Intrinsic error
≤3%
≤ 1.5%
18
1 to 6 A
≤ 1%
Dephasing
≤ 1.5%
≤ 1.5°
≤ 1°
5.3.4 Conditions of use
The miniclamps must be used in the following conditions, in order to comply
with user safety and metrological performance requirements.
•
Frequency
- Use : 40 Hz to 10 kHz.
- When used continuously above 200A, frequency should be limited to 1 Khz.
•
Environmental conditions
- Climatic conditions: -10 to +55° C and RH < 85%
5.3.5 Dimensions and weight
•
•
•
•
•
Overall dimensions : 135 x 50 x 30 mm
Weight: approx. 180 g
Jaw opening : 21 mm
Open jaw height : 69 mm
Max. clamping capacity : Ø 20 mm cable or 20 x 5 mm busbar.
5.3.6 Compliance with international norms
•
Jaws : V0 (as per UL 94)
5.4 Specifications for the analogue inputs for PAD
(Programmable Acquisition Data)
•
•
•
•
Differential analogue input
Serial digital output
RS-485 interface
Typical consumption: 600 mA
5.4.1 PAD-V8
•
•
•
•
•
•
•
8 differential inputs
Input ranges: ±150 mV, ±500 mV, ±1 V, ±5 V, ±10 V or 20 mA (external
shunt)
Accuracy: < 0.1%
Resolution: 16 bits
Sampling frequency: 1/3 Hz
Overvoltage: ±35 V
Insulation voltage: 1000 V DC (non-insulated between inputs)
19
5.4.2 PAD-VTH8
•
•
•
•
•
•
•
•
8 differential inputs
Input ranges: ±15 mV, ±50 mV, ±100 mV, ±500 mV, ±1 V, ±2,5 V or 20
mA (external shunt)
Thermocouples:
“J” : 0 to 760°C
“K” : -50°C to 1300°C
“T” : -100°C to 400°C
“E” : 0°C to 1000°C
“R” and “S” : 500°C to 1750°C
B” : 500°C to 1800°C
“N” : -270°C to 1300°C
“C” : 0°C to 3320°C
Accuracy: < 0.1%
Resolution: 16 bits
Sampling frequency: 1/3 Hz
Overvoltage: ±35 V
Insulation voltage: 1000 V DC (non-insulated between inputs)
20
6 Maintenance
For maintenance of the instrument, only use the spare parts that have been
specified. The manufacturer cannot be held responsible for any accident that
occurs following repairs made outside of its after-sales service or by anyone other
than a certified repairman.
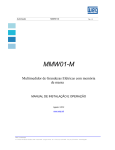
6.1 Replacing the mains fuse
•
Disconnect the mains supply
lead
•
Extract the fuse support
found just above the mains
connector
•
Replace
the
defective
element with a fuse of the same
model: Fuse T 3.15 A - 250 V - 5
x 20 mm
Fuse housing
Fuse housing opening
tab
Outlet or connector
for mains power cor
6.2 Cleaning the instrument’s casing
•
•
•
Clean the casing with a cloth lightly dampened in soapy water.
Rinse off with a wet cloth.
Do not use solvents.
6.3 Metrological verification
•
•
It is essential that all measuring instruments are regularly calibrated.
For checking and calibration of your instrument, please contact our
accredited laboratories (list on request) or the Chauvin Arnoux subsidiary or
Agent in your country.
•
We advise you to check this instrument at least once a year.
6.4 Repairs
Repairs under or out of guarantee: please return the product to your distributor
21
7 To order
To order the instrument configured to your needs, fill out the boxes in the order form below
Power Quality Monitor: Code
Standard instrument includes harmonic analysis,
oscilloscope mode,vector scope, standard model supplied with
carrying bag, 4 current leads (5 A max.), 8 voltage leads,
8 crocodile clips, data processing software CD ROM,
USB cable, plus all options marked in the order form.
Optional functions
Put a 1 to order a function (0 to leave it out)
Power analyzer, RMS hp......................................... 0 or 1
Flicker meter, Quality analyzer ............................................. 0 or 1
Transient recorder...................................................................... 0 or 1
Data logger .......................................................................................0 or 1
Remote control signals.........................................................................0 or 1
Power 2: symmetry, impedance ................................................................. 0 or 1
Remote drive via modem ............................................................... 0 or 1
Current sensors
Come in a shoulder bag, with 4 current leads (max. 5 A) and 8 voltage leads
None ............................................................................................................................
Set of 4 x C145 clamps (1000 A - Ø 52 mm) ................................................................
Set of 4 x AmpFLEX A195 (3000 A - Ø 140 mm / length 450 mm). ..............................
Set of 4 x AmpFLEX A195 (3000 A - Ø 250 mm / length 800 mm) ..............................
Set of 4 x MN95 clamps (5 A - Ø 20 mm) .....................................................................
X X
C X
A1
A 2
M 5
User manual languages
French (by default) .................................................................................................................
English ...................................................................................................................................
German..................................................................................................................................
Italian. ....................................................................................................................................
Spanish..................................................................................................................................
F
G
A
I
E
R
B
L
T
S
2P + E mains supply lead
French, German or Spanish (by default).............................................................................................
English ...............................................................................................................................................
Italian ................................................................................................................................................
Swiss. ................................................................................................................................................
F
G
I
C
Accessories
4 current leads (maxi 5 A) ............................................................................................... P01.2951.84A
4 x C145 clamps (1200 A) ............................................................................................... P01.1203.19A
8 voltage leads (4 blue, 4 black) ...................................................................................... P01.2951.83
4 x AmpFLEX A195 800 mm (3000 A)............................................................................. P01.1205.20
4 x AmpFLEX A195 450 mm (3000 A)............................................................................. P01.1205.19
4 x MN95 clamps (5 A).................................................................................................... P01.1204.29
1 USB connecting cable .................................................................................................. P01.2951.85
Carrying bag ................................................................................................................... P01.2980.34
22
Complementary orders
Optional functions to add to those already on your instrument can be ordered.
Be sure to include the instrument's serial number in the order form.
Serial numberr
Power analyzer, RMS hp................................ 0 or 1
Flicker meter, EN 50160 analyzer ................. 0 or 1
Transient recorder................................................ 0 or 1
Data logger ............................................................ 0 or 1
Remote control signals .................................................0 or 1
Power 2: symmetry, impedance .......................................0 or 1
Remote drive via modem .....................................................0 or 1
23
8 Appendix
8.1
Controls and connectors
Connector for PAD option
and Modem option (on the
side)
Colour LCD
touch screen
USB port for data
transfer
Input connectors
24
8.2
Input connectors
(see connector pins drawing § 8.3)
4 Current inputs
Voltage inputs:
L1, L2 and M
8.3
Connector pins for current measurement
1 : (+) Input for current measurement 1 / 5 A
2 : (-) Input for current measurement 1 / 5 A
3 : (+) Amp FLEX Input
4 : (-) Amp FLEX Input
5 : Not connected
6 : Input (+ V) for MN 95
: Input (+ V) for MN 95
25
8.4
Rear connectors
Digital inputs and
outputs
Input store
Trigger input
Trigger output
RS 232
PAD output (option)
Ethernet
26
8.5
Accessories
Amplfex
MN clamp
27
C clamp
8.6
Mathematical formulas for the calculation of
different parameters
Voltage RMS value
URMS = UA =
Current RMS value
IRMS = IA =
1
128
1
1024
U ABC =
Mean value of the current
IABC =
Apparent power [VA]
S = U RMS I RMS
Real power [W]
P=
Reactive power [var]
∑U
n =1
1024
∑I
n =1
2
n
U A2 + U B2 + U C2
3
Mean value of the voltage
Power factor [PF]
128
1
(IA + IB + IC)
3
1
1024
1024
∑U
n =1
PF =
P
S
Q=
S 2 + P2
I
n n
1st harmonic power [W]
P1 = U1 I1 cos ( ϕU 1 − ϕ I 1 )
1st harmonic reactive power [var]
Q1 = U1 I1 sin ( ϕU 1 − ϕ I 1 )
Displacement factor [dPF, cos ϕ ]
dPF = cos ( ϕU 1 − ϕ I 1 )
Total apparent power [VA]
PABC = PA + PB + PC
Total active power [W]
SABC = SA + SB + SC
28
2
n
Total reactive power [var]
QABC = QA + QB + QC
Total real power of 1st harmonic [W]
P1ABC = P1A + P1B + P1C
Total reactive power of 1st harmonic [var]
Q1ABC = Q1A + Q1B + Q1C
Power factor
PFABC =
Power factor given by 1st harmonics
dPFABC = cos arctg
.u =
PABC
S ABC
Q1 ABC
P1 ABC
A − 3A2 − 6B
A + 3A2 − 6B
Voltage non-symmetry coefficient [%]
2
2
2
where A = U A + U B + U C
4
4
4
and B = U A + U B + U C
Total voltage harmonic distortion [THD]
THDU =
Total current harmonic distortion [THD]
THDI =
∑
50
n=2
U n2
U1
∑
50
2
n=2 n
I1
I
.100
.100
Than are the values of S, P, Q, Q1 , P1 integrated in time domain what gives the energy
values AS, AP, AQ, AQ1, AP1.
29
30
2nd Partxxx
The Softwarexx
31
32
9 Setting procedure before measurement
9.1
Overview of general setup-options (MOP1)
Page 34
Page 80
Page 69
1
Module-Options-Panel
33
9.2
System settings
All basic settings in the [System] module, necessary for the desired recording of
measurements, are specified by the user.
9.2.1 Settings in the C.A 8352 option
System
9.2.1.1
Start-screen
After the start of the C.A 8352 software version 2.x, the following screen appears
on the display:
Figure 9-1: Option System
34
Display:
In the display area next to the license and serial number, a view of some of the
actual parameters is shown.
Note:
The denotation "DEFAULT" always indicates standard settings
(initial values).
Right button panel:
The right button panel of the window (called action-panel) shows
the menu for changing various field settings and other menu buttons within the option [System].
35
Lower button panel:
The lower button panel of the window shows the Module-Options-Panel, which
permits changing/selection of other options. Upon the start of the C.A 8352
software (at this moment, no measurement has begun) and with terminating a
current measurement, all module buttons are displayed gray, with the exception of
the standard buttons [System] and [Store]. Here the option [System] is selected
(always with the start of the C.A 8352 software) and appears therefore as though
it has been pressed.
2
Note:
All buttons will appear in the activated position, as soon as they
are pressed.
Note:
Settings for the recording of measurements in the options [System]
and [Store] can be modified only if no recording is taking place
at that time.
2
Provided that the corresponding module has been licensed.
36
9.2.1.2
Options and functions in detail
In the module [System] all basic settings, which are necessary for the desired
recording, are specified by the user.
9.2.1.3
9.2.1.3.1
Right button panel: menu buttons and their functions
Overview
... Page 38
... Page 40
... Page 41
... Page 42
... Page 66
... Page 67
... Page 67
... Page 67
... Page 68
... Page 68
37
9.2.1.3.2
Detail
Pressing the button [User/Project] changes the display to the
list of the existing user names (listed in the field "UserList”) and
their project names (listed in the field "ProjectList").
In Figure 9-2, no users or projects are available, therefore only
the Term "DEFAULT" is seen (meaning: unnamed user and/or unnamed project).
Figure 9-2: Display after pressing the button
[User/Project]
Within this field, new user and project names can be added, deleted
and/or selected.
By pressing this button,
a keyboard screen appears. This allows a
user name to be entered, e.g.: "demo_user".
38
By pressing this button, the user name marked in
the field "UserList" is deleted.
Warning: With this action, projects and measurement data associated with this user name
are deleted.
By pressing this button, a keyboard screen appears. This allows a project name to be entered,
e.g.: „demo_project1“.
Note:
Since the projects are assigned always
to a user name, this must be marked before pressing the button [Add Project]
in the "UserList".
By pressing this button, all marked project names
in the field "ProjectList" are deleted.
Warning: With this action, measurement data linked
with these project names are also deleted.
By pressing this button, marked user names in the
field "UserList" and the marked project names in
the field "ProjectList" are saved, and the display
changes into the output window of the module
[System] with the display of the new values.
39
Pressing the button [Configuration] changes the display to the
existing configurations listed in the field "configuration list".
In Figure 9-3, no configurations exist. Therefore only the "DEFAULT" appears (meaning unnamed configuration).
Figure 9-3: Display after pressing the button
[Configuration]
In this field, new configurations can be added, and existing ones
can be deleted and/or selected.
Note: Under the term configuration all set measurement parameters of a measurement can be saved and thus e.g. by repetition of a measurement, it can be resaved.
By pressing this button, a keyboard screen appears.
This allows a configuration name to be entered.
e.g.:„demo_configuration“
40
By pressing this button, the marked configuration
name in the field „Configuration List“ is deleted.
By pressing this button, marked user names in the
field "UserList" and the marked project names in
the field "ProjectList" are selected, and the display
changes into the starting window of the module
[System] with the display of the new values.
Pressing the button [Language] changes the display to a listing
of all available languages.
In Figure 9-4, only the languages "DEUTSCH", "ENGLISH" and
“FRANCAIS” are listed.
Figure 9-4: Display after pressing the button [Language]
By marking the desired language and then confirming with the
- button, all terms used by the instrument are translated
into the marked language. The display changes into the output
window of the module [System].
41
Pressing the button [Setup] changes the display to the measurement parameters and the way they were set during the last
measurement.
Figure 9-5: Display after pressing the button [Setup]
In this field, all measurement parameters (connections, measurement range, current/voltage transformer settings, presetting for the modules EN50160, PAD, Transient, Alarm and
Telegram) can be set.
The upper area of the display shows a tabular overview of the
actual measurement parameters (within this field no settings
can be set):
42
Likewise, the lower area of the display shows actual measurement parameters that are changeable, however, from here:
The fundamental frequency is set in this field.
This is done by selecting the field and marking the desired value
in the displayed list. (Note: Changing this frequency affects the
length of the FFT window of the FFT-analysis TW = N ⋅ f1 )
In this field, the frequency resolution of the
measurement instrument can be set. This is done by selecting
the field and marking the desired option from the displayed list:
By activating harmonics the analysis is in accordance with
IEC61000-4-30 and is in steps (increments) that correspond to
the basic frequency, i.e. the value for the n-width unit harmonics
f
corresponds to an averaged value for the frequencies of n −
2
f
to n + . By activating interharmonics the analysis is in accor2
dance with IEC61000-4-30 and is in steps (increments) that correspond to half the basic frequency, i.e. the value for the n-width
unit harmonics corresponds to an averaged value for the fref
f
quencies of n −
to n + .
4
4
By clicking on the window immediately below "Simulate
Meas.", a demonstration measurement with simulated demonstration data is activated.
Right button panel:
The right button panel of the window (called actionpanel) shows the menu for changing various field settings and other menu buttons within the option [Setup].
43
Overview:
... Page 45
... Page 53
... Page 56
... Page 61
... Page 61
... Page 62
... Page 63
... Page 64
... Page 65
44
By pressing this button a screen appears with the
connection diagram as it was set at last (here with
the example "C.A 8352"):
Figure 9-6: Display after pressing the button
[Connection]
All possible connection diagrams can be
paged through by using the fields on the left
side of the display (see Figure 9-7 to Figure
9-12). The last active connection diagram
(visible in the display) is saved upon leaving
the submenu [Connection] (by pressing the
button).
45
Connection possibilities e.g. C.A 8352:
3xUph + 3xIph + N: Y-connection - 5-wire system
Figure 9-7: Connection diagram 1
(3xUph + 3xIph + N)
This connection diagram is generally used for asymmetrical 4- (or
5-) wire systems (low-voltage systems.
As represented in the above illustration, it applies to low-voltage
systems with the protective measure protective grounding (TT
system) and grounding with separate protective earth (PE conductor)
(TN-S-system).
In reduced form (connector/port "UN" is not attached, "IN" to the
"PEN" conductor) this connection is also used in low-voltage systems
with the protective measure "grounding without separate protective
earth conductor (PEN conductor)"(TN-C-system).
Y:EN50160 means, that for evaluation according to EN50160, line-toearth voltage must be used as the EN50160 reference voltage.
46
3xUph + 3xIph: Y-connection -3-wire system
Figure 9-8: Connection diagram 2
(3xUph + 3xIph)
This diagram is generally used for asymmetrical 3-wire systems
(medium and high-voltage grids).
Y:EN50160 means, that for evaluation according to EN50160, line-toearth voltage must be used as the EN50160 reference voltage.
3xUline + 3xIline: Delta connection
Figure 9-9: Connection diagram 3
(3xUline + 3xIline)
This diagram is generally used for asymmetrical 3-wire systems
(medium and high-voltage network without neutral conductor).
D:EN50160 means, that for evaluation according to EN50160, line-toline voltage must be used as the EN50160 reference voltage.
47
3xUph + 2xIph: Aron-connection
Figure 9-10: connection diagram 4
(3xUph + 2xIph)
The Aron-connection is used for asymmetrical 3-wire systems (medium- and high-voltage networks without neutral conductor), for
which only 2 phases are accessible for taking current measurements.
Y:EN50160 means, that for evaluation according to EN50160, line-toearth voltage must be used as the EN50160 reference voltage.
2xUline + 2xIline: V-connection
Figure 9-11: Connection diagram 5
(2xUline + 2xIline)
This diagram is generally used for asymmetrical 3-wire systems
(medium voltage network without neutral conductor), for which only
2 phases are accessible for taking measurements.
48
D:EN50160 means, that for evaluation according to EN50160, line-toline voltage must be used as the EN50160 reference voltage.
1xUph + 1xIph: Single-phase-connection
Figure 9-12: Connection diagram 6
(1xUph + 1xIph)
The Single-phase-connection is used in 4-wire systems in which
either only 1 phase of the measurement is accessible, or the
measurement of one phase is sufficient due to perfectly symmetrical
load.
Use line-to-earth voltage as a reference voltage for evaluation
according to EN50160.
3xUph + 3xIph Y/D: Y-connection 3-wire-system; D calculated
Figure 9-13: Connection diagram 7
(3xUph + 3xIph Y/D)
The usage of this connection diagram is intended for medium-(and
high-) voltage grids, whose voltage measuring transformers are
connected in Y (1 pole), but you want to know the line-to-line voltages
49
also. With this connection diagram the line-to-line voltages are
calculated out of the measured line-to-earth voltages. The calculated
line-to-line voltages will be used for the evaluation in the modules
EN50160 and Flicker (evaluation according EN50160 needs line-toline voltages for medium voltage grids) and ripple control signals. In
the modules Oscilloscope and Transient recorder, there are line-toline AND line-to-earth voltages available.
D:EN50160 means, that for evaluation according to EN50160, line-toline voltage must be used as the EN50160 reference voltage.
3xUph + 3xIph Y/D + M: Y-connection 4-wire-system; D
calculated
Figure 9-14 : Connection diagram 8
(3xUph + 3xIph Y/D + M)
The usage of this connection diagram is intended for medium-(and
high-) voltage grids, whose voltage measuring transformers are
connected in Y (1 pole), but you want to know the line-to-line voltages
also. With this connection diagram the line-to-line voltages are
calculated out of the measured line-to-earth voltages. The calculated
line-to-line voltages will be used for the evaluation in the modules
EN50160 and Flicker (evaluation according EN50160 needs line-toline voltages for medium voltage grids) and ripple control signals. In
the modules Oscilloscope and Transient recorder, there are line-toline AND line-to-earth voltages available.
D:EN50160 means, that for evaluation according to EN50160, line-toline voltage must be used as the EN50160 reference voltage.
50
Warning:
Changing settings in the connection diagram affects the
computation of the results in the three-phase system, i.e. on the
computation of the apparent power S, the active power P, the
reactive power Q, as well as on the computation of derived
energy values AS, AP, AQ, etc. from these values.
The values for voltage and current are presented in the displays
of the measurement module without further computation as U 1, U2
U3, UN and/or I1, I2 I3, IN (exception: Measurement option "Vector"
with application of connection diagrams 3 and 5, see next
paragraph). They must be evaluated by the user according to the
selected connection (see following table).
With the application of connection diagrams 3 and 5, line-to-linevoltages are measured. These voltages are converted in the
measurement option "vectors" into line-to-earth-voltages (voltage
factor 1 , phase shift 30°) and displayed.
3
By usage of the connection diagrams 7 and 8, there are always
phase voltages measured. For the modules oscilloscope and transient recorder however also the line voltages are available as
measuring voltages (for details, see accordingly sections of the
measurement modules).
The following table is a demonstration of a selection of connection
diagrams and their displayed values:
Displayed values
Connection
Connection diagram 1
(3xUph + 3xIph + N)
U1: UL1-N
U2: UL2-N
U3: UL3-N
UN: UN-PE
I1: IL1
I2: IL2
I3: IL3
IN: IN
Connection diagram 2
(3xUph + 3xIph)
U1: UL1-N
U2: UL2-N
U3: UL3-N
I1: IL1
I2: IL2
I3: IL3
U1: UL1-L3
U2: UL3-L2
U3: UL2-L1
I1: IL1
I3: IL3
U1: UL1-0
U2: UL2-0
U3: UL3-0
I1: IL1
I3: IL3
Connection diagram
(3xUline + 3xIline)
3
Connection diagram 4
(3xUph + 2xIph)
51
5
U1: UL1-L2
U2: UL2-L3
U3: UL3-L1
I1: IL1
I2: IL2
I3: IL3
Connection diagram 6
(1xUph + 1xIph)
U1: UL1-N
I1: IL1
Y
Connection diagram
(2xUline + 2xIline)
D
3
U1: UL1-L2
U2: UL2-L3
U3: UL3-L1
Y
Connection diagram 7
(3xUph + 3xIph Y/D)
U1: UL1-N
U2: UL2-N
U3: UL3-N
U1: UL1-N
U2: UL2-N
U3: UL3-N
5
D
Connection diagram 8
(3xUph + 3xIph Y/D + M)
U1: UL1-L2
U2: UL2-L3
U3: UL3-L1
I1: IL1
I2: IL2
I3: IL3
I1: IL1
I2: IL2
I3: IL3
Table 9.1: Comparison of connection diagrams - displayed
values
Example:
The voltage, shown as "U1", in the display, represents a line-to-earth
voltage with connection diagram 1, and a line-to-line voltage with
connection diagram 3.
3
In general the displayed values represent the Y-circuit values in all modules.
Only in the modules oscilloscope and transient recorder a choosing between the Yand D-values possible.
52
By pressing this button, a screen appears with the
measurement range parameters of the measuring
instrument as last set:
Figure 9-15: Display after pressing the button
[Ranges]
The measurement range of the current and the
voltage can be specified in this field. The values
selected here are saved upon leaving the submenu
) button.
[Ranges] by pressing the
Figure 9-16 shows an overview of the input fields:
The indicated conversion factors are factors that
take into consideration the current and/or voltage
transformers in the display of the C.A 8352
instrument. (e.g.: an external 2-kV voltage
transformer with a 100-V output must be set to a
voltage factor of 20, so that a measured voltage
RMS (Root Mean Square) of 100-V appears in the
displays of all C.A 8352 options (oscilloscope,
FFT-analyzer, etc.) as a voltage RMS of 2-kV.
53
ranges setup
for
voltage
current
d es
m eas uring rang e
final va lue
tran sducer
facto r
- sducer
m eas uring rangD
e rehstromtran
final va lue
sy s tem s facto r
p ha se L1
p ha se L2
Pha se L3
Pha se N
Figure 9-16: Setting of the measurement range
Note:
The transformation factors offer the possibility of a
reversed connection (i.e. reverse polarity; see also
section 9.2, page 64) through the input of a negative transformation factor at the software level.
The input of the final measurement range values of
voltage and current is done by selecting the desired
field and marking the desired value in the displayed list:
54
The input of the transducer
factors is done by selecting the
appropriate field and entering
input by means of the keyboard
screen.
If certain phases are not connected in the
connection diagram using the [Connection] button,
then these fields are displayed gray; e.g. with a
single-phase measurement:
55
By pressing this button, a screen appears with the
last selected limiting parameters for the control of
the Power Quality criteria according to EN50160.
With the start of the submenu [EN50160], the button [50160 Limits] is in the pressed position.
Figure 9-17: Display after pressing the button
[EN50160]
In this field, limit values and further specifications
for the EN50160 evaluation of the signal can be confirmed and/or changed. These are activated upon
leaving the submenu [EN50160] and by pressing
the button
.
Right button panel:
The right button panel of the window (called actionpanel) shows the menu for changing various field settings and other menu buttons within the option [EN
50160].
56
Overview:
... Page 57
... Page 59
... Page 59
... Page 60
... Page 60
Input is possible only in the white fields. This is done
by selecting the appropriate field and entering the
desired value with the keyboard screen.
57
Limits for evaluation according to EN50160 (see section 10.7)
can be changed in the panel on the left hand side:
•
•
•
•
•
•
•
Voltage levels (in % of the
reference voltage) for the
95% and the 100% percentile
of the measurement period
Flicker threshold
THD threshold
Unbalance factor of the 3phase voltage system
Week percentile
Hysteresis (see note page 58)
Telegram frequency, that
should be used for
EN50160-evaluation
Note: The telegram frequency selected here does not correspond to the telegram frequency in the module "Telegram" (see
section 10.9)
Within this field, the RMS of the
reference voltage and the Eventevaluation levels in % of the
reference voltage can be predefined.
Note:
When a voltage varies slightly from the set
evaluation level, this will result in permanent events of no significance. In order to avoid this accumulation of unnecessary data,
a bandwidth can be set (+/- hysteresis in % of the reference
voltage) where, if the voltage varies within this range, no new event
is recorded, e.g. event starting at 90% and ending at 92%.
58
Within this field limit values can be specified for the
voltage RMS of the harmonics in % of the RMS of
the fundamental voltage frequency.
Input is by selecting the field and entering the desired value with the keyboard screen.
This screen allows to define values for several
parameters for the detection of Rapid Voltage
Changes:
•
Min. Rate of Change [%]: minimum difference
between 2 neighboring 10ms-RMS-values in
% UN to start the RVC evaluation
• Min. Steady-State Difference (dc) [%]: minimum
difference between the initial steady-state 10ms59
RMS-value and the 10ms-RMS-value of
following steady-state-condition in % UN
the
• Min. Steady State Duration [s]: minimum
duration in s of the 10ms-RMS-values being inside
the “Steadiness-of Steady-State [%]” - limits to be
detected as a steady-state-condition
• Steadiness of Steady-State [%]: hysteresis for
10ms-RMS-values to get into steady-state-condition
Input is possible only in the white fields. This is done
by selecting the appropriate field and entering the
desired value with the keyboard screen.
Note:
All other thresholds for the EN50160 can also be
selected with the data analysis software (Postprocessing).
Pressing this button resets all thresholds for the
values of the EN50160.
This button saves the settings and returns to the
submenu [Setup].
60
After pressing this button the following screen appears:
Figure 9-18: Display after pressing
the button [PAD]
Within this field, selections can be made for an additional data logger (hardware name "PAD" =
programmable acquisition data logger). This is activated upon leaving the submenu [PAD] and
.
pressing the
Note: If no „PAD“ is attached, an error message appears. See also Manual for using "PAD"
By pressing this button, a display appears with the
last set trigger settings for the transient recorder.
Upon opening the submenu [Transient], the button
[U] is in the pressed position.
61
Figure 9-19: Display after pressing
the button [Transient]
In this field, events with which the transient recorder
activates its recording (triggers) can be pre-defined.
These settings are activated upon leaving the submenu [Transient] and by pressing the
button.
The different possibilities for the trigger settings are
described in section 10.8.
By pressing this button, a display appears with the
last set parameters for detecting a telegram (ripple
control signal).
Figure 9-20: Display after pressing
the button [Telegram]
62
In this field, the required characteristics of the
ripple control signal can be pre-defined. These settings are activated upon leaving the submenu
button.
[Telegram] and by pressing the
The description of the adjustable telegram characteristics is found in section 10.9.
After pressing the button [Print], it is possible to
print the set measurement settings. The „Print Panel“
appears.
There are only two possibilities to print the setup
data:
[Print to BMP]: Printing (and/or saving) the setup
infos as a bitmap file to the folder ...\Data2\
User\Project\_Printouts on the hard disc of the
measurement PC (User/Project is the name of the
applied project and/or user, see section 9.2.1.3.2).
[Print]: The setup info is printed on the default
printer (to define a printer as a standard printer see
4
5
[ST], section 9.4).
MOP [System] :
$3
[Cancel]: Cancel without printing.
4
5
Module-Options-Panel
Action-Panel
63
Figure 9-21: Example of a Setup-printing
After pressing this button, a screen appears with the
last set measurement settings and recorded measurement values.
Figure 9-22: Display after pressing
the button [Actual Values]
This display serves as a quick check of whether the
set measurement settings are correct (connections,
polarity, phase sequence, measurement range,
transducer factors, etc.); and of whether the effective/selected measurement connections are also
correct (current clamps connection, etc.). The
measurement settings take effect upon leaving the
submenu [Actual Values] and by pressing the
button.
64
The display area shows a vectorial display and the
temporal process of the measurement values recorded with the current settings. At the same time,
their RMS is shown in the right upper field.
If certain phases of the
connection
diagram
are not connected,
then these fields are
displayed gray and/or
to their graphs are not
shown.
By pressing this button, all activated settings in the
submenu [Setup] are saved, and the submenu is
closed. The display changes into the output window
of the module [System].
65
Pressing the button [Options] changes the display to the following:
Figure 9-23: Display after pressing
the button [Options]
This field serves to activate individual modules of the C.A 8352
software. By entering the license number and following
button, the license number is
confirmation by means of the
checked and the appropriate modules are activated. The licenses
and thus the corresponding license numbers for further modules
of the C.A 8352 software can be purchased separately.
Pressing this button returns the user to the main
menu. The display changes to the output window of
the module [System].
66
Pressing the button [Info] changes the display to the following:
Figure 9-24: Display after pressing the button [Info]
This field serves only as information and gives information about
some system parameters, such as license, serial number, software version, expiry date and shows the activated options.
Pressing this button returns the user to the main
menu. The display changes to the output window of
the module [System].
By pressing the button [Start Meas], the recording of measurement is started. From this point, all buttons of the ModuleOptions-Panel are activated. The display of the button panel
changes to
. By pressing the button [Stop Meas], the
recording of measurement is terminated and changes to the
selected measurement parameters can be made.
By pressing the button [Quit], the program is terminated.
67
By pressing the button [Post], the user enters the subroutine
"post-processing", which permits additional analysis of the saved
measurement values (see section 11).
By pressing the button [ST], the user enters the subroutine
„SystemTool", with which system settings, such as printer installation, system time setting, software update etc. can be changed
(see section 9.4).
68
9.3
Storing
In the module [Store], all saving-settings, such as selection of the data, which are
to be saved, save interval, starting the save, procedure, etc. can be set by the
user.
9.3.1 Settings in the C.A 8352 option Store
9.3.1.1
Start screen
The [Store] button can be operated at any time, including when recording of
measurement is currently running. After pressing the button, the following screen
appears:
Figure 9-25: Option Store
69
Display area:
The display area shows a summary of all the available options (FFT, Power,
Energy, Flicker, etc.) with respect to the analyzed data and the actual active
recording settings. Additionally, the available hard disk space is displayed as % of
the overall capacity and in the form year-month-day-hour-minute.
Note:
Changes in the data recording parameters are possible only if
no recording is currently taking place, i.e. the buttons at the
right edge of the display must be active and the notation [Start]
must appear.
70
M
tim e
rang e
extern
“ i”(in fo )field
m a nual
Figure 9-26 and Figure 9-27 show an overview of the setting options and fields in
the window:
E
Tim e
D e fine of the trigg er m echanism
of da ta recording
S e ttin g of th e de sire d
d ata re c ord ing interva l
der
P h as e L1
der
P h a se Lent
1 option,
N am e of the m easurem
of w hich da ta should be reco rding
A ctivatio n of d ata re cording
w ith settin g pa ra m ete rs,
accord in g the cho se n
trigger m echanism
Activatio
d ensof data recording
wDith
setting param
eters,
rehstrom
accordin
syste mgs the chosen
trigger m echanism
m anual:
start/stop
D efine of the trigger m echa nism
of data recording
Tim e
extern:
activate/
deactivate
time :
activate/
deactivate
time
range
extern
m anual
“ i ”(in fo)fie ld
extern :
a ctiv a te /
d ea c tiv a te
m an ual:
s tart/s to p
D ata recordin g interval
(not ch angeable)
M E
tim e :
a ctiv a te /
d ea c tiv a te
Figure 9-26:
Overview of the
upper display,
module [Store]
71
Figure 9-27:
Lower display
area of the
module [Store]
Note:
•
Activation of the measurement options in the groups of
fields in the upper display area (Figure 9-26):
By selecting the white field next to the respective measurement
option, their recording is activated (X) and/or deactivated ( ).
Note:
•
Entering a name via the „i“(Info) – field:
By selecting this field, a window opens in which the data records
can be assigned a name corresponding to the term "measurement" in the data analysis program "C.A 8352-post" (see
section 11), a measurement location and further descriptors:
Note:
•
Recording interval:
Depending upon the application, different recording intervals are
available:
C:
Interval is not able to be changed here
k:
Multiplication factor: Min-/Max- and Average value is
stored every k*0.2s (or 1min);
Example: 10*0.2s means that minimum, maximum and
average value of the selected parameter of the 10 0,2s
evaluations is stored every 2 seconds.
72
The smallest recording interval corresponds to the analysis
interval of 10 cycles of the basic frequency, 200ms at 50Hz.
For RMS values PNA software always stores minimum,
maximum and average value of all evaluation periods (10
cycles of the fundamental frequency) of the selected
storing period.
Note:
•
Trigger mechanisms:
In each case a trigger mechanism (manual / external / temporal)
can be activated.
Note:
manual:
Starting and terminating the recording are done by
pressing [Start]-/[Stop] – button.
external:
Starting and terminating the data recording can be
done with an external trigger signal (depending on
the type of C.A 8352).
time:
Starting and terminating takes place via pressing
the appropriate [Time] – field and entering a starting
/ stopping time in the display window that appears:
•
Activation of data recording (depending upon set trigger
mechanism):
manual:
Data recording waits until operation of the [Start]- /
[Stop] – button.
external:
Data recording waits for a trigger signal for starting
and terminating the recording.
time:
Activation with [Start] – button. Data recording waits
until the start/stop time matches the time on the
system clock (see section 9.4).
73
Note:
The button [Start] changes with activation to [Stop] and
changes its color depending upon the status of the data recording:
(gray)
Data recording is not activated.
(yellow)
Data recording is activated, however no values have been saved
till now.
(green)
Data recording is activated and values have already been
saved.
Right button panel:
The right button panel of the window (called action-panel) shows
the menu for changing various field settings and other menu
buttons within the option [Store].
Lower button panel:
The Module-Options-Panel, which allows changes to other options, is shown at
the lower edge of window. With the start of the C.A 8352 software (at this moment
74
no measurement has begun), and with terminating a current measurement, all
module buttons are displayed with a gray background, with the exception of the
standard options buttons [System] and [Store]. Here the option [Store] is
selected and is therefore displayed in the pressed position.
75
Note:
All buttons are in the activated position as soon as they are
pressed and/or are displayed in the pressed position when activated.
Note:
Selections for saving measurement values can be made at any
time in the option [Store], i.e. also during a current measurement.
9.3.1.2
Options and functions in detail
Settings which are necessary for the desired saving of measurement values can
be specified by the user in the module [Store].
9.3.1.3
9.3.1.3.1
Right button panel: menu buttons and their functions
Overview
•
...Page 77
•
...Page 79
76
9.3.1.3.2
Detail
Pressing the button [Info] changes the screen to a tabular display
of the Save status for the individual measuring options:
Figure 9-28: Display after pressing the button [Info]
In this field, names and further descriptions can be assigned to the
data records. These terms assist in differentiating between data
records during data evaluation by means of „C.A 8352-Post“(see
section 11). All other fields serve only as indicators of status.
77
Figure 9-29 shows an overview of the displayed fields:
d er
m easu rem ent
optio n (X ),
P h a da
setaL1
their
in this da ta reco rd
to be reco rd ed
n a m e o f th e
re co rd e d d a ta rec ord
a d ju s te d
re co rd in g
in te rval
in a ctive (g re y)
a ctive (ye llo w )
(still n o ne da ta s to re d)
a ctive (g re e n )
(> = 1 d ata a lre a d y s to red )
d a te a n d tim e of d ay
o f th e la st sto rag e
s ta tu s
d isp la y
n u m b ers o f sto ra g e d
d a ta va lu e s
n um b ers o f sto ra g ed
d ata va lu es
n am e o f th e
m ea s urem e nt op tion
a dju ste d
re co rd in g
in te rv al
d ate a n d tim e of day
o f th e la st storag e
sta tu s
d ispla y
in a ctiv e (g re y )
n am e o f th e
re co rd e d da ta record
a c tive (y e llo w )
(s till n o n e d a ta s to re d )
a c tive (g re e n )
(> = 1 d a ta a lre a d y s to re d )
Figure 9-29: Upper and lower display area
from [Info] in overview
78
Pressing the button [Server] changes the screen to a display of
different control parameters for copying/replicating that allow the
C.A 8352 instrument to save measurement data to a userdefined „C.A 8352 server“ (see section 9.4).
Figure 9-30: Display after pressing the button [Server]
Note:
For detailed information on the "C.A 8352 server" please refer to
the associated description, which is available on request.
The "Replicator" is a synonym for the copying process. It is activated and/or deactivated by pressing the white field.
In this field, the user can define when and/or how the replication
procedure is to be started:
•
•
•
•
•
periodically after certain time intervals
after an alarm
after a transient recording
by inquiry from the outside, i.e. via the program "C.A 8352
remote" from the server or from another C.A 8352 instrument
manually.
79
9.4
SystemTool (system tool settings)
The „SystemTool version 3.x“ provides the settings for different system (default
printer, system clock) and network parameter, the transfer of data and the
activation of software updates and Hard Disk utility programs.
9.4.1 Settings/actions in the C.A 8352 option
SystemTool
9.4.1.1
Start screen
6
This is activated under the MOP [System]
7
the AP ). The following screen appears:
: and by pressing the button [ST] in
Figure 9-31: „SystemTool“ – start screen
6
7
Module-Options-Panel
Action-Panel
80
9.4.1.2
9.4.1.2.1
Buttons and their functions
Overview
... Page 82
... Page 83
... Page 84
... Page 85
... Page 86
... Page 91
81
9.4.1.2.2
Detail
After pressing the button [Language] a list shows all available
languages for the submenu „SystemTool“. By selecting the desired language and confirming with the button
[Switch to selected Language] in the „Actions“ column, all terms
are changed to this language.
Figure 9-32: Display after pressing the button [Language]
82
Pressing the button [Date/Time] activates a field within which the
setting of the system clock can be changed. The following screen
appears:
Figure 9-33: Display after pressing the button [Date/Time]
By pushing on the desired date, the selected number
Date:
appears as a blue encircled number (her e.g.:
). Another
month can be selected by pushing the buttons
.
The Time setting is also possible by mouse-click on
Time:
the accordingly region of the clock (hours – selected in Figure
9-33 -, minutes, seconds) and following pressing the buttons
.
The confirmation of the date and/or time takes place by pressing
[Set Systemtime] in the „Actions“-
the button
column.
83
Pressing the button [Printer] activates a field within which a
printer can be selected. This printer can be used as the standard
printer in the Print Options of the respective measurement module.
The following screen appears:
Figure 9-34: Display after pressing the button [Printer]
Additionally to the actual standard printer of the measurement
module, all available printers are listed (Note: The listed printers
correspond to the printers configured under MS Windows). The
selection of a printer is confirmed by pressing the button
[Set Selected as Default] in the „Actions“- column.
84
By pressing the button [Network], the network settings can be
made. The following screen appears:
Figure 9-35: Display after pressing the button [Network]
Network Adapters:
The desired network connecting type can be selected in a drop
down menu.
Note: The listed interfaces correspond to the network-interfaces
installed under “MS Windows”.
TCP/IP Configuration:
Both the automatically IP-Address allocation (through MS
Windows) and the manually allocation of the IP-Address, the
Subnet Mask and the Gateway is possible. In case of manual
setting the change of the address-number-blocks can be made
by mouse-click on the desired address. The following screen
appears:
85
...
delete number
.. choose address-number-block
...
set modification, close the keyboard-input-window
...
don’t set modification, close the keyboard-input-window
(cancel)
[Set new TCP/IP settings] in
By pressing the button
the „Actions“-column, the settings become valid.
Pressing the button [Service] activates a field within which Hard
Disk utility programs can be started. The following screen appears:
Figure 9-36: Display after pressing the button [Service]
86
Following utility programs are available:
•
A data transfer program [Data Transfer]
•
A setup program for setting the replicator function
[Setup Replicator]
Pressing the button [Data Transfer] starts the program „PCLinq“ (USB Bridge Cable Application Version 1.x).
This program makes it possible for the user to access the Hard
Disk of the C.A 8352 instrument from another PC. In addition,
8
the user must also install and start the program „PCLinq“ (USB
Bridge Cable Application Version 1.x) on the PC from which the
C.A 8352 instrument will be accessed. If the PC is connected to
the C.A 8352 instrument with a USB cable, the following screen
appears:
Figure 9-37: Display at activated
“PCLinq“ - connection
Now it is possible to access the Hard Disk of the C.A 8352
instrument (=remote machine) from the PC, e.g. copying the
measurement data of the C.A 8352 instrument to the Hard Disk
of the PC.
8
PCLinq is found on the Installation CD!
87
After pressing the button [Setup Replicator] it’s
possible to do the settings for the replicator function.
The following screen appears:
Figure 9-38: Display „Setup Replicator“- Connection
Path to CFG file:
Points to the path (and/or filename) of the file, in which all configurations are stored.
Note: This name can’t be changed. It only serves as an information.
ODBC connection string & TimeOut:
The command line contains some settings, which are necessary
to replicate data to a SQL database. The meaning of the terms
are the following:
DSN:
Connection name of the SQL-server on which
the data should be stored.
UID:
User name (user identification)
PWD:
User password
DATABASE:
Name of the data base on the SQL-server
88
Note: To make a valid SQL-server connection, first of all an
ODBC-connection has to be installed. This connection refers to
the desired SQL-server.
:
Shows the time in seconds after a break off, in
which a new connection establishment to the
SQL-server is tried.
BK. No.:
Shows the instrument number.
Note: Each instrument must have its own BK number. That’s
essential for differentiation of data on the database.
Path to BK550 data directory:
Shows the path to the data of measurement record, which are
stored directly on the measurement instrument. The default-path
refers to the file folder of the current defined User/Project (see
section 9.2.1.3.2).
TPC/IP Connection:
As transmission protocol the most common TPC/IP protocol is
used. The desired connection can be chosen:
ETHERNET:
Her no further settings are necessary and/or possible.
MODEM:
Following settings are possible:
•
•
•
•
•
Server name (Server name) ... optional
Connection name (Dial up name) ... mandatory
Dial up number (Phone number) ... mandatory
User name (User) ... optional
User password (Password) ... optional
Note: For a valid transmission via modem, there must be installed
a modem connection on the PC.
89
Stores the taken settings.
Break off the replicator setup program.
After the connection settings further settings via the table Data
are possible. In this area additionally settings for the transmitted
data can be made. The following screen appears:
Figure 9-39: Display „Setup Replicator“- Data
Here the selection of particular transmitted measurement
parameter is possible.
In the harmonics area, an ordinal-number-window is built by
setting the upper and lower limits. If one activates for example
the field Even, all data of the harmonics with even ordinal
number are selected for the replication process (e.g.: 2 12
means: transmission of harmonics with ordinal number 2, 4, 6,
8, 10 and 12).
Æ
90
After pressing this button all parameters are
selected.
After pressing this button no parameter is
selected (erasing process).
Saves the made settings.
Terminate the replicator setup program.
Pressing the button [Exit] terminates the submenu "System Tool"
and returns the user to the main program „C.A 8352-Meas“.
91
10 Measurement
10.1 Overview of the measurement options (MOP9)
Page 94
9
Page 150
Page 106
Page 167
Page 112
Page 174
Page 119
Page 180
Page 128
Page 184
Module-Options-Panel
92
Page 134
To further measurement options.
To further measurement options.
93
10.2 Harmonics analysis
In practice, a purely sinusoidal "sine" voltage does not occur. Instead, other cyclic
voltage curves arise, which deviate more or less from the pure sine form. Figure
10.1 shows a sine voltage curve that can occur in practice.
Potential gradient
275
225
Instantaneous value in [V]
175
125
75
25
-25 0
30
60
90
120
150
180
210
240
270
300
330
360
-75
-125
-175
-225
-275
ω t in [°]
Figure 10.1: Typical voltage waveform u(t)
Figure 10.2 shows the breakdown of u(t) into its fundamental frequencies and
harmonics (Fourier components). Figure 10.3 shows the frequency spectrum of
the Fourier components.
Potential gradient
275
total
1
3
5
7
Instantaneous value in [V]
225
175
125
75
25
-25 0
30
60
90
120
150
180
210
240
270
300
-75
125
175
225
275
ωt in [°]
94
330
360
Figure 10.2:
u(t) with
fundamental
frequency and
harmonics
FFT analysis
100
90
Level of harmonics in [%]
80
70
Figure 10.3:
u(t) as frequency
spectrum
60
50
40
30
20
10
0
1
3
5
7
9
11
13
15
17
19
21
23
Ordinal number
10.2.1 Start screen
The C.A 8352 is a high performance power quality analyzer, which makes all
measurements and analysis available simultaneously and in their entirety. If the
equipment settings (see section 9) have been selected and all measurement connections have been connected, measurement can be started by pressing the
button
[Start Meas]. The Option FFT is available after pressing the
button
[FFT]. The following display appears on the screen:
Figure 10.4: Option FFT
95
Right button panel:
The right button panel of the window (called action-panel) shows
the menu for changing various field settings and other menu
buttons within the option [FFT] (Fast-Fourier-Transformation).
Lower button panel:
The lower button panel of the window shows the Module-Options-Panel, which
permits changing/selection of other options (all options run parallel). By pressing
further options become available. Here the option [FFT] is
the button
selected and appears therefore in the pressed position.
Note:
10
10
All buttons are in the activated position as soon as they are
pressed and/or are displayed in the pressed position when
activated.
If the appropriate modules are licensed
96
10.2.1.1 Options and functions in detail
The following measurements are possible with the FFT module:
Function/options
Remarks
U- level-measurement
values of the harmonics with the ordinal
number v = 1 - 50 of the voltages of all
associated phases (1,2,3,N)
I- level-measurement
values of the harmonics with the ordinal
number v = 1 - 50 of the currents of all
associated phases (1,2,3,N)
P- level-measurement
values of the harmonics with the ordinal
number v = 1 - 50 of the active powers of all
associated phases (1,2,3,N)
Q- level-measurement
values of the harmonics with the ordinal
number v = 1 - 50 of the reactive power of all
associated phases (1,2,3,N)
10.2.1.1.1 Numeric display under the Graphics window
Figure 10.5: Lower display area
97
The number in the field with a blue background shows the total
oscillation of the selected parameters (e.g.: [U] with [1]) and in
each case the name is shown before the field.
The number in the field with a green background shows the harmonic with the ordinal number i of the adjusted parameter (e.g.:
[U] with [1]) and in each case the name is shown before the
field.
The actual ordinal number i is shown in the field
.
With this button it is possible to specify and/or select the harmonics whose values will be shown in
these fields.
By pressing the button [Harm], the following window opens for input:
Figure 10.6: Keyboard window for input the
ordinal number of the desired harmonic
One can enter the ordinal number of the desired harmonic with this keypad. By confirming with [Enter]
this keypad disappears again. The field [History]
shows the ordinal number that was last selected.
98
Summary of displayed parameters:
Total active power and
th
active power of the i harmonic in [W]
total apparent power and
th
apparent power of the i harmonic in [VA]
total reactive power and
th
reactive power of the i harmonic in [VAr]
total power factor
power factor ( cos ϕ i =
Pi
th
) of the i harmonic
Si
phase angle ϕi of the i harmonic
th
r.m.s. value of the total voltage in [V]
THD value of the total voltage in [%]
th
r.m.s. value of the voltage of the i harmonic in [V]
and in [%]
r.m.s. value of the total current in [A]
THD value of the total current in [%]
th
r.m.s. value of the current of the i harmonic
in [A] and in [%]
display of the selected ordinal number and the associated
frequency in [Hz]
Note:
The meaning of the indicated values of some parameters
depends upon the selected circuit diagram (see section 9.2,
page 51).
99
10.2.1.2 Right button panel: menu buttons and their functions
10.2.1.2.1 Overview
... Page 101
... Page 102
... Page 103
... Page 104
... Page 104
... Page 98
... Page 105
(gray)
(green)
... Page 105
100
10.2.1.2.2 Detail
Pressing the button [U] changes the screen to a display of the
threshold levels of the harmonics-voltages, Uν (ν = 1 – 50).
Figure 10.7: Display after pressing the buttons [U] and [1]
The horizontal axis indicates the ordinal numbers 1 - 50 of the
harmonics.
The vertical axis shows the voltage levels of the harmonics in
[%] on a logarithmic scale.
101
Pressing the button [I] changes the screen to a display of the
threshold levels of the harmonics-current, Iν (ν = 1 – 50).
Figure 10.8: Display after pressing the buttons [I] and [1]
The horizontal axis indicates the ordinal numbers 1 - 50 of the
harmonics.
The vertical axis shows the voltage levels of the harmonics in
[%] on a logarithmic scale.
102
Pressing the button [P] changes the screen to a display of the
threshold levels of the harmonics-active power Pν (ν = 1–50). A
red bar appears in the case of positive active power, and a blue
bar in the case of negative active power.
Figure 10.9: Display after pressing the buttons [P] and [1]
The horizontal axis indicates the ordinal numbers 1 - 50 of the
harmonics.
The vertical axis shows the voltage levels of the harmonics in
[W] on a logarithmic scale.
103
Pressing the button [Q] changes the screen to a display of the
threshold levels of the harmonics-reactive power, Qν (ν = 1–50).
A red bar appears in the case of positive reactive power, and a
blue bar in the case of negative reactive power.
Figure 10.10: Display after pressing the buttons [Q] and [1]
The horizontal axis indicates the ordinal numbers 1 - 50 of the
harmonics.
The vertical axis shows the voltage levels of the harmonics in
[VAr] on a logarithmic scale.
With these buttons it is possible to switch on or off each individual phase on the display screen. Only the activated phase is displayed on the screen.
104
After pressing the button [Print] the „Print Panel“ appears.
Their are two possibilities to print the current screen picture:
[Print to BMP]:
Prints (and/or stored) the current screen picture to a bitmap file.
The file is saved in the folder ...\Data2\User\Project\_Print_Outs
on the hard disk of the measurement PC (User/Project are the
names of the created user and/or project, see section 9.2.1.3.2).
[Print]:
The current displayed picture is printed on the default printer
11
12
[ST], section 9.4).
(create a printer see MOP [System] :
$3/
[Cancel]:
Cancel without printing.
This button cannot be activated. It serves only as information about
whether data recording is taking place or not.
(gray)
Data recording is taking place, if this button is green. Data
recording
is activated, but there has not been any recording yet,
(green)
when the button is yellow. To change to the module for data
recording-setup is possible at any time by pressing the button
[Store] in the Module-Options-Panel.
11
12
Module-Options-Panel
Actions-Panel
105
10.3 Oscilloscope
10.3.1 Measurement by means of C.A 8352
option OSCILLOSCOPE
10.3.1.1 Start screen
The C.A 8352 is a high performance power quality analyzer, which makes all
measurements and analysis available simultaneously and in their entirety. If the
equipment settings (see section 9) have been selected and all measurement
connections have been connected, measurement can be started by pressing the
button
[Start Meas]. The Option OSCILLOSCOPE is available after
pressing the button
[Scope]. The following display appears on the screen:
Figure 10.11: Option OSCILLOSCOPE
106
Right button panel:
The right button panel of the window (called action-panel) shows
the menu for changing various field settings and other menu buttons within the option [Scope] (Oscilloscope).
Lower button panel:
The lower button panel of the window shows the Module-Options-Panel, which
permits changing/selection of other options (all options run parallel). By pressing
further options become available. Here the option [Scope] is
the button
selected and appears therefore in the pressed position.
Note:
13
13
All buttons are in the activated position as soon as they are
pressed and/or are displayed in the pressed position when activated.
If the appropriate modules are licensed
107
The left vertical axis shows the voltage scale for those voltage values displayed
as a graph (unbroken lines: U1, U2, U3, UN).
The right vertical axis shows the current scale for those current values displayed
as a graph (dashed lines: I1, I2, I3, IN).
The horizontal axis shows the time axis (the period of a single cycle of an
oscillation).
An information display is found below the oscilloscope screen. This shows the
actual measured r.m.s. values of each input and their available voltage and
current values (here U 1, U2, U3, UN and I1, I2, I3, IN).
10.3.1.2 Options and functions of the oscilloscope
With the oscilloscope module, it is possible to display measured signals in real
time with auto-scaling during a single cycle graphically (in the oscilloscope) and
numerically (in r.m.s. values). The following values can therefore be displayed:
Measurement
value
Remarks
U1, U2, U3, UN
All voltage levels (U1, U2, U3, UN) are displayed both graphically as actual values during a single cycle and numerically as r.m.s. values.
I1, I2, I3, IN
All current values (I1, I2, I3, IN) are displayed both graphically
as actual values during a single cycle and numerically as
r.m.s. values.
Note:
The meaning of the indicated values of some parameters depends
upon the selected circuit diagram (see section 9.2, page 51).
108
10.3.1.3 Right button panel: menu buttons and their functions
10.3.1.3.1 Overview
... Page 110
... Page 110
... Page 110
... Page 110
(gray)
(green)
... Page 111
Only in case of connection diagram 7 (3xUph + 3xIph Y/D) and 8 (3xUph + 3xIph
Y/D + M) following buttons are additionally available:
... Page 111
109
10.3.1.3.2 Detail
With these buttons, it is possible to switch on/off individual voltages. Only activated voltages are displayed on the graph.
The voltages that can be displayed and/or selected depend upon
the selected circuit diagram and measurement type (see section
9.2).
Principally, voltages are represented as unbroken lines on the
graph, whereby the color coding is:
U1 = red
U2 = blue
U3 = green
UN = yellow
With these buttons, it is possible to switch on/off individual currents. Only activated currents are represented as a graph.
The currents that can be displayed and/or selected depend upon
the selected circuit diagram and measurement type (see section
9.2).
Principally, currents are represented as dashed lines on the
graph, whereby the color coding is:
I1 = red
I2 = blue
I3 = green
IN = yellow
Pressing the button [Trigg TR] manually triggers recording, i.e. a
transient "shot" is recorded (see chapter 10.8
Transient
Recorder).
By pressing the button [Print] the „Print Panel“ appears. Within
this panel it is possible to print the current display and/or save it
as a BMP-file. More about this button, see page 105.
110
These buttons are only available in case of connection diagram
7 (3xUph + 3xIph Y/D) and 8 (3xUph + 3xIph Y/D + M).
Showing the [Y] sign in the button means that the displayed voltage values are line-to-earth values (Y-circuit). After pressing the
button [Y] the sign changes to [D].
Showing the [D] sign in the button means that the displayed voltage values are line-to-line values (delta circuit).
This button cannot be activated. It serves only as information about
whether data recording is taking place or not.
Data recording is taking place, if this button is green. Data
recording
is activated, but there has not been any recording yet,
(green)
when the button is yellow. To change to the module for data
recording is possible at any time by pressing the button
(gray)
[Store] in the Module-Options-Panel.
111
10.4 Vector diagram
10.4.1 Start screen
The C.A 8352 is a high performance power quality analyzer, which makes all
measurements and analysis available simultaneously and in their entirety. If the
equipment settings (see section 9) have been selected and all measurement
connections have been connected, measurement can be started by pressing the
button
[Start Meas]. The Option VECTOR is available after pressing the
button
[Vector]. The following display appears on the screen:
Figure 10.12: Option VECTOR
112
Right button panel:
The right button panel of the window (called action-panel) shows
the menu for changing various field settings and other menu
buttons within the option [Vector].
Lower button panel:
The lower button panel of the window shows the Module-Options-Panel, which
permits changing/selection of other options (all options run parallel). By pressing
the button
further options become available. Here the option [Vector] is
selected and appears therefore in the pressed position.
Note:
14
All buttons are in the activated position as soon as they are
pressed and/or are displayed in the pressed position when
activated.
The colored bars (here the bar are for phase 1) contain the
actual values for voltage RMS Ui current RMS, Ii, active power, Pi,
apparent power Si reactive power Qi as well as the power factor
cosϕi and the phase shift ϕi measured at this circuit. The index i
thus indicates the ordinal number of the selected harmonics
and/or inter-harmonics (for harmonic selection, refer to section
10.4.1.2 under button [Harmonic]).
Color representation:
14
Phase 1 = red
Phase 2 = blue
If the appropriate modules are licensed
113
Phase 3 = green
Neutral= yellow
Note:
For the gray bars (appear shaded) see section 10.4.1.2 under
button [U] and/or [I].
The control and information displays are under the vector diagram. The ordinal
number is shown for the harmonics and/or inter-harmonics (here 1 corresponds
fundamental wave) that have been selected for graphical and numeric display (for
selection of the ordinal number see section 10.4.1.2 under the button
[Harmonic]). Additionally, this panel indicates the values for which no
measurement signal is available (here U 1 and I1) via the label "Low".
If you do not select to display
and
together at the same time, you
can see the phase angles for the displayed vectors (with signal U1 as the
reference angle 0°).
Note:
If through the selection of circuit diagrams, the measurement of
a certain input is not provided for, these will not be shown in the
information display under the label "Low".
10.4.1.1 Options and functions of the vector option
A graphical (in a vector diagram) and numerical display of the following values is
possible with the vector module.
Measurement
value
Remarks
All voltage-r.m.s. values (U1, U2, U3, UN) at the connections
will be displayed both graphically and numerically.
U
The selected harmonics and/or inter-harmonics are displayed.
Displayed values generally represent r.m.s. values.
114
All current-r.m.s. values (I1, I2, I3, IN) at the connections will be
displayed (both graphically and numerically).
I
The selected harmonics and/or inter-harmonics are displayed.
Displayed values generally represent r.m.s. values.
The values P (active power), S (apparent power), Q (reactive
P, S, Q
FRV3 3
SRZHU FRV3 SRZHU IDFWRU 3 SKDVH VKLIW EHWZHHQ FXUUHQW
and voltage) of the individual connections (1, 2, 3, N) are
numerically displayed.
The meaning of the indicated values of some parameters depends upon the selected circuit diagram (see section 9.2,
page 51).
Note:
10.4.1.2 Right button panel: menu buttons and their functions
15
Note:
All buttons are in the activated position as soon as they are
pressed and/or are displayed in the pressed position when
activated.
10.4.1.2.1 Overview
... Page 116
... Page 117
... Page 118
... Page 118
(gray)
15
(green)
... Page 118
If the appropriate modules are licensed
115
10.4.1.2.2 Detail
With this button, it is possible to display the r.m.s. values of all
the harmonics of the connected voltages (U1, U2, U3, UN) as
vectors.
Principally, voltages are represented as unbroken lines on the
graph, whereby the color coding is:
U1 = red
U2 = blue
Note:
U3 = green
UN = yellow
It is for the voltage display only, therefore the button [U], when
activated, causes the vector display to be scaled with numeric
values (see Figure 10.13: Numeric voltage-display in the vector
diagram
Figure 10.13: Numeric voltage-display in the vector diagram
In Figure 10.13: Numeric voltage-display in the vector diagram
the gray shaded numerical fields (here in the yellow bar) indicate that these
connections (here, N), depending on the selected circuit diagram, are not
measured.
116
With this button, it is possible to display the r.m.s. values of all
the harmonics of the connected currents (I 1, I2, I3, IN) as vectors.
Generally, currents are represented as dashed lines on the
graph, whereby the color coding is:
I1 = red
I2 = blue
Note:
I3 = green
IN = yellow
It is for the current display only, therefore the button [I], when
activated, causes the vector display to be scaled with numeric
values (see Figure 10.14: Numeric current-display in the vector
diagram
Figure 10.14: Numeric current-display in the vector diagram
In Figure 10.14: Numeric current-display in the vector diagram
the gray shaded numerical fields (here in the yellow bar) indicate that these
connections (here, N), depending on the selected circuit diagram, are not
measured.
117
By pressing the button [Harmonic], the following window opens
for input of the ordinal number of the harmonic or inter-harmonic
that is to be graphically or numerically displayed:
Figure 10.15: Keyboard window for input of the
ordinal number i of the desired harmonic
One can enter the ordinal number of the desired harmonic with this keypad. By
confirming with [Enter] the input value is accepted and the keypad disappears.
By pressing the button [Esc] the input is cancelled without accepting the input
value. The field [History] shows the ordinal number that was last selected. By
pressing the button [Copy] the value in the field “History” is input into the input
field.
Note:
A double click on the field „Harm“ in the control display opens
similarly the input window.
By pressing the button [Print] the „Print Panel“ appears. Within
this panel it is possible to print the current display and/or save it
as a BMP-file. More about this button, see page 105.
This button cannot be activated. It serves only as information about
whether data recording is taking place or not.
Data recording is taking place, if this button is green. Data
(green) recording is activated, but there has not been any recording yet,
when the button is yellow. To change to the module for data
recording is possible at any time by pressing the button
(gray)
[Store] in the Module-Options-Panel.
118
10.5 Power and Energy Analyzer
10.5.1 Measurement by means of the C.A 8352
option POWER
10.5.1.1 Start screen
The C.A 8352 is a high performance power quality analyzer, which makes all
measurements and analysis available simultaneously and in their entirety. If the
equipment settings (see section 9) have been selected and all measurement
connections have been connected, measurement can be started by pressing the
button
[Start Meas]. The Option POWER is available after pressing the
button
[Power]. The following display appears on the screen:
Figure 10.16: Option POWER
119
Right button panel:
The right button panel of the window (called action-panel) shows
the menu for changing various field settings and other menu buttons within the option [Power].
Lower button panel:
The lower button panel of the window shows the Module-Options-Panel, which
permits changing/selection of other options (all options run parallel). By pressing
further options become available. Here the option [Power] is
the button
selected and appears therefore in the pressed position.
16
Note:
All buttons are in the activated position as soon as they are
pressed and/or are displayed in the pressed position when activated.
10.5.1.2 Options and functions in detail
The following measurements are possible with the Power module:
Functions/
Options
U in [V]
I in [A]
16
Remarks
voltage r.m.s value, of all connections
(1, 2, 3, N and 3-phase)
current r.m.s. value of all connections
(1, 2, 3, N and 3-phase)
If the appropriate modules are licensed
120
f in [Hz]
active power of all connections
(1, 2, 3, N and 3-phase)
apparent power of all connections
(1, 2, 3, N and 3-phase)
reactive power of all connections
(1, 2, 3, N and 3-phase)
active power of the fundamental harmonic
of all connections (1, 2, 3, N and 3-phase)
reactive power of the fundamental harmonic
of all connections (1, 2, 3, N and 3-phase)
power factor of the fundamental harmonic
of all connections (1, 2, 3, N and 3-phase)
total power factor
of all connections (1, 2, 3, N and 3-phase)
active energy (power consumption)
of all connections (1, 2, 3, N and 3-phase)
apparent energy (power consumption)
of all connections (1, 2, 3, N and 3-phase)
reactive energy (power consumption)
of all connections (1, 2, 3, N and 3-phase)
active energy of the fundamental harmonic
(power consumption)
of all connections (1, 2, 3, N and 3-phase)
reactive energy of the fundamental harmonic
(power consumption)
of all connections (1, 2, 3, N and 3-phase)
applied active energy (power consumption)
of all connections (1, 2, 3, N and 3-phase)
produced active energy (power consumption)
of all connections (1, 2, 3, N and 3-phase)
applied inductive reactive energy (power
consumption)
of all connections (1, 2, 3, N and 3-phase)
applied capacitive reactive power (power
consumption)
of all connections (1, 2, 3, N and 3-phase)
mean frequency of the connections (1, 2, 3)
α u in [%]
unbalance factor of the voltage
P in [kW]
S in [kVA]
Q in [kVAr]
P1 in [kW]
Q1 in [kVAr]
cos ϕ
PF
AP in [kWh]
AS in [kVA]
AQ in [kVAr]
AP1 in [kWh]
AQ1 in [kVAr]
APin in [kWh]
APout in [kWh]
AQL in [kVAr]
AQC in [kVAr]
Note:
The meaning of the indicated values of some parameters depends
upon the selected circuit diagram (see section 9.2, page 51).
121
10.5.1.3 Right button panel: menu buttons and their functions
10.5.1.3.1 Overview
... Page 123
... Page 124
... Page 123
... Page 124
... Page 125
... Page 126
... Page 126
... Page 127
... Page 127
(gray)
(green)
... Page 127
122
10.5.1.3.2 Detail
After pressing this button, a tabular listing of instantaneous values
of various measurement parameters (e.g. voltage, current and
power parameters) appears in the upper area of the display:
indicated
parameter
of
phase L1
of
phase L2
of
phase L3
of the
three-phase
system
of
phase N
Figure 10.17: Upper display area
in the module [Power] – option „Table“
The meaning of the indicated parameters is described in section
10.5.1.2 „Options and functions in detail“.
In the lower display area, depending upon the set display mode,
different values are shown:
•
Display in "Energy" mode:
This mode is activated when the button [Energy] is
pressed.
It shows a listing of all energies measured since the last
initialization (see page 124):
123
indicated
parameter
of
phase L1
of
phase L2
of
phase L3
of the
three-phase
system
of
phase N
Figure 10.18: Lower display area in the module [Power]
– option „Table“ – „Energy“- mode
The meaning of the indicated parameters is described in section
10.5.1.2 „Options and functions in detail“.
By pressing the button [Init Energy] the display of all
indicated energy values (AP, AS, AQ, …AQC) is set
to the value 0.
•
Display in the „Maximum“ – mode:
This mode is activated by pressing the button [Max].
It shows the maximum values of different measurement
parameters of the last save interval (for setting the
memory interval, see section 9.3)
124
indica ted
param e te r
of
phase L1
of
pha se L2
phas e
Figure 10.19: Lower display area in the module [Power]
– option „Table“ – „Maximum“- mode
The meaning of the indicated parameters is described in section
10.5.1.2 „Options and functions in detail“. The field "Time Min/Max"
shows the date and time at the completion of the last save interval.
•
Display in the „Minimum“ – mode:
This mode is activated by pressing the button [Min]. It
shows the minimum values of different measurement
parameters of the last save interval (for setting the
memory interval, see section 9.3)
indic ated
param eter
of
phase L1
of
phase L2
p hase
Figure 10.20: Lower display area in the module [Power]
– option „Table“ – „Minimum“-mode
125
The meaning of the indicated parameters is described in section
10.5.1.2 „Options and functions in detail“.
The field "Time Min/Max" shows the date and time at the completion
of the last save interval.
After pressing this button, a time dependence display appears of
U, I, P and Q for all connected phases.
Figure 10.21: Display after pressing the button [Chart]
With these buttons, it is possible to switch on/off each
individual phase on the display. Only the activated
phases are shown on the display and their buttons
appear in the pressed position, e.g.:
.
126
Overview of the displayed diagrams:
The horizontal axis is the time axis and is scaled in 10-minute-intervals. The
scaling of the vertical axis of the diagrams dynamically follows the corresponding
measured values.
Time dependence of the
voltage r.m.s. values of the set
phases in [V]
Time dependence of the
current r.m.s. values of the set
phases in [A]
Time dependence of the
active power of the
set phases in [kW]
Time dependence of the
reactive power of the
set phases in [kVAr]
By pressing the button [Print] the „Print Panel“ appears. Within
this panel it is possible to print the current display and/or save it
as a BMP-file. More about this button, see page 105.
Pressing the button [Pause] “freezes” the actual displayed values
(the [Pause] button is displayed in the pressed position). The
indicated values are again updated by pressing this button again.
(gray)
(green)
This button cannot be activated. It serves only as information
about whether data recording is taking place or not.
Data recording is taking place, if this button is green. Data
recording is activated, but there has not been any recording yet,
when the button is yellow. To change to the module for data
recording is possible at any time by pressing the button
[Store] in the Module-Options-Panel.
127
10.6 Flicker meter
10.6.1 Measurement by means of the C.A
8352 option FLICKER
10.6.1.1 Start screen
The C.A 8352 is a high performance power quality analyzer, which makes all
measurements and analysis available simultaneously and in their entirety. If the
equipment settings (see section 9) have been selected and all measurement
connections have been connected, measurement can be started by pressing the
button
[Start Meas]. The Option FLICKER-METER is available after
pressing the button
[Flicker]. The following display appears on the screen:
Figure 10.22: Option FLICKER METER
Note: If a measurement has already been started, a screen with "Wait for flicker
filter" appears for 2 minutes in the upper window.
W a it fo r flic ker filter.
128
Right button panel:
The right button panel of the window (called action-panel) shows
the menu for changing various field settings and other menu
buttons within the option [Flicker] (Flicker meter).
Lower button panel:
The lower button panel of the window shows the Module-Options-Panel, which
permits changing/selection of other options (all options run parallel). By pressing
further options become available. Here the option [Flicker] is
the button
selected and appears therefore in the pressed position.
Note:
17
All buttons are in the activated position as soon as they are pressed and/or are displayed in the pressed position when activated.
10.6.1.2 Options and functions in detail
With the Flicker Meter module the following measurements are possible:
Measurement value /
Functions
Remarks
P(t) - Measurement
current flicker strength (display range 200 ms)
Pst - Measurement
short term flicker measurement
Plt - Measurement
long term flicker measurement
Note:
18
19
The meaning of the indicated values of some parameters depends upon the selected circuit diagram (see section 9.2, page 51).
17
If the appropriate modules are licensed
Pst with a interval Tst = 10 min (according to standard IEC 61000-4-15 & EN50160)
19
Plt with a interval Tlt = 2 h (according to standard IEC 61000-4-15 & EN50160)
18
129
10.6.1.3 Right button panel: menu buttons and their functions
20
Note:
All buttons are in the activated position as soon as they are pressed and/or are displayed in the pressed position when activated.
10.6.1.3.1 Overview
... Page 131
... Page 132
... Page 133
... Page 133
(gray)
20
(green)
... Page 133
If the appropriate modules are licensed
130
10.6.1.3.2 Detail
Pressing the button [Flicker] changes the screen to the following
display:
Figure 10.23: Display after pressing the button [Flicker]
The window is partitioned so that three diagrams can fit in it. The uppermost diagram shows the flicker value, P, currently being measured over a time
window of 200 ms.
The second diagram shows the measured short-term flicker Pst (the value with a
short-term interval of 10 min, calculated statistically according to the relevant
regulations and standards).
The third diagram shows the measured long-term flicker Plt (the value with a
long-term interval of 120 min = 2h, calculated statistically according to the relevant
regulations and standards).
131
The value of the flicker strength is shown on the vertical axis and the horizontal
axis shows the time interval of the measurement, with time and date, over a time
window of 24 h.
Note:
This flicker display contains all measurement values, i.e. with
the computation of the displayed values, no correction is made
21
according to IEC 61000-4-30 .
Pressing the button [Fli./50160] does not change the structure of
the screen display. For the description of the individual normal
ranges, see the description of the button [Flicker], page 131.
Figure 10.24: Display by activated button [Fli./50160]
In the available display mode (see Fig. 10.24), corrections are made to the
measured values regarding special interruptions, disruptions and increases
of the measured voltage. These special interruptions, etc. are those, which
are defined according to EN 50160 as as "events" (so-called "flagged"
measured values), as they are interruptions, dips/sags and swells. The
display in this mode shows (final) measurement values, i.e. the flicker values
22
without the calculation of these "special" events .
21
Flagging concept for interruptions, dips/sags and swells (for further details see
[2]).
22
See [2]
132
Note:
When one of these "events" is detected, the display "Event Detected"
appears in the upper window.
This display occurs in both display modes.
With these buttons, it is possible to switch individual phases on
or off. Only activated phases are displayed as graphs.
By pressing the button [Print] the „Print Panel“ appears. Within
this panel it is possible to print the current display and/or save it
as a BMP-file. More about this button, see page 105.
This button cannot be activated. It serves only as information about
whether data recording is taking place or not.
(gray)
Data recording is taking place, if this button is green. Data
recording is activated, but there has not been any recording yet,
(green) when the button is yellow. To change to the module for data
recording is possible at any time by pressing the button
[Store] in the Module-Options-Panel.
133
10.7 EN 5016023
(Characteristics of the voltage in public power supply grids)
10.7.1 Start screen
The C.A 8352 is a high performance power quality analyzer, which makes all
measurements and analysis available simultaneously and in their entirety. If the
equipment settings (see section 9) have been selected and all measurement
connections have been connected, measurement can be started by pressing the
button
[Start Meas]. The Option 50160 is available after pressing the
button
[50160]. The following display appears on the screen:
Figure 10.25: Option 50160
23
Text passages from the Standard that are quoted literally are italicised; see [1]
134
Right button panel:
The right button panel of the window (called action-panel) shows
the menu for changing various field settings and other menu buttons within the option [50160].
Lower button panel:
The lower button panel of the window shows the Module-Options-Panel, which
permits changing/selection of other options (all options run parallel). By pressing
further options become available. Here the option [50160] is
the button
selected and appears therefore in the pressed position.
24
Note:
All buttons are in the activated position as soon as they are pressed and/or are displayed in the pressed position when activated.
Note:
The evaluation criteria (threshold settings) which are used in this
measurement option are defined prior to beginning measurement: see section 9, page 56
In this display, all relevant values of the EN 50160 analysis are listed (for further
details, see section 10.7.1.2.1, [Complex] button).
24
If the appropriate modules are licensed
135
(green)
(red)
These control fields make it possible for the user to receive a
quick overview of the fulfillment of the EN 50160 criteria.
The following applies to the green field:
The value lies within the EN 50160 limits.
The following applies to the red field:
The value lies outside the EN 50160 limits.
(for further details, see section 10.7.1.2.1, [Complex] button).
Under the matrix display of the 50160 analysis, there is a control and information display (for further details, see section 10.7.1.2.1 [Complex] button).
10.7.1.1 Options and functions in detail
Complex analysis is possible with the 50160 Module according to EN 50160. The
following analysis is performed and the results are represented graphically and/or
numerically.
Analysis
parameter
Remarks
The following values are displayed numerically:
Frequency
Minimum frequency (fmin)
Maximum frequency (fmax)
The following is performed
the analysis according to EN 50160 (> 95%), as well as
the analysis EN 50160 (100%).
136
The following values are displayed numerically for each individual phase:
Minimum measurement voltage (Umin)
Maximum measurement voltage (Umax)
The following is performed
the analysis according to EN 50160 (> 95%), as well as
the analysis EN 50160 (100%).
The voltage levels are generally expressed as average values
over a storing period of 200ms –RMS-values.
Voltage
The detection and display of voltage - Events (Dips,
interruptions, swells) with following parameters:
Date and Time of the event
phase, on which the event occurred
Extrema in [V]
Duration in [s]
Classification in Extrema-value and duration
The detection and display of Rapid Voltage Changes (RVC)
with following parameters:
Date and Time of the RVC
phase, on which the RVC occurred
dmax in [%]
dc in [%]
Duration in [s]
Classification in dc-value and duration
The following value is generally displayed numerically for each
individual phase:
Flicker
Long-term flicker strength Pltmax
The following is performed:
THD
and
harmonics
the analysis according to EN 50160 (> 95%)
The following values are displayed numerically for each individual phase:
Maximum total harmonic content THDmax in [%]
The following is performed:
the analysis according to EN 50160 (> 95%)
137
Additionally an exact graphical analysis of the individual harmonics (harmonics value) is possible.
The following values are displayed numerically:
Voltage
unbalance
αmax in [%]
The following is performed:
the analysis according to EN 50160 (> 95%)
The following values are displayed numerically for each individual phase:
Signal
voltages,
ripple control
signals
Maximum signal voltage (Usigmax)
The following is performed:
the analysis according to EN 50160 (> 99%)
The voltage levels are generally expressed as r.m.s. values
Note:
The meaning of the indicated values of some parameters depends upon the selected circuit diagram (see section 9.2,
page 51).
10.7.1.2 Right button panel: menu buttons and their functions
10.7.1.2.1 Overview
... Page 139
... Page 143
... Page 144
... Page 146
... Page 148
138
... Page 144 and Page 145
... Page 149
... Page 149
(gray)
(green)
... Page 149
10.7.1.2.2 Detail
After pressing the button [Complex] a display appears which gives
a quick overview of the different limits of the relevant parameters
for evaluation according to the Standard EN 50160, (their exceeding and/or fulfillment). The following screen appears:
Figure 10.26: Display after pressing the button [Complex]
Note:
The buttons [1] [2] [3] of the menu cannot be activated with the
[Complex] button activated and are therefore represented with a
gray background.
139
The representation of the parameters and their limits is in matrix form. The
individual parameters relevant to the EN 50160 analysis are specified among the
lines of the matrix. The Min-, Max- and threshold values are listed adjacent to
each other in columns of the matrix.
Figure 10.27: Example matrix display Frequency
serves as an example of the parameter frequency.
Min: shows the minimum value fmin of the frequency measured since the last
initialization (see button [Init ] page 149).
Max: shows the maximum value fmax of the frequency measured since the last
initialization (see button [Init ] page 149).
EN50160(>95%): To meet the standard according to EN 50160, the 10-second
average values of the fundamental frequency during 95% of one week must be
within the range 50 Hz ± 1% (i.e. 49,5 to 50,5 Hz) (this regulation applies only to
networks with a connection to a interconnected grid system). This part of the
array displays the current percentage of the current measurement, in which the
frequency has been within the range.
EN50160(>100%): To meet the standard according to EN 50160, the 10-second
average values of the fundamental frequency during 100% of one week must lie
within the range 50 Hz ± 4% / -6% (i.e. 47 to 52 Hz) (this regulation applies only to
networks with a connection to a interconnected grid system). ). This part of the
array displays the current percentage of the current measurement, in which the
frequency has been within the range.
Figure 10.28: Example matrix display Voltage
In Figure 10.28: Example matrix display Voltage
the voltage range serves as an example of the description the matrix display. The
value of the reference voltage is shown under the word “Voltage” (for setting the
25
26
[Setup]
[EN50160]). The
$3
reference level, refer MOP
[System]
:
25
26
Module-Options-Panel
Actions-Panel
140
:
values of the phases are indicated by different colors. The following color code
applies:
Phase 1 = red
Phase 2 = blue
Phase 3 = green
Min: shows the minimum value Umin, which means minimum value of all 10
minute-average-RMS-values of the voltage measured since the last initialization
(see button [Init ] page 149).
Max: shows the maximum value Umax, which means maximum value of all 10
minute-average-RMS-values of the voltage measured since the last initialization
(see button [Init ] page 149).
EN50160(>95%): To meet the standard according to EN 50160, the 10-minute
average values of the r.m.s. values of the supply voltage during 95% of a weeklong interval must lie within the range ± 10%. This part of the array displays the
current percentage of the current measurement, in which the voltage RMS10minutes-average values have been within the range.
EN50160(>100%): To meet the standard according to EN 50160, the 10-minute
average values of the r.m.s. values of the supply voltage during 100% of a weeklong interval must be within the range + 10% and – 15% . This part of the array
displays the current percentage of the current measurement, in which the voltage
RMS-10minutes-average values have been within the range.
The following applies for further displays in the column EN50160(>95%):
Flicker:
To meet the standard according to EN 50160, the long-term flicker
strength, Plt, may not exceed the value 1 during 95% of any week-long
period. This part of the array displays the current percentage in which
the long-term flicker strength has not exceeded the value 1.
THD (total harmonic distortion): To meet the standard according to EN 50160, the
total harmonic distortion, THD, of the supply voltage may not exceed
the value 8% during 95% of the time. This part of the array displays the
current percentage in which the value 8% has not exceeded.
Unbalance: To meet the standard according to EN 50160, the 10-minute average
value of the r.m.s. values of the negative sequence components must
be smaller than 2% of the corresponding positive sequence system components during 95% of each week-long interval. This part of the matrix
displays the current percentage in which the standard is met by <2%.
141
The column Max indicates the value of αmax in [%] for the row
Unbalance.
Note:
Harmonics: To meet the standard according to EN 50160, 95% of the 10-minute
average values of the voltage r.m.s. values of each individual harmonic
may not exceed the values shown in EN50160 within any week-long
interval. If this standard is met, the indicator for this line is green.
Note:
After pressing the button [Spectrum], a more precise view of the
frequency analysis is available. In particular the red indicator (i.e.
EN 50160 criterion is not fulfilled) shows whether or not the
result of the frequency analysis is within harmonic levels.
Total result:
(green)
If all criteria for the fulfillment of the standard according to EN 50160
are met, the appropriate indicator in the row is green.
The indicator for a fast overview
(red)
The indicator makes it possible for the user to receive a quick overview of the
fulfillment of the criteria according to EN 50160. If the indicator is green, the
parameter in the given row lies within the expected range according to
EN 50160. If indicator is red the parameter does not fulfill the criteria according to
EN 50160.
The control and information display gives information about the status, the
reference voltage and the starting time of the measurement.
Status
The flashing red display "Voltages Out of Range" indicates that the
measured voltage/s lie outside of the voltage measurement range.
Wait For Flic ker Filters
142
Start
Time
The flashing red display "Wait For Flicker Filters" at the beginning of
the measurement (and after pressing the button [Init]) points out that
values can only be measured after a few seconds (after initialization
and activation of the flicker filter). Once the flicker filter is available, the
flashing display disappears.
Indicates the starting time (date and hour) of the measurement. By
pressing the button [Init], all array elements are initialized (deleted),
the start time display changes to the current date and time and a new
measurement begins.
After pressing the button [Spectrum] a display of the frequency
analysis appears:
Sp ectru m
Figure 10.29: Display after pressing the button [Spectrum]
The vertical axis indicates the percentage of the harmonic voltage by the
reference voltage on a logarithmic scale. The horizontal axis carries the individual
ordinal numbers of the harmonics. The following values and/or limits are marked in
the diagram:
The blue marking
gives the threshold for the individual har-
monic values according to EN 50160
The green line
indicates the average value of 95% of the
"best" values of the measurement time period.
143
The red cross
marks the maximal measured voltage level
over the complete measurement time period.
The phase, which is to be represented, is
selected with these buttons.
After pressing the button [Events], the display of tabulated events
of the measured voltages appears. The following picture appears:
Figure 10.30: Display after pressing the button [Events]
In the upper half of the screen, the height and duration of the individual voltage
fluctuations since the last initialization are displayed in the form of a matrix. The
ranges of the residual voltages of the events are defined in the first column and
ranges for the duration of the events at the top of each row.
Reference Values:
>110% means the fluctuation had a level of more than 110% of the reference
voltage.
<90% means the residual voltage was lower than 90% of the reference voltage.
The equivalent applies to <75%; <55%; <35% and <15%.
The rows Total<, Total> and Total indicate the sums of the different events. For
example, Total< shows the summed number of events (fluctuations) that were
144
<90%, <75%; <55%; <35% and <15% of the reference voltage. Total shows the
entire sum of a column (one time interval).
Note:
:
:
The value limits (>110%, <90%, etc.) can be set under MOP
28
$3
[Setup]
[System]
[EN50160].
27
Reference time ranges:
The time interval indicates the duration of the fluctuation.
The events lasted
<2p:
…shorter than 2 periods of the reference voltage
<10p: …shorter than 10 periods of the reference voltage
<1s:
…shorter than 1 second
<10s: …shorter than 10 seconds
<1m: …shorter than 1 minute
<10m. …shorter than 10 minutes
<1h:
…shorter than 1 hour
>1h:
…longer than 1 hour
Total: Indicates the sum of all events in a row (one range of values).
The individual events are tabulated in the lower half of the screen with:
Date (date when the event occurred),
Time (time-point when the event began, start time),
Phase (location of the event),
Extrema (residual voltage in [V]) and
Duration (time interval),
listed since the last initialization.
Note:
events are only registered in the event table and/or event list, if
the event is terminated.
With these buttons it is possible to select the phase
for which the event table (upper half of screen) is to
be presented. The event list’s display (lower half of
screen) is independent of the choice of phase.
27
28
Module-Options-Panel
Actions-Panel
145
After pressing the button [RVC Events], a display of tabulated
RVCs (Rapid voltage changes) of the measured voltages is
shown. The following picture appears:
Figure 10.31: Display after pressing the button [RVC Events]
In the upper half of the screen (“RVCH Table (dc/t)”), the dc-value (relative
steady-state voltage change) and the duration of the RVC since the last
initialization are displayed in the form of a matrix. The ranges of dc of the RVCs
are defined in the first column and ranges for the duration of the RVCs at the top
of each column.
Reference dc -values:
<1% means the difference between the initial steady-state voltage and the
steady-state voltage at the end of the RVC is less than 1% of the initial one
(relative steady-state voltage change dc <1%)
The equivalent applies to <2%; <3%; <4% …. and <9%.
> 9% means that the dc value is between 9% and 19,99% (otherwise it must be a
dip).
The row/column Total indicates the sums of the different RVCs of the appropriate
column/row.
Note:
29
30
:
:
:
Limits for the detection algorithm of RVCs can be set under
29
30
MOP [System]
$3
[Setup]
[EN50160]
[RVC].
Module-Options-Panel
Actions-Panel
146
Reference time ranges:
The time interval indicates the duration of the RVCs.
The RVCs lasted
<200ms: …shorter than 200ms
<500ms: …shorter than 500ms
<1s:
…shorter than 1 second
<10s: …shorter than 10 seconds
>10s: …longer than 10 seconds
The individual RVCs are listed in the lower half of the screen (“RVCH Events”)
with:
Date (date when the RVC occurred),
Time (time-point when the RVC started),
Phase (location of the RVC),
dmax [%] (maximum relative voltage change in % UN)
dc [%] (relative steady-state voltage change in % UN)
Duration (of the RVC),
listed since the last initialization.
With these buttons it is possible to select the phase
for which the RVC matrix (upper half of screen) is to
be presented. The RVC list display (lower half of
screen) is independent of the choice of phase.
147
After pressing the button [RVC Eval], a display with a statistical
evaluation of RVCs according to IEC 61000-3-7 is shown. The
following picture appears:
Figure 10.32: Display after pressing the button [RVC Eval]
On this display you can see an automatic evaluation of RVCs according to IEC
61000-3-7. The PNA collects all occurring RVCs every hour and evaluates them
afterwards.
Upper table:
The column “Actual hour” shows the number of RVCs (“Rapid voltage changes”)
and the maximum dmax (“dmax”), which occurred during the running evaluationhour, sorted by phases.
After one full hour PNA-software evaluates all these RVCs according to the limits,
described in the columns “dmax” and “changes per hour”.
The column “Hours” shows the amount of evaluated hours, in which the RVCs
were inside the limits (“OK”) and the number of evaluated hours, in which the
RVCs exceeded the limits (“Above Lim.”).
The column “percentil” shows the percentage of the evaluated hours, in which the
RVCs were inside the limits (“OK”).
Lower table:
In addition to the information described for the upper table, the evaluation display
classifies the informations in several dmax-value-parts.
148
By pressing the button [Init] all current values in the display (and
measurement values to this point) are deleted and a new measurement procedure is initialized (started).
Note:
The button [Init] is not available in the active memory mode (i.e.
button [Store] is green). An initialization can only be done if the
memory procedure is terminated prior to this (see also section 9.3).
By pressing the button [Print] the „Print Panel“ appears. Within
this panel it is possible to print the current display and/or save it
as a BMP-file. More about this button, see page 105.
This button cannot be activated. It serves only as information about
whether data recording is taking place or not.
(gray)
Data recording is taking place, if this button is green. Data
recording is activated, but there has not been any recording yet,
(green) when the button is yellow. To change to the module for data
recording is possible at any time by pressing the button
[Store] in the Module-Options-Panel.
149
10.8 Transient Recorder
10.8.1 Start screen
The C.A 8352 is a high performance power quality analyzer, which makes all
measurements and analysis available simultaneously and in their entirety. If the
equipment settings (see section 9) have been selected and all measurement connections have been connected, measurement can be started by pressing the
button
[Start Meas]. The Option TRANSIENT is available after pressing
the button
[Transient]. The following display appears on the screen:
Figure 10.33: Option TRANSIENT
150
Right button panel:
The right button panel of the window (called action-panel) shows
the menu for changing various field settings and other menu
buttons within the option [Transient].
Lower button panel:
The lower button panel of the window shows the Module-Options-Panel, which
permits changing/selection of other options (all options run parallel). By pressing
the button
further options become available. Here the option [Transient] is
selected and appears therefore in the pressed position.
Note:
31
All buttons are in the activated position as soon as they are
pressed and/or are displayed in the pressed position when
activated.
10.8.2 Options and functions in detail
The following measurements are possible with the Transient module:
Recognizing, saving, listing and temporally representing of user-defined events.
Technical specifications:
maximum sampling rate in [Hz]:
38400 Hz (with 1-phase measurement)
19200 Hz (with 3-phase-measurement)
9600 Hz (with 4-phase measurement)
maximum number of samples able
to be saved per event:
61440 (corresponding to a recording of
6,4 s with 1-phase measurement)
31
If the appropriate modules are licensed
151
The meaning of the indicated values of some parameters depends
upon the selected circuit diagram (see section 9.2, page 51).
Note:
10.8.3 Right button panel: menu buttons and their functions
10.8.3.1 Overview
... Page 153
... Page 154
... Page 155
... Page 156
... Page 158
... Page 160
... Page 164
... Page 164
... Page 165
... Page 166
(gray)
(green)
... Page 166
(gray)
(red)
... Page 166
152
10.8.3.2 Detail
Pressing the button [U] changes the screen to a display of the
criteria able to be selected for voltage events.
Figure 10.34: Display after pressing the button [U]
Criteria able to be selected for voltage events:
temporal increase in
voltage in [kV/ms]
changes in 10ms RMS
value of the voltage in
[V]
maximum value of the
voltage in [V]
10ms RMS value of the
voltage in [V];
with “Min Time [s]” you
can enter a minimum
duration, for which the
153
set limits must be
exceeded to start the
transient recording
r.m.s. value of the
harmonic component of
the voltage in [V], which
is to be set in the field
total harmonic distortion
(THD factor) of the
voltage in [%]
You will find a detailed description of the selection procedure on page 159.
Pressing the button [UD] changes the screen to a display of the
criterias, which can be selected for trigger events of the
calculated line-to-line voltages.
Figure 10.35: Display after pressing the button [UD]
Note:
The button
is only selectable, if you use connection
diagram 7 (3xUph + 3xIph Y/D) or connection diagram 8 (3xUph
+ 3xIph Y/D + M), see page 46, because only with these
connection diagrams line-to-line voltages are calculated from
measured line-to-earth voltages.
154
Criterias, which can be set for the calculated line-to-line voltages:
maximum value of the
voltage in [V]
10ms RMS value of the
voltage in [V]; with “Min
Time [s]” you can enter a
minimum duration, for
which the set limits must
be exceeded to start the
transient recording
You will find a detailed description of the selection procedure on page 159.
Pressing the button [I] changes the screen to a display of the
criteria able to be selected for current events.
Figure 10.36: Display after pressing the button [I]
temporal increase in
current in [kA/ms]
changes in 10ms RMS
value of the current in [A]
155
maximum value of the
current in [A]
10ms RMS value of the
current in [A];
with “Min Time [s]” you
can enter a minimum
duration, for which the
set limits must be
exceeded to start the
transient recording
r.m.s. value of the
harmonic component of
the current in [A], which
is to be set in the field
total harmonic distortion
(THD factor) of the
current in [%]
You will find a detailed description of the selection procedure on page 159.
Pressing the button [P] changes the screen to a display of the
criteria able to be selected for power events.
156
Figure 10.37: Display after pressing the button [P]
Criteria able to be selected for power events:
changes in active power
in [W]
active power in [W]
active power of the
fundamental frequency
in [W]
reactive power in [VAr]
reactive power of the
fundamental frequency
in [VAr]
157
apparent power in [VA]
You will find a detailed description of the selection procedure on page 159.
Pressing the button [Other] changes the screen to a display of
the criteria able to be selected for special event criteria.
Figure 10.38: Display after pressing the button [Other]
Criteria able to be selected:
This button activates/
deactivates the
possibility to trigger a
transient recording via
a connected external
TTL input signal
By pressing the button [OFF] the designation of the
button changes to [ON].
158
Unbalance factor of the
3-phase voltage α U in
[%]
Power factor of the
complete signal
cosPhi
(power factor of the
fundamental frequency)
frequency in [Hz]
frequency change in
[Hz]
You will find a detailed description of the selection procedure on page 159.
Explanation of the selection procedure:
An event is detected if the measurement variable
is outside the range enclosed by the selected
high value (upper field) and the selected low
value (lower field).
The input of the high value (upper
field) and/or low value (lower field)
takes place via clicking on the appropriate field and associated activation of the keypad window:
By pressing the button
the display of the button changes to
and
activates the following selection option:
An event is detected if the measurement variable
is inside the range enclosed by the selected high
value (upper field) and the selected low value
(lower field).
159
The input of the high value (upper
field) and/or low value (lower field)
takes place via clicking on the appropriate field and associated activation of the keypad window:
Note:
This keypad offers the possibility of entering the values +infinity
(„ +∞ “) and -infinity („ −∞ “).
buttons,
By pressing one of the
the connected phases, which are
to be monitored regarding the predefined event, can be selected separately. The buttons then take on
the designation and color of the
selected phase. If a phase is not
connected, it is gray in color.
e.g.:
Pressing the button [Pretrig] changes the screen to a display of
the some special parameters for the transient recorder function.
Figure 10.39: Display after pressing the button [Pretrig]
160
Description of the selectable special parameters:
In total 61440 samples with a
sampling rate of up to 38400 Hz
(with 1-phase measurement) can
be stored. A pre-trigger range and
a post-trigger range can be
selected by shifting the black bar:
Note: These settings can only be
changed,
if
there
is
no
measurement
with
activated
transient storing running.
This field indicates the number of samples that are detected
before the occurrence of the event. This value changes automatically with the movement of the black bar.
In this field the sampling rate of the transient recorder
(number of signal samplings performed per second) is
displayed. With 1-phase measurement it is possible to
have a maximum scanning rate of 38400 Hz, with 3-phase
measurement a maximum scanning rate of 19200 Hz, and
with 4-phase measurement a maximum scanning rate of
9600 Hz. The input is made by clicking on the field and
marking the desired value in the displayed list.
This field indicates the number of samples that are detected
after the occurrence of the event. This value changes automatically with the movement of the black bar.
Within this range, a special trigger
suppression can be activated and
/or deactivated:
161
For example: If the decrease of a parameter below a certain threshold value is
defined as a trigger characteristic (e.g. threshold value for voltage r.m.s. value is
200V) and there is a long, persisting total failure of this parameter (e.g. a voltage
interruption for some seconds), the transient recorder triggers continuously with
storing always the same information.
In order to prevent such an incident, it is possible to deactivate the trigger automatically, when the voltage of the triggered phase falls below the Dropout Level
Lo in [V] or rises above the Dropout Level Hi in [V] for a duration longer than
the time specified in Dropout Time in [sec].
This special trigger suppression is activated by pressing the
deactivated by pressing the
button and
button.
minimum duration of the Dropout Level exceedings
Dropout Level Hi for the upper threshold and Dropout Level
Lo for the lower threshold, which start the trigger
suppression, when exceeded.
This field serves purely as an information field for the selected measurement range end value for the r.m.s. values of
the voltage of phase 1 in the module [System].
This field indicates by its red color whether a voltage failure
(defined above) takes place and thus triggering is deactivated.
With the selection of
[OR], an event is
detected as soon as
one of the selected
event criterias occurs.
(„OR“-link)
By pressing the button [OR] the designation of the
button changes to [AND].
With the selection of
[AND] an event is
detected only if all
selected event criteria
occur simultaneously.
(„AND“-link)
162
In this field, the maximum number
of trigger events, which can be
saved, can be defined and the
number of already stored transients
is
shown.
Additional
the
functionality of the HW-digital-outsignal can be set.
Enter the maximum number of transients, which are
allowed to be stored by the software.
With this button the HW-digital-out-signal can be
activated. There are two possibilities to get the HWdigital-out HIGH:
If the “Trigg Status” characters are present each
transient recording causes a HW-digital-out HIGH.
Are the “Max Events” characters present the HW-digitalout is set to HIGH by reaching the maximum number of
events, which are allowed to be stored.
This field shows the number of already stored transients.
163
Pressing the button [Event Table] changes the display to a tabular
representation of the detected events.
Figure 10.40: Display after pressing the button [Event Table]
Tabular representation in overview:
con se cutiv e num be ring
of e ve nts
date of even t
entra nce
pha se ,
in w h ich th e e vent
w a s detected
tim e o f even t
entra nce
crite rio n,
that to a eve nt
dete ction le d
+ .. even t proce ss
w a s saved
Pressing the button [Clear Events] just clears the list, but does not really delete
the stored transients.
164
Pressing the button [Scope] shows voltages and currents of the
last detected event (200ms around the trigger point).
Figure 10.41: Display after pressing the button [Scope]
Description of the display areas:
Event number and time of the given
event
Time period of the measured voltages in the time window of 200 ms
around the given event:
(color coding of the phases:
1...red;
2...blue;
3...green;
N...yellow)
Time period of the measured currents in the time window of 200 ms
around the given event:
(color coding of the phases:
1...red;
2...blue;
3...green;
N...yellow)
Pressing the button [Trigg Now!] manually triggers recording,
i.e. a transient "shot" is recorded.
165
By pressing the button [Print] the „Print Panel“ appears. Within
this panel it is possible to print the current display and/or save it
as a BMP-file. More about this button, see page 105.
(gray)
(green)
This button cannot be activated. It serves only as information
about whether data recording is taking place or not.
Data recording is taking place, if this button is green. Data
recording is activated, but there has not been any recording yet,
when the button is yellow. To change to the module for data
recording is possible at any time by pressing the button
[Store] in the Module-Options-Panel.
(gray)
(red)
This button cannot be activated. It serves only as information
about whether a pre-defined event is taking place or not. With
the occurrence of the pre-defined event, the color of the button
changes to red.
166
10.9 Ripple control signals, telegrams
(Mains signalling voltage on the supply voltage)
10.9.1 Start screen
The C.A 8352 is a high performance power quality analyzer, which makes all
measurements and analysis available simultaneously and in their entirety. If the
equipment settings (see section 9) have been selected and all measurement
connections have been connected, measurement can be started by pressing the
button
[Start Meas]. The Option TELEGRAM appears after pressing the
button
and is available after pressing the button
display appears on the screen:
Figure 10.42: Option TELEGRAM
167
[Teleg.]. The following
Right button panel:
The right button panel of the window (called action-panel) shows
the menu for changing various field settings and other menu buttons within the option [Teleg.].
Lower button panel:
The lower button panel of the window shows the Module-Options-Panel, which
permits changing/selection of other options (all options run parallel). By pressing
the button
further options become available. Here the option [Teleg.] is
selected and appears therefore in the pressed position.
Note:
32
All buttons are in the activated position as soon as they are
pressed and/or are displayed in the pressed position when
activated.
10.9.2 Options and functions in detail
With the telegram module, it is possible to locate and record telegrams (ripple
control signals). A graphical display of the packets, which transmit information
(telegrams) in the individual phases, is similarly possible.
32
If the appropriate modules are licensed
168
Analysis
parameter
Remarks
automatic search for telegrams in phases 1, 2, 3 with simultaneous recording. Recording and/or indication is therefore:
ripple
control
signal
the starting point with date and time (Start)
the analysis and/or filter frequency (Freq)
Maximum voltage of the received signal (Umax)
Maximum current of the received current (Imax)
Average voltage level of the received signal (UON)
Average current level of the received signal (ION)
Graphical display of the captured data bit sequence (signals)
The voltage and current values generally expressed as R.M.S values.
The meaning of the indicated values of some parameters depends
upon the selected circuit diagram (see section 9.2, page 51).
Note:
10.9.3 Right button panel: menu buttons and their functions
10.9.3.1 Overview
... Page 170
... Page 172
... Page 173
(gray)
(green)
... Page 173
169
10.9.3.1.1 Detail
After pressing the button [Settings] selection of the recording
signal can be made. The following display appears:
Figure 10.43: Display after pressing the button [Settings]
The window is divided into two areas. In the lower window area, a telegram signal
is schematically displayed. By clicking with the mouse on the appropriate input field,
the benchmark of the packets for the analysis can be entered.
The input fields thus have the following meanings:
In this input field the length (duration) of the positive start bit, t1, in
[s] (i.e. "high" condition = Start 1) must be entered.
In the second input field the length (duration) of the negative start
bit, t2, in [s] (i.e. "low" condition = Start 0) must be entered.
Finally the total length (total time), Length, of a packet is to be
entered in [s].
170
the Telegram frequency in [Hz] (i.e. the frequency
of the fed telegram signal) and
the Level threshold in [%] of the fundamental frequency (i.e. the signal is only recognized as such
starting from this voltage level. If the signal level for
example is below the threshold, no telegram signal
will be recognized
WKXV HJ HUURUV DV D UHVXOW RI
noise can be suppressed).
:
The display in the upper window area is a control display. It shows whether a
telegram is recognized as such and/or that a signal has been captured.
Figure 10.44: Control display for the telegram analysis
33
The column Voltage [%] indicates the r.m.s. value level of the voltage of the
captured signal regarding the fundamental frequency level.
In the column Detected a green field appears as soon as a voltage with the
selected analysis frequency is recognized.
If the positive start bit (i.e. "high" condition = Start 1), regarding the criteria (i.e. the
duration t1), is confirmed, the field in this column lights up. Then, if the negative
start bit (i.e. "low" condition = Start 0) is also confirmed, the field similarly lights
up in the appropriate column.
Only if both start bits are recognized and confirmed the telegram-recording starts,
whose current length (duration) is displayed in the column time [s]. The
preceding start bits are also recorded.
33
with the appropriate analysis frequency
171
After pressing the button [Value] the following display appears:
Figure 10.45: Display after pressing the button [Value]
The last captured telegrams of the individual phases are graphically represented.
Additionally control values are displayed via individual graphs. The following
values are displayed:
Start:
Indicates the exact measured frequency of the captured telegram.
Freq:
Indicates the exact measured frequency of the captured telegram.
Umax: Indicates the maximum voltage level (r.m.s. value) of the telegram
signal, which arose during the captured telegram.
Imax:
Indicates the maximum current level (r.m.s. value) of the telegram
signal, which arose during the captured telegram.
172
Uon:
Indicates the mean voltage level (r.m.s. value) of logic 1 signals
("high" condition) over the captured Telegram packet (total length)
for which the value lies above the response threshold.
Ion:
Similarly applies to the current.
Note:
A graphical view of previously captured signals is only possible
in the program „C.A 8352-Post“(see section 11).
By pressing the button [Print] the „Print Panel“ appears. Within
this panel it is possible to print the current display and/or save it
as a BMP-file. More about this button, see page 105.
This button cannot be activated. It serves only as information
about whether data recording is taking place or not.
Data recording is taking place, if this button is green. Data
(green) recording is activated, but there has not been any recording yet,
when the button is yellow. To change to the module for data
recording is possible at any time by pressing the button
(gray)
[Store] in the Module-Options-Panel.
173
10.10 Unbalance analysis
10.10.1 Start screen
The C.A 8352 is a high performance power quality analyzer, which makes all
measurements and analysis available simultaneously and in their entirety. If the
equipment settings (see section 9) have been selected and all measurement connections have been connected, measurement can be started by pressing the
button
[Start Meas]. The Option SYMMETRY appears after pressing the
and is available after pressing the button
button
display appears on the screen:
Figure 10.46: Option SYMMETRY
174
[Symm]. The following
Right button panel:
The right button panel of the window (called action-panel) shows
the menu for changing various field settings and other menu buttons within the option [Symm].
Lower button panel:
The lower button panel of the window shows the Module-Options-Panel, which
permits changing/selection of other options (all options run parallel). By pressing
the button
further options become available. Here the option [Symm] is
selected and appears therefore in the pressed position.
Note:
34
34
All buttons are in the activated position as soon as they are
pressed and/or are displayed in the pressed position when activated.
If the appropriate modules are licensed
175
10.10.1.1 Options and functions in detail
The [Symm] - Module serves its purpose only with measurement in a three-phase
power supply (not with single-phase measurement). Under this condition the
following measurements are possible:
Functions/Options
Remarks
U in [kV]
voltage r.m.s. values: 3-phase, positive-, negative-,
zero-phase sequence system
I in [A]
current r.m.s. values: 3-phase, positive-, negative-,
zero-phase sequence system
U1 in [kV]
voltage r.m.s. values of the fundamental harmonic:
3-phase, positive-, negative-, zero-phase sequence
system
I1 in [A]
current r.m.s. values of the fundamental harmonic:
3-phase, positive-, negative-, zero-phase sequence
system
active power: 3-phase, positive-, negative-, zerophase sequence system
active power of the fundamental harmonic:
3-phase, positive-, negative-, zero-phase sequence
system
P in [kW]
P1 in [kW]
NEG/POS in [%]
ratio negative-/positive-components in [%]
(corresponds the unbalanced factor α U of U, U1
and unbalanced factor α I of I, I1)
ZERO/POS in [%]
ratio zero-/positive-components in [%] of U, U1, I, I1
Note:
The meaning of the indicated values of some parameters depends
upon the selected circuit diagram (see section 9.2, page 51).
10.10.2 Right button panel: menu buttons and their functions
Note:
All buttons are in the activated position as soon as they are
pressed and/or are displayed in the pressed position when
activated.
176
10.10.2.1.1 Overview
... Page 178
... Page 178
... Page 178
... Page 178
... Page 179
... Page 179
... Page 179
(gray)
(green)
... Page 179
10.10.2.1.2 Detail
Overview of tabular display
zero-p h ase
se qu en ce sy ste m
positive-p h ase
se qu en ce sy ste m
displayed
parameter
sy m m e tric al
negative-ph ase
se qu en ce sy ste m
negative-/positivesy ste m
Figure 10.47: Tabular Display
177
zero-/positivesy ste m
The meaning of the displayed parameters is described in section 10.10.1.1
"Options and functions in detail". If due to the type of switch selection (e.g. with
single-phase measurement) no partitioning is possible into symmetrical components, the value 0 is displayed in all fields.
Time representation
Figure 10.48: Time representation
This represents the course of positive, negative and zero-phase sequence
systems over time and their respective symmetrical values for the parameter
selected in the menu i.e.:
Pressed
button in
35
the AP
Representation of the course of positive, negative and zerophase sequence systems over time and their symmetrical
values (line colors correspond to the colors from the tabular
representation)
the r.m.s. values of the total voltage
the r.m.s. values of the fundamental frequency voltage
the r.m.s. values of the total current
the r.m.s. values of the fundamental frequency current
35
Action-Panel
178
the total active power
the total active power of the fundamental frequency
Note:
Pressing one of the buttons of the menu does not change anything in the tabular representation lying above it (neither general
appearance nor values in the fields)
The horizontal axis is the time axis and shows a time window of 1 hour. The
scaling of the vertical axis of the diagrams occurs dynamically for the appropriate measurement values.
By pressing the button [Print] the „Print Panel“ appears. Within
this panel it is possible to print the current display and/or save it
as a BMP-file. More about this button, see page 105.
This button cannot be activated. It serves only as information about
whether data recording is taking place or not.
Data recording is taking place, if this button is green. Data
(green) recording is activated, but there has not been any recording yet,
when the button is yellow. To change to the module for data
recording is possible at any time by pressing the button
(gray)
[Store] in the Module-Options-Panel.
179
10.11 Impedance measurement
10.11.1 Start screen
The C.A 8352 is a high performance power quality analyzer, which makes all
measurements and analysis available simultaneously and in their entirety. If the
equipment settings (see section 9) have been selected and all measurement connections have been connected, measurement can be started by pressing the
button
[Start Meas]. The Option IMPEDANCE appears after pressing
the button
and is available after pressing the button
lowing display appears on the screen:
Figure 10.49: Option IMPEDANCE
180
[Imped]. The fol-
Right button panel:
The right button panel of the window (called action-panel) shows
the menu for changing various field settings and other menu buttons within the option [Imped].
Lower button panel:
The lower button panel of the window shows the Module-Options-Panel, which
permits changing/selection of other options (all options run parallel). By pressing
the button
further options become available. Here the option [Imped] is
selected and appears therefore in the pressed position.
Note:
36
All buttons are in the activated position as soon as they are
pressed and/or are displayed in the pressed position when
activated.
10.11.2 Options and functions in detail
With the impedance module it’s possible to determine the network impedances of
each phase (see section 10.11).
Note:
36
Which phase-impedances are displayed depends on the chosen
circuit diagram (see section 9.2).
If the appropriate modules are licensed
181
10.11.3 Right button panel: menu buttons and their functions
Note:
All buttons are in the activated position as soon as they are pressed
and/or are displayed in the pressed position when activated.
10.11.3.1.1 Overview
... Page 183
and
... Page 183
... Page 183
(gray)
(green)
... Page 183
10.11.3.2 Detail
Figure 10.50: Display after pressing the button [Imped]
182
The left vertical axis shows the impedance scale in [Ω].
The horizontal axis shows the time axis.
With these buttons, it is possible to switch on/off individual phases.
Only activated phases are displayed on the graph.
Which phase-impedances can be displayed depends on the selected circuit diagram and measurement type (see section 9.2).
phase 1= red
phase 2 = blue
phase 3 = green
neutral conductor = yellow
If the button [Zsh + Zload] is displayed, the time process of the
parameters Zsh (short circuit impedance; net impedance) and
Zload (Impedance of the load) is shown in the diagram. If you
click on this button, the content of the button changes to…
If the button [Zload Cplx] is displayed, the time process of the
parameters Zload real part and Zload imaginary part is shown in
the diagram. If you click on this button, the content of the button
changes back to [Zsh + Zload].
By pressing the button [Print] the „Print Panel“ appears. Within
this panel it is possible to print the current display and/or save it
as a BMP-file. More about this button, see page 105.
This button cannot be activated. It serves only as information about
whether data recording is taking place or not.
(gray)
Data recording is taking place, if this button is green. Data
(green) recording is activated, but there has not been any recording yet,
when the button is yellow. To change to the module for data
recording is possible at any time by pressing the button
[Store] in the Module-Options-Panel.
183
10.12 Half cycle measurement (RMS hp)
10.12.1 Start screen
The C.A 8352 is a high performance power quality analyzer, which makes all
measurements and analysis available simultaneously and in their entirety. If the
equipment settings (see section 9) have been selected and all measurement connections have been connected, measurement can be started by pressing the
button
[Start Meas]. The Option RMS hp appears after pressing the
button
and is available after pressing the button
lowing display appears on the screen:
Figure 10.51: Option RMS hp
184
[RMS hp]. The fol-
Right button panel:
The right button panel of the window (called action-panel) shows
the menu for changing various field settings and other menu buttons within the option [RMS hp].
Lower button panel:
The lower button panel of the window shows the Module-Options-Panel, which
permits changing/selection of other options (all options run parallel). By pressing
the button
further options become available. Here the option [RMS hp] is
selected and appears therefore in the pressed position.
Note:
37
All buttons are in the activated position as soon as they are
pressed and/or are displayed in the pressed position when
activated.
10.12.2 Options and functions in detail
The following measurements are possible with the RMS hp module:
All measurement parameters stated below are r.m.s. values which are integrated
only over a half cycle duration of the fundamental frequency i.e. over 10 ms
with 50 Hz.
37
If the appropriate modules are licensed
185
Functions/
Options
U in [V]
Umax in [V]
Remarks
R.m.s. values of the voltage
(integrated over a half cycle)
of all connected phases (1, 2, 3, N)
Maximum half cycle r.m.s. value of the voltage
of the respective phase (1, 2, 3, N):
since last pressing
, or during the actual saving interval
(with storing activated)
Iumax in [A]
Half cycle r.m.s. values
of the current of the respective phase (1, 2, 3, N)
at the time of the Umax occurrence (see Tumax)
Tumax
Date and time of the occurrence of Umax
Umin in [V]
Minimum half cycle r.m.s. values of the voltage
of the respective phase (1, 2, 3, N)
since last pressing
, or during the actual saving interval
(with storing activated)
Iumin in [A]
Half cycle r.m.s. values
of the current of the respective phase (1, 2, 3, N)
at the time of the Umin occurrence (see Tumin)
Tumin
Date and time of the occurrence of Umin
I in [A]
R.m.s. values of the current
(integrated over a half cycle)
of all connected phases (1, 2, 3, N)
Imax in [A]
Maximum half cycle r.m.s. values of the current
of the respective phase (1, 2, 3, N)
since last pressing
, or during the actual saving interval
(with storing activated)
Uimax in [V]
Half cycle r.m.s. values of the voltage
of the respective phase (1, 2, 3, N)
at the time of the Imax occurrence (see Timax)
Timax
Date and time of the occurrence of Imax
186
Imin in [A]
Minimum half cycle r.m.s. values of the current
of the respective phase (1, 2, 3, N)
since last pressing
, or during the actual saving interval
(with storing activated)
Uimin in [V]
Half cycle r.m.s. values of the voltage
of the respective phase (1, 2, 3, N)
at the time of the Imin occurrence (see Timin)
Timin
Date and time of the occurrence of Imin
The meaning of the indicated values of some parameters depends
upon the selected circuit diagram (see section 9.2, page 51).
Note:
10.12.3 Right button panel: menu buttons and their functions
Note:
All buttons are in the activated position as soon as they are
pressed and/or are displayed in the pressed position when
activated.
10.12.3.1 Overview
... Page 188
... Page 188
(gray)
(green)
... Page 188
187
10.12.4 Half cycle measurement indicators
displayed
param eter
Umax
area for
of
p h ase N
U m in
a rea for
area for
area for
of
p h ase L 3
Im a x
U R M S hp
I R M S hp
of
p h ase L 2
Im in
disp lay are a for
d isplay area for
of
p h ase L 1
Figure 10.52: Overview of the tabular display
By pressing the button [Init] all values in the Umax, Umin, Imax,
and Imin display areas of the individual phases are reset to 0
(see Figure 10.52: Overview of the tabular display
By pressing the button [Print] the „Print Panel“ appears. Within
this panel it is possible to print the current display and/or save it
as a BMP-file. More about this button, see page 105.
This button cannot be activated. It serves only as information
about whether data recording is taking place or not.
Data recording is taking place, if this button is green. Data
recording
is activated, but there has not been any recording yet,
(green)
when the button is yellow. To change to the module for data
recording is possible at any time by pressing the button
(gray)
[Store] in the Module-Options-Panel.
188
11 C.A 8352-Post (Data analysis)
The program „C.A 8352-Post“ is a comprehensive tool for the representation and
post measurement analysis of saved measurements. It also offers the possibility
of a standardized protocol for the analysis of the measurements and/or exporting
the results into other programs.
11.1 Starting C.A 8352-Post
The post-measurement data analysis program can be started directly at the
instrument with the button
in the module [System] (see section 9.2
) of
the measurement program „C.A 8352Meas“ or from an external PC via the file
„C.A 8352Post.exe“ in the folder „C.A 8352Post“ (see installation instructions).
Running the program scans the standard file of saved measurement data (...\C.A
8352\Data2) for saved series of measurements and lists these in the start-screen
(see section 11.2) for selection.
Note:
The procedure for the selection of
the measurement data is managed
in a status window („DATA Server“)
and possible errors are indicated.
This function serves only as information.
189
11.2 Start screen
Figure 11.1: Start screen C.A 8352-Post
Note:
All buttons are in the activated position as soon as they are
pressed and/or are displayed in the pressed position when
activated.
Right button panel:
On the right side of the screen one finds the action-panel (see page
191 for a summary of the buttons and their functions) for switching to
different data analysis functions and other menu buttons available
within the program „C.A 8352-Post“.
190
11.2.1 Right button panel: menu buttons and their functions
11.2.1.1 Overview - General options
... Page 198
... Page 198
... Page 198
... Page 198
... Page 198
11.2.1.2 Overview – Data analysis-options
... Page 199
... Page 210
... Page 220
... Page 231
... Page 250
... Page 262
... Page 196
... Page 197
191
11.2.2 Selection of a particular measurement
Upper area of the display
After a restart, the upper area of the display shows a listing of all existing "Users",
under whose names series of measurements were saved in the standard file:
Figure 11.2: Start screen C.A 8352-Post, upper display area (1)
Note:
The designation "DEFAULT" is present in this display for series
of measurements, where no user name was entered.
By pressing the
- field next to the displayed user names, the project names
saved under the respective user name are listed.
According to the same principle (pressing the
- field next to the displayed
project names) the measurements saved under the respective project name are
listed (Note: Names for the measurements can be entered during the recording of
the measurement; see section 9.3).
Note:
By pressing the
- field, the respective procedure is cancelled.
192
Figure 11.3: Start screen C.A 8352-Post, upper display area (2)
Symbols:
In the case of this measurement (one row corresponds to a set of
measurement data) the data of the measurement option described at
the top of the column are saved.
In the case of this measurement (one row corresponds to a set of
measurement data) the data of the measurement option described at
the top of the column are not saved.
The selection of a particular data record (which is to be analyzed further) is done
by pressing the field next to the date of the appropriate measurement
) and is cancelled again with the same procedure
(
(
Note:
).
After selection of a measurement the button
the desired type of data analysis) and the button
(for starting
(for ex-
porting a data record) is activated.
Note:
Selection of 2 measurements: A maximum of only 2 measurements, whose saved data correspond to the field "group" (those are
all measurement options except for "transient", "telegram", "alarm";
see section 9.3) can be selected at the same time and therefore be
compared with each other with regard to their time dependence.
193
Lower display area
After its selection, the lower display area shows information about the selected
measurement:
Figure 11.4: Start screen C.A 8352-Post, lower display area (1)
- button to
Click on the
get a report for all the measurement setups for the selected measurement, see
chapter 0. In this submenu you can also delete the whole measurement or parts
of the measurement, see chapter 0.
Printing a measurement’s setup report
Click on the
- button to
get a report for all the measurement setups for the selected measurement. The
display will look like this:
Click on the
- button
to print this report.
Figure 11.5:
Details & Manage - window
194
Deleting (parts of) the selected measurement
Click on the
- button to
enter the submenu, where you can delete the whole measurement or only parts of
the measurement:
Figure 11.6: Details & Manage - window
- button the whole selected measurement will be
If you click on the
deleted and you return to the start-screen.
- button a sub-window appears, where you can
If you click on the
select, which part of the measurement should get deleted:
Just select the time-interval, which you
want to delete by shifting the bars or by
entering time/date manually.
195
11.2.3 Starting an analysis of a measurement
After selection of the desired measurement (or two measurements), only the
analysis-options, that are possible for the type of the selected measurement,
become active on the right button panel.
Note:
The button
is activated after selection of a measurement
(for starting the desired type of data analysis).
Depending upon the desired type of analysis, one of the appropriate buttons must
be pressed.
and always
The analysis procedure is started by pressing the button
begins with a pre-selection window for the time interval of the measurement,
which is to be analyzed:
Figure 11.7: Time preselect window
The preset values correspond to the current start and end times of the selected
measurement. They can be changed by entering them directly in the fields or by
moving the two bars.
Note:
In most cases, it is recommended that the entire measurement period
will be displayed first and a "Zoom" function (within Data Analysis
Options) allows individual measurement sections to be viewed in
more detailed way.
196
11.2.4 Exporting measurement data
After selection of a given measurement, parts of the saved measurement data of
this measurement can be exported in a .txt file (saving in tabular form in a text
file). The new file ("… .txt") is saved in the file "...\Data2\_EXPORT "and may be
opened and/or worked on from here.
Note:
The button
is activated after selection of a measurement
(for exporting a data record).
After pressing the button
, a window opens for the selection of the type
of measurement data, which are to be exported:
Figure 11.8: Export –selection window
197
11.2.5 Changing the language of the user interface
After pressing the button
, a window opens in
which the language selection of the programs surface
can be changed:
11.2.6 Software information
After pressing the button
, a window
opens in which information about the software
is provided.
11.2.7 Return to the measurement software38
Pressing the button
terminates "C.A 8352-Post" and calls up the program
"C.A 8352-Meas" which serves for the measurement and recording of the power
network parameters (see sections 9 and 10).
11.2.8 System settings38
Pressing the button
starts the program "SystemTool" with which system
settings, such as printer installation, system time setting, software updates, etc.
can be carried out (see section 9.4).
11.2.9 Terminating the program ("C.A 8352-Post")
This possibility exists only with direct installation and use of the program on a PC.
.
In this case the program "C.A 8352Post" is terminated with the button
38
This possibility exists only if the program "C.A 8352Post" were started from the
measurement program ("C.A 8352Meas") directly at the measurement instrument.
198
11.3 Analysis options
11.3.1 Analysis with option
x(t) graph
After the procedures described in sections 11.2.2 and 11.2.3, the button
appears pressed and after a delay in which the data is read in for measurement,
the data are displayed as shown below:
Figure 11.9: Start screen within the analysis option [x(t)-Graph]
199
11.3.1.1 Main display area
11.3.1.1.1 Display in "Compare" mode ("Com")
This mode is activated when the "Com" field is activated in both graphs (see
Figure 11.10: [x(t)-Graph] – display in „Compare“- mode
D escription of the
displayed m easurem ent
D escription of the analysis option
and the m easurem ent param eter
display o f the
m easurem ent param e ter value
at the cursor position
G raph 1
chang e be twe en :
“D etail”(D et.)-m ode /
“C om pare”(C om .)-m od e
cursor
display o f the
m easurem ent param e ter value
at the cursor position
G raph 2
chang e be twe en:
“D etail”(D et.)-m ode /
“C om pare”(C om .)-m od e
cursor
D isplay of date and tim e of the m easurem ent values
Figure 11.10: [x(t)-Graph] – display in „Compare“- mode
200
In this mode, in graphs 1 and 2 the time dependence of two different parameters on one measurement or the time dependence of one parameter on 2
separate measurements (selection of two measurements, see section 11.2.2) can
be displayed and compared.
Moving the cursor: see page 208
Zoom function:
Through the „Zoom“ mechanism (touchscreen: touch the screen at a desired
position on the screen with the pen, move it to the desired final position and take
the pen off the screen again; mouse: click on a position with the left mouse button
and drag the cursor to the desired position and release the mouse button again)
individual areas in the area of a graph can be zoomed out. This zoom function
affects the other graph at the same time.
(To reset the zoom function, see page 208)
Changing the scaling of the y axis:
By clicking (mouse) and/or tapping (touchscreen) the y axis of one of the two
graphs, a "Pop up" window opens in which the scaling of the y axis can be
changed:
In this window it is possible for the user to manually enter
the scaling (manual setting and input of the desired
min/max values), to fit the level of the displayed values
automatically by autoscaling (Autoscale setting) or to
freeze the current scaling (scaling Lock).
In addition, the set scaling option can be specified as to whether it applies to the
upper graph (setting "Graph 1"), the lower graph (setting "Graph 2") or to both
graphs (setting "Graph 1 & 2").
201
11.3.1.1.2 Display in Detail mode ("Det")
This mode is activated while the "Det." field is activated in one of the two graphs
(see Figure 11.11: [x(t)-Graph] – display in „Detail“- mode
D escrip tion of the
displayed m easure m en t
D escrip tion of the ana lysis option
an d th e m easurem ent pa ram e ter
curso r 1
(va ria ble )
G raph 1
curso r 2
(fix)
“D etail”(De t.)-m od e
fo r G ra ph 1 ac tivated
da te, tim e, m ea su rem en t
param eter valu e
at the c urso r 1 positio n
da te, tim e, m ea su rem en t
param eter valu e
at the c urso r 2 positio n
differen ce be tw een the
cu rsor 2 and cu rsor 1
pa ram e ter value s
Figure 11.11: [x(t)-Graph] – display in „Detail“- mode
In this mode, the time dependence of a measurement parameter in one of the
nd
two graphs can be analyzed in more detail with the aid of a 2 cursor.
Moving the (variable) cursor: see page 208
In this mode, individual sections can also be zoomed and the scaling of the y-axis
can be changed (see section 11.3.1.1.1).
202
Right button panel:
On the right hand side of the screen one finds the action-panel
(overview of the buttons and their functions: page 203) for switching to
different data analysis functions and other menu buttons available
within the analysis option [x(t)-Graph].
11.3.1.2 Right button panel: menu buttons and their functions
11.3.1.2.1 Overview
... Page 204
39
... Page 206
39
... Page 206
... Page 206
... Page 208
... Page 208
... Page 208
... Page 208
... Page 209
39
Drop-down menu by pressing the button
203
11.3.1.2.2 Detail
By pressing this button, different measurement parameters can be
selected whose time dependence is represented in the graphs
1 and 2.
The following selection window opens:
In the lower area of this window (
), the graph is
designated for which the measurement parameter is directly
selected (graph 1 or 2, see Figure 11.10: [x(t)-Graph] – display
in „Compare“- mode
By clicking on this one moves to the selection for the next
graph, i.e. from graph 1 to graph 2 or vice versa.
“Flagging”
40
:
concept
During a dip, swell or interruption the calculated values for
power frequency, voltage magnitude, flicker, supply voltage
unbalance, voltage harmonics, voltage interharmonics, mains
signaling are marked as “flagged”. If during a given time interval
any value is flagged, the aggregated value over a storing period
(stored value) including that value shall also be flagged.
The user can decide afterwards, if he uses these values for
40
see [2]: IEC 61000-4-30 “Flagging concept”
204
further evaluation or not.
For example:
A time diagram of a measurement with flagged data, where you
decided to show all data (“Use flagged data”), will show all
data, but with black marks above the flagged data points.
Figure 11.12: time diagram
with „Use flagged data“ selected
Now have a look on the same time diagram with “Do not use
flagged data” selected. In this case the time diagram does not
show the value of the flagged datapoints itselves, but also the
black marks on their position.
Figure 11.13: time diagram
with „Do not use flagged data“ selected
205
Note:
and
If 2 different measurements are selected for simultaneous analysis,
the program assigns one measurement to graph 1 and the other
measurement to graph 2.
By pressing this button, a selection can be made, whether the
average value (AVG), minimum value (MIN), maximum value
(MAX) or minimum and maximum value together in one
diagram (EXTREMA) of the selected measurement parameter
is to be represented as its time dependence. This selection
shows effects to the displayed graph, in the case that not all
data points of the selected time period can be displayed on the
screen (caused by the limited screen resolution), because of
too many data points.
Example: There are 3000 data points (measurement points),
which should be displayed in one graph. The screen can
display only (because of his resolution) 1000 points. A selection
of Avg (average value) effects that the present diagram is
converted to a displayable size (in our case 1000 data points).
In this case the mean value over 3 sequenced data points is
built and shown as one data point on the screen. By selection
Min (minimum value) the lowest, in case of selection Max
(maximum value) the highest of the 3 data points will be displayed.
The upper one of the two buttons shows effects to the display
of graph 1, the lower one to the display of graph 2.
With this button, the standardized protocol for this analysis can
be printed out on the system printer (for printing directions, see
section 9.4) and/or saved in a ".bmp " or ".html" file.
Information such as measurement site, description, etc. can be
entered in a "pop-up" window (protocol title and selected measurement parameters of the two graphs have been entered from the
preset values). Further, the thickness of the line can be changed
( ) and a selection can be made, whether the print-out will be
in color or black and white ( ).
206
The type of print-out can be defined with this button.
Note:
The print-out is sent to the file „..\Data2\User\Project\
_Print_Outs“ as a „.bmp“ or „.html“ file.
Attention: If the selected type is a „.html“ file, all
entries in the file „..\_Print_Outs“ will be deleted.
By pressing this button, it is possible to do the printer
settings and/or change the type of printer (Print Setup).
If this field is activated, the title of the printout is adapted to suit the current analysis option.
By deactivating this button, the user’s own title can be entered
which then also appears in the print-out of all other analysis
options.
207
In this analysis option, the print-out has the following appearance:
Figure 11.14:
Protocol of the analysis option [x(t)-Graph]
By pressing this button, the display in both graphs is reset to display the entire measurement span.
This button resets the cursor to the center of the displayed series
of measurements in both graphs
With these buttons, it is possible to switch on/off individual inputs to the graphs (e.g. phase values). Only activated inputs to
the graph are represented.
Input 1 = red
Input 2 = blue
Input 3 = green
Input N = yellow
With these arrow keys, the cursor is moved simultaneously in
both graphs.
In the display area below, the current cursor position is shown
as a date and time.
208
This button terminates the analysis option [x(t)-Graph] and returns the user to the start-screen of the program "C.A 8352Post" (see section 11.2).
209
11.3.2 Analysis with option x(t) histogram
After the procedures described in sections 11.2.2 and 11.2.3, followed by
and a certain amount of time, in which the desired
pressing the button
measurement data are read in, a display with following structure appears:
Figure 11.15: Start screen within analysis option [x(t)-Histog]
210
11.3.2.1 Main display area
D e s crip tion o f th e
d isp la ye d m e a s urem e n t
D e s crip tion o f th e a n a lys is o p tio n
a n d th e m e a s u rem e n t pa ra m e ter
N um ber of data po ints,
w h ich a re a nalysed statically
in the histogram
t i m e d e p en d e n c e d g r a p h
o f th e m eas u r em en t
p aram eter s
m e a n v a lu e b y
d a ta p o in t a m o u n t
o f th e c u rso r p o sitio n
c urs o r
h is to g ra m -g rap h
o f m e a s u re m e n t
p a ra m e te rs
Scale of correspo nding m easure m en t pa ram e ter
Figure 11.16: Start screen within the analysis option
[x(t)-Histog]; overview
The time dependence of a measurement parameter is displayed in the upper
graph, the histogram evaluation and the cumulative distribution of the data points
of the selected time period is shown in the lower diagram.
Moving the cursor in the histogram representation:
see page 218.
211
Zoom function:
Through the "Zoom" mechanism (touchscreen: tap the screen with the pen, drag
it to the desired position and take the pen off the screen again; mouse: click on a
position with the left mouse button and drag the cursor to the desired position and
release the mouse button again) individual areas in the area of a graph can be
zoomed out. This zoom function affects the other graph at the same time; only the
“zoomed” data area of the histogram analysis is presented.
(To reset the zoom function, see page 218)
Right button panel:
On the right hand side of the screen one finds the action-panel
(overview of the buttons and their functions: Page 213) for switching
to different data analysis functions and other menu buttons available
within the analysis option [x(t)-Histog].
212
11.3.2.2 Right button panel: menu buttons and their functions
11.3.2.2.1 Overview
... Page 214
41
... Page 214
... Page 215
... Page 216
... Page 218
... Page 218
... Page 218
... Page 218
... Page 218
... Page 219
41
Drop-down menu by pressing the button
213
11.3.2.2.2 Detail
By pressing this button, different measurement parameters can
be selected whose time dependence and histogram will be represented.The following selection window opens:
In the lower area of this window (
), the graph is
designated for which the measurement parameter is directly
selected. By clicking on this one moves to the selection for the
next graph, i.e. from graph 1 to graph 2 or vice versa.
“Flagging”
42
concept
: see page
204.
By pressing this button, a selection can be made, whether the
average value (AVG), minimum value (MIN), maximum value
(MAX) or minimum and maximum value together in one
diagram (EXTREMA) of the selected measurement parameter
is to be represented as its time dependence. (for more
information see 11.3.1.2.2, page 206).
This function does not have an effect on the histogram representation.
42
see [2]: IEC 61000-4-30 “Flagging concept”
214
By pressing this button, statistical values of the selected measurement parameter (standard deviation, average value, etc.) can
be displayed. These are analyzed over all measurement points
of the time dependence diagram’s displayed time range. The
display appears in a window below the time diagram:
Explanations of the statistic values:
•
arithmetic average value: This is the sum of all measurement values divided by their number.
•
Variance: This is formed by taking the difference of each
individual measurement value from the (arithmetic) average
value that has been determined, squaring these differences
and then summing all resulting values. This sum is then
divided by the number of measurement values, producing
the "variance" (or "mean square difference").
•
Standard deviation: Is the square root of the variance.
•
Median: The value which divides a frequency distribution
into 2 parts in such a way, that equally as many
measurement points lie below this point as above it.
•
Modal value: The most frequently occurring value in a frequency distribution; corresponds therefore to the maximum
in the histogram.
•
Points for calc: number of data points, which are displayed
in the histogram.
•
Total points: number of data points of the selected time
period (which are displayed in the time diagram).
•
Bin: Size of one class of the histogram.
215
By pressing this button, you can change the type of histogram
evaluation.
By default the PNA software divides the difference between the
minimum and the maximum value of the selected
measurement parameter of the displayed time period into 100
classes and classifies all the data points into these classes.
Especially when there are just a few data points with very different
values to the rest of the data point-values, this leads to a
histogram display with nearly no detailed information, because
most of the data points are inside 1 class.
In such a case this choosing function helps to give nevertheless
detailed histogram-information.
Following sub-window appears with the default setup Automatic
(see description above):
216
Choose Manually:
Enter a minimum value (Min) and a maximum value (Max)
manually to set the lower and upper limit for the classification
into 100 classes.
Then choose the Type of evaluation:
•
Type A: All data points outside the limits, set by Min and
Max, are not evaluated in the histogram at all.
•
Type B: All data points with values lower than the Min-limit
are evaluated and displayed in the first class of the
histogram. All data points with values higher than the Maxlimit are evaluated and displayed in the last class of the
histogram.
•
Type C: All data points with values lower than the Min-limit
are evaluated but not displayed in the histogram. All data
points with values higher than the Max-limit are evaluated
but not displayed in the histogram.
Selecting one of these Types has also got effects on the
parameters Points for calc., Total points and Bin of the
Statistics-function, see
, page 215.
If the Hist.calc function is activated, the button blinks red.
217
For a precise description, see section 11.3.1.2.2, page 206. In
this analysis option, the print-out appears as follows:
Figure 11.17: Protocol of the
analysis option [x(t)-Histog]
By pressing this button, the display in both graphs is reset to the
display and analysis of the entire measurement.
This button causes a resetting of the cursor to 50% of the
analyzed measurement data points in the histogram (the displayed values correspond to the "Median" value).
With these buttons, it is possible to switch on or off individual
inputs (e.g. phase values) into the graph. Only activated inputs
into the graph are represented.
Input 1 = red
Input 2 = blue
Input 3 = green
Input N = yellow
The cursor in the histogram display can be moved with these
arrow keys.
The current cursor position in [%] of the analyzed measurement
data points is indicated in the display area underneath.
218
With this button, the analysis option [x(t)-Histog] terminates and
the user is returned to the start-screen of the program "C.A
8352-Post" (see section 11.2).
219
11.3.3 Analysis with option FFT
After the procedures described in sections 11.2.2 and 11.2.3, followed by
pressing the button
and a certain amount of time, in which the desired
measurement data are read in, a display with following structure appears:
Figure 11.18: Start screen within the analysis option [FFT]
The display of the analysis option [FFT] always begins with a display of the
spectral and the time dependent display of a measurement parameter.
220
11.3.3.1 Main display area
D escription of the
displayed m easurem ent
D escription of the analysis option
and the m easurem ent param eter
S cale of c orres pon ding
m ea su rem ent pa ra m eter
tim e depend enced grap h
of the m easu rem ent
param eters
F FT-spe ctra l displa y
o f th e m ea su re m e nt
param ete rs
O rdinal n um ber
Figure 11.19: Start screen within the analysis option [FFT]; overview
Zoom function:
Through the "Zoom" mechanism (touchscreen: touch the screen at a desired
position on the screen with the pen, move it to the desired final position and take
the pen off the screen again; mouse: click on a position with the left mouse button
and drag the cursor to the desired position and release the mouse button again)
individual areas in the area of a graph can be zoomed out. This zoom function
221
affects the other graph at the same time, since only the zoomed data area will be
applied for the FFT-analysis.
Through the "Zoom" mechanism in the spectral display, individual ordinal
numbers of ranges can be zoomed.
(To reset the zoom function, see page 228)
Right button panel:
On the right hand side of the screen one finds the action-panel
(overview of the buttons and their functions: Page 223) for switching
to different data analysis functions and other menu buttons available
within the analysis option [FFT].
222
11.3.3.2 Right button panel: menu buttons and their functions
11.3.3.2.1 Overview
43
... Page 224
... Page 224
... Page 225
... Page 226
... Page 227
43
... Page 227
... Page 227
... Page 228
... Page 228
... Page 230
... Page 230
... Page 230
... Page 230
43
Drop-down menu by pressing the button
223
11.3.3.2.2 Detail
By pressing this button, a spectral display of different measurement parameters and their time dependence can be displayed:
D escription of the
display ed m ea surem e nt
D escription of the a nalys is option
and the m easurem ent param eter
S ca le o f co rres p o n d in g
m e a su re m e n t p a ra m e te r
tim e d epe nde nce d graph
of the m ea su rem ent
param e ters
F FT-sp e ctra l d isp la y
o f th e m ea su re m en t
pa ram e te rs
O rdina l n um be r
Figure 11.20: Display analysis option
FFT-Spectra
By pressing this button, a tabular listing of the mean and maximum
values, as well as thresholds of the individual frequency components (ordinal numbers) of different measurement
parameters can be displayed:
224
D escription of the
displayed m easurem ent
Lim its
O rdinal num ber
An a lys is op tion
Figure 11.21: Display analysis option FFT-Table
A red coloring in the appropriate line simultaneously indicates a
threshold exceeding.
By pressing this button, the density distribution of different
measurement parameters and their time dependence can be
displayed:
D e s c rip tio n o f th e
d is p la y e d m e a s u re m e n t
D e s c rip tio n o f th e
a n a ly s is o p tio n a n d th e
m e a s u re m e n t p a ra m e te r
S c a le o f c o rre s p o n d in g
m e a s u re m e n t p a ra m e te r
tim e dep enden ced graph
of the m easure m e nt
param eters
D e n sity d istrib u tio n fun ctio n
o f the m e a sure m e n t
pa ra m eters
D a te a n d tim e o f m e a s u re m e n t
Figure 11.22: Display analysis option
FFT- Intensity
225
By pressing this button, you get the possibility to see the
FFT-Spectra for each storing point:
D e scrip tio n o f th e
d isp la ye d m e a su re m e n t
D e scrip tio n o f th e an a lysis o p tio n
a n d the m e asu re m e n t p aram e te r
tim e g ra ph
o f th e m ea s urem en t
para m ete r
S cale of corre spon ding
m ea su re m e nt pa ram e te r
Cursor
F FT-spe ctral d isplay
of the m easurem e nt
param eter
at C u rsor p osition
in tim e diag ram
O rdin al num ber
Figure 11.23: Display analysis option
FFT- Inst. Spectra
Just shift the Cursor position in the time diagram with the
-buttons to see the FFT-Spectra at this time.
226
By pressing this button, different measurement parameters can
be selected for analysis. The following selection window opens:
In the lower area of this window (
), the graph is
designated for which the measurement parameter is directly
selected. By clicking on this one moves to the selection for the
next graph, i.e. from graph 1 to graph 2 or vice versa.
“Flagging”
44
: see page 204
concept
By pressing this button, a selection can be made, whether the
average value (AVG), minimum (MIN) value or maximum
(MAX) or minimum and maximum value together in one
diagram (EXTREMA) of the selected measurement parameter
is to be represented as its time dependence (for more
information see section 11.3.1.2.2, page 206).
This function only affects the time dependence of the measurement parameter in the "Spectra" and "Intensity" display.
With this button, all threshold settings for the frequency components of current and voltage can be entered, changed, saved
under a user-defined name, and reset again to standardized
values from EN 61000-2-4. The following input window
appears:
44
see [2]: IEC 61000-4-30 “Flagging concept”
227
By pressing this button the display in the corresponding graphs
is reset again to the display of the entire measurement.
For a precise description, see section 11.3.1.2.2, page 206. In
the FFT analysis option, the print-out appears as follows:
Figure 11.24:
Protocol
analysis option
[FFT-Spectra]
228
Figure 11.25:
Protocol
analysis option
[FFT-Intensity]
Figure 11.26:
Protocol
analysis option
[FFT-Table]
229
With these buttons, it is possible to switch on or off individual
inputs (e.g. phase values) into the graph. Only activated inputs
into the graph are represented.
Input 1 = red
Input 2 = blue
Input 3 = green
Input N = yellow
With these arrow keys, the tabular display can be paged through
by further ordinal numbers, which are not currently displayed.
With these arrow keys, the cursor in the time graph of the Inst.
Spectra function can be shifted with these arrow-buttons.
With this button, the analysis option [FFT] terminates and the
user is returned to the start-screen of the program "C.A 8352Post" (see section 11.2).
230
11.3.4 Analysis with option EN50160
After the procedures described in sections 11.2.2 and 11.2.3, followed by
pressing the button
and a certain amount of time, in which the desired
measurement data are read in, a display with following structure appears:
Figure 11.27: Start screen within the analysis option [50160]
The display of the analysis option [50160] always begins with a summary of the
parameters (Total), which are relevant to the evaluation of power quality
parameters according to EN 50160 regarding possible threshold-exceedings.
231
11.3.4.1 Main display area
A dh erence to the E N 50160
boundaries in [% ]
Exc eeding display
green... no threshold im peachm ent
red... threshold im peach m ent
M a xim um
value
Voltage q uality
para m eter
M inim um
value
Figure 11.28: Start screen within the analysis option [50160]; overview
Right button panel:
On the right hand side of the screen one finds the action-panel
(overview of the buttons and their functions: Page 233) for switching
to different data analysis functions and other menu buttons available
within the analysis option [50160].
232
11.3.4.2 Right button panel: menu buttons and their functions
11.3.4.2.1 Overview
45
... Page 235
... Page 236
... Page 237
... Page 237
... Page 238
... Page 239
... Page 241
... Page 241
... Page 243
... Page 244
... Page 236
... Page 236
... Page 244
... Page 247
... Page 249
45
Drop-down menu by pressing the button
233
... Page 249
... Page 249
... Page 249
234
11.3.4.2.2 Detail
Pressing this button produces a summary of the parameters with
a display of occurred threshold-exceedings, which are relevant to
the evaluation of power quality according to EN 50160.
M axim u m
va lu e
A dh eren ce to the E N 5016 0
boundaries in [% ]
Volta ge q ua lity
pa ra m eter
Exc ee ding d isp la y
green ... no thresho ld im pe achm ent
red... threshold im pe ach m en t
M inim um
va lu e
Figure 11.29: Display analysis option
50160- [Total]
Start and end of the measurement can be read in the lower
display. Also the whole number of stored points together with
the number of “flagged” points is shown.
“Flagging”
46
concept:
During a dip, swell or interruption the calculated values for
power frequency, voltage magnitude, flicker, supply voltage
unbalance, voltage harmonics, voltage interharmonics, mains
signaling are marked as “flagged”. If during a given time interval
any value is flagged, the aggregated value over a storing period
46
see [2]: IEC 61000-4-30 “Flagging concept”
235
(stored value) including that value shall also be flagged.
The user can decide afterwards, if he uses these values for
further evaluation not.
The evaluation according EN50160 can be done with
“flagged”
(
61
data (
) and without „flagged“ data
).
S ca le o f th e fu n d a m e n ta l ha rm o nics
altitu d e in [% ]
In this analysis setting, a spectral representation of the voltage
is produced with a simultaneous display of the maximum values
and thresholds of the phases of all frequency components:
sp ectral re presentation
of th e voltage
s ettin g th re s h old of th e
c orre sp o nd in g h a rm o nic /ph a se
m e a s ure d m ax im u m va lue o f th e
c orres p o nd in g h arm on ic /ph a se
O rd in a l n u m b e r
Figure 11.30: Display analysis option
50160- [Spectra]
236
This option shows all stored events, single-phase and 3-phase
events, sorted in a table with different durations and residual
voltages.
Figure 11.31: Display analysis option
50160- [Event Table]
The Start-threshold level for the calculation of the duration of
the events is displayed at the bottom.
You can change the sorting fields for duration, but also the
calculation start level for the calculation of the event’s durations
with the “Eve Calc.”-option, see page 245.
This option shows a list of all events (threshold-exceedings),
which have occurred, listed with sequential numbering, date,
time, duration of the event and the phase in which the event
occurred, as well as its residual voltage (Extrema).
237
Figure 11.32: Display analysis option
FFT- [Events]
At the bottom the calculation-start level for the duration of the
events is displayed. You can change this start level by using the
“Event calculation”-option, see “Eve cal” at page 245).
The entries in the list can be sorted according to a given field by
selecting the field at the top of the table (No., Date, Time, Phase,
Extrema, Length).
The events can be paged through by using the arrow keys (see
page 249).
You can also reduce the displayed events by using the filterfunction, see page 244.
This option displays a comparison between the power events
that have occurred and those of the curve named CBEMAcurve:
The „Computer and Business Equipment Manufacturers
Association“ (CBEMA) specified on the basis of the AC
voltage deviation tolerance level in which computers and
office machines should still perform their functions without
malfunctions (area marked in gray in Figure 11.33: Display
analysis option
50160- [CBEMA]
238
F un d a m e n ta l ha rm o n ic a ltitu de
of th e vo lta ge in [% ]
Generally this curve is designed for 120 V r.m.s. and 60 Hz and
the user has to estimate for himself, if this curve is also valid in
his measuring case.
le ich
C o mVe
pargriso
n wmithit th e
“C
urvee
“CBBEEM
MAA”-K
”- curv
eve nts
ou tside
eve nts
inside
D u ra tio n
Figure 11.33: Display analysis option
50160- [CBEMA]
239
After pressing the button [RVC Eval], a display with a statistical
evaluation of RVCs according to IEC 61000-3-7 is shown. The
following picture appears:
Figure 11.34: Display analysis option
50160- [RVC Eval]; Table1
On this display you can see an automatic evaluation of RVCs
according to IEC 61000-3-7. The PNA collects all occurring
RVCs every hour and evaluates them afterwards.
Table 2:
Every hour all RVCs are evaluated according to the limits,
described in the columns “dmax” and “changes per hour”.
The column “Hours” shows the amount of evaluated hours, in
which the RVCs were inside the limits (“OK”) and the number of
evaluated hours, in which the RVCs exceeded the limits
(“Above Lim.”).
The column “percentil” shows the percentage of the evaluated
hours, in which the RVCs were inside the limits (“OK”).
Table1:
In addition to the information described for the upper table, the
evaluation display classifies the informations in several dmaxvalue-parts.
240
This option shows a list of all RVCs , which have occurred,
listed with sequential numbering, date, time, dmax, dc, duration
of the RVC and the phase in which the RVC occurred.
Figure 11.35: Display analysis option
50160- [RVC List]
The entries in the list can be sorted according to a given field by
selecting the field at the top of the table (No., Date, Time, Phase,
dmax, dc, duration).
The events can be paged through by using the arrow keys (see
page 249).
You can also reduce the displayed events by using the filterfunction, see page 244.
241
This option shows all stored RVCs, sorted in a table with
different dc- (or dmax-) values and durations.
Figure 11.36: Display analysis option
50160- [RVC Table]
, default) or dmax
Depending if you have selected dc (
) their range-classification are defined in the first
(
column and ranges for the duration of the RVCs at the top of
each column.
You can change the sorting fields for duration, but also the
sorting fields for the dc/dmax-classes by using the “Table
Limits.”-option, see page 246.
242
This option shows a daily/weekly statistic of the stored RVCs,
as demanded in EN50160.
Figure 11.37: Display analysis option
50160- [RVC Days]
, default) or dmax
Depending if you have selected dc (
) and if you have selected Day (
, default) or
(
), the display shows an appropriate statistical
Week (
evaluation of all stored RVCs.
Just select for example dc and Day to show you all RVCs of the
whole measurement, sorted by phases and the day of
occurrence.
If you want to see only RVCs, whose dc-values are higher than
- button and
a user-definable threshold, click on the
enter a threshold level in the following sub-window:
243
With this button, all threshold settings for a power quality analysis can be selected. The button [Set To Default] resets all
threshold definitions to values according to EN 50160. The following input window appears:
For events (event list, CBEMA) and RVC (RVC List) display
you can use the filter function to reduce the displayed
events/RVCs:
For events evaluation the events, which are shown in the event
list or in the CBEMA curve, can be reduced (filtered). Filter
criteria are measurement time, phases, extreme values (residual
voltages) and event duration.
244
For RVC evaluation the events, which are shown in the RVC
list, can be reduced (filtered). Filter criteria are measurement
time, phases, dmax, dc and RVC duration.
If the filter-function is activated the button lights red (
245
).
With the “Event calculation”-function you can change the
calculation of the duration of the events:
Normally the event starts at 90% UN crossing. If you want to
know the duration of the event from another starting point on,
just choose another crossing level from the list-field
“Calculation start level”. This function can be used in the
analysis option 50160- [Event Table] and 50160- [Event List].
For the analysis option 50160- [Event Table] you can also
change the duration ranges of the table by changing the rangelimits in the white fields of the lower area (“Event Table Bin
Ranges [s]”).
With the “Table Limits”-function you can change the limits of the
sorting fields of the RVC table.
For the analysis option 50160- [RVC Table] you can change the
duration ranges of the table by changing the range-limits in the
white fields (“RVCH Table Bin Ranges [s]”). The limits for the
sorting fields for the dc-value can be set by entering the desired
values in the white fields of “RVCH Table dc ranges”.
246
For a precise description, see section 11.3.1.2.2, page 206.
In the analysis option „50160“, the print-out appears as follows:
Figure 11.38: Protocol 1
analysis option
[50160-Total]
Figure 11.39: Protocol 2
analysis option
[50160-Total]
247
Figure 11.40:
Protocol
analysis option
[50160-Spectra]
Figure 11.41:
Protocol
analysis option
[50160-Events]
248
Figure 11.42:
Protocol
analysis option
50160-CBEMA]
By pressing this button, the list of power events is exported in a
"...txt." file. The new file ("...txt") is saved to the folder „...\Data2\
_EXPORT“.
With these buttons, it is possible to switch on/off individual inputs
to the graphs (e.g. phase values). Only activated inputs to the
graph are represented.
Input 1 = red; Input 2 = blue; Input 3 = green
These arrow keys can be used to page through the events in
the event list or in the "CBEMA" curve.
This button terminates the analysis option [50160] and returns
the user to the start-screen of the program "C.A 8352-Post"
(see section 11.2).
249
11.3.5 Analysis with option Transient
After the procedures described in sections 11.2.2 and 11.2.3, followed by
pressing the button
and a certain amount of time, in which the desired
measurement data are read in, a display with following structure appears:
Figure 11.43: Start screen within the analysis option [Transient R.]
11.3.5.1 Main display area
The display of the analysis option [Transient R.] always begins with a summary
of the recorded (transient) events in chronological order. This listing also includes
the event criteria which led to recognizing the event and the phase in which the
event has happened.
250
Figure 11.44: Start screen within the analysis option
[Transient R.]; overview
The entries in the list can be sorted according to a given field by selecting the field
at the top of the table (No., Date, Time, Phase, Condition). The events can be
paged through by using the arrow keys (see page 261).
Right button panel:
On the right hand side of the screen one finds the action-panel
(overview of the buttons and their functions: Page 252) for switching
to different data analysis functions and other menu buttons available
within the analysis option [Transient R.].
251
11.3.5.2 Right button panel: menu buttons and their functions
11.3.5.2.1 Overview
47
... Page 253
... Page 253
... Page 257
... Page 258
... Page 258
... Page 259
... Page 260
... Page 260
... Page 260
... Page 260
... Page 261
... Page 261
... Page 261
47
Drop-down menu by pressing the button
252
11.3.5.2.2 Detail
By pressing this button, the user is provided with a summary of
the recorded (transient) events in chronological order. This listing
also includes the event criteria which led to recognizing the
event and the phase in which the event has happened.
In this area, one or two events can be marked in order to view
their time dependence (see option [x(t) Graph], page 253) or
their spectrum (see option [Spectra], page 257).
Figure 11.45: Display analysis option
Transient R.- [Table]
This button brings the user to a display of the time dependences
of different recorded measurement parameters of the marked
event(s).
•
Display in "Compare" mode ("Com")
This mode is activated when the field „Com.“ is activated in both
graphs (see Figure 11.46: Display analysis option
Transient R.- [x(t) Graph] in „Compare“- mode).
253
D e scriptio n o f th e
d ispla ye d m e as u re m en t
D e scriptio n o f th e
a na ly sis o p tio n a nd the
m e as ure m en t p ara m e te r
D ispla y of the m ea su re m e nt
pa ra m e te r va lu e
a t the cu rs or p ositio n
graph 1
cu rso r
C h an ge be tw ee n :
“D e tail”(D et.)- m od e /
“Info rm a tio n”(Info )-m o de /
“C o m pa re”(C o m .)-m o de
D ispla y of the m ea su re m e nt
pa ra m e te r va lu e
a t the cu rs or p ositio n
graph 2
cu rso r
C h an ge be tw ee n :
“D e tail”(D et.)- m od e /
“Info rm a tio n”(Info )-m o de /
“C o m pa re”(C o m .)-m o de
Tim e in [s] b e fo re (-) a n d afte r (+ ) th e e ve nt o ccu ra n ce
Figure 11.46: Display analysis option
Transient R.- [x(t) Graph] in „Compare“- mode
In this mode, in graphs 1 and 2 the time dependence of two
different parameters of one measurement or the time dependence of one parameter of two separate measurements
(selection of two measurements, see page 253) can be displayed
and compared.
Zoom function:
Through the "Zoom" mechanism (touchscreen: touch the screen
at a desired position on the screen with the pen, move it to the
desired final position and take the pen off the screen again;
mouse: click on a position with the left mouse button and drag
the cursor to the desired position and release the mouse button
again) individual time ranges in the area of a graph can be
zoomed out. This zoom function affects the other graph at the
same time.
254
(To reset the zoom function, see page 260)
Moving the cursor: see page 261
Changing the scaling of the y-axis: see page 201
•
Display in „Information“ mode („Info“)
This mode is activated when the field „Info“ is activated in one
of the two graphs (see Figure 11.47: Display analysis option
Transient R.- [x(t) Graph] in „Information“ mode).
Description of the
displayed measurement
Description of the
analysis option and the
measurement parameter
graph 1
cursor
“Information”(Info)- mode
activated for graph 1
Information about the measurement +
m inimum-peak values and maximum-peak values
m inimum-rms values and maximum-rms values
of the individual connections
Figure 11.47: Display analysis option
Transient R.- [x(t) Graph] in „Information“ mode
In this mode, certain measurement parameter values (minimum
and maximum r.m.s. and peak values over the entire measurement period) of one of the two graphs can be displayed in a
brief overview.
255
•
Display in „Detail“ mode („Det.“)
This mode is activated when the field „Det.“ is activated in
one of the two graphs (see Figure 11.48: Display analysis
option
Transient R.- [x(t)Graph] in „Detail“ mode
D e scription of the
displayed m e asure m e nt
D e scription of the
an alysis op tio n a nd the
m easu re m e nt pa ra m e ter
cursor 1
(varia ble)
g ra p h 1
cursor 2
(fixe d)
“D etail”(Det.)- m ode
for the activate d graph 1
D ate, tim e, m easurem ent pa ram eter value s
at the cursor 1 position
D ate, tim e, m easurem ent pa ram eter value s
at the cursor 2 position
D ifference
of the param eter values
betw ee n cursor 2
and cursor 1
Figure 11.48: Display analysis option
Transient R.- [x(t)Graph] in „Detail“ mode
In this mode, the time dependence of a measurement parameter can be analyzed in detail in one of the two graphs by
using one of the two cursors.
Moving the (variable) cursor: see page 261
An individual area can also be “zoomed” in this mode and the
scaling of the y-axis can be changed (see section 11.3.1.1.1).
256
In this option, the selected events are subjected to a frequency
analysis.
•
Display in "Compare" mode ("Com.")
This mode is activated when the field "Com." is activated in both
graphs (see Fig.11.49 Display analysis optionTransient R.[Specta] in „Compare“ mode.
D e s crip tio n o f th e
d isp la ye d m e a s u re m e n t
D e s crip tio n o f th e
a n a lys is o p tio n a n d th e
m e a s u re m e n t pa ra m e te r
D isp la y o f th e m e a s u re m e n t pa ra m e te r v a lu e
a t th e c u rs o r p o s itio n
graph 1
c u rs o r
D isp la y o f th e m e a s u re m e n t pa ra m e te r v a lu e
a t th e c u rs o r p o s itio n
graph 2
c u rs o r
f r equenc y in [ Hz ]
Figure 11.49: Display analysis option
Transient R.- [Specta] in „Compare“ mode
In this mode, in graphs 1 and 2 the frequency spectra of two
different measurement parameters of one event or the
frequency spectra of one measurement parameter of two
separate events can be displayed and compared with each
other.
257
Zoom function:
Through the "Zoom" mechanism (touchscreen: touch the screen
at a desired position on the screen with the pen, move it to the
desired final position and take the pen off the screen again;
mouse: click on a position with the left mouse button and drag
the cursor to the desired position and release the mouse button
again) individual frequency ranges in the area of a graph can
be zoomed out. This zoom function affects the other graph at
the same time.
•
Display in "Information" mode ("Info")
This mode is activated when the field "Info" is activated in one
of the two graphs.
In this mode, certain measurement parameter values (minimum
and maximum r.m.s. and peak values over the entire measurement period) of one of the two graphs can be displayed in a
brief overview.
With this button, the events,
which are displayed in the event
list (Table), can be reduced (filtered). Filter criteria are measurement time, phases, and
event criteria.
By pressing this button,
different measurement
parameters can be selected whose time dependence and/or spectrographic analysis are to be
displayed. One of the following selection windows
opens:
258
For a precise description, see section 11.3.1.2.2, page 206.
In the analysis option „Transient R.“, the print-out appears as
follows:
Figure 11.50: Protocol
analysis option
[Transient R.-Table]
Figure 11.51: Protocol
analysis option
[Transient R.-x(t) Graph]
259
Figure 11.52: Protocol
analysis option
[Transient R.-Spectra]
By pressing this button, the displays in both graphs are reset to
the display of the entire event.
This button resets the cursor to the center of the display in both
graphs.
By pressing this button, the list of transient events is exported in
a „...txt.“-file. The new file („...txt“) is saved to the folder „...\Data2
\_EXPORT“.
With these buttons, it is possible to switch on/off individual
inputs to the graphs (e.g. phase values). Only activated inputs
to the graph are represented.
Input 1 = red
Input 2 = blue
260
Input 3 = green
Input N = yellow
With these arrow keys, the event list (Table) can be paged
through.
With these arrow keys, the cursor is moved simultaneously in
both graphs.
In the display area below, the current cursor position is shown
as a time (x(t)-graph) and/or as a frequency (spectra)
This button terminates the analysis option [Transient R.] and
returns the user to the start-screen of the program "C.A 8352Post" (see section 11.2).
261
11.3.6 Analysis with option Telegrams
After the procedures described in sections 11.2.2 and 11.2.3, followed by
pressing the button
and a certain amount of time, in which the desired
measurement data are read in, a display with following structure appears:
Figure 11.53: Start screen within the analysis option [Telegrams]
The display of the analysis option [Telegrams] always begins with a summary of
the recorded telegrams (ripple control signals) in chronological order. This listing
also includes the phase in which the telegram was detected and a brief
description of the telegram ("Checksum": special coding for rapid identification).
262
11.3.6.1 Main display area
Figure 11.54: Start screen within the analysis option
[Telegrams]; overview
Right button panel:
On the right hand side of the screen one finds the action-panel
(overview of the buttons and their functions: Page 264) for switching
to different data analysis functions and other menu buttons available
within the analysis option [Telegrams].
263
11.3.6.2 Right button panel: menu buttons and their functions
11.3.6.2.1 Overview
48
... Page 264
... Page 265
... Page 266
... Page 267
... Page 268
... Page 268
... Page 268
... Page 268
... Page 268
... Page 268
11.3.6.2.2 Detail
By pressing this button, the user is provided with a summary of
the recorded telegrams in chronological order. This listing also
includes the phase in which the telegram was detected and a
brief description of the telegram ("Checksum": special coding
for rapid identification). One or more telegrams can be marked
in this area in order to view their time dependence (see option
[x(t)-Graph], page 265).
48
Drop-down menu by pressing the button
264
Figure 11.55: Display analysis option
Alarms- [Table]
This button takes the user to a display of the time dependence
(in seconds) of the selected telegrams:
Tim e d ep en de nc e g ra ph
o f the se le cte d tele gram s
cursor
D esc rip tion to th e d isp la ye d tele g ra m
param ete rs in this se ctio n
Figure 11.56: Display analysis option
Telegrams- [x(t) Graph]
265
Freq:
Umax: Indicates the maximum voltage level (r.m.s.
value) of the telegram signal, which arose
during the captured telegram.
Imax:
Indicates the maximum current level (r.m.s.
value) of the telegram signal, which arose
during the captured telegram.
Uon:
Indicates the average voltage level (r.m.s.
value) of the single logical 1-signal (high
condition) over the captured telegram packet
(total length) for which the value lies above the
response threshold.
Ion:
As for current.
Indicates the exact measured frequency for the
captured telegram.
Zoom function:
Through the "Zoom" mechanism (touchscreen: touch the screen at a desired
position on the screen with the pen, move it to the desired final position and take
the pen off the screen again; mouse: click on a position with the left mouse button
and drag the cursor to the desired position and release the mouse button again)
individual areas in the area of a telegram time dependence can be zoomed out.
This zoom function affects the other graph at the same time.
With this button, the telegrams, which are shown in the
telegram list (Table), can be reduced (filtered). Filter criteria are
measurement time, phases, telegram conditions.
266
For a precise description, see section 11.3.1.2.2, page 206.
In the analysis option „Telegrams“, the print-out appears as follows:
Figure 11.57:
Protocol
analysis option
[Telegrams-Table]
Figure 11.58:
Protocol
analysis option
[Telegrams-x(t) Graph]
267
By pressing this button, the display of the time dependence is
reset to display the total telegram duration.
This button resets the cursor to the center of the display.
By pressing this button, the list of telegrams is exported in a
„...txt.“ file (saved in tabular form in a text file). The new file
(„...txt“) is saved to the folder „...\Data2\ _EXPORT“ and can be
opened and/or processed from here.
These arrow keys can be used to page through the list of telegrams (Table).
With these arrow keys, the cursor can be moved through the
telegram duration graph.
The current cursor position in seconds of the telegram duration
is indicated in the display area underneath.
With this button, the analysis option [Telegrams] terminates
and the user is returned to the start-screen of the program "C.A
8352-Post" (see section 11.2).
268
07 – 2004
Code 691239A01 – Ed. 1
China - Shanghai Pujiang Enerdis Inst. CO. LTD - 5 F, 3 Rd buildind, n°381 Xiang De Road
200081
SHANGHAI.
Tél
:
(021)
65
08
15
43
Fax
:
(021)
65
21
61
07
Deutschland - Straßburger Str4 - 77694 KEHL/RHEIN - Tél : (0785 1) 99 26-0 - Fax : (07851) 99 26-60
España - C/ Roger de Flor N°293 - Planta 1 - 08025 BARCELONA - Tél : (93) 459 08 11 - Fax : (93) 459 14 43
Italia - Via Sant’ Ambrogio, 23/25 - 20050 BAREGGIA DI MACHERIO (MI) - Tél : (039) 245 75 45 - Fax : (039) 481 561
Liban - P.O BOX 60-154 - 1241 2020 Jal el dib - BEYROUT - Tél : +961 1 890 425 - Fax : +961 1 890 424
Österreich - Slamastrasse 29 / 3 - 1230 WIEN - Tél : (1) 61 61 9 61 - Fax : (1) 61 61 9 61 61
Schweiz - Einsiedlerstrasse 535 - 8810 HORGEN - Tél : (01) 727 75 55 - Fax : (01) 727 75 56
UK - Waldeck House - Waldeck Road - MAIDENHEAD SL6 8BR - Tél : 01628 788 888 - Fax : 01628 628 099
USA - d.b.a AEMC Instruments - 200 Foxborough Blvd, Foxborough, MA 02035 - Tél : (508) 698-2115 - Fax : (508) 698-2118
190, rue Championnet - 75876 PARIS Cedex 18 – FRANCE
Tél : (33) 01 44 85 44 85 - Fax : (33) 01 46 27 73 89 - www.chauvin-arnoux.fr
269