1
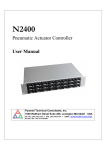
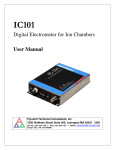
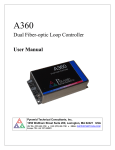
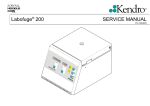
M40
High-Density Device Interface
User Manual
Pyramid Technical Consultants, Inc.
1050 Waltham Street Suite 200, Lexington MA 02421 USA
US: TEL: (781) 402 1700 ♦ FAX: (781) 402-1750 ♦ EMAIL: [email protected]
Europe: TEL: +44 1273 492001
PSI System Controls and Diagnostics
1 Contents
1
Contents ..............................................................................................................................................................2
2
Figures .................................................................................................................................................................5
3
Safety Information .............................................................................................................................................6
4
Models .................................................................................................................................................................8
5
Scope of Supply ..................................................................................................................................................9
6
Optional Items ..................................................................................................................................................10
7
6.1
Power supplies ..............................................................................................................................................10
6.2
Signal cables .................................................................................................................................................10
6.3
Data cables....................................................................................................................................................10
6.4
Test connectors ..............................................................................................................................................10
6.5
Fiber-optic loop ............................................................................................................................................10
6.6
DIN rail mount ..............................................................................................................................................10
Intended Use and Key Features ......................................................................................................................11
7.1
Intended Use..................................................................................................................................................11
7.2
Key Features .................................................................................................................................................11
8
Specification......................................................................................................................................................12
9
Installation ........................................................................................................................................................17
9.1
Mounting .......................................................................................................................................................17
9.2
Grounding and power supply ........................................................................................................................17
9.3
Connection to equipment ...............................................................................................................................18
9.3.1
Typical setup ........................................................................................................................................18
9.3.2
Compatibility with loop controllers .....................................................................................................19
9.3.3
Signal cables ........................................................................................................................................19
M40 User Manual
M40_UM_150226
Page 2 of 62
PSI System Controls and Diagnostics
9.3.4
10
Embedded installation ..........................................................................................................................20
Getting Started using the Pyramid Diagnostic Host Programs ....................................................................21
10.1
Preparing the M40 for operation .............................................................................................................21
10.2
Installing and Using the PSI Diagnostic Program ...................................................................................22
10.2.1
Establishing communication with the M40 .....................................................................................22
10.2.2
Data tab ...........................................................................................................................................24
10.2.3
Setup tab..........................................................................................................................................28
10.2.4
Device tab .......................................................................................................................................30
10.3
Installing and Using the PTC Diagnostic G2 Program ...........................................................................31
10.3.1
11
Establishing communication with the M40 .....................................................................................32
Interfacing to EPICS via IG2 ..........................................................................................................................35
1.1
What is EPICS? .............................................................................................................................................35
1.2
Installing and Configuring IG2 .....................................................................................................................36
12
Circuit overview ...............................................................................................................................................39
13
Calibration ........................................................................................................................................................43
13.1
M40 Calibration Factors ..........................................................................................................................43
13.2
Application Calibration Factors ..............................................................................................................43
14
Wavetable Output and Logging ......................................................................................................................45
15
Connectors ........................................................................................................................................................46
15.1
Front panel connectors.............................................................................................................................46
15.1.1
15.2
16
Analog and digital I/O .....................................................................................................................46
Rear panel connectors ..............................................................................................................................47
15.2.1
Power input .....................................................................................................................................47
15.2.2
Fiber-optic communications ............................................................................................................47
Controls and Indicators ...................................................................................................................................48
16.1
Front panel controls .................................................................................................................................48
16.2
Rear panel controls ..................................................................................................................................48
16.2.1
Address switch ................................................................................................................................48
M40 User Manual
M40_UM_150226
Page 3 of 62
PSI System Controls and Diagnostics
16.3
Front panel indicators ..............................................................................................................................48
16.4
Rear panel indicators ...............................................................................................................................48
16.4.1
Power ..............................................................................................................................................48
16.4.2
Activity............................................................................................................................................48
16.4.3
Network...........................................................................................................................................48
16.4.4
Device .............................................................................................................................................48
16.5
Internal settings ........................................................................................................................................49
16.5.1
17
JPR1 settings ...................................................................................................................................49
Software updates ..............................................................................................................................................50
17.1
FPGA firmware updates ...........................................................................................................................50
17.2
PIC firmware updates ...............................................................................................................................51
18
Fault-finding .....................................................................................................................................................54
19
Maintenance .....................................................................................................................................................57
20
Returns procedure ...........................................................................................................................................58
21
Support..............................................................................................................................................................59
22
Disposal .............................................................................................................................................................60
23
Declaration of Conformity ..............................................................................................................................61
24
Revision History ...............................................................................................................................................62
M40 User Manual
M40_UM_150226
Page 4 of 62
PSI System Controls and Diagnostics
2 Figures
Figure 1. M40 chassis end panels. Dimensions mm. _________________________________________________ 15
Figure 2. M40 case plan and side views. Dimensions mm. ____________________________________________ 16
Figure 3. DIN rail mounting shown for the identically-shaped M10 device. _______________________________ 17
Figure 4. M40 power input options._______________________________________________________________ 18
Figure 5. Schematic M40 installation for remote control of a power supply group _________________________ 19
Figure 6. Example of a connection to the M40 via an A500 and Ethernet. ________________________________ 22
Figure 7. PSI Diagnostic Search Utility – adding a target IP address and port ______________________________ 23
Figure 8. PSI Diagnostic Search Utility – detection in progress__________________________________________ 23
Figure 9. Result of device search _________________________________________________________________ 24
Figure 10. Data tab: M40 running with default settings, showing autoscaled background noise on the inputs. __ 25
Figure 11. Data tab: bargraph display. ____________________________________________________________ 26
Figure 12. Setup tab. __________________________________________________________________________ 29
Figure 13. Device tab, showing firmware update utility controls. _______________________________________ 30
Figure 14. PTC Diagnostic G2 discovery dialog. ______________________________________________________ 32
Figure 15. System pane showing M40 connected via A500 ____________________________________________ 33
Figure 16. M40 data display in PTC Diagnostic G2 ___________________________________________________ 33
Figure 17. Example network for EPICS communications. ______________________________________________ 35
Figure 18. Example user screen created using CS Studio BOY. __________________________________________ 36
Figure 19. Example xml system configuration file for IG2 / EPICS. _______________________________________ 38
Figure 20. M40 block schematic. _________________________________________________________________ 39
Figure 21. M40 analog input configuration (referenced to AGnd). ______________________________________ 40
Figure 22. M40 analog input filter response. _______________________________________________________ 40
Figure 23. M40 analog output configuration. _______________________________________________________ 41
Figure 24. M40 analog output slew rate for full scale step (20 V in 32 µsec). ______________________________ 41
Figure 25. M40 digital input configuration. ________________________________________________________ 42
Figure 26. M40 digital output configuration. _______________________________________________________ 42
Figure 27. Using application scaling. ______________________________________________________________ 44
Figure 28. Location of jumpers___________________________________________________________________ 49
Figure 29. Selecting the fhex file to load. __________________________________________________________ 51
Figure 30. Restart prompt after FPGA update. ______________________________________________________ 51
Figure 31. Selecting the hex file to load. ___________________________________________________________ 52
Figure 32. Firmware upload in progress ___________________________________________________________ 52
M40 User Manual
M40_UM_150226
Page 5 of 62
PSI System Controls and Diagnostics
3 Safety Information
This unit is designed for compliance with harmonized electrical safety standard EN610101:2000. It must be used in accordance with its specifications and operating instructions.
Operators of the unit are expected to be qualified personnel who are aware of electrical safety
issues. The customer’s Responsible Body, as defined in the standard, must ensure that operators
are provided with the appropriate equipment and training.
The unit is designed to make measurements in Measurement Category I as defined in the
standard.
Although the M40 does not generate dangerous voltages, nor is it designed to measure directly
such voltages, in your application it may be controlling power supplies that do. Appropriate
precautions must be taken.
The unit must not be operated unless correctly assembled in its case. Only Service Personnel, as
defined in EN61010-1, should attempt to work on the disassembled unit, and then only under
specific instruction from Pyramid Technical Consultants, Inc. or their authorized distributors.
Pyramid may agree to the M40 being embedded within a customer device where this is necessary
for an application, either cased or un-cased. The customer assumes responsibility for the safety,
design and performance of the integrated system.
The unit is designed to operate from +24VDC power, with a maximum current requirement of
200mA. A suitably rated power supply module is available as an option.
The unit must be grounded by secure connection to a grounded conducting surface. If the unit is
mounted on an insulating surface, then one of the four mounting screws must be re-assigned as a
grounding connection.
Some of the following symbols may be displayed on the unit, and have the indicated meanings.
M40 User Manual
M40_UM_150226
Page 6 of 62
PSI System Controls and Diagnostics
Direct current
Earth (ground) terminal
Protective conductor terminal
Frame or chassis terminal
Equipotentiality
Supply ON
Supply OFF
CAUTION – RISK OF ELECTRIC SHOCK
CAUTION – RISK OF DANGER – REFER TO MANUAL
M40 User Manual
M40_UM_150226
Page 7 of 62
PSI System Controls and Diagnostics
4 Models
M40
-NOCASE
M40 User Manual
Universal device interface with eight analog outputs, eight analog
inputs, eight TTL outputs, eight TTL inputs.
Option for supply as uncased circuit board for embedded applications
M40_UM_150226
Page 8 of 62
PSI System Controls and Diagnostics
5 Scope of Supply
M40 model as specified in your order.
PSU24-40-1 power supply.
USB memory stick containing:
Datasheet
User manual
PSI diagnostic software files
PTC DiagnosticG2 software files
IG2 interface layer files for EPICS connectivity
Test data
Optional items as specified in your order.
OEM customers will not receive all items.
M40 User Manual
M40_UM_150226
Page 9 of 62
PSI System Controls and Diagnostics
6 Optional Items
6.1 Power supplies
PSU24-40-1. +24 VDC 1.62 A PSU (100-250 VAC, 50-60 Hz, IEC C14 3-pin plug receptacle)
with output lead terminated in 2.1mm threaded jack.
6.2 Signal cables
CAB-D44F-10-D44M Signal cable 44-way screened, D44 male to D44 female, 10’.
Other lengths available.
6.3 Data cables
CAB-ST-HCS-10-ST Fiber-optic cable, 200 um silica, ST terminated, 10’.
Other lengths available up to 1000’.
6.4 Test connectors
Loopback test connector for the M40.
6.5 Fiber-optic loop
A360 fiber-optic loop controller / Ethernet adaptor.
A500 intelligent real-time controller with Ethernet interface.
A560 intelligent real-time controller with Ethernet interface.
6.6 DIN rail mount
MTG-DIN35-11462. Mounting adaptor for 35mm standard DIN rail. M40 can be mounted
along or across the rail.
M40 User Manual
M40_UM_150226
Page 10 of 62
PSI System Controls and Diagnostics
7 Intended Use and Key Features
7.1 Intended Use
The M40 is intended for general control and monitoring applications using analog voltages in the
+/-10 V range, and TTL level digital inputs and outputs. It has similar features to the M10
device, and the same case size, but it provides a higher number of inputs and outputs than the
M10. A typical M40 application would be the remote control and monitoring of one or more
power supplies. The analog outputs would set voltage and current commands or compliance
limits, the analog inputs would monitor actual voltage and current. The digital outputs can be
assigned to functions such as enable, reset and so on, and the digital inputs can monitor status
bits.
The M40 has design features which make it tolerant of electrically noisy environments, but the
place of use is otherwise assumed to be clean and sheltered, for example a laboratory or light
industrial environment. The unit may be used stand-alone, or networked with other devices and
integrated into a larger system. Users are assumed to be experienced in the general use of
precision electronic circuits for sensitive measurements, and to be aware of the dangers that can
arise in high-voltage circuits.
7.2 Key Features
Precision analog inputs and outputs +/- 10 V range with 16 bit digitization.
Fast digital inputs and outputs.
On-board digital averaging of analog inputs.
Very low transition transients on analog outputs between DAC levels, compatible with control of
wideband devices.
Multiple waveform output capability with synchronized data collection.
Can be operated in a fiber-optic serial communication loop with up to fifteen other devices.
100BaseT Ethernet interfacing to a host computer available through the A360, A500 and A560
loop controllers.
M40 User Manual
M40_UM_150226
Page 11 of 62
PSI System Controls and Diagnostics
8 Specification
Analog outputs
Number
Eight identical, bipolar, +/-10 V
Configuration
Single-ended
Compliance
5 mA max per channel via internal 100R series resistance
Resolution
16 bit over full range.
Linearity
0.1 % maximum deviation of any point from linear fit to all points
over full span.
Noise
< 0.5 mV RMS measured by loopback to analog inputs, with line
frequency averaging.
Typical RMS noise measured with external DVM < 50 µV.
Crosstalk
< 1 mV for 10 V output on another channel
Thermal stability
< 200 µV C-1
Slewing rate
0.6 V µsec-1 typical
Maximum output refresh
rate
100 kHz (internal wavetable driven)
Calibration
Independent gain and offset stored for each output in NVR
10 kHz (host controlled via fiber optic interface, special host
software)
Analog inputs
Number
Eight identical, bipolar, +/-10 V
Configuration
Single-ended
Input impedance
>= 1 Mohm
Input protection
4.7 kohm series input.
Analog filter
2-pole LP filter, 10 kHz (-3dB)
Noise
< 0.50 mV RMS with line frequency averaging.
Typical measured RMS noise with unconnected inputs:
< 200 µV at 1e-4 s averaging
< 30 µV at 1e-2 s averaging
< 10 µV at 2e-1 s averaging
Digitization
16 bit over full range
Crosstalk
< 1 mV with 10 VDC on another input
M40 User Manual
M40_UM_150226
Page 12 of 62
PSI System Controls and Diagnostics
< 30 mV with 10 VAC 1 MHz on another input
Conversion rate
250 kHz on each input, fully simultaneous
Digital filtering
Software configurable block averaging, 1 second maximum.
Linearity
0.1 % maximum deviation of any point from linear fit to all points
over full span.
Calibration
Independent gain and offset stored for each input in NVR
Waveform memory
(future option)
Outputs
1024 output values x 8 analog channels plus one synch bit
Output rate
Period selectable 10 µsec to 3600 seconds
Inputs
1024 input readings x 8 analog channels plus digital input byte
Digital outputs
Number
Eight
Voltage levels
TTL
Maximum compliance
3 mA per channel source or sink
Output series resistance
100 ohm
Minimum output pulse
length
15 nsec
Digital inputs
Number
Eight
Voltage levels
TTL
Configuration
Active low with internal 47 kohm pull up to +5V
Input protection
470 ohm series
Controls and displays
Controls
16 position rotary switch for loop address selection
Displays
Four LEDs (power, activity, network, device)
Communications
Interface
Fiber optic 640 nm, ST connectors (10 Mbit/sec)
Data rate
Typical data rate to host > 1 kHz. Rate in optimised systems up
to 10 kHz.
M40 User Manual
M40_UM_150226
Page 13 of 62
PSI System Controls and Diagnostics
Power
Power input
+24 VDC (+12 V, -4 V), 120 mA typical, 200 mA maximum,
excluding any direct user load. 500 mA fused.
User power
Maximum user power from 24V supply 400 mA (500 mA fused).
Mechanical
Case
Stainless steel.
Connector
Signal connector DSub 44 pin (high density) female.
Power connector Switchcraft 2.1mm jack.
Case protection rating
The case is designed to rating IP43 (protected against solid
objects greater than 1mm in size, protected against spraying
water).
Weight
0.28 kg (0.62 lb).
Dimensions
(see figures 1 and 2).
Environmental
Operating environment
10 to 35 C (15 to 25 C recommended to reduce drift and offset)
< 80% humidity, non-condensing
vibration < 0.2 g all axes (1 to 100 Hz)
Shipping and storage
environment
0 to 50C
< 80% humidity, non-condensing
vibration < 2 g all axes, 1 to 100 Hz
M40 User Manual
M40_UM_150226
Page 14 of 62
PSI System Controls and Diagnostics
44-PIN D-SUB FEMALE I/O
0.60
77.5
79.9
ADDRESS
SELECTOR
STATUS LEDs
FIBER-OPTIC RX
FIBER-OPTIC TX
Power
Activity
Network
Device
+24VDC
POWER IN
Power Transmit Receive
+24V
Address
Figure 1. M40 chassis end panels. Dimensions mm.
M40 User Manual
M40_UM_150226
Page 15 of 62
PSI System Controls and Diagnostics
4X
Ø3.66 MOUNTING HOLE
3.8
114.0
62.0
103.7
28.1
121.6
Figure 2. M40 case plan and side views. Dimensions mm.
M40 User Manual
M40_UM_150226
Page 16 of 62
PSI System Controls and Diagnostics
9 Installation
9.1 Mounting
The M40 may be mounted in any orientation, or may be simply placed on a level surface. A
fixed mounting to a secure frame is recommended in a permanent installation for best low
current performance, as this can be degraded by movement and vibration. Four M3 clear holes
are provided in the base flange on a 62 mm by 114 mm rectangular pattern (see figure 2). An
adaptor for 35 mm EN 50022 DIN rail is available.
Figure 3. DIN rail mounting shown for the identically-shaped M10 device.
The mounting position should allow sufficient access to connectors and cable bend radii. Leave
60mm clearance at either end for mating connectors and cable radii.
Best performance will be achieved if the M40 is in a temperature-controlled environment. No
forced-air cooling is required, but free convection should be allowed around the case.
9.2 Grounding and power supply
A secure connection should be made via the mounting flange to local ground potential. If the
unit is mounted on an insulating surface, then one of the four mounting screws must be reassigned as a grounding connection.
.+24 VDC power should be provided from a suitably-rated power supply with the following
minimum performance:
Output voltage
+24 +/- 0.5 VDC
Output current
300 mA minimum, 2000 mA maximum
M40 User Manual
M40_UM_150226
Page 17 of 62
PSI System Controls and Diagnostics
Ripple and noise
< 100 mV pk-pk, 1 Hz to 1 MHz
Line regulation
< 240 mV
The M40 is tolerant of line voltage in the range 18 VDC to 28 VDC, although we recommend
using a 24 V supply with reasonable output regulation, as indicated.
You may deliver or extract 24 V power through the unit through one of two alternative
connections, as illustrated in figure 4.
Signal
connector
500 mA
33
32
500 mA
Power jack
+24 V
0 V (PS Gnd)
To M40 power circuits
Figure 4. M40 power input options.
The primary input is the 2.1 mm power jack, and the alternative is pins 33 (+24V), 32 (0V) of the
44-way D connector. The second arrangement is provided for situations where the device being
controlled is able to supply 24 VDC power. If power is provided through the jack input, then it is
available as an output on pins 33, 32 of the D connector for user applications. In this case, you
must ensure the following:
a) Maximum current draw does not exceed the external power supply limit, or 500 mA.
b) You do not inject noise into the M40 that will degrade its performance.
The M40 fuses are internal automatically re-setting PTC fuses rated at 500 mA. However the
external power supply for power delivered via the 2.1 mm power jack should in no circumstances
be rated higher than the connector limit of 5 A, and a maximum rating of 2.0 A is recommended.
9.3
Connection to equipment
9.3.1 Typical setup
Figure 5 shows a typical installation to control a group of power supplies, in schematic form. An
M40 provides a current program and voltage compliance limit, and reads back actual current and
voltage from each of four power supplies. Digital outputs are used to enable the supplies, and
reset fault conditions. Digital inputs are used to monitor enabled and fault states. The M40 is on
a fiber-optic communication loop, under control of one of the Pyramid Technical Consultants,
M40 User Manual
M40_UM_150226
Page 18 of 62
PSI System Controls and Diagnostics
Inc. loop controllers (A360, A500, A560). Software on the host computer exposes the I/O points
provided by the M40, and thus allows remote control of the power supplies. Power for the M40
is obtained in this example from a separate power module.
A##0
Programmable
power supplies
Other
devices
I_prog
V_prog
I_mon
V_mon
Other
devices
M40
Dig_ctrl
Dig_mon
Fiber-optic comms
(x 4)
+24V in
Figure 5. Schematic M40 installation for remote control of a power supply group
Typical M40 applications involve its use as part of a large control system integrated under one or
more A500 or A560 controllers. The M40 may be the only device on the loop, or one of up to
fifteen devices. As the number of devices is increased, the loop bandwidth has to be shared, so
for fast control you would generally keep the number of devices on each loop to the minimum.
The M40 has very low glitch energy when its analog outputs change from one DAC setting to
another, so it is well-suited to the control of fast power supplies such as those for electrostatic or
magnetic beam scanners.
An arbitrary output waveform table can be loaded into the M40 and used to drive the outputs
whilst the inputs are recorded. The M40 can thus function as a highly-flexible multi-channel
signal generator and data recorder.
9.3.2 Compatibility with loop controllers
The M40 is compatible with any A500 controllers running DSP firmware version 5.40 or later
and FPGA firmware 2.7.178 or later. The M40 is compatible with any A560 controllers running
firmware package 0.6.138.15 or later.
9.3.3 Signal cables
Try to locate the M40 as close to the equipment being controlled as possible, with the case
sharing the equipment ground. The longest transmission distance is thus handled by the fiberoptic lines, which are completely immune to electrical noise. If long signal cables from the M40
M40 User Manual
M40_UM_150226
Page 19 of 62
PSI System Controls and Diagnostics
to the device being controlled are unavoidable, then you should observe the following
precautions.
Long signal cables increase the chances of picking up unwanted signals and noise on the analog
voltage lines. A maximum length of 10 m is advised, and you should use good quality shielded
cable, with twisted pair cores for the analog inputs (analog in + and -) and outputs (analog out
and AGND).
The strategy for connecting screens will vary according to the nature of the noise. At RF
frequencies, it is generally best to connect the screen to the grounded chassis at both ends. At
lower frequencies it is often best to connect at one end only to break up ground loops. Connect
the cable screens to the M40 case, using the shell of the D connector, and leave them
unconnected at the other end. In some cases, you may get better noise performance by reversing
this screen connection arrangement.
If you are working with fast digital output pulses from the M40, you should also be careful with
long cable runs. To avoid pulse distortion, use matched impedance (around 100 ohm) screened
twisted pair cores (digital output and DGND) for each fast digital signal, and terminate the line
with 100 ohms at the receiving end.
9.3.4 Embedded installation
The M40 is suitable for installation inside the equipment being controlled, and this is generally
the arrangement that minimizes noise and minimizes risk of damage from electrical transients. In
some cases space considerations may dictate that the M40 is installed without its steel case.
Since this may expose the device to mechanical damage or electrical interference, such
installations should only be performed in collaboration with Pyramid Technical Consultants, Inc..
This option is available as M40-NOCASE. The CE marking of the M40 is not applicable if it is
operated without its case, and the user should make separate arrangements to ensure conformity
of the overall assembly with applicable standards.
M40 User Manual
M40_UM_150226
Page 20 of 62
PSI System Controls and Diagnostics
10 Getting Started using the Pyramid Diagnostic Host
Programs
Usually you will use a custom application to communicate with the M40, either one you write
yourself using the software interfaces available from Pyramid Technical Consultants, Inc., or one
that is supplied by Pyramid. However you can get started immediately using one of the PSI
Diagnostic host programs. These are available for free download from www.ptcusa.com, and are
provided with the M40 for end-user customers. There are two generations of the Diagnostic
software, and the M40 is compatible with both.
PSI Diagnostic. This software supports all Pyramid products, apart from G2 devices. It allows
you to connect the M40 via an A500 controller. Ethernet communications use UDP with an
added reliability layer.
PTC Diagnostic G2. This software supports all G2 devices such as the A560, I128, F460 and
C400, plus a growing selection of other Pyramid devices, including the M40. It allows you to
connect the M40 via an A500 or A560 controller. Ethernet communications use TCP/IP and
UDP.
Both Diagnostics are standalone Windows programs which allow you to set outputs and read,
graph and log data from the M40. Their user interfaces are similar. For some applications one of
the Diagnostic programs may be adequate for all of your data acquisition needs. In any event it is
useful to understand what you can do with the Diagnostic programs, because they expose all of
the functions of the devices they connect to. Application programmers will find this useful to
help decide which functions to implement in their own host software.
10.1 Preparing the M40 for operation
Inspect the unit carefully to ensure there is no evidence of shipping damage. If there appears to
be damage, or you are in doubt, contact your supplier before proceeding.
Connect 24 V DC power but no other connections. The LEDs will go through a startup sequence
when the power is applied. All four LEDs light, then the power LED stays lit while the other
three indicators light in sequence. When the M40 has started correctly and prior to connecting to
a controller, only the power LED will remain lit.
It is simplest to start with to connect the M40 directly to a loop controller as the only device on
the loop. The address switch can be set to anything between 1 and 15. Figure 5 shows a
connection to an A500.
M40 User Manual
M40_UM_150226
Page 21 of 62
PSI System Controls and Diagnostics
Ethernet
A500
Fiber-optic
comms
M40
+24V in
Figure 6. Example of a connection to the M40 via an A500 and Ethernet.
10.2 Installing and Using the PSI Diagnostic Program
Download the PSI Diagnostic installer (.msi file) or find the copy on the USB memory stick if
you purchased the M40 as an end-user. We recommend that you copy the installer file into a
directory on your host PC. Check the Pyramid Technical Consultants, Inc. web site at
www.ptcusa.com for the latest version.
The program runs under the Microsoft Windows operating system with the 4.0 .NET framework.
This has to be installed before the PSI Diagnostic. Most new PCs have .NET already installed,
or it can be downloaded from the Microsoft web site at no charge. The Pyramid installer will
prompt you if you need to update the version on your computer.
Launch the installer, and follow the screen prompts. Once the program has installed, you can run
it at once. It will allow you to connect to the M40 via an A500 controller, and, depending upon
your setup, to multiple additional devices at the same time. The Diagnostic uses the concepts of
ports and loops to organize the connected devices. A port is a communications channel from
your PC, such as a COM port, a USB port or Ethernet port. The A500 communicates via an
Ethernet port. Each port can be a channel to one or more loops, and each loop may contain up to
15 devices.
10.2.1 Establishing communication with the M40
Start the PSI Diagnostic. It will search the available ports on your computer and present a search
list in an autodetect utility window. If the first search does not reveal any ports, a second attempt
will usually reveal them. The example in figure 6 shows two autodetected COM ports plus two
previously entered IP addresses. We’ll work through an example where the connection to the
M40 is via an A500 at IP address 192.168.100.238.
We can add any specific IP address to the network search by typing the address followed by a
colon and the standard port number 100, as shown in the figure below, and clicking “Add IP”.
M40 User Manual
M40_UM_150226
Page 22 of 62
PSI System Controls and Diagnostics
Figure 7. PSI Diagnostic Search Utility – adding a target IP address and port
Check that the target port is checked for inclusion in the search and click the “Start” button. The
autodetection process will start.
Figure 8. PSI Diagnostic Search Utility – detection in progress
After a few seconds the program should find the M40 (plus any other devices you have
connected), and display the list of available devices in the System window. In the example
M40 User Manual
M40_UM_150226
Page 23 of 62
PSI System Controls and Diagnostics
shown below, we have found one A500 controller, with an M40 on loop 6 plus other devices on
loops 1 and 3.
Figure 9. Result of device search
10.2.2 Data tab
Clicking on the M40 entry in the explorer list will open the M40 window with the data tab
showing (figure 9). You can read the eight analog and eight digital inputs, and set the eight
analog and eight digital outputs. At the top of the window a communications status bar
progresses if the M40 is communicating successfully with the loop controller, and there are
LEDs which indicate the connected state, the pending state (the M40 is occupied processing a
command) and the error state.
You can resize, maximize and minimize this window in the usual manner. At startup the M40
will be acquiring data using default settings and you should see background noise values for all
channels. If there is no connection to the M40 signal connector, then analog inputs will float
towards a 10V limit, and the digital inputs will be pulled high by the internal pullups, so all the
inputs will show “set” (green LEDs on the display). On the M40 itself, the network LED will
blink indicating that the device is being polled by the loop controller over the fiber optic
connection, and the Device LED will flash indicating that the M40 is initiated and acquiring data.
If you abort the acquisition, the Device LED will turn off.
M40 User Manual
M40_UM_150226
Page 24 of 62
PSI System Controls and Diagnostics
Figure 10. Data tab: M40 running with default settings, showing autoscaled background noise
on the inputs.
Select one of the fixed Y scales if you want to inhibit autoscaling of the graph. You can display
the analog signals either as a scrolling value against time graph (like a chart recorder) or as an
analog bargraph. The scope display mode looks the same as the strip chart, but the data is
displayed without scrolling for each 256 readings.
M40 User Manual
M40_UM_150226
Page 25 of 62
PSI System Controls and Diagnostics
Figure 11. Data tab: bargraph display.
Try out the various screen controls and readouts to see their effect.
Initiate / Abort
These buttons start and stop data acquisition. LEDs indicate whether the
M40 is measuring, triggered or streaming data to the controller in fast
mode.
ADC
The eight analog inputs are continuously updated while the M40 is
acquiring data. The displayed values are Input_voltage * Gain - Offset.
The offset and gain values are set on the Setup tab (see next section). The
colour codes show which are the corresponding traces on the graphic
display, and you can suppress plotting of any channel by unchecking it.
This does not affect the data logging – all channels are always logged.
DAC
You can set the eight analog outputs. The new value will be sent out as
soon as you press the enter key, or click in another parameter field. The
values that are sent out in volts are (Raw_value – Offset)*Gain, up to the
+/- 10V limit. The offset and gain values are set on the Setup tab (see next
section).
If you have selected the check box to use the application calibration on the
Setup tab, and supplied physical units, then these will be displayed on the
Data tab alongside the relevant channel.
Digitals
M40 User Manual
Eight check boxes allow you to set the corresponding digital outputs high.
Eight LEDs show the states of the digital inputs. By default the LED is
illuminated if the input is TTL high, but this logic can be inverted using
M40_UM_150226
Page 26 of 62
PSI System Controls and Diagnostics
controls on the Setup tab.
Triggers
This counter shows the number of readings made by the M40 since the last
initiate. The number of readings you can log on the host computer may be
less, depending on the number of readings you request, the averaging
period and the available data rate up to the loop controller and the host
computer.
Temperature
This is a readback of the internal temperature of the M40 in degrees
centigrade.
Buffer
The PSI Diagnostic collects data coming from the M40 into a buffer, with a
rate that is the lesser of the actual acquisition rate or the X axis rate setting.
The buffer contents can be cleared with the Clr button ( ), or can be
written to a .csv file with the save button ( ). The buffer number shows
how much data is currently in the buffer. The maximum allowed is 65535
bytes, after which the buffer wraps around to overwrite the earliest values.
You can toggle data plotting and accumulation into the buffer with the Run
Plot control (
/
). When the accumulation is halted, then the
slider is enabled, which allows you to scroll back through the data when in
strip chart mode.
Y:
This drop-down controls the vertical scaling of the data plot. You can
select automatic scaling or various fixed proportions of the nominal 10 V
full scale.
Display only
positive values
This control is enabled for fixed vertical scaling. It toggles the graphic
from a display that is symmetric around 0 to one that shows only 10% of
the vertical scale in the negative direction.
X:
This drop down controls how fast new points are added to the data plot and
the data log. For example, if your acquisition settings generate a value
every 100 msec but you have 1 second selected on this control, then every
tenth reading will be stored.
Filtering
The PSI Diagnostic can apply a filter to the plotted data to allow you to
pick small signals out of noise. This filter is independent of, and additional
to, the block averaging filtering implemented by the M40 itself. The PSI
Diagnostic filter is a simple IIR type, Yplot_N = Ynew/A + (1-1/A)Yplot_N-1,
where Ynew is the latest reading, Yplot_N is the current value to be plotted,
Yplot_N-1 is the prior plotted value and A is the averaging value from the
pull-down menu. You clear and restart the filter at any time by pressing
M40 User Manual
M40_UM_150226
Page 27 of 62
PSI System Controls and Diagnostics
the reset button
.
The filtering affects the graphed data and digital displays. If you choose to
save the buffered data, you will have the opportunity to save the raw values
or the filtered values.
DC/AC
The DC/AC toggle removes the DC component from the strip chart or
scope mode graphic data, but does not affect the digital display nor the
logged data.
/
Zero correction
/
When you press zero, the current values are captured and subtracted from
all subsequent readings as displayed on all the graphic and digital displays,
until you press the clear zeroes button . If you choose to save the
buffered data, you will have the opportunity to save the raw values or the
zero offset corrected values.
Differential display When this control is pressed, the graphic changes to display the difference
between successive readings. The buffered data is not affected.
Graphic mode
You can plot the data as a rolling strip chart or a bar chart (histogram). The
scope mode is a variant of the strip chart. Instead of a rolling chart, the
graphic is refreshed as a whole for each 256 samples. In histogram mode
you can place a cursor on a particular channel to read out its value.
Clear buffered data. Values are cleared from the PSI Diagnostic data
buffer, but any acquisition in progress continues and timestamps are not
reset.
Save data buffer contents to csv file. When you click this button you will
see a drop down selection
which allows you to save either
the raw data, or the values with the PSI Diagnostic zero offset and
averaging
10.2.3 Setup tab
Click on the “Setup” tab. On this screen you can alter digital input logic polarities, analog input
filtering and analog calibration values.
M40 User Manual
M40_UM_150226
Page 28 of 62
PSI System Controls and Diagnostics
Figure 12. Setup tab.
Digital input
polarity
By default, the digital inputs show true (green LEDs on the Data tab) when
the electrical level is TTL high. You can change this individually for the
eight inputs using the check boxes, so that true is TTL low.
Trigger points
The trigger points field determines how many readings will be taken
following Initiate. The INF button sets a state where acquisition will
continue indefinitely.
Averaging period
The analog inputs are converted in the M40 at 50 kSa/s. A digital filter
then averages the samples over the selected period to give the final values
make up each reading on each channel, and that are transmitted back to the
host system for display and logging. A useful setting is the period of the
local mains electricity (16.67 msec or 20 msec), as this will zero any mains
pickup in the readings.
Calibrate
The M40 uses two linear calibrations. The M40 calibration is established
during manufacture or factory recalibration, and is intended to correct for
small differences in the electronics, so that the outputs and inputs are
accurate in volts. It is stored in the M40 itself in NVR.
The application calibration is applied by the PSI Diagnostic in addition to
the permanent calibration when the “Use temporary scaling” box is
checked. Any physical units you have entered will be displayed alongside
the relevant input/output values on the Data tab. The parameters are stored
M40 User Manual
M40_UM_150226
Page 29 of 62
PSI System Controls and Diagnostics
on your computer, referenced to the serial number of the M40. This
calibration is primarily intended to allow you to program and readback a
power supply or similar device in its native units. See section ## for more
information on using the calibrations.
10.2.4 Device tab
Click on the “Device” tab. You can check the communication link status, read the M40
manufacturing serial number and verify the versions of the hardware and firmware. On the right
is the firmware update utility. You can use this to download firmware updates (.hex and .fhex
files) downloaded from the Pyramid Technical Consultants, Inc. web site.
Figure 13. Device tab, showing firmware update utility controls.
Communication
The counters show details of the communications between the M40 and its
host. You can click the Reset Counters button to reset the fields to zero.
System controls
Pressing :SAFEstate sets a mode in which the M40 goes to a defined safe
state (all outputs zeroed) if it does not communicate with its host controller
in the timeout period in seconds set by the :COMM:TIMEout parameter. If
communications are restored, then the M40 will re-assert its prior output
state. If you want to disable this feature, set the timeout to 0.
Pressing :AUTOrecover sets a state in which the M40 will attempt to
M40 User Manual
M40_UM_150226
Page 30 of 62
PSI System Controls and Diagnostics
restart automatically if it detects data corruption.
The COMM:Term and COMM:Checksum controls are not used on the
M40. You can ignore them when using the PSI Diagnostic
The system controls are software password protected, so you will see a red
warning message at the bottom of the window when you use them. The
PSI Diagnostic automatically sends the password.
Frequency
This parameter sets the averaging period that will be used by default on
power up. You should set it to the dominant electronic noise frequency in
your environment (normally the line frequency).
SerialNumber
This is the manufacturing serial number of your device, and should be left
unchanged.
Comm:Timeout
The time period in seconds without communications before the M40 goes
to the safe state. Set to zero if you don’t want this feature.
Select .hex file
This button starts the M40 PIC firmware update process. It opens a file
selection dialog. When you select a hex file it will start uploading to the
M40 immediately. Upon completion the M40 will restart automatically,
and you will see the new Device Version number displayed. See section 16
for more details.
Select .fhex file
This button starts the M40 FPGA firmware update process. It opens a file
selection dialog. When you select a fhex file it will start uploading to the
M40 immediately. Upon completion you will need to power cycle the
M40, which will cause the new code to be loaded. You will see the new
FPGA Version number displayed. See section 16 for more details.
Reset
This button causes a full warm reset of the M40. All outputs will go to
zero during the reset, then will be set back to their prior settings by the PSI
Diagnostic.
10.3 Installing and Using the PTC Diagnostic G2 Program
The PTC Diagnostic G2 host software provides the same user functions as the PSI Diagnostic,
and has a similar look and feel, but it is built on a different software foundation. Unlike the PSI
Diagnostic, the PTC Diagnostic G2 uses the same DLL function libraries that Pyramid uses to
build user applications. These libraries can be provided to customers who want to build their
own applications. The G2 Diagnostic can often provide faster average data rates to the host by
its use of block data transfers. If you need a Diagnostic to operate the M40 in conjunction with
G2 devices such as the A560, I128, and C400, then you must use the PTC Diagnostic G2.
PTC Diagnostic G2 can coexist with the PSI Diagnostic on the same computer. Both programs
can in fact communicate with an A500 or A560 the M40 at the same time (the PSI Diagnostic
must be launched first), although this is not generally recommended, as the results could be very
confusing.
M40 User Manual
M40_UM_150226
Page 31 of 62
PSI System Controls and Diagnostics
Since the two programs are similar, we shall concentrate on the differences.
Download the PTC Diagnostic G2 installer (.msi file) or find the copy on the USB memory stick
if you purchased the M40 as an end-user. We recommend that you copy the installer file into a
directory on your host PC. Check the Pyramid Technical Consultants, Inc. web site at
www.ptcusa.com for the latest version.
The program runs under the Microsoft Windows operating system with the 4.0 .NET framework.
This has to be installed before the PSI Diagnostic. Most new PCs have .NET already installed,
or it can be downloaded from the Microsoft web site at no charge. The Pyramid installer will
prompt you if you need to update the version on your computer.
10.3.1 Establishing communication with the M40
Start the PTC Diagnostic G2. The program expects all connections to devices like the M40 be
via Ethernet ports, whether through dedicated loop controllers like the A500, A560 and A360, or
via other Ethernet-enabled devices that support slave devices, such as the I128. Unlike the PSI
Diagnostic, you do not need to specify the IP address. When you launch the program, it will
open the Discover Devices dialog. Pressing the Discover Controllers button will give you a list
of available controllers. The search will include all devices visible on your accessible subnet,
including any on the far end of a VPN link. In the following example the search has found five
A500 controllers. The A60 Recovery entry is a diagnostic utility used for some G2 devices,
which you can ignore.
Figure 14. PTC Diagnostic G2 discovery dialog.
Highlight the target device to enable the Connect & Discover Subdevices button. Clicking this
should result in the controller appearing in the System area on the left, with its connected
subdevices shown. In this case we only have an M40 on loop 6.
M40 User Manual
M40_UM_150226
Page 32 of 62
PSI System Controls and Diagnostics
Figure 15. System pane showing M40 connected via A500
Clicking on the M40 entry opens a window for it, with the same basic strip chart and histogram
graphing options, and digital displays.
Figure 16. M40 data display in PTC Diagnostic G2
M40 User Manual
M40_UM_150226
Page 33 of 62
PSI System Controls and Diagnostics
Checking the Auto Initiate button causes the program to automatically start data taking after you
make any change to the M40 parameters.
The Setup and Calibration buttons access areas that provide the same functions as the PSI
Diagnostic Setup tab. PTC Diagnostic G2 does not support application calibration in its current
version. Buffered data acquisition uses M40 on-board memory to permit bursts of contiguous
data to be captured at high rate. This will be supported in a future M40 firmware release.
The firmware update utility is accessed on the Properties area.
M40 User Manual
M40_UM_150226
Page 34 of 62
PSI System Controls and Diagnostics
11 Interfacing to EPICS via IG2
1.1 What is EPICS?
The Experimental Physics and Industrial Control System (EPICS, http://www.aps.anl.gov/epics/)
is:
“A set of Open Source software tools, libraries and applications developed collaboratively and
used worldwide to create distributed soft real-time control systems for scientific instruments such
as particle accelerators, telescopes and other large scientific experiments. EPICS uses
Client/Server and Publish/Subscribe techniques to communicate between the various computers.
Most servers (called Input/Output Controllers or IOCs) perform real-world I/O and local control
tasks, and publish this information to clients using the Channel Access (CA) network protocol.
CA is specially designed for the kind of high bandwidth, soft real-time networking applications
that EPICS is used for, and is one reason why it can be used to build a control system comprising
hundreds of computers.”
Pyramid supplies an executable called IG2 which embeds an open source Channel Access Server
from the EPICS community. This allows connection via the Ethernet interface. IG2 is
configured for the devices you wish to connect using editable xml files. Once IG2 is running on
a computer in your network, then any other computer can run a client program which can display
and control the process variables for the devices. In the simple network in figure 17, the process
variables of an M40 attached to an A360 via fiber optics, are exposed to the network by the IG2
service running on a server computer. One or more client GUI computers can then access the
values.
Switch
A360
Router
IG2 server
M40
GUI PC
Figure 17. Example network for EPICS communications.
M40 User Manual
M40_UM_150226
Page 35 of 62
PSI System Controls and Diagnostics
There is a wide range of client interfaces from the EPICS community, including interfaces for
C++, C#, Java, Python, Labview ™, and Matlab ™. The Control System Studio, or CS Studio,
(http://controlsystemstudio.github.io/) is a set of ready-made tools built on Java and Eclipse
(http://www.eclipse.org/ ) that allows users to get started with little or no programming required.
There are various logging, plotting, post-processing and alarm point tools. A fully-featured “drag
and drop” user interface editor (BOY) allows quite complex customized user interfaces to be
created with minimum development time. As an example, the following screenshot shows a
simple user interface created in the CS Studio BOY OPI editor. The M40 was assumed to be
controlling a high voltage power supply.
Figure 18. Example user screen created using CS Studio BOY.
1.2 Installing and Configuring IG2
The IG2 package is available to users of Pyramid products. It is supplied as a zip file which
should be de-compressed and the entire folder moved to the computer that will act as the server.
The server and the user interface computer can be the same machine. The loop controller, the
server and the user interface computer should be able to communicate with each other over your
network.
M40 User Manual
M40_UM_150226
Page 36 of 62
PSI System Controls and Diagnostics
In the folders you have saved, there is an xml files in the \service subdirectory that need to be
edited to customize your particular setup. IG2 looks for the file “system.xml” in the \service
subdirectory to establish the configuration of the system. You can locate system.xml elsewhere
than the default location, or give it a different name, in which case you need to specify the path
and file name by means of an argument in the command line that launches IG2.
The system file comprises a header section on the xml schema, which does not need to change.
Then comes a description of the user interface host computer, descriptions of the fiber optic loop
controller devices in your system and descriptions of the devices attached to loops. You don’t
have to describe every device and every input/output point that is present in your system, but only
the ones that you expose in the system file will be visible to EPICS.
The simplified example in figure 19 illustrates the xml schema. The analog inputs and outputs
are scaled to suit the application, and only those necessary are exposed. The A360 is supporting
the M40 as the only looped device.
The convention of “wires” for Pyramid device process variables, and the fixed names of those
wires for each supported product, are described in the document “ig2_scripting_v#.#.pdf”, where
#.# is the document revision number, included with each release. The document also describes
how you can scale the values, for example to convert voltages from general purpose I/O devices
to physical units relevant to the item they are controlling, and how you can set up monitoring
against tolerance bands.
The choice of a corresponding working name for each wire is up to the user; it is sensible to
choose something descriptive that is relevant to what you are measuring or controlling. We
nevertheless recommend a naming convention that makes it clear whether a value is a readback
or control (the prefixes c_ and r_ are used in the example), which particular device the value is
associated with, and a number or letter to indicate the channel for multichannel devices.
M40 User Manual
M40_UM_150226
Page 37 of 62
PSI System Controls and Diagnostics
Figure 19. Example xml system configuration file for IG2 / EPICS.
Once you have created and saved your system file, you can run the IG2 service executable. If the
server has a display, you will see a console window that shows the connection process and then
records subsequent control value changes sent to the M40. The names you declared will now be
recognized as process variables by any EPICS-compatible client program.
CAUTION
Don’t try to control the M40 simultaneously from an EPICS client and from a Diagnostic. The
results will be confusing. In particular, if you attempt to run the IG2 service and PTC
DiagnosticG2 on the same computer, the communications will conflict.
M40 User Manual
M40_UM_150226
Page 38 of 62
PSI System Controls and Diagnostics
12 Circuit overview
+5 V
Digital
inputs
Schmidt
trigger
+1.5 V
Reg
+3.3 V
Reg
+/-15 V
+24V Ext
DC-DC
DC-DC
+24V DC in
+5 VA
Digital
outputs
Line
driver
PCB
temp
sensor
Status
LEDs
Microcontroller
DGnd
TX
Fiber-optic
RX
Analog
inputs
FPGA
ADC
Buffer
Filter
Analog
outputs
DAC
Buffer/gain
Figure 20. M40 block schematic.
All input and output functions are handled through an FPGA. A PIC microcontroller handles
calibration , communications message handling and some ancillary I/O. Incoming 24 VDC
power is fused, clamped against overvoltage and heavily filtered. Isolation DC-DC converters
generate independent voltage rails for the internal analog and digital circuitry.
The eight identical analog inputs, with allowable range -10 to +10V, are inrush limited by 4.7k
resistors and buffered through a unity gain buffer.
M40 User Manual
M40_UM_150226
Page 39 of 62
-15V
4
PSI System Controls and Diagnostics
3
V-
4k7
2
1
V+
8
Input (1 of 8)
+15V
Figure 21. M40 analog input configuration (referenced to AGnd).
The signals then pass through a two-pole low-pass analog filter with a -3dB point at 10 kHz and
a gain of 0.50, before being delivered to the ADC.
Figure 22. M40 analog input filter response.
The multichannel ADC is fully bipolar, +/- 5V range with 16 bit resolution. All eight inputs are
sampled simultaneously at 250 kHz and accumulated in the averaging buffer of the FPGA. The
use of averaging (downsampling) increases the effective resolution of the M40 greatly. The
amount of averaging is under software control. The PIC microcontroller applies the calibration
to convert to floating point values in volts.
The eight identical analog outputs are generated by a 16-bit DAC, offset to give an analog value
centred on 0.0 V, and passed through an output stage with gain 2.01 to give a certain -10 to +10
V range. A 100 ohm series resistor in the feedback loop protects against external short circuits.
M40 User Manual
M40_UM_150226
Page 40 of 62
PSI System Controls and Diagnostics
100
-15V
2
8
4
1
3
V-
1
1
V+
8
7
2
Output (1 of 8)
100R
10K
2
+15V
10K
1
8
Figure 23. M40 analog output configuration.
The analog voltage outputs slew at around 0.6 V per microsecond when changing from one
setting to another. This rate of change may be too high for some devices controlled by the M40,
in which case the change should be delivered as a sequence of smaller steps.
Figure 24. M40 analog output slew rate for full scale step (20 V in 32 µsec).
The eight digital inputs are pulled up to +5 V via 47 kohm, and protected by 470 ohm series.
Schmitt triggers buffer and clean the inputs before they pass to the M40 digital processing.
M40 User Manual
M40_UM_150226
Page 41 of 62
PSI System Controls and Diagnostics
RN 47k
74LVC14A
Vcc 14
Gnd 7
2
4
6
8
10
12
Y1
Y2
Y3
Y4
Y5
Y6
A1
A2
A3
A4
A5
A6
+3.3V
1
3
5
9
11
13
RN 470R
74LVC14A
Inputs
Vcc 14
Gnd 7
2
4
6
8
10
12
Y1
Y2
Y3
Y4
Y5
Y6
A1
A2
A3
A4
A5
A6
+5VD
1
3
5
9
11
13
Figure 25. M40 digital input configuration.
The eight digital outputs are buffered and level shifted to TTL levels by a line driver, and the
signal passes out via a 100 ohm current limiting resistor.
RN 100R
74HCT540
A1
A2
A3
A4
A5
A6
A7
A8
Y1
Y2
Y3
Y4
Y5
Y6
Y7
Y8
/G1 Vdd
/G2 GND
Outputs
+5VD
Figure 26. M40 digital output configuration.
M40 User Manual
M40_UM_150226
Page 42 of 62
PSI System Controls and Diagnostics
13 Calibration
13.1 M40 Calibration Factors
Ideally the M40 would output and input perfectly accurate analog voltages. In practice small
circuit offsets and gain errors result in small inaccuracies. The M40 stores calibration factors
(“Permanent calibration”) that allow these to be compensated, increasing the absolute accuracy of
the device by an order of magnitude.
There is a gain and offset factor for each analog output, and a gain and offset factor for each
analog input. The values can be viewed on the setup tab in either version of Diagnostic host.
The factors are determined using high-precision test equipment and stored in the M40 internal
memory as part of the manufacturing process, or if the unit is returned for recalibration. The
parameters are reloaded whenever the M40 is powered up.
The permanent calibration factors are applied as follows:
Output:
Vout = Gain*(Vraw – Offset)
where Vout is the voltage sent out by the M40, and Vraw is the voltage that would be sent out if
there was no calibration.
Input:
Vread = Gain*Vin – Offset
where Vin is the actual input voltage and Vread is the displayed value.
Note that the input gains should all be around 3-4% greater than 1.000. This is by design, to
ensure that the full scale voltage of 10.00 V can be read without risk of ADC overrange.
13.2 Application Calibration Factors
Application calibration factors are provided to allow you to map the +/-10 V native range of the
M40 onto the output and readback of a power supply or similar device that it is controlling. The
temporary calibration is applied on top of the permanent calibration, when the “Use temporary
scaling” option is checked.
The simplest way to appreciate this function is to consider an example. Say we have a high
voltage power supply, designed by a rather confused engineer, that outputs -50 kV to +50 kV
linearly in response to a control input of 0 to +5 V. It has a linear readback of -10 V to +10 V
corresponding to - - 50 kV to +100 kV. We want to enter and read back values in kV on the M40
diagnostic, and we know that the permanent calibration is good so that the M40 outputs and
inputs are accurate in voltage. When we have selected the analog input and output pair we shall
use, we can enter “kV” in the units field so that the Data tab readings are labeled appropriately.
For the output,
Vout = Gain*(Vset + Offset),
so for the example, we put Gain = 0.05 and Offset = 50.
M40 User Manual
M40_UM_150226
Page 43 of 62
PSI System Controls and Diagnostics
For the input,
Vread = Gain*Vin – Offset,
so for the example, Gain = 6.25 and Offset = -12.5.
In practice you may be able measure the response of the power supply by independent means as a
function of the M40 output and input values with the temporary calibration disabled, to obtain
the necessary parameters.
Notice that this procedure is most intuitive when you can associate one M40 analog input and
output pair to setting and reading back one parameter, so that the physical units are common. For
example, analog output 3 could be calibrated as described to provide a command in kV, and
analog input 3 would be used to read back the corresponding monitor value also scaled in kV.
Then we might use analog input 4 to readback and scale a monitored current in mA, for example,
and analog input 5 to readback and scale a temperature in centigrade. The following figure
shows how this might look.
Figure 27. Using application scaling.
M40 User Manual
M40_UM_150226
Page 44 of 62
PSI System Controls and Diagnostics
14 Wavetable Output and Logging
The M40 is able to output tables of values on up to eight analog outputs simultaneously. While
these values are being put out, the device can log the eight inputs. Thus it can act as a
multichannel arbitrary waveform generator and data logger. If the output and sampling rate is
high, the output values and logged data reside in the M40 on-board memory to ensure contiguous
data, but this limits the size of the tables. At lower rates the tables can be managed by the host
system thus much larger files can be handled.
The wavetable facility will be added in a future firmware release.
M40 User Manual
M40_UM_150226
Page 45 of 62
PSI System Controls and Diagnostics
15 Connectors
15.1 Front panel connectors
15.1.1 Analog and digital I/O
Forty-four pin high-density Dsub female.
Pin 15
Pin 1
Pin 30
Pin 16
Pin 44
Pin 31
(External view on connector / solder side of mating plug)
1
2
3
4
5
6
7
8
9
10
11
12
13
14
15
Analog In 7
Analog In 5
Analog In 3
Analog In 1
Gnd
Gnd
Gnd
Gnd
Gnd
Gnd
Gnd
Analog Out 7
Analog Out 5
Analog Out 3
Analog Out 1
16
17
18
19
20
21
22
23
24
25
26
27
28
29
30
Analog In 8
Analog In 6
Analog In 4
Analog In 2
Digital In 2
Digital In 4
Digital In 6
Digital In 8
Digital Out 2
Digital Out 4
Digital Out 6
Analog Out 8
Analog Out 6
Analog Out 4
Analog Out 2
31
32
33
34
35
36
37
38
39
40
41
42
43
44
Shield
Power Supply Gnd
+24 VDC in/out fused
Digital In 1
Digital In 3
Digital In 5
Digital In 7
Digital Out 1
Digital Out 3
Digital Out 5
Digital Out 7
Digital Out 8
Gnd
+5 VDC out
CAUTION
Do not connect +24 V to any of the inputs or outputs.
CAUTION
M40 User Manual
M40_UM_150226
Page 46 of 62
PSI System Controls and Diagnostics
Digital inputs should not lie outside the range 0 to +5.5 V or damage may result.
Analog inputs should not lie outside the range +/- 15V or damage may result.
15.2 Rear panel connectors
15.2.1 Power input
2.1 mm threaded jack. To mate with Switchcraft S761K or equivalent
Center pin: +24VDC
Outer: 0V
15.2.2 Fiber-optic communications
ST bayonet. To mate with ST male terminated fiber optic cable. Recommended cable types 1
mm plastic (such as Avago HFBR-EUS-500) or 200 um silica (such as OCS BC03597-10 BL).
Signal: 650 nm light (red).
Transmit
Receive
(light grey) (dark grey)
Note: Most fiber optic ST connectors include a key tab which must align with the keyway in the
M40 connectors. Rotate the cable and centre of the mating connector until the key engages
before pushing the connector home and engaging the bayonet.
M40 User Manual
M40_UM_150226
Page 47 of 62
PSI System Controls and Diagnostics
16 Controls and Indicators
16.1 Front panel controls
None.
16.2 Rear panel controls
16.2.1 Address switch
16 position rotary switch setting device address. Choice of address is arbitrary, but each device
in a fiber-optic loop system must have a unique address.
Setting
0
1-F (decimal 1 to 15)
Function
(Reserved to loop controller)
Available address settings.
16.3 Front panel indicators
None.
16.4 Rear panel indicators
Quad green LED.
Device
Network
Activity
Power
16.4.1 Power
Green LED. On = input power is present; internal DC-DC converters are running.
16.4.2 Activity
Green LED. Green LED. Flashes when M40 has received new analog or digital output setting.
16.4.3 Network
Green LED. Flashes when M40 is processing messages on the fiber-optic channel.
16.4.4 Device
Green LED. Green LED. Flashing 5 Hz = M40 is initiated and acquiring data.
M40 User Manual
M40_UM_150226
Page 48 of 62
PSI System Controls and Diagnostics
16.5 Internal settings
We do not recommend that you open the M40 case unless specifically instructed to do so by your
supplier or Pyramid Technical Consultants, Inc. There are no user-serviceable parts inside. The
following information is provided for reference only.
Figure 28. Location of jumpers
16.5.1 JPR1 settings
Links
None
1
2
1&2
M40 User Manual
Function
Normal operation mode.
(Reserved)
(Reserved)
(Reserved)
M40_UM_150226
Page 49 of 62
PSI System Controls and Diagnostics
17 Software updates
The M40 has three embedded firmware releases.
Firmware
Function
FPGA (.pof file / .fhex file) General logic, loop message passthrough, ADC reading and
averaging
PIC Boot (.hex file)
Boot up, code upload
PIC Application (.hex file)
Main application; calibration, conversion to floating point values,
communication messaging.
The PIC microcontroller boot code should not require updating. It would require access to the
circuit board and dedicated programming tools to load new code. If the boot code ever does need
to be updated, your supplier will contact you and make arrangements either to return the unit for
upgrade, or to have an engineer perform the upgrade for you.
The FPGA and PIC microcontroller application code may be updated periodically to add new
operating features. New code releases will be provided by your supplier, or can be downloaded
from the Pyramid Technical Consultants, Inc. website. The fhex (for FPGA) and hex (for PIC
microcontroller) files can be loaded using the PSI Diagnostic host without any need to access the
unit. The uploads can be performed directly from the PC host.
17.1 FPGA firmware updates
To update the FPGA, click the “Select .fhex file” button under Upload FPGA on the Device tab,
and navigate to the relevant file. The code will then load. The process takes about 20 seconds.
M40 User Manual
M40_UM_150226
Page 50 of 62
PSI System Controls and Diagnostics
Figure 29. Selecting the fhex file to load.
When the upload is complete, you will get a prompt to power cycle the M40 in order to load the
new code.
Figure 30. Restart prompt after FPGA update.
If the FPGA upload fails for any reason such as loss of power during the upload, or data
corruption, then the M40 may not be able to communicate. In the unlikely circumstance that this
happens, it can be recovered using an FPGA programming tool and the .pof version of the FPGA
code. Contact your supplier or Pyramid Technical Consultants who will arrange for the unit to
be repaired.
17.2 PIC firmware updates
To update the PIC microcontroller, click the “Select .hex file” button on the Device tab and
navigate to the relevant file. The code will then load. The process takes about 30 seconds.
M40 User Manual
M40_UM_150226
Page 51 of 62
PSI System Controls and Diagnostics
Figure 31. Selecting the hex file to load.
Figure 32. Firmware upload in progress
M40 User Manual
M40_UM_150226
Page 52 of 62
PSI System Controls and Diagnostics
When the upload is complete, the M40 will reset itself and start running the new firmware. You
should see the new device version number displayed on the screen.
M40 User Manual
M40_UM_150226
Page 53 of 62
PSI System Controls and Diagnostics
18 Fault-finding
Symptom
Possible Cause
Incorrect analog input readings Cabling error
Confirmation
Solution
Check signals are connected to Use appropriate connection.
the correct pins.
Calibration incorrect or
corrupted
Check calibration values.
Unintentional or incorrect use
of the application calibration.
Check application calibration
values and whether “Use
temporary scaling” is checked.
Incorrect analog output values
Terminating impedance is too
low.
Disconnect load and remeasure.
Ensure load is within the
current compliance of the
analog outputs.
Outputs drop to zero
SAFEstate is enabled and
communication has been lost.
Check setting and state of
communications.
Check connections to
controller, status of controller.
Use appropriate SAFEstate
setting for the application.
High noise levels
Integration time too short for
signal being measured
Noise level reduces with
integration period.
Use an appropriate integration
time for the signal level.
Line voltage pickup
Noise level drops sharply if
Keep M40 and signal cables
integration period is 16.7 msec clear of unscreened high
(60 Hz) or 20 msec (50 Hz)
current mains voltage. Use
integration periods (N/line
frequency) if possible.
M40 User Manual
M40_UM_150226
Page 54 of 62
Re-enter correct values, or
contact supplier or Pyramid
Technical Consultants, Inc. if
no problem found.
PSI System Controls and Diagnostics
Averaging period does not
match the line frequency.
Check averaging period
setting.
Use integration periods (N/line
frequency) if possible.
Check setting.
Set averaging appropriate to
the required time resolution
and noise levels.
PSI Diagnostic filter has been
set.
Check setting.
Set filtering appropriate to the
required time resolution and
noise levels.
Digital input not registering
signal as expected
Incorrect electrical connection
to target device, typically lack
of appropriate ground path.
Check that unloaded output
changes as expected with a
loop back connector (all
outputs connected directly to
corresponding inputs).
Make correct electrical
arrangement.
Digital inputs operate with
incorrect polarity.
Input polarity setting is
incorrect for the application.
Check requirement and set
input polarities accordingly.
Use the correct digital input
settings.
Unable to set digital outputs as Incorrect electrical connection
expected
to target device, typically lack
of appropriate ground path.
Check that unloaded output
changes as expected with a
loop back connector or by
direct measurement.
Make correct electrical
configuration.
Data taking stops.
Selected number of triggers
has been reached.
Check trigger points setting.
Use the correct setting, or
click INF for continuous
acquisition.
Unable to communicate with
M40
Duplicate address setting
Check address against
expected address in host
software.
Use correct switch setting.
Switches can be changed
while the unit is operating.
Analog in signals respond very M40 averaging period has
slowly
been set very long.
Communication link timeout
M40 User Manual
M40_UM_150226
Investigate and fix
communications issue. Use a
longer timeout setting if
Page 55 of 62
PSI System Controls and Diagnostics
necessary.
RX and TX cables cross
connected somewhere in loop.
Network LED not lit.
Correct cabling as necessary.
Fiber optics are damaged
Inspect fibers, especially the
connectors. Check light can
be seen through fiber.
Exchange fibers and retry.
Fit new fibers or re-terminate
as necessary.
Unexpected changes in
parameters
Another host software
program is accessing the
device.
Check host programs running
on connected computers.
Run a single host program
only.
Communications interruptions
Other processes on PC host
interfering with comms ports.
M40 User Manual
M40_UM_150226
Use a dedicated PC with
simple configuration and
minimum number of processes
running.
Page 56 of 62
PSI System Controls and Diagnostics
19 Maintenance
The M40 does not require routine maintenance or calibration. There is risk of contamination
which may degrade performance if the case is opened. There are no user-serviceable parts inside.
The M40 is fitted with a 0.5 A automatically resetting positive temperature coefficient (PTC)
fuse in the 24 VDC input. No user intervention is required if the fuse operates due to
overcurrent. The fuse will reset when the overcurrent condition ends.
M40 User Manual
M40_UM_150226
Page 57 of 62
PSI System Controls and Diagnostics
20 Returns procedure
Damaged or faulty units cannot be returned unless a Returns Material Authorization (RMA)
number has been issued by Pyramid Technical Consultants, Inc. If you need to return a unit,
contact Pyramid Technical Consultants at [email protected], stating
- model
- serial number
- nature of fault
An RMA will be issued, including details of which service center to return the unit to.
M40 User Manual
M40_UM_150226
Page 58 of 62
PSI System Controls and Diagnostics
21 Support
Manual and software driver updates are available for download from the Pyramid Technical
Consultants website at www.ptcusa.com. Technical support is available by email from
[email protected]. Please provide the model number and serial number of your unit, plus
relevant details of your application.
M40 User Manual
M40_UM_150226
Page 59 of 62
PSI System Controls and Diagnostics
22 Disposal
We hope that the M40 gives you long and reliable service. The M40 is manufactured to be
compliance with the European Union RoHS Directive 2002/95/EC, and as such should not
present any health hazard. Nevertheless, when your device has reached the end of its working
life, you must dispose of it in accordance with local regulations in force. If you are disposing of
the product in the European Union, this includes compliance with the Waste Electrical and
Electronic Equipment Directive (WEEE) 2002/96/EC. Please contact Pyramid Technical
Consultants, Inc. for instructions when you wish to dispose of the device.
M40 User Manual
M40_UM_150226
Page 60 of 62
PSI System Controls and Diagnostics
23 Declaration of Conformity
M40 User Manual
M40_UM_150226
Page 61 of 62
PSI System Controls and Diagnostics
24 Revision History
The release date of a Pyramid Technical Consultants, Inc. user manual can be determined from
the document file name, where it is encoded yymmdd. For example, M10_UM_080105 would
be a M10 manual released on 5 January 2008.
Version
Changes
M40_UM_120621
First general release
M40_UM_120703
Added information about data buffer save options introduced in PSI
Diagnostic version 4.114.
M40_UM_120907
Correction to analog output circuitry.
M40_UM_141212
Update specification table.
Add section on EPICS interfacing via IG2.
M40_UM_150226
M40 User Manual
Update specification table.
M40_UM_150226
Page 62 of 62