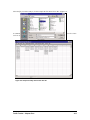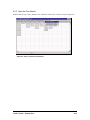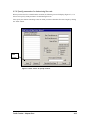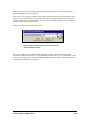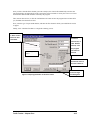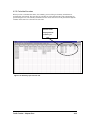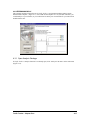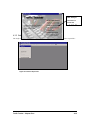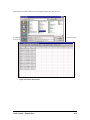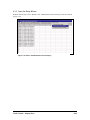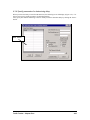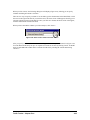
1
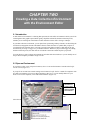
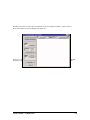
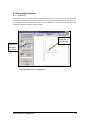
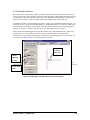
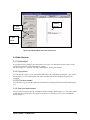
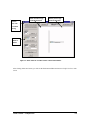
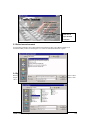
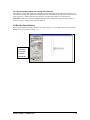
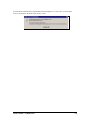
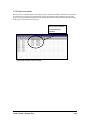
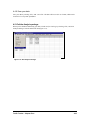
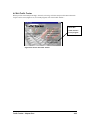
Development of Video-Based
and
Other Automated
Traffic Data Collection Methods
Traffic Tracker Manual
FINAL REPORT
FEBRUARY 2004
Budget Number KLK203
N04-02
Prepared for
OFFICE OF UNIVERSITY RESEARCH AND EDUCATION
U.S. DEPARTMENT OF TRANSPORTATION
Prepared by
National Institute for Advanced Transportation Technology
University of Idaho
Michael Kyte
Melissa Lines
User Manual
Program Version 3.0, April 2003
At the University of Idaho
Table of Contents
Chapter One: Getting Started with Traffic Tracker
1.1 Overview of Traffic Tracker
1.2 System Requirements for Using Traffic Tracker
1.3 Installing Traffic Tracker
1.4 Accessing Traffic Tracker’s Function
1.5 Getting Help with Traffic Tracker
1.6 Using this Manual
1-1
1-1
1-2
1-2
1-3
1-4
Chapter Two: Creating a Data Collection Environment with the
Environment Editor
2.1 Introduction
2.2 Open an Environment
2.3 Place Graphic Elements
2.3.1 Add lines
2.3.2 Add data collectors
2-2
2-2
2-5
2-5
2-6
2.3.3 Add text
2.4 Other Features
2.4.1 Delete object
2.4.2 Copy picture
2.4.3 Print environment
2.4.4 Save your environment
2-7
2-7
2-7
2-7
2-8
2-8
Chapter Three: Collecting Traffic Data with the Data Collector
3.1 Introduction
3.2 Open Data Collector
3.3 Select an Environment
3.4 Specify Where to Save the Data
3.5 Using the Data Collector Screen
3.6 Exit the Data Collector
3-2
3-2
3-3
3-4
3-5
3-7
Chapter Four: Analyzing your Data with the Analysis Package
4.1 Introduction
4.2 Determining Flow Rate
4.2.1 Open Analysis Package
4.2.2 Select the file to analyze
4.2.3 Open the Flow Wizard
4.2.4 Specify parameters for determining flow rate
4.2.5 Calculate flow rate
4.2.6 Save your data
4.3 Determining Delay
4.3.1 Open Analysis Package
4.3.2 Select the file to analyze
4.3.3 Open the Delay Wizard
4.3.4 Specify parameters for determining delay
4.3.5 Calculating delay
4.3.6 Save your data
4-2
4-3
4-3
4-4
4-6
4-7
4-10
4-10
4-11
4-11
4-12
4-14
4-15
4-18
4-18
4.4 Determining Vehicle Speeds
4.4.1 Open Analysis Package
4.4.2 Select the file to analyze
4.4.3 Open the Speed Wizard
4.4.4 Specify parameters for determining speed
4.4.5 Determine speeds
4.4.6 Save your data
4.5 Exit the Analysis Package
4.7 Exit Traffic Tracker
4-19
4-19
4-20
4-22
4-23
4-26
4-27
4-27
4-28
CHAPTER ONE
Getting Started with
Traffic Tracker
CONTENTS
1.1 Overview of Traffic Tracker ................................................................................................. 1-1
1.2 system requirements for using Traffic Tracker................................................................. 1-1
1.3 Installing Traffic Tracker...................................................................................................... 1-1
1.4 Accessing Traffic Tracker’s Functions .............................................................................. 1-2
1.5 GETTING HELP WITH TRAFFIC TRACKER....................................................................... 1-3
1.6 Using this Manual................................................................................................................. 1-4
CHAPTER ONE
Getting Started with
Traffic Tracker
1.1 Overview of Traffic Tracker
Traffic Tracker is a software program that enables you to collect and analyze time-based traffic flow data.
The program allows you to design a data collection screen that is a graphical representation of the location
where you are collecting data. During the data collection process, you press a number or letter key (called a
trigger) on the keyboard each time a particular traffic event occurs. Each time you press a trigger key, the
current time is recorded in a data file. The key that you pressed is also recorded in the data file, so that you
can distinguish between separate events. Once you have collected data using Traffic Tracker, you can
analyze the data in a variety of ways.
Traffic Tracker consists of three components. You design data collection screens (called Environments) in
the Environment Editor. You use these screens to collect data using the Data Collector. You then analyze
the data using the Analysis Package.
1.2 system requirements for using Traffic Tracker
Software: Your computer must have one of the following operating systems installed: Windows 98,
Windows NT, Windows 2000, Windows ME, or Windows XP.
Traffic Tracker will perform a wide range of basic analysis functions on your traffic flow data. If you want
to perform further analysis, you will need to have a spreadsheet such as Excel or Access installed.
Hardware: Your computer must be equipped with a minimum 200 MHz processor and 32 Mb of ram.
1.3 Installing Traffic Tracker
The Traffic Tracker Installation CD contains five files:
•
Setup.exe
•
SETUP.LST
•
Traffic Tracker.CAB
Traffic Tracker – Chapter One
1-1
•
Traffic Tracker User Manual
•
ReadMe
To begin the installation process, double-click on Setup.exe. You will enter the standard Windows
installation program. Follow the clear and simple instructions to install Traffic Tracker. When installation
is complete, you will see the following screen (Figure 1.1). Click “OK.” Traffic Tracker will now appear
in your START menu.
Figure 1.1 Traffic Tracker was installed successfully
on your computer. Click OK.
1.4 Accessing Traffic Tracker’s Functions
When you click Traffic Tracker on the START menu, the main Traffic Tracker screen will display (Figure
1.2). All of Traffic Tracker’s functions are accessed from this screen. You must exit one function and
return to this screen in order to enter another function.
The first link, “About Traffic Tracker,” provides basic information about the program and its history. The
second link, “Traffic Tracker Help,” accesses the program’s online help system. The next four links,
“Create an Environment,” “Edit an Environment,” “Collect Data,” and “Analyze Your Data,” allow you to
access each of the program’s functions.
Traffic Tracker – Chapter One
1-2
Figure 1.2. Traffic Tracker's main screen.
1.5 GETTING HELP WITH TRAFFIC TRACKER
There are two ways to get help in using Traffic Tracker:
1.
User Manual. This manual illustrates how to use Traffic Tracker by providing step-by-step
instructions for collecting and summarizing three kinds of traffic data:
•
Flow rates
•
Delays
•
Speeds
2. Online Help. The Traffic Tracker online help system is available from within the program
(select Help from the main menu or from within each program function screen). Traffic Tracker’s
online help system provides an in-depth look at each of the program’s functions and features as
well as answers to specific questions.
If, after reading the manual and using the online help system, you still have problems with the program,
contact NIATT at the University of Idaho: [email protected] or 208/885-0576.
Traffic Tracker – Chapter One
1-3
1.6 Using this Manual
Chapter 1 introduces Traffic Tracker. It provides an overview of the program, lists the system requirements
for using the program, describes how to install the Traffic Tracker software and access Traffic Tracker’s
functions, and explains how to get help for using the program.
Chapter 2 describes how to use the program’s Environment Editor.
Chapter 3 describes how to use the program’s Data Collector.
Chapter 4 describes how to use the program’s Analysis Package.
Traffic Tracker – Chapter One
1-4
CHAPTER TWO
Creating a Data Collection Environment
with the Environment Editor
Contents
2.1 INTRODUCTION ..................................................................................................................... 2-1
2.2 OPEN AN ENVIRONMENT ....................................................................................................... 2-1
2.3 PLACE GRAPHIC ELEMENTS ................................................................................................... 2-3
2.3.1. Add lines................................................................................................................... 2-3
2.3.2 Add data collectors................................................................................................... 2-3
2.3.2 Add data collectors................................................................................................... 2-4
2.3.3 Add text...................................................................................................................... 2-4
2.4 OTHER FEATURES ................................................................................................................ 2-5
2.4.1 Delete object.............................................................................................................. 2-5
2.4.2 Copy picture .............................................................................................................. 2-5
2.4.32 Print environment ................................................................................................... 2-5
2.4.4 Save your environment ............................................................................................ 2-5
CHAPTER TWO
Creating a Data Collection Environment
with the Environment Editor
2.1 Introduction
A data collection environment is a drawing that represents the real traffic environment in which you will be
collecting data. This graphic representation greatly simplifies and clarifies the data collection process,
whether you are working out in the field in a traffic situation or in the office viewing a videotape.
In your data collection environment, you can place lines representing roadway elements, text describing the
environment, and graphic elements called data collectors. Data collectors are symbols that you place in
your drawing in the locations where you want to record events. When you place a data collector in your
environment, you assign a “trigger” key to that data collector. Whenever you press that trigger key during
the data collection process, the data collector records the current time and the key that you pressed.
You can choose to create a unique environment for each data collection situation, or you can modify one of
the pre-drawn templates provided in Traffic Tracker.
2.2 Open an Environment
If you want to create a new, unique environment, select “Create an Environment” from the main Traffic
Tracker screen (Figure 2.1).
If you prefer to not start from scratch creating an environment, Traffic Tracker contains five templates with
pre-drawn environments. You can use these templates as they are, or you can modify them to fit your
needs. To access the templates, click “Edit an Environment” (Figure 2.1).
Click here to
create a new
Click here to
edit an existing
environment.
Figure 2.1. Select "Create an Environment” or “Edit an Environment.”
Select the template you wish to use, and click “Open” (Figure 2.2).
Traffic Tracker – Chapter One
1-1
Whether you choose to create a new environment or edit an existing environment, Traffic Tracker’s
Environment Editor screen will display next (Figure 2.3).
Figure 2.3. Use this screen to create or edit an environment.
Once you’ve opened a new or existing environment, use the Environment Editor to move or place graphic
elements in your environment. The following paragraphs describe how to use the tools on this screen.
Traffic Tracker – Chapter One
1-2
2.3 Place graphic elements
2.3.1. Add lines
To add lines to the environment, click the “Add Lines” button (Figure 2.4) and point to the starting position
for your line. Holding the button down, drag the mouse to the desired end point and release the button. The
line will appear on the environment. Once you’ve clicked “Add Lines,” you can draw multiple lines on the
environment without clicking the button each time.
Click, hold, &
drag mouse to
Click here to
add lines to
the environ-
Figure 2.4. Add lines to the environment.
Traffic Tracker – Chapter One
1-3
2.3.2 Add data collectors
Data collectors are symbols that you add to your data collection environment in the locations where you
want to record events. They respond to specific keys pressed by the user during data collection, and record
in a data file the current time and the key that was pressed. Each data collector displays a running total
onscreen of the number of events recorded at that location during the data collection process.
To add data collectors to the environment, first enter a “trigger” key in the blank field shown (Figure 2.5).
The trigger is the key on the keyboard that identifies a specific data collector. It is also the key that causes
the data collector to add entries to the data file. Each data collector can have only one unique trigger key.
Triggers can be letters or numbers, they can only be one digit, and they are case-sensitive.
After you have entered the trigger for the first data collector, click “Add a Data Collector,” point to the
location where you want to place the collector, and click. The data collector will appear on the
environment. It is a good idea to add descriptive text labels to your data collectors (see next section). You
may add as many data collectors to your environment as you wish.
3. Click to
place data
1. Enter
trigger key
for2.3.3
data
Add text
To add text to the environment, first type the text in the blank field labeled “Text to Add” (Figure 2.6).
Then click “Add Text,” point to the location where you want to place the text, and click again. The text will
appear“Add
on the environment.
2. Click
a Data
Figure 2.5. Add triggers and data collectors to the environment.
Traffic Tracker – Chapter One
1-4
3. Click to
place text
2. Click
Add Text
1. Type
text in
Figure 2.6. Add descriptive text to the environment.
2.4 Other Features
2.4.1 Delete object
If you want to move or change a line, data collector, or text box, you must delete it and re-enter it on the
environment. To do this, click “Delete Object,” point to
the object (Figure 2.7), and click. The object will disappear. Then re-place the item.
2.4.2 Copy picture
You can generate a picture of your environment and send it to the Clipboard by clicking the “Copy Picture”
button (Figure 2.7). You can then paste your picture into MS Word or other programs using the paste
command.
2.4.32 Print environment
You can print a copy of your data collection environment by clicking the Print Environment button (Figure
2.7).
2.4.4 Save your environment
To save your environment, click the “Exit Editor and Save Changes” button (Figure 2.7). You will be asked
to name this environment before the program saves the file. To discard your work, click “Exit Without
Saving Changes.”
Traffic Tracker – Chapter One
1-5
Click to
Click to make a copy
Click to print a copy
of the environment
of the environment
exit, with
or without
saving
Click to
delete
Figure 2.7. Other features of Traffic Tracker’s Environment Editor.
After clicking either Save button, you will exit the Environment Editor and return to Traffic Tracker’s main
screen.
Traffic Tracker – Chapter One
1-6
CHAPTER THREE
Collecting Traffic Data with
CONTENTS
the Data Collector
3.1 INTRODUCTION ..................................................................................................................... 3-1
3.2 OPEN DATA COLLECTOR ...................................................................................................... 3-1
3.3 SELECT AN ENVIRONMENT..................................................................................................... 3-2
3.4 SPECIFY WHERE TO SAVE THE DATA ...................................................................................... 3-2
3.5 USING THE DATA COLLECTOR SCREEN .................................................................................. 3-3
3.6 EXIT THE DATA COLLECTOR ................................................................................................. 3-5
CHAPTER THREE
Collecting Traffic Data with
the Data Collector
3.1 Introduction
Once you have set up your data collection environment, you are ready to begin data collection. When an
event occurs, such as a car leaving the stop bar at an intersection, press the appropriate trigger key on the
keyboard and the time that the event occurred will be recorded in a data file. The key that you pressed will
also be recorded, so you can keep track of multiple types of events. Each data collector will display a
running total onscreen of the number of events that have been recorded at that location.
3.2 Open Data Collector
To open Traffic Tracker’s data collection function, click “Collect Data” on the program’s main screen
(Figure 3.1).
Traffic Tracker – Chapter One
1-1
Click here to
open the data
Figure 3. 1. Click "Collect Data."
collection
3.3 Select an environment
You will first be asked to select a data collection environment, either a pre-drawn template or an
environment that you have created (Figure 3.2). Select an environment and click “Open.”
Figure 3.2. Select a data collection environment.
3.4 Specify where to save the data
When you click “Open,” you will be asked where you want to save the traffic data you are about to collect
(Figure 3.3). The default location is the Templates folder, but you can specify any folder you desire. Click
“Save.”
Figure 3.3. Specify where you want to save your data.
Traffic Tracker – Chapter One
1-2
3.5 using the Data Collector screen
When you click “Save,” Traffic Tracker’s Data Collector screen will open, displaying the environment that
you selected (Figure 3.4).
Before you begin data collection, first designate a start time in the “Start Time” field. Using the hh:mm:ss
format (hours, minutes, seconds), enter the current time or any other time, and the data will be referenced to
the time that you provide. For example, if you are collecting data from a videotape, you might want to enter
the start time of the videotape so the data will be properly referenced. For this example, we have entered a
start time of 1:23 pm. Be sure to enter the time using a 24 hour clock (midnight is shown as 0000, 6am
shown as 0600, noon shown as 1200, 6pm shown as 1800).
You are now ready to begin data collection. Click the Start/Pause button to begin data collection and click
again to pause collection. The timer will begin counting when you click Start/Pause and stop when you
click the button a second time. (Hint: If you are collecting data from a videotape, be sure to pause the
videotape every time you pause the data collector.)
Timer
1. Enter
start time
Record events as they occur by pressing the trigger keys that correspond to the data collectors within your
environment. Each time you press a trigger key, the current time is stored in the data file along with the
2.
Clickkey
to that was pressed. You will not be able to view the data file as it is being compiled, but the data
trigger
collectors
start or will display the number of events that have been recorded up to that point (Figure 3.5).
pause the
Figure 3.4. You must enter a start time before beginning data
collection.
Data collectors
display the number
of events recorded
th
f
3.5.1 Recording events without data collectors
There will undoubtedly be times when you notice a new parameter to measure after you are already in the
field collecting data. A handy feature of Traffic Tracker is that pressing any number or letter key will
cause the current time to be recorded in the data file, regardless of whether or not a data collector exists.
So, if you want to start tracking a new parameter, simply make a note of the new event and the trigger that
you select, and press the trigger key whenever the new event occurs. The event will be recorded, but you
Press
corresponding trigger key each time an event occurs.
just won’t beFigure
able to 3.5.
see it
onscreen.
Traffic Tracker – Chapter One
1-3
For example, suppose you decide at the last minute that you want to record the number of large trucks that
are turning right. You might decide to use the letter “T” as your trigger and press “T” whenever a large
truck turns right.
Traffic Tracker – Chapter One
1-4
3.5.2 Synchronizing multiple users during data collection
There may be a project that requires more than one person to participate in the data collection process. For
this situation, develop data collection environments for each user and make sure that each environment uses
unique trigger keys. Set the start time for each user to the same time and have everyone press the
Start/Pause button at the same time. Multiple data files can be merged into one file in Traffic Tracker’s
Analysis Package, making it easy to analyze them all.
3.6 Exit the Data Collector
When you are finished with data collection, click “Exit” (Figure 3.6). Your data will be saved in a commadelimited text file, with the extension “.csv.”
Click “Exit”
to end data
Figure 3.6. When you click exit, your data will be saved.
collection
and exit the
Traffic Tracker – Chapter One
1-5
You will then be notified where your data has been stored (Figure 3.7). Click “OK” to exit the Data
Collector and return to the main Traffic Tracker screen.
Figure 3.7. This screen notifies you where your data have been
stored.
Traffic Tracker – Chapter One
1-6
CHAPTER FOUR
Analyzing your Data with
the Analysis Package
CONTENTS
4.1
INTRODUCTION…………………………………………………………………………
…………..4-8
4.2 DETERMINING FLOW
RATE………………………………………………………………………….4-9
4.2.1 Open Analysis Package .......................................................................................... 4-9
4.2.2 Select the file to analyze ....................................................................................... 4-10
4.2.3 Open the Flow Wizard ........................................................................................... 4-12
4.2.4 Specify parameters for determining flow rate ..................................................... 4-13
4.2.5 Calculate flow rates ................................................................................................ 4-15
4.2.5 Calculate flow rates ................................................................................................ 4-16
4.2.6 Save your data ........................................................................................................ 4-16
4.3 DETERMINING
DELAY…………………………………………………..…………………...4-11
4.3.1 Open Analysis Package ........................................................................................ 4-17
4.3.2 Select the file to analyze ....................................................................................... 4-18
4.3.3 Open the Delay Wizard.......................................................................................... 4-20
4.3.4 Specify parameters for determining delay........................................................... 4-21
4.3.5 Calculate delay........................................................................................................ 4-24
4.3.6 Save your data ........................................................................................................ 4-24
4.4 DETERMINING VEHICLE
SPEEDS…………………………………………………………….…….4-25
4.4.1 Open Analysis Package ........................................................................................ 4-25
4.4.2 Select the file to analyze ....................................................................................... 4-26
4.4.3 OPEN THE SPEED
WIZARD………………………………………………………………..……4-28
4.4.4 SPECIFY PARAMETERS FOR DETERMINING
SPEED…………………………………………….4-29
4.4.5 Determine speeds ................................................................................................... 4-32
4.4.6 Save your data ........................................................................................................ 4-33
4.5. EXIT THE ANALYSIS
PACKAGE…………………………………………………………………..4-33
4.6 EXIT TRAFFIC
TRACKER………………………………………………………………………….4-34
Traffic Tracker – Chapter Four
4-7
CHAPTER FOUR
Analyzing your Data with
the Analysis Package
4.1 Introduction
Once you have collected event data, you can use Traffic Tracker’s Analysis Package to extract and analyze
the values that interest you. The Analysis Package allows you to analyze data in a variety of ways, but the
program also features three mini-wizards that greatly simplify the determination of flow rate, delay, and
speeds.
This chapter will describe how to use these mini-wizards in the context of three example intersections. Turn
to the following sections of this chapter for specific instructions on using each of the mini-wizards:
Section 4.2 – Determining Flow Rates
Section 4.3 – Determining Delays
Section 4.4 – Determining Vehicle Speeds
For more detailed instructions on the Analysis Package’s additional features and tools, select “Help” from
the menu bar in the Analysis Package.
Traffic Tracker – Chapter Four
4-8
4.2 determining flow rate
This example uses data that was collected in one of Traffic Tracker’s environment templates named
“Simple Four-Way Intersection” (Figure 4.1). You could use this template as is for your data collection,
you could modify it to your situation, or you could create an entirely new environment for your intersection
modeled on this one.
4.2.1 Open Analysis Package
Begin by opening Traffic Tracker’s analysis function. Click “Analyze Your Data” on the main menu
(Figure 4.2).
Figure 4.1. Simple Four-Way Intersection data collection environment template.
Traffic Tracker – Chapter Four
4-9
Click “Analyze
Your Data” to
access the
l
i f
ti
4.2.2 Select the file to analyze
The Traffic Tracker Analysis Package screen will display (Figure 4.3). Under “File,” select “Open File.”
Figure 4.2. Click "Analyze Your Data."
Figure 4.3. Select "Open File."
Traffic Tracker – Chapter Four
4-10
Select the file you wish to analyze, for this example the file named “flow data” (Figure 4.4).
Figure 4.4. Select the file to analyze.
A comma-delimited text file will open, displaying the data you have collected using Traffic Tracker’s Data
Collector (Figure 4.5).
Figure 4.5. Simple Four-Way Intersection data file.
Traffic Tracker – Chapter Four
4-11
4.2.3 Open the Flow Wizard
With the data file open, select “Wizards” and ” Find Interval Flow Rate” from the menu bar (Figure 4.6).
Figure 4.6. Select "Find Interval Flow Rate."
Traffic Tracker – Chapter Four
4-12
4.2.4 Specify parameters for determining flow rate
When you select the Flow wizard from the menu bar, the following screen will display (Figure 4.7). Use
this screen to specify all the parameters for determining flow rate.
First, specify the columns containing events for which you want to determine flow rates. Begin by clicking
the “Insert” button.
Click
“Insert ”
Figure 4.7. Click “Insert” to specify columns.
Traffic Tracker – Chapter Four
4-13
When you click “Insert,” the following dialog box will display (Figure 4. 8), allowing you to specify a
column containing a movement event time.
There are two ways to specify a column. You can either type the column name in the blank field, or click
the arrow to the right of the field. If you click the arrow, the insert screen will disappear, allowing you to
select the column of interest in the data file. Once you click on a column, the insert screen will reappear,
with the column name entered in the field.
When you have entered the column, click “Insert.”
Figure 4.8.Type in column name or click arrow to select
column and enter its name.
After you click Insert, the Flow Rates wizard will reappear with the column’s name inserted in the
Movements of Interest list (Figure 4.9). You can determine the flow rates for up to 12 separate movements
at one time by clicking “Insert” to select and add each additional column. Delete a column from the list by
selecting the column and clicking “Remove.”
Traffic Tracker – Chapter Four
4-14
Once you have selected all the columns you want to analyze, the wizard will automatically enter the start
time and end time, encompassing all of the events in the selected columns. You may also enter a set of start
and end times different than the times selected by the program.
Then, enter an interval size, or click the “Default Interval” button to have the program insert an interval for
you, and then select the Interval Units.
Next, select the type of report under Results, and enter the first column in which you would like the results
to appear.
Finally, click “Calculate Flow Rates” to begin the summary process.
1. Enter column
names for flow
2. Enter an
calculation.
interval size, or
click “Default
Interval,” and
the program
will select an
3. Select type of
report.
interval.
4. Enter the name of
the first column for
5. Click to begin
Figure 4.9. Specify parameters for the flow routine.
Traffic Tracker – Chapter Four
calculating flow
4-15
4.2.5 Calculate flow rates
When you click “Calculate Flow Rates,” the summary process will begin. Summary calculations are
performed for each interval. The start time for each interval will be placed in the results column that you
specified (Figure 4.10). The summary information for the various flow rates will be placed in the adjacent
columns on the same row as the interval’s start time.
Results will be
displayed in the
columns you
ifi d
4.2.6 Save your data
Save your data by selecting “File,” and “Save File.” The data will be saved in .csv format, which can be
read in Excel or any other spreadsheet.
Figure 4.10. Summary report for flow rate.
Traffic Tracker – Chapter Four
4-16
4.3 DETERMINING DELAY
This example uses data collected in one of Traffic Tracker’s environment templates named “Queue
Measurement Template” (Figure 4.11). You could use this template as is for your data collection, you
could modify it to your situation, or you could create an entirely new environment for your intersection
modeled on this one.
Figure 4.11. Queue Measurement data collection environment template.
4.3.1 Open Analysis Package
If Traffic Tracker’s analysis function is not already open, click “Analyze Your Data” on the main menu
(Figure 4.12).
Traffic Tracker – Chapter Four
4-17
Click “Analyze
Your Data” to
access the
l
i f
ti
Figure 4.12. Click "Analyze Your Data."
4.3.2 Select the file to analyze
The Traffic Tracker Analysis Package screen will display (Figure 4.13). Under “File,” select “Open File.”
Figure 4.13. Select "Open File."
Traffic Tracker – Chapter Four
4-18
Select the file you wish to analyze, for this example “queue data” (Figure 4.14).
A comma-delimited text file will open, displaying the data you have collected using Traffic Tracker’s Data
Collector (Figure 4.15).
Figure 4.14. Select the file to analyze.
Figure 4.15. Queue data text file.
Traffic Tracker – Chapter Four
4-19
4.3.3 Open the Delay Wizard
With the data file open, select “Wizards” and ” Find/Summarize Interval Delays” from the menu bar
(Figure 4.16).
Figure 4.16. Select “Find/Summarize Interval Delays.”
Traffic Tracker – Chapter Four
4-20
4.3.4 Specify parameters for determining delay
When you select the Delay wizard from the menu bar, the following screen will display (Figure 4.17). Use
this screen to specify all the parameters for determining delay.
First, specify the columns containing events for which you want to determine delay by clicking the “Insert”
button.
Click “Insert.”
Figure 4.17. Click "Insert" to select events.
Traffic Tracker – Chapter Four
4-21
When you click “Insert,” the following dialog box will display (Figure 4.18), allowing you to specify
columns containing movement event times.
There are two ways to specify a column. You can either type the column name in the blank field, or click
the arrow to the right of the field. If you click the arrow, the insert screen will disappear, allowing you to
select the column of interest in the data file. Once you click on a column, the insert screen will reappear,
with the column name entered in the field.
When you have entered the columns you wish to analyze, click “Insert.”
Figure 4.18. Enter column names and click “Insert.”
After you specify a column, the column’s name will appear in the Delay Data Columns list (Figure 4.19).
You can determine the delay for up to 12 separate movements at one time by clicking “Insert” to add the
name of each additional column. Delete a column from the list by selecting the column and clicking
“Remove.”
Traffic Tracker – Chapter Four
4-22
Once you have selected all the columns you want to analyze, the wizard will automatically enter the start
time and end time, encompassing all of the events in the selected columns. You may also enter a set of start
and end times different than the times selected by the program.
Then, enter an interval, or click the “Default Interval” button to have the program insert an interval for you,
and select the Interval Units.
Next, select the type of report under “Results,” and enter the first column in which you would like the
results to appear.
Finally, click “Calculate Delays” to begin the summary process.
2. Enter an
1. Select
interval size, or
column names
click “Default
for delay
Interval,” and
3. Select type
report.
2. Select of
type
of
report and interval
units
the program
will select an
interval.
4. Enter the name of
the first column for
5. Click to
begin
Figure 4.19. Specify parameters for the Delay routine.
Traffic Tracker – Chapter Four
calculating
4-23
4.3.5 Calculate delay
When you click “Calculate Delays,” the summary process will begin. Summary calculations are performed
for each interval. The start time for each interval will be placed in the results column that you specified
(Figure 4.20). The summary information for the various delays will be placed in the adjacent columns on
the same row as the interval’s start time.
Results will be
displayed in the
columns you specified.
4.3.6 Save your data
Save your data by selecting “File,” and “Save File.” The data will be saved in .csv format, which can be
read in Excel or any other spreadsheet.
Figure 4.20. Summary report for delay.
Traffic Tracker – Chapter Four
4-24
4.4 determining vehicle speeds
This example uses data collected in one of Traffic Tracker’s environment templates named “Speed
Measurement Template” (Figure 4.21). You could use this template as is for your data collection, you
could modify it to your situation, or you could create an entirely new environment for your intersection
modeled on this one.
Figure 4.21. Speed Measurement template.
4.4.1 Open Analysis Package
If Traffic Tracker’s analysis function is not already open, click “Analyze Your Data” on the main menu
(Figure 4.22).
Traffic Tracker – Chapter Four
4-25
Click “Analyze
Your Data” to
access the
l
i f
ti
4.4.2 Select the file to analyze
The Traffic Tracker Analysis Package screen will display (Figure 4.23). Under “File,” select “Open File.”
Figure 4.22. Click "Analyze Your Data."
Figure 4.23. Select "Open File."
Select the file you wish to analyze, for this example “speed data.csv” (Figure 4.24).
A comma-delimited text file will open, displaying the data you have collected using Traffic Tracker’s Data
Collector (Figure 4.25).
Figure 4.24. Select the file to analyze.
Traffic Tracker – Chapter Four
Figure 4.25. Speed data file.
4-26
Traffic Tracker – Chapter Four
4-27
4.4.3 OPEN THE SPEED WIZARD
With the data file open, select “Find/Summarize Interval Speeds” from the menu bar (Figure 4.26).
Figure 4.26. Select “Find/Summarize Interval Speeds.”
Traffic Tracker – Chapter Four
4-28
4.4.4 SPECIFY PARAMETERS FOR DETERMINING SPEED
When you select the Speed wizard from the menu bar, the following screen will display (Figure 4.27). Use
this screen to specify all the parameters for the routine. First, select the columns containing events for
which you want to determine speed by clicking the “Insert” button.
Click
“Insert.”
Figure 4.27. Click “Insert” to select events.
Traffic Tracker – Chapter Four
4-29
When you click “Insert,” the following dialog box will display (Figure 4.28), allowing you to specify
columns containing entrance and exit events for a particular speed trap, plus the length of the speed trap,
including the foot, ( ‘ ) mark.
There are two ways to specify a column. You can either type the column name in the blank field, or click
the arrow to the right of the field. If you click the arrow, the insert screen will disappear, allowing you to
select the column of interest in the data file. Once you click on a column, the insert screen will reappear,
with the column name entered in the field.
When you have entered the columns you wish to analyze and the length of the speed trap, click “Insert.”
After you specify a column, the column’s name will appear in the Speed Data Columns list (Figure 4.29).
Figure
columns
and
length
of clicking
speed trap.
You can find the speeds
for4.28.
up toSpecify
12 separate
traps at
one
time by
“Insert” to add the name of each
additional column. Delete a column from the list by selecting the trap’s entrance or exit column and
clicking “Remove.”
Traffic Tracker – Chapter Four
4-30
Once you have selected all the columns you want to analyze, the wizard will automatically enter the start
time and end time, encompassing all of the events in the selected columns. You may also enter a set of start
and end times different than the times selected by the program.
Next, enter an interval, or click the “Default Interval” button to have the program insert an interval for you,
and select Interval Units.
Then, select the type of report you want under “Results,” and the units of the results.
Then specify the length units for the speed traps, and enter the first column in which you would like the
results to appear.
Finally, click “Calculate Speeds” to begin the summary process.
2. Enter an
1. Enter
interval size, or
column
click “Default
names for
speed
calculation
2. Select type of
report and
3.
Select
type of
interval
units.
report, and units
of results.
Interval,” and
the program
will select an
interval.
5. Enter the
4. Enter
name of the first
unit length
column for
for speed
t
6. Click to
begin
Figure 4.29. Enter parameters for the Speeds routine.
calculating
d
Traffic Tracker – Chapter Four
4-31
4.4.5 Determine speeds
When you click “Calculate Speeds,” the summary process will begin. Summary calculations are performed
for each interval. The start time for each interval will be placed in the results column that you specified
(Figure 4.30). The summary information for the various speed traps will be placed in the adjacent columns
on the same row as the interval’s start time.
Results will be displayed
in the columns you
specified.
Figure 4.30. Summary report for speed.
Traffic Tracker – Chapter Four
4-32
4.4.6 Save your data
Save your data by selecting “File,” and “Save File.” The data will be saved in .csv format, which can be
read in Excel or any other spreadsheet.
4.5. Exit the Analysis package
When you are finished summarizing your data, exit the Analysis Package by selecting “File,” and “Exit
Analysis Package” from the main menu bar (Figure 4.31).
Figure 4.31. Exit Analysis Package.
Traffic Tracker – Chapter Four
4-33
4.6 Exit Traffic Tracker
When you click “Exit Analysis Package,” the Analysis Package will close and you will return to the main
Traffic Tracker screen (Figure 4.32). To exit the program, click “Exit Traffic Tracker.”
Click “Exit
Traffic Tracker”
to exit program.
Figure 4.32. Click to exit Traffic Tracker.
Traffic Tracker – Chapter Four
4-34