1
User Manual RFEX
Test and Measurement Division
User Manual
RFEX
System Software for
EMF Measurements
Version 3.2.0
1140.7984.03
E-1
User Manual RFEX
Contents
Contents
Introduction.............................................................................................. 4
1 Installation and Requirements.......................................................... 5
1.1
System requirements....................................................................................... 5
1.2
Copy Protection ............................................................................................... 5
1.3
Required Hardware Interfaces ........................................................................ 6
1.4
Installation ........................................................................................................ 7
2 First Steps........................................................................................... 7
2.1
Step 1: Starting RFEX ...................................................................................... 8
2.2
Step 2: Configuring a Measurement Packet .................................................. 9
2.3
Step 3: Testing the Packets .......................................................................... 11
2.4
Step 4: Executing a Long-term Measurement ............................................. 13
2.5
Step 5: Generating a Report.......................................................................... 14
2.6
Step 6: Backing Up Measurement Data........................................................ 14
3 Reference of the User Interface...................................................... 15
3.1
Main Menu ...................................................................................................... 15
3.2
Selection Dialogs ........................................................................................... 16
3.3
Table Editor .................................................................................................... 18
3.4
Hardware Configuration ................................................................................ 19
3.4.1
3.4.2
3.4.3
3.4.4
3.4.5
3.5
Spectrum Analyzer................................ ................................ ................................ ..........
Switch Unit................................ ................................ ................................ ......................
RF Generator................................ ................................ ................................ ..................
UMTS Analyzer................................ ................................ ................................ ...............
GPS Receiver................................ ................................ ................................ .................
19
20
22
24
25
Editor for Measurement Packets .................................................................. 27
3.5.1
3.5.2
3.5.3
3.5.4
Measurement Sequence Tab................................ ................................ .......................... 28
Spectrum Analyzer Tab................................ ................................ ................................ ... 30
Measurement Frequencies Tab................................ ................................ ....................... 33
Data Acquisition Tab................................ ................................ ................................ ....... 36
3.6
Editor for UMTS Measurement Packets ....................................................... 39
3.7
Measurement Configuration Editor .............................................................. 40
3.8
Options Dialog................................................................................................ 43
3.8.1
3.8.2
Measurement Tab................................ ................................ ................................ ........... 43
Report Tab................................ ................................ ................................ ...................... 45
2
E-1
User Manual RFEX
Contents
4 File System ....................................................................................... 47
4.1
Directory Structure ........................................................................................ 47
4.2
Configuration Data......................................................................................... 48
4.3
Measurement Results .................................................................................... 49
4.3.1
4.3.2
4.3.3
4.3.4
4.4
Single Measurements ................................ ................................ ................................ ..... 49
Peak/Average Measurements................................ ................................ ......................... 50
Long-term Measurements ................................ ................................ ............................... 50
Measurement Log................................ ................................ ................................ ........... 51
Reports ........................................................................................................... 52
5 Measurement Procedures ............................................................... 54
5.1
EMF Measurement Procedures..................................................................... 54
5.1.1
5.1.2
5.1.3
5.1.4
5.2
Single Measurement................................ ................................ ................................ ....... 54
Peak / Average Measurement................................ ................................ ......................... 56
Long-Term Measurement................................ ................................ ................................ 56
Learning Phase................................ ................................ ................................ ............... 57
Other Measurement Procedures ................................................................... 58
5.2.1
5.2.2
5.2.3
Threshold Calibration................................ ................................ ................................ ...... 58
Overview Sweep................................ ................................ ................................ ............. 59
Cable Calibration ................................ ................................ ................................ ............ 60
3
E-1
User Manual RFEX
Introduction
Introduction
RFEX (Radio Frequency EXposure software), the System Software for EMF measurements by Rohde
& Schwarz, is a dedicated solution for the measurement and evaluation of electromagnetic fields
(EMF). It is implemented as a standard Windows application, and has been developed to support the
operation of the following R&S measurement systems:
•
Portable System for EMF Measurements TS-EMF, Ident. No. 1158.9295
•
EMF Measurement System (with ESPI and an antenna array), Ident. No. 1158.9037
When used with one of these systems, RFEX takes care the remote control of the measurement
instrument and the antenna switching, of integrating and correcting the raw measurement data, of
saving the results and, if possible, of generating measurement reports. All these features can be
accessed and parameterised by the user from a standard Windows-style user interface.
The present manual first describes the requirements for the use of the software. Chapter 2 gives a
brief introduction to first time users in order to get familiar with RFEX. A full reference of the user
interface can be found in chapter 3, whereas chapter 4 explains in detail which data files are required
and generated by RFEX at run time. Chapter 5 deals with the details of the measurement process.
Throughout this manual, there will be many details which apply to the portable EMF measurement
system TS-EMF alone. These will be marked by the following special formatting:
*
Hints formatted like this are applicable to the portable EMF measurement
system TS-EMF only.
TS-EMF
4
E-1
User Manual RFEX
1
First Steps
Installation and Requirements
1.1 System requirements
The System Software for EMF measurements RFEX has to be installed on a computer running with
Windows® Operating Systems. Its functionality is tested and guaranteed on Windows 2000 and
Windows XP.
There are no particular requirements on the computer system except that it should have enough
resources to run the operating system.
The resolution of the graphic interface card should be minimum 800 x 600 pixel.
A minimum of 10 MBytes of hard disc memory is required for the installation. For the measurement
data enough hard disc memory should be foreseen, too. Long-time measurements running for 24
hours have shown the following amount of data to be recorded:
• The final results data file for a long-time measurement contains about 12 kBytes per
measurement packet.
•
•
The raw data files (saved optionally!) make up to 50 MBytes.
The measurement log file (saved optionally!) has a size of up to 1 MByte.
For the automatic report generation, Microsoft Excel has to be installed.
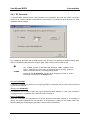
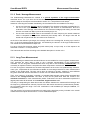
1.2 Copy Protection
In order to protect RFEX from being illegally copied and used, the software is delivered with and
protected by a hardlock. It is allowed to install RFEX on as many computers as you like, but only if a
valid hardlock is connected to the computer, the possibility to do measurements is enabled.
Installing the software without hardlock allows to generate or modify measurement setups (packets)
and to print out reports. However, if you try to start a measurement on such an installation, the
following message will appear and the measurement is aborted:
Additionally, specially coded hardlocks will enable additional options. For example, the measurements
on UMTS base stations with channel decoding can only be done with such a specially coded hardlock.
5
E-1
User Manual RFEX
First Steps
1.3 Required Hardware Interfaces
Depending on the configuration of the measurement system, the computer must be equipped with the
following interfaces:
TS-EMF (Portable System for EMF Measurements)
Ÿ
A serial interface (COMx) must be available for remote control of the spectrum analyzer
FSH3. If the computer is equipped with USB interfaces only, a standard commercially available
USB to RS232 converter can be used.
Ÿ
A USB port must be available for controlling the switching of the tri-axis isotropic probe.
Ÿ
A second USB port is required for connecting the hardlock for copy protection. A two-port USB
extender is delivered by standard with the TS-EMF system in order to support notebooks with
one single USB port.
Ÿ
Optionally, a second serial interface (COMx) must be available if a GPS receiver shall be
supported for accurate geographic detection.
Ÿ
Optionally, a IEEE 1394 (Firewire) port or plug-in card is required for measurements on UMTS
base stations with channel decoding using a R&S TSMU. A suitable OEM card (different types
for desktop computers and notebooks) can be purchased from R&S.
EMF Measurement System with ESPI and an antenna array
Ÿ
A GPIB (IEEE bus) plug-in card must be available for remote control of the ESPI. The
recommended card is the National Instruments PCI-GPIB (for desktop computers) or PCMCIAGPIB (for notebooks); both interface cards can be purchased from R&S. The Windows
software driver to be installed shall be version 1.60 or upper.
Ÿ
Alternatively, the ESPI can be remotely controlled by network. For this purpose, a LAN
connection with the Microsoft Windows Network TCP/IP driver must be available. In this case,
the GPIB interface card is not required.
Ÿ
A serial interface (COMx) must be available for remote control of the antenna switching unit.
Ÿ
A USB port is required for connecting the hardlock for copy protection.
Ÿ
Optionally, a second serial interface (COMx) must be available if a GPS receiver shall be
supported for accurate geographic detection.
Ÿ
Optionally, a IEEE 1394 (Firewire) port or plug-in card is required for measurements on UMTS
base stations with channel decoding using a R&S TSMU. A suitable OEM card (different types
for desktop computers and notebooks) can be purchased from R&S.
6
E-1
User Manual RFEX
First Steps
1.4 Installation
G
Important Note !
If any other version of RFEX is installed on the computer, this older version must
be uninstalled before installing a new version!
For uninstalling RFEX click on
Start à Settings à Control Panel à Add or Remove Programs
select Rohde & Schwarz RFEX from the list of installed programs and click on
Remove
For installing RFEX, please start the Setup.Exe program on the delivered CD-ROM. Do so by
selecting Start à Run… and typing D:\Setup.exe into the command line, assuming that the CD-ROM
drive on your computer is configured as drive D:. Click on OK to start the installation. If the Autostart
feature is enabled for your CD-ROM drive, the setup program will be launched automatically when
loading the CD-ROM.
The installation consists in starting, one after another, two independent utilities. The first one installs
the Windows system driver for the iKey hardlock, which is delivered for protecting the software against
unwanted copying. The second one is the RFEX installation utility.
Installation should be self-explaining. The only user interaction required is to define the path where to
copy the RFEX to. Default path is C:\Program Files\Rfex.
In addition to the application software RFEX itself, the available manuals and an example data set are
copied to the hard disk, so that RFEX is ready to start measurements from the beginning. All these
additional files can also be found on the CD-ROM.
*
TS-EMF
The calibration data for the delivered tri-axis probe are available on the CDROM in the folder CalDataAntenna. Please make sure to copy them by hand
after software installation.
For systems newly delivered with RFEX V3.2.0, the probe calibration data are
burnt onto the hardlock as well, and can directly be imported from the user
interface, see section 3.2.
Two additional hardware components used with TS-EMF require special Windows drivers to be
installed as well:
•
The 3-axis probe is switched by means of a signal converter connected to one of the PC’s
USB ports. When first connecting this converter to the PC, the Operating System will try to find
a driver. Please select the directory \UsbIODriver on the CD-ROM as source directory fort his
driver.
•
If option TSEMF-US2 for UMTS measurements with channel decoding based on the R&S
Radio Network Analyzer TSMU is used, the special Windows driver for the IEEE1394 interface
developed for supporting the TSMU must be installed. For this purpose, an entry is added to
the Windows Start menu: Please click on Start à Programme à Rohde & Schwarz RFEX
à Ohci1394 Driver Installation for installing this driver. Alternatively, the installation utility
can be found on the CD-ROM, directory \TsmuOhciDriver. See also te TSMU manual for
details.
7
E-1
User Manual RFEX
2
First Steps
First Steps
This chapter describes the basic steps to configure the system software RFEX, to perform measurements and to generate reports.
Before starting to work with RFEX according to the following example, please make sure that the
following requirements are matched:
•
The tables containing the cable loss of the used cables and the antenna factor of the used
antenna must be available. These tables give the associated correction factors depending on
the frequency. Section 3.3 shows how to edit such tables.
•
The instruments making up the system must have been configured to RFEX software. Refer to
section 3.4 for information on how to configure the available hardware.
*
TS-EMF
The software dialogs shown throughout this chapter apply to the use of RFEX
with the TS-EMF system. For the use with other systems, the Measurement
Packet configuration dialog (section 2.2) will be slightly different.
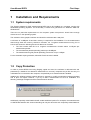
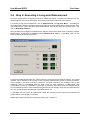
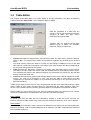
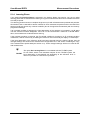
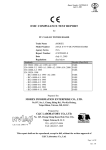
2.1 Step 1: Starting RFEX
Start the System Software RFEX by clicking on Start à Programs à Rohde & Schwarz RFEX à
RFEX V3.2.0. The main screen of RFEX will appear. Most of the configuration and measurement
actions start from this point. A complete reference of the interface is given in chapter 3.
8
E-1
User Manual RFEX
First Steps
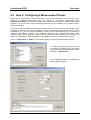
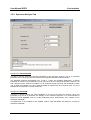
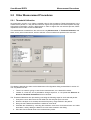
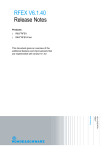
2.2 Step 2: Configuring a Measurement Packet
Measurement configuration is done in two steps. Since each measurement can be made up by a
sequence of partial measurements each one defined by a separate measurement setup
("Measurement Packet"), the first configuration step consists in defining the necessary measurement
packets. In the second step, these measurement packets will be combined to a complete measurement configuration.
The need for defining different measurement packets arises from the fact that the total EMF to be
evaluated is generated from several separate sources of electromagnetic radiation. Each of these
contributions (e.g. TV and radio broadcasting, mobile phone base stations) must eventually be
measured with different settings of the analyzing instrument (e.g. different bandwidths, signal
detectors, sweep times, frequency ranges). Each measurement packet defines how to operate the
system for evaluating the EMF contribution of one radiation source in a certain frequency range.
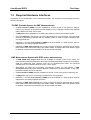
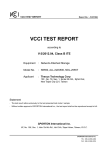
Click on Configuration à Packet.... The following dialog for selecting a packet will be opened:
To create a new packet, type the name of
the packet (for example "My first packet")
in the field for packet names at the bottom
and click on Open Packet....
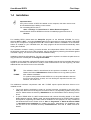
The configuration dialog for measurement
packets will be opened:
9
E-1
User Manual RFEX
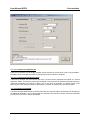
First Steps
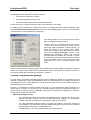
This dialog allows to define different parameters for
•
the setup of the spectrum analyzer,
•
the data acquisition procedure, and
•
the measurement frequencies for this particular setup.
Section 3.5 gives a complete reference of all control elements in this dialog.
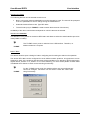
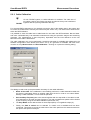
For setting up the measurement frequencies at which to evaluate the electromagnetic radiation level,
select the Measurement Frequencies tab and click on the Frequency list... button to open the dialog
for the definition of the measurement frequencies.
This dialog allows to enter new frequencies into the
table or to delete frequencies from it.
In many cases, it is required to perform the measurement on a series of frequency points with the
same step width (equidistant channel spacing). To
make the editing of such tables easier, RFEX
contains a so called channel generator to be accessed via the Channel Generator... button in the
measurement frequencies dialog. This channel
generator adds (or deletes!) any number of entries
in the frequency list; the amount of entries is defined
by giving suitable values for the start and the stop
frequencies and for the required frequency step
width.
Leave the Measurement Frequency Dialog and the Measurement Packet Editor by pressing the button
Close. The measurement setup definition generated this way is automatically checked for consistency
and stored. Details about data storage are given in chapter 4.
Creating a completely new package
In most cases, the standard packages delivered and installed with RFEX will be adequate for the
required measurements. Only small adaptations may be needed depending on specific conditions of
the measurement site. These adaptations can be performed with the help of the RFEX routines for
packet testing (see next section).
However, if a completely new packet needs to be set up, e.g. for measuring the EMF contribution of a
signal source not taken into account by any standard packet, setting the following parameters to
correct values is critical for getting reasonable measurement results without neglecting or underestimating major contributors to the EMF:
•
Spectrum Analyzer section
o
The resolution bandwidth shall match the bandwidth of the expected RF signal. If the
signal’s bandwidth is bigger than the broadest bandwidth available on the analyzer,
consider using the channel power measurement utility (only for FSH3).
o
The input attenuation shall be enough to protect the analyzer’s input from overload or
even damage by too high fields. Only if the measured signal is very low (find out by testing
the package) an attenuation of 0 dB shall be set.
o
Use RMS detector whenever pulsed signals are to be measured.
10
E-1
User Manual RFEX
•
First Steps
Data Acquisition section
o
Use a short dwell time if the signal to be measured is expected to be constant in
amplitude (e.g. an FM modulated carrier signal). Use longer dwell times (with Max Hold
trace mode on the analyzer) when the signal’s amplitude varies with time but the carrier
signal is permanent. Use long dwell times (several thousands of milliseconds) if the signal
is a pulsed (keyed) carrier signal.
Consider setting this long time as analyzer sweep time if you want to force the analyzer to
sweep slowly in order to measure on each frequency during a time long enough to make
sure any keyed signal on this frequency is going to be detected.
Have a look at the delivered standard packets for measurements on GSM base stations in
order to get an additional understanding of these hints.
o
Always perform a threshold calibration run (see next section) before working with your
new packet. This will automatically calculate a suitable value for the acceptance threshold
depending on the locally available fields and the noise floor of your analyzer.
o
Use an extrapolation factor for correcting measured values which you know to be too low,
e.g. when the bandwidth of the signal to be measured exceeds the highest bandwidth of
the analyzer, but no channel power measurement option is available.
The extrapolation factor should reflect how much of the signal strength is lost during
measurement due to too small a bandwidth being used. It is recommended to do some
experiments comparing levels measured with TS-EMF and with instruments specifically
suited to measuring such broadband signals, in order to determine reasonable
extrapolation factors.
•
Measurement Frequencies section
o
For measuring the EMF of signal sources emitting with a known fixed channel pattern, use
the known channel pattern mode with a frequency list, eventually generated with the
channel generator utility as shown above.
o
For signal sources emitting at frequencies with no known distribution pattern, use the
sweep with peak search mode.
In any case, some knowledge about the nature and characteristics of the signals to be evaluated must
be gathered before starting to evaluate them with RFEX.
2.3 Step 3: Testing the Packets
Before starting a real long-term EMF measurement, the measurement packet configured just before
should be tested. This ensures that all parameters are selected correctly.
To test the measurement packet, RFEX features two test procedures: the Single Measurement mode
and the Threshold Calibration. Both of these combine set of measurements packets to a sequence
and run this sequence once. This allows to test all the steps which are used during a later long-time
measurement because the same sequences are used.
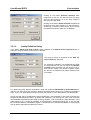
Single Measurement
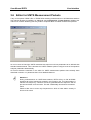
Click on Measurement à Single Meas... and the measurement selection dialog is opened. This is
similar to the dialog for selecting a measurement packet shown in the previous step. Type in the name
for the measurement (for example "My first Measurement") and click on New Measurement.... The
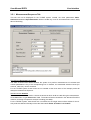
Measurement Configuration dialog appears:
11
E-1
User Manual RFEX
First Steps
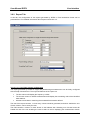
The main task of this dialog is to configure the list of measurement packets in the correct sequence.
Select one or several packets in the list Available Packets and shift it to the list Selected Packets by
pressing the upper button showing the arrow to the right. Clicking on the Close button will save the
configuration. The Single Measurement configuration is now available for a later measurement.
To start a test run immediately, click on the Start Measurement button. The dialog will be closed and
the measurement will start immediately. A display box occupying the main part of the RFEX main
window is opened, showing a measurement log which allows to follow step by step how the
measurement is proceeding.
Threshold Calibration
An additional refinement is available for fine-tuning the packet definition: the Threshold Calibration
utility. One of the most critical parameters in a measurement packet is the Acceptance threshold
parameter in the Data Acquisition tab. This value defines a radiation level below which any measured field level will be ignored. It is very important to set this parameter in a way that it is neither too
high (would lead to too low an EMF value being measured) nor too low ( would lead to the analyzer’s
noise floor to be evaluated as radiation). A suitable value can automatically be determined with the
threshold calibration procedure.
Click on Measurement à Threshold Calibration… The same Measurement Configuration dialog as
above with only some little differences will be opened. Select the packets to be tested and click on
Start Measurement. Again, one test run will be performed. At the end, the acceptance threshold
value of each packet will automatically be adapted to a value representing a good compromise
between the requirements of not including the analyzer’s noise floor in the measurement result, but
not loosing too much of the signal to be measured in the result compression process.
12
E-1
User Manual RFEX
First Steps
2.4 Step 4: Executing a Long-term Measurement
Once the measurement configuration has been edited and tested, a long-term measurement of the
electromagnetic field can be performed. This measurement is the main task of the system.
For starting a long-term measurement, click on Measurement à Long-term Meas.... The dialog for
the measurement selection appears showing all existing long-term measurement configurations. For a
new measurement, type in the name of the measurement, for example “My first Long-term meas." and
click on New Measurement....
Next, the dialog for configuring a measurement appears, which is the same as for configuring a Single
Measurement, except that an additional button Measurement Times... is available. Click on this
button to define the measurement time.
A long-term measurement starts at a certain moment in time and ends at another moment. The overall
duration can be defined at will. During such a long-term measurement the list of selected measurement packets is executed cyclically in sequence. For each frequency, the average value of the
measured field is accumulated and the peak value for each frequency is determined. This
accumulation is done for a selectable cycle length (in minutes), after which these accumulated values
are compressed so that for each measurement packet only one average value and one peak value are
left. The overall resulting field strength will be determined, too.
To generate the final result, all measurement data are reduced to three values per measurement
packet and per cycle length (in minutes).
Details about data recording and compression are given in chapter 5.
13
E-1
User Manual RFEX
First Steps
2.5 Step 5: Generating a Report
After completing a measurement, a report may be created. Basically, there are two possibilities:
•
The measurement result which is available as file in ASCII format can be printed directly or be
post-processed by any other tool (see chapter 4 for information on data format and data
storage)
•
The measurement result may also be used to automatically generate an EXCEL® spreadsheet from RFEX.
For generating this spreadsheet, select Export à Long-term Meas.... A measurement selection
dialog similar to the one for selecting the measurement will appear. Select the measurement for which
a report shall be generated and click on Create Meas. Report. Depending on the amount of data
recorded, it may take some time to generate the report as a total of three Excel files. When this
operation is complete, the files can be found in the directory Reports.
Eventually, no report will be generated at all. This may be the case if no signals could be measured or
the signal level was so low that it fell below the acceptance threshold and hence was ignored during
result compression. In this case, a warning will inform the user about this.
Similarly, the spreadsheets generated from a long-term measurement may contain empty cells, which
arise from no signal above acceptance threshold having been measured, during the associated time
lapse and for the corresponding measurement packet.
2.6 Step 6: Backing Up Measurement Data
RFEX creates setup and result files as well as Excel worksheets. All these files are not further managed or saved by the RFEX. If you want to keep a secure backup of these files on hard-disc or any
network drive, this backup procedure must be handled from outside of RFEX, for example via the
Windows-Explorer.
Details on the type and location of the files generated by RFEX are given in chapter 4.
14
E-1
User Manual RFEX
3
User Interface
Reference of the User Interface
3.1 Main Menu
The main menu of System Software RFEX contains the following entries (menu entries in Italics and
marked with * are not available for the TS-EMF system):
Menu
Function
Refer to section
Antenna
Open the editor for antenna factor tables
3.2, 3,.3
Cable
Open the editor for cable loss tables
3.2, 3,.3
Limit Line
Open the editor for limit line tables
3.2, 3,.3
Exit
Exit RFEX
File
Configuration
Packet
Open the editor for the measurement packets
3.2, 3.5
Umts-Packet
Open the editor for UMTS measurement packets 3.7
Hardware
Open the hardware configuration dialog
3.4
Overview-Sweep *
Execute an overview sweep
5.2
Single Meas
Configure and execute a single measurement
3.2, 3.6, 5.1
Peak/Average Meas
Configure and execute a Peak / Average
measurement (cycle in minutes)
3.2, 3.6, 5.1
Long-term Meas
Configure and execute a long-term measurement 3.2, 3.6, 5.1
Threshold Calibration
Configure and execute a threshold calibration
Cable Calibration *
Record the frequency dependent attenuation loss 5.2
of a cable
Measurement
5.2
Export
Single Meas
Generate a report for a single measurement
4.4
Peak/Average Meas
Generate a report for a Peak / Average
measurement
4.4
Long-term Meas
Generate a report for a long-term measurement
4.4
Options
Optional settings to parameterise RFEX run time
operation
3.8
Change Language
Changing the interface language
Info
Opens the system information dialog
System
RFEX can run its user interface displaying all strings in different languages. Currently, English,
German, Spanish and, on Windows versions enabling Chinese user interface, Chinese are supported.
Default language after installation is English. The language can be changed from the main menu entry
System à Change Language. RFEX must be restarted to activate the new language.
15
E-1
User Manual RFEX
User Interface
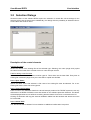
3.2 Selection Dialogs
Several functions of the software RFEX require the selection of certain files. All the dialogs for the
selecting a file have the same layout. Additionally, the dialogs offer the possibility to delete the files or
to save them with another name.
Description of the control elements
List with file names
Shows the names of the existing files of the selected type. Selecting one name (single click) copies
the name into the lower field. A double click on a name will open this file.
Field for editing a new file name
Prior to edit a new file, the file name must be typed in. This is done into the lower field. Every time an
existing file is selected (single click), the name will be copied into this field.
Button Open Table...
Opens the editor for the file selected. A file name of an existing file must be selected. For a nonexisting file first the name has to be typed-in.
Button Copy from hardlock
From V3.2.0 on, the calibration data for the tri-axis isotropic probes of the TS-EMF system are not only
delivered on the RFEX CD-ROM, but are also written on the software protection hardlock. This button
will be displayed whenever a hardlock containing antenna data is found to be connected to the PC.
Clicking on this button will copy the antenna calibration tables from the hardlock and store them on the
PC’s hard disk.
Button Delete Table
The selected file will be deleted. Prior to deletion an additional confirmation is required.
16
E-1
User Manual RFEX
User Interface
Button Save Table as
The selected file will be copied and saved with different name. Proceed as follows:
•
First select from the list the file to be copied.
•
•
Type-in a new name for the file in the lower field.
Select the above button
If no file is selected or if the new name is missing, or if both file names are equal, then an error
message will be shown and the operation will be aborted.
Button Close
Exits the dialog.
Additional control elements in other selection dialogs
Depending on the dialog, the buttons have slightly different meanings. The selection dialog for measurement packet shows Measurement Packet instead of Table, and selection dialog for measurements shows Measurement instead of Table.
The selection dialog for measurements shows the button New Measurement instead of Open
Measurement. Pressing this button generates a new data file with the specified name. If the file
already exists, an error message will appear.
To repeat a measurement, the button Repeat Measurement... is available. Before starting the
measurement an additional confirmation is necessary to repeat the measurement, since in that case
all the existing data will be overwritten. In case of a Long-term measurement the button is labelled
Repeat Measurement.... During Long-term measurements the existing data are not deleted but the
new measurement data are attached to the existing data.
17
E-1
User Manual RFEX
User Interface
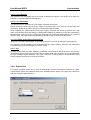
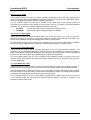
3.3 Table Editor
The purpose of the table editor is to create, display or change data tables. The editor is started by
pressing the button Open Table... in the selection dialog for tables.
Data are presented in a table with two
columns. The left column always shows the
frequency in MHz. The right column
depends on the type of table.
Together with the software RFEX three
different types of tables are available:
antennas, cables and limit lines.
•
•
•
Antenna describes the antenna factor of the antennas used. The right column shows the antenna
factor in dB/m. The measurement results of the spectrum analyzer are corrected by the antenna
factor.
The serial number code of the antenna to which the file belongs is displayed on top of the data
table if the file contains this information. This allows a fast check whether the table corresponds to
the real probe being used with the system.
Cable describes the attenuation caused by the cabling from spectrum analyzer to the antenna.
The data in the right column are shown in dB and the attenuation is expressed in positive values.
The measurement results of the spectrum analyzer are corrected by the cable loss; the raw data
already include the cable loss.
Limit Line describes the maximum field strength allowed. Refer to the national regulations of each
country. The limit line is expressed in V/m. The limit line table is used during final data
compression to calculate the relation of the measured field strength to the limit line (shown as
parts per thousand).
Tables of type Antenna and Limit Line are to be generated manually from within RFEX using the table
editor. Tables of type Cable can alternatively be generated with the cable calibration utility (see
section 5.2.3). But this requires a tracking generator option to be installed in the spectrum analyzer.
Editing a table only can be done line by line. The line is selected clicking on it with the mouse, and the
content of the selected line is transferred to the lower two input fields for editing.
Button Delete
To delete a line from the table, the line is selected by clicking on it with the mouse, and then this
button is selected. A table at least must contain one line; therefore the last line never can be deleted.
Button Insert
To add a new line to the table, first the values to be added are to be typed in the two input fields at the
bottom of the dialog. Then the button Insert has to be selected. The table is automatically sorted out
with increasing frequency.
18
E-1
User Manual RFEX
User Interface
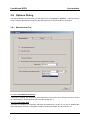
3.4 Hardware Configuration
This dialog allows to configure the hardware to be controlled by RFEX. Normally, it will be enough to
set up the configuration once after RFEX installation. The dialog is opened from the main menu by
clicking on Configuration à Hardware.... It contains one tab for each device which can eventually be
supported by RFEX.
3.4.1 Spectrum Analyzer
The spectrum analyzer is the basic instrument to perform any measurements and data acquisition.
Selection box Type
Select the device to be used. The following devices are supported:
•
Spectrum Analyzer FSP from Rohde & Schwarz
•
•
EMITest Receiver ESPI from Rohde & Schwarz
Spectrum Analyzer FSU from Rohde & Schwarz
•
Spectrum Analyzer FSH3 from Rohde & Schwarz
Availability of the other control elements depends on which instrument is selected.
Option GPIB
This option is available only if an analyzer with GPIB interface has been selected, i.e. the FSP, the
FSU or the ESPI. If this option is checked, the selection box Address is enabled for configuring the
analyzer’s GPIB address.
Option LAN
This option is available only if an analyzer with TCP/IP interface has been selected, i.e. the FSP, the
FSU or the ESPI. If this option is checked, four fields are enabled for configuring the analyzer’s IP
Address.
19
E-1
User Manual RFEX
User Interface
Selection Box Interface
This selection box is available only if the FSH3 is selected as analyzer. The serial port to which the
analyzer is connected shall be selected here.
Selection Box Baud Rate
This selection box is available only if the FSH3 is selected as analyzer.
Please choose the baud rate set at the FSH3 via its setup menu. Only with the correct baud rate
information, RFEX will be able to set up a communication with the FSH3.
When operating the FSH3 without mains power supply, each time the device is switched off, it will
return to the default baud rate setting of 19200 baud, RFEX will by default try to find the FSH3 testing
this baud rate. If the FSH3 can be found with 19200 baud and the Baud Rate selection box contains a
different value, the FSH3 will be programmed by remote control to use this new baud rate.
Check box Blank screen during measurement
If this box is checked, trace display on the analyzer’s screen is turned off during the measurement.
This selection is only available if one of the devices FSP, FSU or ESPI is selected. The FSH3 does
not enable turning off screen display by remote control.
Button Test
Clicking on this button will make RFEX try to establish communication with the analyzer. The device’s
identification will be queried and it will be reset to default state. If the analyzer can not be addressed,
an error message will be displayed. This gives a fast way of testing whether the parameters of the
remote interface have been set correctly to RFEX.
3.4.2 Switch Unit
A remotely controlled switch unit is used to sequentially connect the different antennas of a EMF
measurement system or the different axes of the TS-EMF isotropic probe, to the input of the spectrum
analyzer during a measurement run.
20
E-1
User Manual RFEX
User Interface
Selection box Type
The following devices can be selected as switch unit:
•
None. In this case, antenna polarisation must be changed by hand. The user will be prompted
to do so if polarisation is due to change during the measurement.
•
Automatic Antenna Switch Unit, Type DEV 9801
•
Tri-Axis Probe (only for TS-EMF; is used to switch the three axis of the sensor)
Availability of the other control elements depends on which instrument is selected.
Selection box Interface
This selection is only active for the device DEV 9801 and allows to select the serial interface port to be
used (COM1 to COM4).
*
The TS-EMF tri-axis probe is switched via a USB interface. Therefore, no
address selection is required.
TS-EMF
Button Test…
This button allows to open a dialog for further configuring and for testing the switch unit’s operation.
The device DEV 9801 can be configured for seven different switch positions. A logical name can be
assigned to each of the positions and this name will be used later on for switching. RFEX requires the
logical names „Position 1“ to „Position 7“ for correct switching. For each switch position a button Test
is available which allows to check correct switching functionality.
*
TS-EMF
For the TS-EMF tri-axis probe, the switch positions are pre-configured and
cannot be changed. This button can be used to check the correct switching functionality.
21
E-1
User Manual RFEX
User Interface
3.4.3 RF Generator
To perform EMF measurements, a RF generator is not mandatory. But it can be used to record the
cable loss in a cable calibration measurement (see section 5.2.3). Without signal generator no cable
calibration will be possible.
Any suitable RF generator with a GPIB interface can be used. The optionally available tracking generator of a GPIB controlled spectrum analyzer (FSP, FSU or ESPI) can be used as well.
*
TS-EMF
The TS-EMF system is delivered with standard cables calibrated from
factory. Although the FSH3 may be equipped with a tracking generator
option, driving this option is not supported by RFEX.
Therefore, the RF Generator tab will not be displayed if FSH3 is chosen
as analyzer instrument in the Analyzer tab.
Check box Available
If this box is checked, the presence of a signal generator is assumed and the other control elements
on this tab are enabled.
Selection box GPIB Addr.
This selection box is used to select the signal generator’s GPIB address. In case of an analyzer’s
tracking generator, the address is the same as for the analyzer’s.
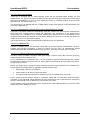
Button Commands...
Since the exact type and manufacturer of the RF generator cannot be selected, it is necessary to
specify the GPIB commands for the operation of the generator. Clicking on this button opens the
following dialog for configuring the generator’s remote control commands:
22
E-1
User Manual RFEX
User Interface
Text fields for entering the GPIB commands
In total, five text fields are available to enter the GPIB commands for the RF generator. Three of them
are optional:
•
•
•
Initialize Generator (Reset)
Switch RF ON
Switch RF OFF
The other two command lines have to be edited in any case; empty text fields will lead to an error
message when trying to save this setup.
•
Set frequency in Hz: The command has to be entered in a way that the signal frequency is
transferred with unit Hz; the value of the frequency is replaced by the string %f .
•
Set RF level to 0 dBm: Cable calibration is done with a generator level of 0 dBm. The
corresponding command has to be entered in this text field.
G
Attention !
During cable calibration the commands are used exactly as entered in this dialog.
Make sure that the correct syntax is used!
Buttons Test
For each command line, a button Test is available. Clicking on this button will send the command to
the device as written in the text field. This allows to check if the command has been entered correctly.
Button Default commands
Clicking on this button will enter the commands applicable to the R&S devices ESPI and FSP in all
input fields.
Button Close
Clicking on this button will save all configured commands and will close the dialog. If no command is
specified to set the frequency or the level of the signal generator, an error message will appear.
23
E-1
User Manual RFEX
User Interface
3.4.4 UMTS Analyzer
Options TSEMF-US1 and TSEMF-US2 extend RFEX by software modules able to decode the WCDMA signals of UMTS base stations and directly measure the channel power of the identified
primary channels (C-PICH). Option TSEMF-US1 includes such measurements based on the R&S PN
Scanner with an FSP or an ESPI or based on the R&S TSMU Radio Network Analyzer. Option
TSEMF-US2 includes only the measurements with the TSMU, it is a subset of option TSEMF-US1.
In the same way as the application itself, these options are protected from being illegally copied and
used by a special encryption version of the RFEX hardlock. If one of these options is enabled with a
suitable hardlock, the tab for selecting and configuring an instrument for UMTS measurements will be
displayed in the Hardware Configuration dialog.
Selection box Type
Select the device to be used. The following devices are supported for UMTS measurements:
•
R&S Spectrum Analyzer FSP (only with option TSEMF-US1)
•
•
R&S EMI Test Receiver ESPI (only with option TSEMF-US1)
R&S Radio Network Analyzer TSMU (with both options TSEMF-US1 and TSEMF-US2)
Availability of the other control elements depends on which instrument is selected.
Option GPIB
This option is available only if an analyzer with GPIB interface has been selected, i.e. the FSP or the
ESPI. If this option is checked, the selection box Address is enabled for configuring the analyzer’s
GPIB address.
Option LAN
This option is available only if an analyzer with TCP/IP interface has been selected, i.e. the FSP or the
ESPI. If this option is checked, four fields are enabled for configuring the analyzer’s IP Address.
No additional control element is displayed if R&S TSMU is selected as UMTS Analyzer. The
instrument is driven via a IEEE 3194 (Firewire) interface which needs no further configuration.
24
E-1
User Manual RFEX
User Interface
3.4.5 GPS Receiver
As the TS-EMF system is conceived to be used as hand-held mobile utility, it can be useful to record
the position where a measurement is performed as precisely as possible, and not relying only on
descriptive indications of the measurement location. For this purpose, RFEX implements a simple
interface for reading out the geographical position from GPS receivers. The interface relies on the
GPS receiver device being able to send the $GPGLL message as defined in the well-known NMEA
message protocol. Only this $GPGLL message is interpreted, and the current geographical position is
extracted from this message.
There are lots of different GPS receivers available on the market, and many different approaches for
configuring the output interface. Before using a GPS receiver with RFEX please make sure that it
supports the NMEA protocol and consult the device’s manual on how to configure the device for
activating output messages according to NMEA.
The feature has been tested with the Garmin GPS III+ receiver. No guarantee can be given for a
general compatibility to any device.
Check box Available
If this box is checked, the presence of a GPS receiver is assumed and the other control elements on
this tab are enabled.
Selection box Interface
This selection box is used to select the serial port (COMx) to which the receiver is connected.
According to NMEA specifications, the port is configured to be operated with 4800 baud, 8 data bits,
one stop bit and no handshake.
Button Test
Clicking on this button activates the COM port. If any of the possible command strings is not empty, it
is sent to the device. Then, the port input is scanned. If a valid $GPGLL message is received, the
position decoded from it is displayed in a message box.
The timeout for receiving a valid position is 30 seconds. Hence set up your GPS receiver and make
sure it is able to locate its position before testing the communication.
25
E-1
User Manual RFEX
User Interface
Text fields for entering the NMEA configuration messages
For some types of GPS receivers it may be necessary (or possible) to explicitly activate NMEA
protocol and to configure which messages will be output to RFEX.
G
Attention !
Whether such commands are defined and/or mandatory depends on the used
GPS receiver. This information and the exact syntax for the commands must be
found in the receiver’s manual and supplied to RFEX by the user.
If such commands are defined, they can be entered in these text fields and will be sent as typed here
to the serial port. Three different commands are supported:
•
Activate NMEA protocol: The command entered in this field shall be used to switch the
receiver’s output syntax to NMEA if the default protocol after switching it on is a different one.
•
Disable all messages: This command can be used for turning off NMEA output, and should be
used together with the next one. The purpose is to avoid output of messages which are not
interpreted by RFEX.
•
Enable GLL message: Once all NMEA messages are disabled, the GLL message must be
enabled again in order to allow position interpretation by RFEX.
The Garmin GPS III+ device used for testing does not define such commands. Instead, NMEA output
must be enabled manually from the devices user interface. In this case, for example, all three fields
should remain empty.
26
E-1
User Manual RFEX
User Interface
3.5 Editor for Measurement Packets
This editor is used to define the measurement packets. A measurement packet specifies how to
record measurement data in a particular frequency range.
There are several reasons why it is necessary and recommendable to split the total frequency range
to be evaluated for EMF into different sub-ranges:
•
On the one hand, the total EMF to be evaluated is generated by several separate sources of
electromagnetic radiation. Each of these contributions (e.g. TV and radio broadcasting, mobile
phone base stations) must eventually be measured with different settings of the analyzing
instrument (e.g. different bandwidths, signal detectors, sweep times, frequency ranges).
Hence, each measurement packet defines how to operate the system for evaluating the EMF
contribution of one source of radiation.
•
On the other hand, the overall frequency range which a full EMF system with an array of
different antennas is able to evaluate, must be split up into several sub-ranges because the
complete range can not be covered by one antenna. Therefore at least one measurement
packet is to be defined for each antenna.
•
Finally, it is recommendable to define several frequency sub-ranges in order to separate the
contributions to the total EMF of different services (e.g. GSM base stations, FM broadcast,
etc.) to be monitored in the final result tables. Since during the measurement process the
acquired data are compressed to one resulting figure for each measurement packet, defining
logically separate packets allows an easy identification of their contributions to the total EMF.
The Editor for the Measurement Packet is opened via the selection dialog for Measurement Packet
(main menu entry Configuration à Packet...). The settings to be entered in order to define system
operation are organized in four different tabs which will be described in the following.
*
TS-EMF
For the TS-EMF system, only three of these tabs will be displayed, as the
available measurement axes are defined and there is no need for defining
axis-dependent measurement parameters. Differences will be explicitly
noted throughout the following description.
Additionally, two general elements are contained in this dialog:
Text field Description
This text field allows to enter any description of the measurement packet. This description is considered as a comment but is useful for a later identification and explanation.
Button Close
Clicking on this button causes all the setups to be stored and the dialog will be closed. Before saving
the data, they are checked for consistency. Among others, the measurement frequency range is
tested to be covered in full extent by the selected correction tables (antenna and cable). In case any
inconsistency is detected, an error message will be displayed and the dialog can not be closed until all
mismatches are corrected.
27
E-1
User Manual RFEX
User Interface
3.5.1 Measurement Sequence Tab
This tab will not be displayed for the TS-EMF system. Instead, the three parameters Cable,
Reference Level and Input Attenuation will be included only once for all measurement axes in other
tabs of this dialog.
Check boxes Horizontal and Vertical
The state of these boxes defines whether the system is to perform measurements in horizontal and
vertical polarisations. Only if the corresponding box is checked, the associated selection boxes (for
antenna, cable etc.) can be accessed.
For the TS-EMF system, these boxes are not needed as the three axes of the isotropic probe will
always be measured in sequence.
Selection boxes Antenna
These selection boxes are used to choose the antennas which shall be used during the measurement.
All available files of type Antenna are listed. The antenna factors contained in the selected file will be
used for correcting the spectrum analyzer’s reading (raw data).
For the TS-EMF system, these boxes are not needed, as the single antenna factor tables for the triaxis probe are defined internally to have the fixed names Probe X, Probe Y and Probe Z.
28
E-1
User Manual RFEX
User Interface
Selection boxes Cable
These selection boxes are used to choose the tables containing the cable loss of the measurement
setup. All available files of type Cable are listed. The cable loss contained in the selected file will be
used for correcting the spectrum analyzer’s reading (raw data).
For the TS-EMF system only one box is needed as the three axes of the isotropic probe are
connected to the analyzer’s input through the same cable. The box is included in the Data Acquisition
parameter tab. Only two pre-defined cables are available in this case:
• 0m Cable:
no cable, the probe cable is included in the antenna factor.
•
TS-EMFZ2:
8m extension cable, available as option TS-EMFZ2.
Selection boxes Switch Path
These boxes are used to select the switch path to be set at the switch unit in order to connect a
specific the antenna to the input of the spectrum analyzer. All switch paths defined in the switch unit
section of the hardware configuration dialog (see section 3.4.2) are listed.
For the TS-EMF system, these boxes are not needed as the three axes of the isotropic probe are
switched through a USB port and no additional configuration information is needed for this.
Selection boxes Input Attenuation
These boxes are used to define the input attenuation to be set at the spectrum analyzer. This
parameter can be individually selected for horizontal and vertical polarisation, because the different
nature of the signals to be measured as well as the influence of the antenna and of the measurement
environment can lead to significantly different levels for different polarisations.
For the TS-EMF system, only one box is needed as the voltages induced in the three axes of the
isotropic probe are measured with identical analyzer settings. The box is included in the Spectrum
Analyzer settings tab.
Text fields Reference Level
These text fields are used to enter the reference level in dBµV to be set at the spectrum analyzer. A
suitable value can be determined by a manual test or with the help of RFEX Overview Sweep utility.
If the so called Learning Phase (see section 5.1.4) is activated, the values specified for Input Attenuation and Reference Level are taken as start values for this learning phase. The actual settings for both
parameters are automatically evaluated during the learning phase.
For the TS-EMF system, only one of these fields is needed as the voltages induced in the three axes
of the isotropic probe are measured with identical analyzer settings. The field is included in the
Spectrum Analyzer settings tab.
29
E-1
User Manual RFEX
User Interface
3.5.2 Spectrum Analyzer Tab
Selection box Resolution BW
This box is used to select the resolution bandwidth of the spectrum analyzer. This is an important
parameter since it strongly influences measurement speed and measurement resolution.
The standard resolution bandwidths from 3 kHz to 1 MHz are available. Additionally, a special
bandwidth of 200 kHz can be selected, but can only be set on the FSH3 from firmware version 5.0 on
and if firmware option FSH-K1 is installed. For all analyzers except the FSH3, the bandwidths 5 MHz
and 10 MHz are available, too. The 5 MHz bandwidth is implemented as a Channel Filter; if it is not
available at the instrument, 10 MHz will be set.
Selection box Video BW
This box is used to specify the video bandwidth to be set at the spectrum analyzer. Since this
parameter only serves to smoothen the display of the measured spectrum, it is recommended to
select the mode Coupled. Then the video bandwidth will be automatically set in relation to the
resolution bandwidth.
This parameter is not included for the TS-EMF system, video bandwidth will always be coupled to
resolution bandwidth.
30
E-1
User Manual RFEX
User Interface
Selection box Trace Mode
This box is used to define which trace mode is set at the spectrum analyzer.
• MaxHold means, that the spectrum analyzer, when performing several sweeps, shows the
maximum level evaluated at each frequency point.
• Average means that the spectrum analyzer displays the average value for all frequency
points.
• ClearWrite means that for each sweep the previous data are deleted and only the
measurement of the actual sweep shown.
When performing a Peak/Average measurement or a long-term measurement, frequency sweeps are
done several times and the peak (MaxHold) and average values are determined by RFEX. Therefore,
it is recommended to use the ClearWrite setting for the analyzer. Especially when measuring digitally
modulated signals (pulsed signals), it is recommended to use the MaxHold function for fast measurements (only one sweep performed with dwell time set to zero). This may result in a kind of overrated
value but ensures that the pulsed signal is reliably detected. If the dwell time is selected as a multiple
of the sweep time then the Average function can be used. This way the average value of a pulsed
signal is shown.
Check box RMS Detector
If this box is selected, the RMS detector is selected at the spectrum analyzer. Otherwise the MaxPeak
detector will be used. It is recommended to use the RMS detector if pulsed signals with a low duty
cycle, like e.g. digital mobile phone signals, have to be measured, as these signals would be overrated
by using MaxPeak detector.
*
TS-EMF
For the TS-EMF system, the Spectrum Analyzer tab looks as displayed on
the next page. As mentioned in section 3.5.1, the parameters Reference
Level and Input Attenuation are included here. Additionally, the parameters described on the next page are implemented only for use with the TSEMF (analyzer model FSH3).
31
E-1
User Manual RFEX
User Interface
Check box Switch Pre-Amplifier ON
If this box is checked, the 20 dB pre-amplifier will be switched on at the FSH3. This is only possible if
the FSH3 has a pre-amplifier (model 23) and firmware option FSH-K1 is installed.
Check box Channel Power Measurement
If this box is checked, the FSH3 will be set to do a channel power measurement instead of a normal
frequency sweep. This may be useful if the bandwidth of the signal to be measured is broader than the
maximum bandwidth of the FSH3 (1 MHz). This is the case, for example, for UMTS signals (3.84
MHz). As the other analyzers feature a bandwidth of 10 MHz, this setting is not necessary there.
Text field Channel bandwidth
If a Channel power Measurement has been activated, the channel width to be scanned can be entered
as additional parameter. It is recommended (see manual of the FSH3) to set the resolution bandwidth
to maximum 10% of this channel bandwidth.
32
E-1
User Manual RFEX
User Interface
3.5.3 Measurement Frequencies Tab
One of the essential settings which are done in the measurement packet is the definition of the
frequency points, where the measurements should be performed. Moreover, RFEX implemets two
different modes for the measurement: a mode which is based on a channel pattern and a mode which
searches the maximum levels in the measured frequency range.
G
Attention !
No measurement packet can be saved without defining a suitable set of measurement frequencies.
Option Known channel pattern
If this mode is selected, the measurement frequencies are defined with equidistant spacing. A typical
application is the measurement of mobile communication services (for example GSM), where the
channels are defined in a known channel spacing.
The frequencies are defined in the Measurement Frequencies dialog, which is opened by clicking on
the button Frequency list.... See section 3.5.3.1.
In this case, the measurement is performed as follows: The complete frequency range to be measured
by the spectrum analyzer is divided into stripes ("channels") of the same width, and the frequencies
defined in the list are taken as channel centre frequencies. The maximum measurement value in each
channel will be used for further processing.
33
E-1
User Manual RFEX
User Interface
Only when selecting this frequency list mode, the parameter Channels per sub-packet defined in the
Data Acquisition tab will be taken into account; see section 3.5.4 for details.
Additionally, the width of such a signal channel can be specified more closely:
•
Option Channel width = RBW
RBW stands for the resolution bandwidth set at the spectrum analyzer. Selecting this option
means that only the signals immediately adjacent (covering a total of one RBW) to the
channel’s centre frequency will be considered when evaluating the channel’s maximum signal
level. If two channel frequencies are defined in a way that both channels do not intersect,
there will be gaps in the overall spectrum which will not be taken into account when assigning
their peak levels.
•
Option Channel width = Half distance to adjacent channel
In this case the channel is calculated to cover half of the gap to the neighbouring frequency.
As the adjacent channel is calculated in the same manner, all frequencies in the packet will be
taken into account during level evaluation. Signals may be assigned to a channel even if they
are not in the centre frequency’s immediate proximity.
Option Sweep with Peak search
If the measurement frequencies are not expected to appear in a pattern with equidistant spacing but
are expected to appear in any order, then the mode Sweep with Peak Search should be used. A
typical application are measurements in the frequency range below 30 MHz. In this frequency range a
lot of transmitters can be found with arbitrary distribution.
To define the measurement frequencies for this mode, the button Sweep Definition... is selected; see
section 3.5.3.2.
In the sweep mode the measurement is done for the specified frequency range. The result data are
analyzed for the maximum peaks with a number of n (n can be selected). The amount of n peaks is
stored for further processing.
3.5.3.1
Measurement Frequencies Dialog
If the option Known Channel Pattern is been selected in the Measurement Frequencies tab, the
definition of the measurement frequencies is done by a table containing the desired frequency values:
To support the generation of the table, an editor is
available which is almost identical to the one in section
3.3. In this case only one row is necessary showing the
frequency values.
An additional button Channel generator... is available
which opens an additional dialog. This enables the
user to generate or delete a list of frequencies in a fast
and easy way. See next page.
34
E-1
User Manual RFEX
User Interface
Clicking on the button Generate channels adds
frequencies to the list. The list will cover the range
from the start frequency up to the stop frequency
with the given step width.
Clicking on the button Delete channels will delete all
frequencies from start frequency to stop frequency,
accordingly. Frequency values which do not match
the specified frequency steps are not deleted!
3.5.3.2
Sweep Definition Dialog
If the option Sweep with Peak search is been selected in the Measurement Frequencies tab, a
frequency range to sweep across has to be defined:
The range to sweep is defined from the Start and
Stop Frequency text fields.
For spectrum evaluation, two additional text fields
are implemented. The first one defines the Number
of Peaks which shall kept from the spectrum recorded from the sweep. The number of peaks equals
the amount of measurements values resulting from
one sweep.
For determining what shall be considered a peak, the parameter Bandwidth for Peak Reduction is
defined. This value gives the minimum distance two peaks should have to be considered as different
ones. Thus, it can be avoided to keep more than one frequency value associated to one broad peak.
During the later step of measurement result compression, this parameter is also used to identify the
frequencies which belong together. All peaks with a frequency not differing from each other more than
this bandwidth parameter are identified to belong together. This ensures that a slight deviation of the
peak frequency (e.g. caused by instability of the transmitter, atmospheric influences, or the fact that
the transmitter delivers a broadband signal in comparison to the selected bandwidth of the analyzer)
dos not lead to redundant measurement values.
35
E-1
User Manual RFEX
User Interface
3.5.4 Data Acquisition Tab
*
TS-EMF
For the TS-EMF system, the parameter Cable, which in the general case
is included in the Measurement Sequence tab, is additionally included
here.
Text field Channels per Sub-packet
This parameter is only taken into account if the option Known Channel Pattern is selected in the
Measurement frequencies tab, see section 3.5.3.
During a measurement in the Known Channel Pattern mode, the complete frequency range is not
covered by one sweep. Instead the frequency range will usually be divided into smaller ranges ("sub
packets") to ensure that each measurement channel is recorded with a sufficient amount of pixels
(analyzer screen resolution). This text field allows to select the number of channels which should be
recorded in one sub-packet. The channel width corresponds to the selected resolution bandwidth at
the spectrum analyzer.
Please note the following: The less channels are defined in the sub-packet, the better the resolution of
the measured spectrum will be (more pixels are available per channel). But this also increases the
amount of sub-packets to be measured (requires frequent setting of the spectrum analyzer, hence
increases the measurement time).
36
E-1
User Manual RFEX
User Interface
In detail, the RFEX proceeds as follows: the frequency range for a sub-packet equals to the product of
the amount of channels and the resolution bandwidth. Suppose e.g. that a frequency range from 935
to 960 MHz shall be measured at a bandwidth of 100 kHz and with 20 channels per sub-packet. This
results in sub-packets with 2 MHz (20 times 100 kHz) sweep range each. Therefore, the complete
frequency range is divided in 13 sub-packets (the last one being somewhat smaller than 2 MHz).
During the measurement each sub-packet is extended by half the measurement bandwidth on both
ends to ensure that the start frequency and the stop frequency are correctly recorded correctly (with
half a bandwidth overlap).
The maximum amount of channels depends on the spectrum analyzer model: For the FSx and ESPI
devices, which by default have 501 pixels trace resolution on screen, the maximum number of
channels is 250; with a resolution bandwidth of 100 kHz, the sweep will cover 25.1 MHz. For the FSH3
with 301 pixels, the maximum number of channels is 150. In both cases, this results in a minimum of 2
pixels for each frequency to be measured..
Text field Dwell time
This text field allows to enter the time which will be waited for to read the trace data from the spectrum
analyzer after a sub-packet has been started. The time is entered in milliseconds.
By default, the sweep time is automatically set by the spectrum analyzer (coupled to the selected band
width). RFEX queries the sweep time set by the analyzer and the Dwell Time set in the RFEX software
will be 1.5 times this value. If the dwell time set in the RFEX software is bigger than the sweep time of
the spectrum analyzer, then the analyzer will perform multiple sweeps. This setting should be selected
when using the trace mode MaxHold for the analyzer. Generally, 100 ms is assumed to be the lowest
limit for the analyzer sweep time.
Check box Use dwell time as Analyzer sweep time
If this box is checked, the dwell time defined above will be used as the analyzer sweep time. Thus it is
possible to force the analyzer to do slow sweeps. This can be necessary, for example, for evaluating
traffic channels on TDMA mobile phone system (e.g. GSM) with sufficient measurement time.
Text field Extrapolation Factor
This field is used for entering a correction factor in dB which will be added to the measured level. This
can be necessary, for example, if the potential maximal emission level of a base station can only be
theoretically evaluated based on a known current partial load.
Text field Acceptance threshold
One of the main features of RFEX is its ability of data reduction. The amount of data ignored is mainly
determined by the Acceptance threshold parameter, which because of this is one of the most critical
parameters in a measurement packet. This threshold value defines a radiation level below which any
measured field level will be ignored. It is very important to set this parameter in a way that it is neither
too high (would lead to too low an EMF value being measured) nor too low (would lead to the
analyzer’s noise floor to be evaluated as radiation).
The acceptance threshold is not applied directly to the results read from the analyzer, but to the values
calculated after correcting the analyzer data by the measurement antenna factor and the cable loss.
The threshold can be defined to be used in two different ways:
•
Option absolute
In this case the threshold is considered to be an absolute value with unit dBµV/m. All
measurement results below this threshold will be ignored from data reduction on.
37
E-1
User Manual RFEX
•
User Interface
Option relative to max. level
In this case, the maximum level in the result file to be compressed is determined before the
compression step. The threshold is relative to this maximum level. All measurement results
with a value below the found maximum minus this relative value will be ignored from data
reduction on.
For the final result this leads to two consequences: if the measured spectrum shows a clear
maximum, only this value will be kept. If the measurement does not show a maximum, but a
more or less stable noise floor, all measured values will be kept and the final result will
correspond to the integral of these noise signals.
As the threshold is applied for reducing the data after correcting the raw data for antenna factor and
cable attenuation, it can not directly be correlated to the noise floor of the analyzer. Therefore, finding
a suitable threshold level can be a relatively difficult task. In order to support the user for this task, the
measurement function Threshold Calibration (see section 5.2.1) has been implemented.
38
E-1
User Manual RFEX
User Interface
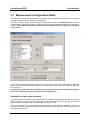
3.6 Editor for UMTS Measurement Packets
If any of the options TSEMF-US1 or TSEMF-US2 enabling measurements on W-CDMA base stations
with channel decoding is available, an additional entry Configuration à Umts Packet is added to the
main menu of RFEX. Selecting this entry leads to a special editor for UMTS measurement packets:
As can be seen at first sight, UMTS measurements require much less parameters to be defined than
standard measurements. This is because the UMTS software options configure most of the spectrum
analyzer parameters automatically.
All control elements contained in the editor for UMTS measurement packets have already been
described in section 3.5. please see there for a detailed reference.
G
Attention !
During measurements on UMTS base stations, RFEX will try to find W-CDMA
signals at all of the frequencies entered in the frequency list. If no base station is
found at one frequency, a timeout will not be generated and the sequence will not
proceed until after some seconds. This will considerably slow down the measurement!
Please make sure to enter only frequencies on which a base station nearby is
known to be active!
39
E-1
User Manual RFEX
User Interface
3.7 Measurement Configuration Editor
The task of the editor for Measurements is to combine all the measurement packets, which should be
cyclically executed during a long-term measurement.
The editor is opened by the selection dialog for measurements (main menu Measurement). Each time
a measurement shall be performed, the editor is be opened and measurement start must explicitly be
confirmed: No measurement can be started before the measurement configuration is displayed
on the screen.
When saving a measurement configuration, not only the names of the used measurement packets are
saved, but all the setup parameters (except the measurement frequencies) are saved as well. See
also section 4.2.
This procedure guarantees that all setups are stored which have been used for data acquisition
even if the measurement packet is going to be changed later on.
Description of the control elements
The basic feature of the editor are two lists to show the available measurement packets and the ones
which should be executed. The two buttons with the arrow symbol are used to register (arrow left to
right) a packet for measurement or to de-register (arrow right to left).
Each of the packets only can be selected once and therefore each packet is available in only one of
both lists. During the measurement the measurement packets are performed in the same sequence as
they have been selected.
40
E-1
User Manual RFEX
User Interface
Button Details...
In the list, the measurement packets are only identified by name. The two buttons Details offer the
possibility to view their content without leaving this editor and opening another editor for measurement
packet. Selecting one of the buttons opens an additional window which shows a summary of the
settings of the selected measurement packet. Before selecting one of two buttons a measurement
packet must have been selected; otherwise the two buttons are not active.
Check box UMTS packets
If any of the options TSEMF-US1 or TSEMF-US2 enabling measurements on W-CDMA base stations
with channel decoding is available, the measurement configuration editor will additionally display this
box. If it is checked, the list of available measurement packets is re-built to contain only the packets for
UMTS measurements generated with the editor for UMTS packets, see section 3.6.
Selection box Change Polarisation
This text field defines in which sequence the measurements are performed concerning the antennas
and horizontal/vertical polarisation.
• After every Sub-Packet means that the switching of the antenna switching unit is done every
time when the measurement of a sub-packet is finished. This selection is useful for systems
using the same antenna for horizontal and vertical polarisation. This case no switching is done
and the spectrum analyzer can keep the same settings which optimizes the measurement
sequence.
• After every Measurement Packet will switch the polarisation after completion of a
measurement packet. If the measurement packet only contains one configuration, no switching will be performed. This selection is used as default.
• After every Run will complete the whole measurement packet sequence before the
polarisation is switched. This selection is the best solution if there is no automatic switching
unit available and the switching has to be done manually.
*
TS-EMF
For the TS-EMF system, the selection in this box is always fixed to After
every Sub-Packet. As a consequence, the field is measured at the three
axes of the isotropic field probe directly in sequence, and the measured (and
corrected) values are geometrically added immediately afterwards.
Selection Box Limit Line
This selection box shows the different limit lines, which can be selected during compression of the
measurement data. If a limit line is selected, measurement data can be represented as values per
thousand of the limit. However, it is also possible not to select a limit line and save the measurement
values in a field strength or a power flux density unit; see section 3.8 for details.
Button Start Measurement
Clicking on this button saves the settings, closes the dialog and starts the measurement. Before
saving, the given data are checked for consistency. At least one measurement packet must have be
selected. If the measurement times have not been defined before (clicking on Measurement
Times...), the dialog for the definition of the measurement times will be opened, too.
Button Close
Clicking on this button saves the settings and closes the dialog. Before saving, the given data are
checked for consistency and an error message is generated if applicable.
41
E-1
User Manual RFEX
User Interface
Button Measurement Times...
Clicking on of this button starts the dialog for defining the measurement times. In case of a single
measurement this button is not available, since the measurement packet sequence is only executed
once.
In case of a measurement in the minute range (data accumulation with Peak/Average representation)
this dialog is used to define how the measurement iteration shall proceed.
Either the measurement can be defined to take place over a certain time lapse between 0 and 30
seconds, where 0 means that the selected packets are executed exactly once.
Or the measurement can be defined to take place over a range of points. In this case, after the end of
each loop over all packets, the user is prompted to place the probe at the next measurement location
or to finish the test.
In case of a long-term measurement, which basically is not more than a sequence of peak/average
measurements in the minute range, two time factors have to be defined. The first factor is the cycle
length (from 0 to 30 minutes as described above). The second factor is the start and stop time for the
overall measurement. To do this, several fields are foreseen to specify the time together with the date
for the start and stop of the measurement. Default values are selected in a way that the measurement
starts within two minutes after opening of the dialog and ends in one hour.
42
E-1
User Manual RFEX
User Interface
3.8 Options Dialog
The options dialog is opened clicking on the main menu entry System à Options… It allows the user
to set a range of parameters configuring the measurement run and the extent of the reports.
3.8.1 Measurement Tab
Check box Save Measurement Log
If this box is checked, the contents of the measurement log list box, which during the test run shows
the current activity, will be saved to a file. See also section 4.3.4.
Check box Save Raw Data
If this box is checked, the temporary data files generated during a test run will not be deleted after
data compression has been completed, but will be renamed and kept. See also section 4.3.
43
E-1
User Manual RFEX
User Interface
Check box Do Learning Phase
If this box is checked, the so called learning phase will be executed before starting the real
measurement. The aim is to find the best setting for the spectrum analyzer’s reference level and input
attenuation automatically, in order to make sure there will be no overload condition at the analyzer
during the test. See also section 5.1.4.
This check box is not available with the TS-EMF system as the FSH3 analyzer’s input attenuation can
not be set independently.
Check box Automatically continue last long-term measurement on startup
If this box is checked, RFEX will automatically load and continue the last long-term measurement
which had been executed before closing the application. The consistency of the measurement
configuration, the availability of the selected measurement packets and the controllability of the
configured instruments are checked as usual before starting the new test run, but the user does not
need to click even once after starting RFEX.
The length of the test run started automatically is defined by the next parameter.
Selection box Measure for
This box is enabled only if the automatic continuation of the last long-term measurement has been
enabled (see previous parameter). It allows to define how long such an automatically started
measurement shall last. Available selections are: One hour, One day, One week and One month.
Selection box Unit for long-term measurement results
In earlier version of RFEX, long-term result files always contained three data columns giving the
measured data in three different units.
This is considered to be redundant. Also, it is now possible to perform measurements and evaluate
the data without referring them to a limit line, which makes it impossible to save the data in this format,
as was done previously.
Hence, one single unit for saving long-term measurement data must be selected. The available units
are grouped by the magnitude they represent. Possible selections are
•
field strength units V/m and dBµV/m,
•
power density units µW/cm², W/m² and µW/m²,
•
and values relative to a limit line in thousands (o/oo) or hundreds (o/o) of the limit
Power density units are always saved in a scientific format with at least three significant digits.
Therefore, in this case field values different from zero will be saved even if the field is so low that the
values in field strength units or relative to the limit would give a zero.
If a unit relative to the limit is selected, but the measurement is done without selecting a limit line, data
will be saved in the default unit of V/m.
44
E-1
User Manual RFEX
User Interface
3.8.2 Report Tab
In this tab, the configuration of the reports generated by RFEX in Excel worksheet format can be
parameterized. For detailed information about reports see section 4.4.
Selection box field Table column configuration
The report generated by RFEX for single and peak/average measurements can be freely configured
with the help of these boxes. The only fixed features of the report are:
•
The first column will display the frequency in MHz.
•
The second column for UMTS measurements will display the scrambling code of the identified
base stations.
•
At least a third column containing the measured field must be defined
The rest of the report contents, i.e. how many columns shall be generated, and which shall be the unit
of each column, can be set by the user.
The field contains a column of check boxes on the leftmost side. Selecting one of these boxes will
enable the rest of the row enabling the user to select a unit for displaying the measurement results.
45
E-1
User Manual RFEX
User Interface
Unit selection is done the same way as described for the long-term measurement unit in the previous
section, i.e., first the applicable physical magnitude (field strength, power density or parts of the limit)
is chosen, and then one of the units defined for this magnitude can be selected.
Selection box Packet Settings in Report
This option is used to define the extent of the measurement packet settings to be included in a report
for single and peak/average measurements. Do not include settings stands for no parameters at all
to be included in the report, whereas Include settings will lead to all settings of the packet being
printed to the report after the data table. Include frequencies as well will be available in a future
release and will lead to the list of measurement frequencies being added to the report as well.
Selection box Scrambling Code Format
This box is displayed only if any of the options TSEMF-US1 or TSEMF-US2 enabling measurements
on W-CDMA base stations with channel decoding is available. As several base stations of a provider
will be emitting on the same W-CDMA frequency, an additional characteristic parameter is needed to
distinguish between them; this additional information is the base station’s scrambling code, which will
always be added to a report generated for a UMTS measurement.
This selection box allows to define if the full scrambling code number shall be added to the report, or if
the short format obtained from dividing the full code number by 16 is preferred.
46
E-1
User Manual RFEX
4
File System
File System
This chapter describes the directory structure and the files created on the computer’s hard disk by
RFEX during installation and execution. Detailed information is supplied about where to find result files
and reports and how they are formatted. Main intention is to enable the user to efficiently document
his measurements and to define his needs for backing up all files he considers necessary.
4.1 Directory Structure
All the files generated by RFEX are kept in a fixed directory structure, which originates from the
installation directory defined by the user during installation. The file structure is as follows:
Directory
Sub-Directories
Content
Installation directory
\ Application
\ Data
Executable program
Rfex.ini: main initialisation file
\ Antennas
Configuration files: Correction tables and
definition of measurement packets
\ Limits
\ Cables
\ Packets
\ Measures
\ Single
Measurement configurations and results
\ PeakAver
\ LongTerm
\ Reports
Excel-Files with measurement results
If not yet available, the sub-directories are created automatically during the first run of RFEX.
All files except the report files, which are generated in Excel format, are readable files in ASCII format.
The format of configuration files is similar to the format of Windows initialisation files.
Tables and measurement data are stored with descriptive column headers including a unit string if
applicable. The measurement results are lined up in rows with the data fields separated by tab characters. This format allows to import the files into any other application by choosing the tab character as
field separation.
G
Attention !
RFEX generates measurement result files and Excel sheets. These files are not
managed further on, particularly there is no automatic backup feature. If a backup
of the measurement data and other files is required, it must be performed from
outside the RFEX application, for example by using the Windows-Explorer.
It is recommended to do regular backups and to clean up the directories containing the measurement
data, especially if the option Save Raw Data (see section 3.8.1) is active.
47
E-1
User Manual RFEX
File System
4.2 Configuration Data
Configuration data are always saved in ASCII format. They can be opened with any editor, for
example the Windows Notepad utility.
Rfex.ini
This file is used for saving, in a format similar to the format of Windows initialization files, settings
defined in the Hardware Configuration dialog (see section 3.4) and the Options dialog (see section
3.8).
Data Tables
Data tables contain measurement correction factors. The following types are known to RFEX:
•
Antenna Gain Factors. Stored in Data \ Antennas. Named *.Antenna
•
Cable Correction Factors. Stored in Data \ Cables. Named *.Cable
•
Limit Lines. Stored in Data \ Limits. Named *.Limit
All these tables are stored as two-column tables mapping the format of the associated table editors
(see section 3.3). The first column gives frequency values in MHz, the second column contains the
associated level values. A header section contains column and unit descriptions as strings.
Measurement Packet Definitions
Measurement packets are edited within RFEX with the Measurement Packet editor (see section 3.5).
All settings entered in this dialog will be saved to a file ending with the extension *.Packet in the
directory Data \ Packets. The format corresponds to a Windows initialization file.
Measurement Configurations
Measurement configuration files are generated when closing the Measurement Configuration editor
(see section 3.6). At that point, the following information is stored to these files:
•
Number and names of the measurement packets selected for the measurement.
•
For each selected measurement packet, a separate section is generated containing a copy of
the packet file itself, except the measurement frequency data.
•
Settings in the Measurement Times dialog. These depend on the type of measurement being
performed.
•
Limit line and antenna switching scheme selected for the measurement.
During the measurement run, test execution start and stop times as well as the number of measured
loops (in the case of peak/average measurement) will also be saved to this file.
Saving a copy of the measurement packets will allow to trace the measurement results to the original
settings in the packets, even if the packet itself is modified later on. Only the definition for the
measurement frequencies will in any case be extracted from the packet itself.
Measurement configuration files are saved to the different sub-directories in the \Measures directory,
and are defined to have different file name extensions: *.Single for single measurements, *.PkAv for
peak/average measurements and *.LongTerm for long-term evaluations. The format always
corresponds to a Windows initialization file.
48
E-1
User Manual RFEX
File System
4.3 Measurement Results
Measurement results are always saved in ASCII format. They can be opened with any editor, for
example the Windows Notepad utility.
The format, the contents and the directory where to save the measurement result files, depend on the
type of the measurement. In order to understand the contents of the different files, a good understanding of the measurement procedures and of how the different measurement types are related to each
other is recommendable. See chapter 5 for details on the measurements.
4.3.1 Single Measurements
Single measurement result files are saved, together with their corresponding measurement configuration files in the Measures \ Single directory.
During a single measurement, RFEX drives the system in order to acquire one set of measurement
data (one value for each measurement frequency) for each selected polarization for each packet.
Immediately after acquisition, the value defined as extrapolation factor in the measurement packet is
added to each measurement value.
These extrapolated data are saved as raw data to a file called <Measurement>.Raw
<Measurement> stands for the name given to this measurement when selecting it.
where
After the sweep has been completed for all measurement packets, these raw data are corrected for
the antenna factors and the cables attenuations associated to each polarization in the measurement
packet editor. The next step consists in compressing the data by comparing the values against the
acceptance threshold defined in the measurement packet. Only if the value for at least one
polarization exceeds the acceptance threshold, the measured data at the associated frequency will be
considered from here on.
The values obtained from this compression step are saved to a file called <Measurement>.Result.
Finally, the vector sum (root of the sum of square values) of the values obtained for each polarization
is performed, in order to evaluate the equivalent field strength in V/m. These sums then are saved to
the final result file for a single measurement, named <Measurement>.Compressed.
According to the procedure described, this final result file contains one line for each frequency at
which a significant field component (higher than the acceptance threshold) has been detected. Each
line contains, in this order, four fields: Name of the measurement packet, time and date of data
acquisition, frequency and equivalent field in V/m.
*
TS-EMF
For the TS-EMF system, the above steps are performed in a little different order.
Due to fact that with the tri-axis probe no explicit polarization selection is available,
all three axes of the probe will sequentially be activated and the corresponding
levels be evaluated.
Therefore, after adding the extrapolation factor, the measured data will first be
corrected for their antenna factors (one for each axis) and then immediately added
geometrically (root of sum of squares). Hence, <Measurement>.Raw will contain
only one value per frequency, this value already being corrected for the antenna
factors and being the vector sum of all three field components.
Correspondingly, also <Measurement>.Result, obtained after correcting the cable
attenuation and compressing the data, will show only one value for each frequency.
In this case, the total equivalent field values instead of each single polarization
component will be taken into account when compressing the data against the
acceptance threshold.
If the option Save Raw Data is selected in the Options dialog (see section 3.8), the intermediate files
<Measurement>.Raw and <Measurement>.Result will not be deleted after the measurement.
49
E-1
User Manual RFEX
File System
4.3.2 Peak/Average Measurements
Peak/Average measurement result files are saved, together with their corresponding measurement
configuration files in the Measures \ PeakAver directory.
During a peak/average measurement, the system is driven in exactly the same way as during a single
measurement, with the exception that after one measurement has been performed for all selected
packets, the same measurement sequence is started again, cyclically, until the measurement time
defined before starting the run has been completed.
The measurement data are saved to raw data files in the same manner as during a single
measurement. However, as more than one test run will be done, raw data files are saved with an
additional suffix in their name extension, they will be saved as <Measurement>.Raw.i where i is a
number starting at 0 and increasing one unit each time a measurement loop is completed.
The contents of the raw data files obviously are the same as in the case of the single measurement,
being different for a standard system and for the TS-EMF system (already corrected for antenna
factors and added geometrically).
After each measurement cycle, the data are accumulated. On the one hand, they are added to the
sum of all previous measurements, on the other hand, the maximum value for each measurement
frequency is kept in a different file.
After the measurement time is completed, the values in the first accumulated file (containing the sum
of all measured data for each frequency) are divided by the total number of loops performed; this will
then give the average value over all loops for each frequency. The second file will contain the peak
value detected for each frequency during the whole measurement time.
These temporary files are called <Measurement>.Average.All and <Measurement>.Peak.All.
The values in these files will be corrected for antenna factors and cable attenuations, just as in the
case of a single measurement, then be compressed by comparing them to the acceptance threshold
defined in each measurement packet, and finally added geometrically. (For the TS-EMF system,
antenna factor correction and geometrical sum have already been done on the raw data).
In the end, two result files will be generated: <Measurement>.Average.Compressed and
<Measurement>.Peak.Compressed, containing the average and the peak values of the equivalent
field strength measured during the defined time interval. The format is the same as in the case of the
final result for a single measurement, only the data do not arise from one single run, but are the
accumulation (peak and average values) of a number of test runs during a given measurement time.
If the option Save Raw Data is selected in the Options dialog (see section 3.8), the intermediate files
<Measurement>.Raw.i, <Measurement>.Average.All and <Measurement>.Peak.All will not be deleted
after the measurement.
4.3.3 Long-term Measurements
Long-term measurement result files are saved, together with their corresponding measurement configuration files in the Measures \ LongTerm directory. Due to the potentially large quantity of raw
data, these will not be saved to the main directory, but to sub-directories having the same name as
given to the measurement.
A long-term measurement consists in repeating peak/average measurement cycles during a certain
time, which is defined in terms of a start and a stop time. Its total duration is arbitrary and may last for
weeks or theoretically for months.
After each peak/average cycle, the same files as described in the last section have been generated. If
the option Save Raw Data is selected in the Options dialog (see section 3.8), the temporary
peak/average result files are renamed to <Measurement>.Raw.i.j, <Measurement>.Average.j and
<Measurement>.Peak.j, where j is a number starting at 0 and increasing one unit each time a
peak/average cycle is completed. These files are moved to a sub-directory Measures \ LongTerm \
<Measurement>.
50
E-1
User Manual RFEX
File System
The final result of a long-term measurement is a series of files containing one line for each measurement packet for each completed peak/average cycle. For generating this line, all result lines from the
average result file of an peak/average cycle (<Measurement>.Average.j) and corresponding to a this
packet, will be combined together to give one single average value. Also, all result lines from the peak
result file and corresponding to the same measurement packet (<Measurement>.Peak.j) will be
combined to give one single peak value. Finally, the maximum value contained in the peak result file
will also be saved as the one single maximum result for the corresponding packet.
In conclusion, this final result file will contain lines made up by the packet name, a date and time
stamp, an average emission value, a total peak value (average of peaks) and a single maximum
emission value. If a GPS receiver is used (see section 3.4.5), an additional field containing the
geographic position read out from this device at the end of the peak/average cycle will be added at the
end of the line.
The above description shows how a long-term final result file is generated. However, more than one
file is generated for such a measurement: It is said above that all average values will be “combined” to
give one total value corresponding to a packet. This combination takes place in different ways,
resulting in different values which are saved to different files:
•
<Measurement>.Square.FinalResult is generated combining single values by adding the
square values of the single field strength contributions. This method allows direct comparisons
of the total value with the limit line defined acc. to ICNIRP (International Committee on NonIonizing Radiation Protection), condition 9.
•
<Measurement>.Linear.FinalResult is generated taking the linear sum of the field strength
values. This can directly be compared to the ICNIRP condition 7, defined for fields with a
frequency up to 10 MHz. Hence, this file is created only if any measurement frequency below
10 MHz is defined in the measurement packet.
•
<Measurement>.Rms.FinalResult is generated extracting the square root of the above sum
of square field strength values. This Root Mean Square value is very popular among
engineers doing EMF measurement.
But there is still more: If a long-term measurement lasts more than a day, one series of result files will
be generated for each day during which the measurement was active. This is done by renaming the
current files <Measurement>.*.FinalResult to <Measurement>.yyyymmdd.*.FinalResult where
yyyymmdd represents the date of the just finished day.
For example, if a long-term measurement named MyTest is performed in the frequency range from 80
th
th
MHz to 3 GHz starting on February, 10 , 2004 and ending on February, 12 , 2004, the following files
will make up the result of this test:
•
MyTest.20040210.Square.FinalResult, MyTest.20040210.Rms.FinalResult
•
MyTest.20040211.Square.FinalResult, MyTest.20040211.Rms.FinalResult
•
MyTest.20040212.Square.FinalResult, MyTest.20040212.Rms.FinalResult
4.3.4 Measurement Log
If the option Save Measurement Log is selected in the Options dialog (see section 3.8.1) the content
of the measurement log window which displays the measurement progress on the RFEX main screen
will be saved to a file named <Measurement>.Log.
51
E-1
User Manual RFEX
File System
4.4 Reports
As a general principle, the test reports are formatted as Excel spreadsheets and contain the final
result as a table of values. Technically, an installed Excel program is driven by its software interface to
generate the report files. Therefore, Excel must be installed on the PC running RFEX in order to be
able to generate reports at all. If no Excel installation can be identified, report generation menu entries
are disabled. In this case, still the result files can be manually imported from any other application, as
they are ASCII formatted.
Additional information about the settings defined in the measurement packet(s) and graphics
displaying the most significant contributions to the total field strength will be added if appropriate and
configured by the user.
For single and peak/average measurements, the extent of the generated spreadsheet is mainly
defined by the settings in the Options dialog (see section 3.8.2).
Single Measurement
The measurement result for a single measurement will be displayed in an Excel spreadsheet as
follows:
•
One worksheet will be generated for each measurement packet defined in the measurement
configuration. The worksheet’s name will be the same as the packet’s name.
•
This worksheet contains
o
A title line, giving the packet name again.
o
A value table with one row for each frequency belonging to the packet present in the
single measurement’s result file <Measurement>.Compressed.
The number of columns and the units in which the values are displayed is defined by
the user in the Options dialog (see section 3.8.2).
•
o
Three or four summary values at the bottom of the table. The values are: the sum of
squares of all measured field strength contributions, the RMS value (root of sum of
squares), and, if there is any frequency below 10 MHz in the table, the linear sum of
the values measured below 10 MHz (see also the discussion of the final result files for
long-term measurements in section 4.3.3). The last value is the single maximum field
strength in the table.
o
If the user has selected to include the packet settings in the report (see section 3.8.2),
a number of lines follows, displaying textual information about the packet settings.
o
Finally, a graphic is generated, displaying the up to 30 biggest field strength values in
the table as columns over frequency.
A summary worksheet will be generated as first of all worksheets. It contains
o
A title section identifying the measurement as a whole.
o
If a GPS receiver was available during the measurement, the geographic position
queried from this device.
o
A table with the summary values of all single-packet worksheets.
o
A graphic containing all RMS summary values as columns over the packet names.
As a general principle, the summary values will be generated in units relative to the limit if a limit line
is selected for report generation. If no limit is selected, the first column in the table will be used for
summing up the values, and will hence define the unit of the summary values.
52
E-1
User Manual RFEX
File System
Peak/Average Measurement
As the result files for a peak/average measurement are basically the same as for a single
measurement, the Excel spreadsheet generated for such measurements will also be very similar to
the one for a single measurement. The only difference is that the contents of each worksheet will be
doubled: First, a result table and a graphic for the average results will be generated, and after these, a
table and a graphic for the peak values will be generated. The summary worksheet at the beginning
will also contain a table and a graph for the sums of the average values for all packets, and after that,
a table and a graph for the RMS sum of the peak values of each packet.
Long-Term Measurement
Although the measured data are compressed and only packet specific values are saved for long-term
measurements, these may still generate huge amounts of data. Correspondingly, the Excel spreadsheets generated as reports may also be quite big.
One spreadsheet will be generated for each type of final result file saved during the measurement,
where “type” refers to the result addition algorithm: square, RMS and possibly linear (see section
4.3.3). In other words, exporting long-term measurements will lead to two or three Excel files.
Each of these files contains:
•
One worksheet for each final result file saved for one day. That is, if the measurement has
lasted less than one day, the Excel file contains only one worksheet, if the measurement has
lasted longer, there will be one worksheet for each day.
•
Each worksheet will contain a table starting with a column containing the time and date stamp
saved to the final result file on compressing the peak/average cycle to three single values.
If the measurement was a UMTS base station measurement with channel decoding, a second
column containing the scrambling code of each identified base station is included.
A section follows with one column for each packet containing the average values from each
line in the final result file. The section is closed by a column in which all these average values
are summed up per line. Summation scheme corresponds to the scheme used for generating
the single values (linear sum for square and linear files, square root of the sum for RMS files).
The next section shows one column for each packet containing the peak values from each
line, the section also being closed by a summary column.
Finally, a third section contains the single maximum emission values.
If GPS data are available in all or part of the result lines, a column is added at the end with the
geographic position obtained from the GPS receiver when compressing the data at the end of
each peak/average cycle.
Please note that it may be possible that a certain packet shows no contribution for a certain time and
date stamp. In this case, the table will contain empty cells, defined by the columns associated to this
packet and the rows for the given time and date. Also, some GPS position cells may be empty if, for
example, the GPS receiver was not able to synchronize to the GPS system at a given moment.
G
Attention !
The amount of data originating from a long-term measurement may be huge.
Correspondingly, the time of generating the Excel spreadsheets displaying all
these data may also be quite long. It is not uncommon that generating a long-term
report may take some minutes of time.
53
E-1
User Manual RFEX
5
Measurement Procedures
Measurement Procedures
This chapter deals with the measurement procedures implemented in RFEX.
Section 5.1 describes the procedures implementing real EMF tests with which to evaluate the RF
emission in the environment. Three of these procedures are available, namely Single measurement,
Peak/Average measurement and Long-Term measurement. They can be thought of building a
hierarchy in which each upper level makes use of the lower levels, executing them in a meaningful
sequence.
Section 5.2 describes other measurement procedures for testing and adjusting the EMF system
behaviour. These include Threshold Calibration, Overview Sweep and Cable Calibration.
5.1 EMF Measurement Procedures
Before any EMF measurement can be started with RFEX, the software should be fully configured. This
includes:
•
Data tables describing the system components like antenna factors and cable attenuation
tables must be available and contain the correct data.
For the TS-EMF system, antenna calibration data corresponding to the delivered tri-axis-probe
are included on the RFEX CD-ROM, and cable calibration tables are standardised and
installed automatically during software installation.
For non-TS-EMF systems, cable attenuation factors should be calibrated with the Cable Calibration procedure (see section 5.2.3).
•
The instruments making up the system must have been selected in the Hardware Configuration dialog (see section 3.4).
•
Any measurement packet to be used during the measurement shall either be a standard
packet delivered together with the software, or must have been generated and configured.
•
We strongly recommend to do a threshold calibration run before starting a long-term measurement in order to adapt the measurement packets to the local conditions.
Any EMF measurement is started either by clicking on the corresponding buttons in the RFEX main
dialog or from the Measure entry in the main menu. In any case, the Measurement Configuration
dialog (see section 3.7) will be opened and must explicitly be acknowledged by the user before a
measurement starts, making sure that the correct packets are selected for the measurement.
5.1.1 Single Measurement
In the context of RFEX, a Single Measurement is defined as the single run of a sequence made up of
one or several measurement packets.
After clicking on the Start Measurement button in the Measurement Configuration dialog, the measurement will be according to the following steps:
1. Reset the analyser.
2. Load the first measurement packet.
3. Divide the frequency range of a measurement packet into sub-packets. This way the complete
frequency range of a measurement packet is swept through by parts (partial sweeps). One
partial sweep covers the frequency range calculated as the product of the measurement
packet parameter Channels per sub-packet and the measurement bandwidth.
54
E-1
User Manual RFEX
Measurement Procedures
4. Program the analyzer with the parameters of the measurement packet and the frequency
range of the first sub-packet.
5. Wait for the Dwell Time.
6. Read out the trace data from the analyzer.
7. Evaluate the trace data: store the maximum level for each measurement channel.
8. If there is at least one sub-packet left, continue with the sub-packet and step 4. Else the test
for this measurement packet will have been run through: continue with step 9.
9. If there is still one measurement packet left, continue with the next measurement packet and
step 3. Else all measurement packets will have been executed: continue with step 10.
10. Store the raw data and perform the correction by antenna factor and cable loss. Antenna and
Cable factors are specific for each measurement packet; the values for the actual frequency
points are interpolated form the tables.
11. Compress the corrected data: compare the value of the measured value with the acceptance
threshold set in the measurement packet. All levels which are below this acceptance threshold
are not taken into consideration any longer and are deleted out of the table.
12. Calculate the resulting field strength: if measurement data are available for both polarisations,
the vector sum is formed from both results. For each frequency the resulting field strength is
compared with the limit line defined for this measurement; the result is shown as the per
thousand value in relation to the limit line.
The final result is a file according to the detailed description in section 4.3.1.
The above stepwise description does not include the switching between horizontal and vertical polarisation. The Measurement Configuration dialog allows to select when this switching shall take place:
•
After every Sequence: the first measurement packet is started with the antenna switching set
for horizontal polarisation. The whole sequence as described above is executed and for each
measurement packet loaded the horizontal polarisation is set. Then the first measurement
packet is loaded again but with the antenna switching set for vertical polarisation. The
sequence is run again but with vertical polarisation. If there is no polarisation defined for a
measurement packet then the measurement is skipped.
•
After every Packet: each measurement packet is completed (until step 9 of the sequence
above) with horizontal polarisation. But then the actual measurement packet is repeated again
(step 3 to 9) with vertical polarisation.
•
After every Sub-Packet: the above sequence is performed until step 8 with horizontal
polarisation. But then not the next sub-packet is loaded but the actual sub-packet is repeated
again (step 4 to 8) with vertical polarisation.
Independently of the above modes of polarisation switching, the same data are available at step 10 of
the above sequence: the level values of all measurement channels for all measurement packets
measured at the polarisations specified.
*
TS-EMF
For the TS-EMF system, the process is executed with two little differences:
•
•
Instead of two measurements for independent polarisations, three
measurements are taken, one for each dipole of the tri-axis field probe.
There is no possibility of selecting when to switch the probe axes, they
will always be switched After every Sub-Packet.
55
E-1
User Manual RFEX
Measurement Procedures
5.1.2 Peak / Average Measurement
The Peak/Average Measurement consists of a cyclical repetition of the single measurement
described above. The cycle time can be selected in the range 0 to 30 minutes. During this measurement the steps of the sequence as described in section 5.1.1 are performed until step 9.
Instead of correcting the raw data immediately, the raw data first are accumulated in two ways:
•
On the one hand the Average value is evaluated. The raw data continually are added and in
the end of the cycle this sum will be divided by the amount of measurements. Since the
evaluation of the average value is based on the measured voltage (linear value), the raw data
first are converted from dBµV (unit set at the analyzer) to mV.
•
On the other hand the Peak value is accumulated. For each frequency the actual measured
value is compared to the previous measured (and stored) value. The larger value will be
stored and compared with the next value to be measured..
At the end of the defined cycle length, the average values in the average file, showing up to now the
sum of all single measurements performed, are divided by the amount of all single measurements.
The results are converted back to dBµV unit.
For each of both files (average values and peak values) step 10 up to step 12 of the sequence as
described in section 5.1.1 are performed.
The final result are two files according to the detailed description in section 4.3.2.
5.1.3 Long-Term Measurement
The peak/average measurements described above are not suitable for a true long-term measurement.
They generate too many data in order to get a compact representation of the measurement.
Therefore, for true long-term measurements which may last for a theoretically unlimited time, it is
necessary to implement further, comprehensive data compression mechanisms.
For such a long-term measurement, the data compression at the end of one peak/average measurement cycle, compresses all the information available in the average result file for each measurement
packet, to one single value. The sum can be done by squares or linearly, resulting in three different
long-term result files. See the discussion in section 4.3.3 for details about the result files.
Thus, for a number n of packets, a number n of resulting field strength values will be calculated and
stored as the average emission. The same is done for the peak value data and results in the
maximum emission for each measurement packet. Furthermore for each measurement packet the
largest peak value will be stored as the maximum single emission value.
This way of compressing the data does erase the relation between the measured field strength and
the frequency (measurement channel). But since the test results are saved by measurement packets,
the information about the origin of the RF contribution is still available (for example GSM900, TV
broadcasting, etc.).
The final result of a long-term measurement is made up by three files per day included in the overall
measurement time lapse. See section 4.3.3 for a detailed description
56
E-1
User Manual RFEX
Measurement Procedures
5.1.4 Learning Phase
If the option Do Learning Phase is selected in the Options dialog (see section 3.8), the so called
learning phase will be executed after starting a long-term measurement and before measurement data
are really acquired.
This learning phase executes a complete single test cycle with all measurement packets and polarisations defined, but no data will be stored. Instead, for each measurement packet it will be checked if the
spectrum analyzer reports any overload condition (due to the signal level measured) with the currently
programmed settings.
If an overload condition is detected, the input attenuation of the analyzer is increased in 10 dB steps
until the overload condition disappears. If this can not be reached with a maximum of 60 dB attenuation, the measurement is aborted with a warning.
If the overload condition is removed, the IF overload condition is checked. If an IF overload condition
is detected, it will be removed by increasing the reference level of the analyzer display in 10 dB steps.
If the input attenuation or the reference level have been changed during the learning phase, then the
changed settings are stored to the measurement configuration file, in the section containing the copy
of the measurement packet data (see section 4.2). These changed settings will then be used for the
real measurement.
*
TS-EMF
The option Do Learning Phase is not available with the TS-EMF system.
For the FSH3, which is the standard analyzer for the TS-EMF system, the
input attenuation is automatically set depending on the reference level. A
check of a possible IF overload is not possible.
57
E-1
User Manual RFEX
Measurement Procedures
5.2 Other Measurement Procedures
5.2.1 Threshold Calibration
As mentioned in section 3.5.4, finding a suitable value for the Acceptance Threshold parameter in the
measurement packet, in a way that all noise floor signals are ignored, but all relevant peaks are kept
during data compression, can be a difficult task. In order to support the user with this process, RFEX
implements the so called Threshold Calibration.
This measurement is started from the main menu entry Measurement à Threshold Calibration and
starts, as any other measurement, with the selection of the measurement packets to be executed:
This dialog is basically the same as the Measurement Configuration dialog as described in section 3.7.
The only differences are:
•
•
There is no need for giving a name for the measurement, as no data will be saved.
Instead of a limit line and a polarisation change sequence, a new parameter Distance to
Noise for Threshold Calculation has to be entered.
The Threshold Calibration then proceeds by executing the following steps for each selected packet:
1. Prompt the user to disconnect the RF cable from the analyzer input connector.
2. Direct the analyzer to do a sweep across the frequency range defined in the packet.
3. Query the trace data and evaluate the maximum noise level.
4. Calculate the threshold by correcting this maximum noise level for antenna factor and cable
attenuation, and by adding the distance to noise value entered in the dialog.
5. Save this new threshold value to the measurement packet.
58
E-1
User Manual RFEX
Measurement Procedures
5.2.2 Overview Sweep
*
The Overview Sweep mode is not available with the TS-EMF system.
TS-EMF
The purpose of the overview sweep is to do a fast check to see if the system works correctly under
remote control.
It is started by clicking on the main menu entry Measurement à Overview Sweep to open the
following dialog:
Here, some basic parameters of the analyzer can be set, and one of the switch paths configured for
the antenna switching unit can be selected.
Pressing the button Start Sweep transfers the settings to the analyzers and executes the sweep.
After execution of the sweep, the maximum level shown at the display will be identified. The reference
level of the spectrum analyzer will be set to a value which is 20 dB above this level.
The reference level can be considered as a recommendation for setting the analyzer in the corresponding frequency range.
59
E-1
User Manual RFEX
Measurement Procedures
5.2.3 Cable Calibration
*
TS-EMF
For the TS-EMF system, no cable calibration is available. The cable loss of
the cables used for this system has been recorded in factory and is delivered
together with the system (predefined data set).
For accurate EMF measurement, it is required to know the loss of the cables used in the system and
to correct the measurement result by this cable loss (see section 3.3). The cable loss is stored as file
within the RFEX software.
It is possible to enter the cable loss in table format for use within the RFEX software. But the faster
and more comfortable way is an automatic measurement using the spectrum analyzer and a tracking
generator. The measurement is done frequency dependant and the level difference at the two
terminals of the cable is determined.
The cable calibration only can be performed if a tracking generator is available and registered in the
software configuration of the RFEX (see section 3.4.3). If a generator is available, the main menu
contains an entry Measurement à Cable Calibration... Clicking on it opens the following dialog:
This dialog is used to set up the parameters necessary for the cable calibration.
•
Name of the cable. If the calibration is successfully performed, a cable attenuation table with
this name is generated. Select an existing cable from the box or enter a new name. Before
starting a cable calibration, a name must be specified.
•
Start and Stop Frequency are to be entered together with the step width. If the cable is used
for measurement, the start and stop frequency of a later measurement packet will be limited
by the frequency range of the cable calibration (see section 3.5).
The Step Width can be defined either in linear steps (MHz) or in logarithmic steps (%).
•
•
Finally, the Path to switch can be selected if a switch unit is available and has been
configured. This allows to record the cable loss of the entire path from the antenna terminal to
the input of the spectrum analyzer.
60
E-1
User Manual RFEX
Measurement Procedures
After all parameters are set, the cable calibration can be started by pressing the button Calibration....
The measurement is split into two phases:
• Normalisation Measurement: The first step requires to connect the spectrum analyzer with
the tracking generator by means of an additional cable (reference cable). The generator is set
to a constant level of 0 dBm and the level via the reference cable is measured with the spectrum analyzer. This is done for the frequency range and the step width as specified in the
setup parameters.
• Calibration Measurement: The second step asks to connect the cable (or path) to be measured together with the reference cable used in the first step. Another measurement is
done at the same conditions and frequency points as before.
•
In the end the cable loss is calculated by subtracting the normalisation level from the calibration level. The resulting level is the required cable loss with unit in dB.
Basically, the cable calibration is a relative measurement since only the difference of the normalisation
measurement and the calibration measurement is of interest. This method has the advantage that the
accuracy of the tracking generator is not important.
During the calibration the dialog shown above is extended in a way to represent the measurements
done and to have a possibility to stop the calibration measurement.
61
E-1