1
ZigBeeNet™ Software 1.0
Application Note
Creating, building & debugging ZigBeeNet applications
in Eclipse
Doc. AN-481~08 v.2.0
March 2008
© 2008 MeshNetics
CREATING, BUILDING & DEBUGGING ZIGBEENET APPLICATIONS
IN ECLIPSE
APPLICATION NOTE
Document Summary
This document gives a brief introduction to the process of creating, building and
debugging ZigBeeNet-based projects using the open-source IDE, Eclipse, WinAVR
compiler and JTAGICE mkII hardware on a PC running Microsoft® Windows™
2000/XP.
In this tutorial we will create a small project that controls one of the LEDs on
MeshNetics’ MeshBean development board and try to debug it using Eclipse and
JTAGICE mkII hardware.
Document Conventions
Buttons
Dialog button names are denoted in Courier: OK, Cancel
Menu
commands
Menu items are denoted in Courier and shown in order they must
be selected: File -> Open
Keyboard
shortcuts
Several keys should be pressed simultaneously in the order they
are listed: F7, Ctrl-Shift-F5
Source code
Code snippets are shown in colored text:
/***********************************************
User's entry.
***********************************************/
void fw_userEntry(FW_ResetReason_t resetReason)
File and
directory
names
File and directory names are taken in single quotes:
‘bin’, ‘avr-gdb.exe’
Intended Audience
This document is intended for developers, wanting to get familiar with writing
ZigBee/802.15.4 applications using MeshNetics ZigBeeNet ZigBee stack.
Related Documents:
[1]
ZigBit™ Development Kit. User’s Guide. MeshNetics Doc. S-ZDK-451
[2]
JTAGICE mkII Quick Start Guide
http://www.atmel.com/dyn/resources/prod_documents/doc2562.pdf
[3]
WinAVR User Manual / Ed. by Eric B. Weddington
[4]
AVR Studio User Guide. Available in HTML Help with the product.
http://www.atmel.com/dyn/products/tools_card.asp?tool_id=2725
© 2008 MeshNetics
Page 2/22
CREATING, BUILDING & DEBUGGING ZIGBEENET APPLICATIONS
IN ECLIPSE
APPLICATION NOTE
Pre-requisites
Make sure you have the latest versions of JAVA Run-time Environment (JRE)
(download from http://www.javasoft.com), Eclipse for C++ development (download
from http://www.eclipse.org) and WinAVR (http://winavr.sourceforge.net) installed on
your PC.
You’ll also need 1 MeshBean board [1] and 1 Atmel JTAGICE mkII device [2].
You will also have to install the JTAGICE mkII USB driver that comes with WinAVR
[3] (see next chapter).
Installing the JTAGICE mkII driver
WARNING:
If you install this driver, you won’t be able to use JTAGICE with AVR Studio Error!
Reference source not found.. If you want to use AVR Studio, you’ll have to reinstall
the driver (located in the ‘usb’ folder of AVR Studio installation, usually ‘\Program
files\Atmel\AVR tools\usb’).
The following instructions are for Windows XP.
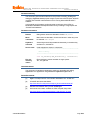
1.
Connect your JTAGICE mkII to your PC, turn it on and open Windows Device
manager. If you did not install the driver that comes with AVR Studio, you will
see a USB Device with question mark under the Other devices branch
(see Figure 1).
© 2008 MeshNetics
Page 3/22
CREATING, BUILDING & DEBUGGING ZIGBEENET APPLICATIONS
IN ECLIPSE
APPLICATION NOTE
Figure 1. Device Manager screen
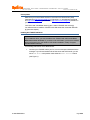
2.
If you did install the driver from Atmel, there will be a JTAGICE mkII item
under the Jungo branch. Right-click either of these items and select Update
driver from the menu. In the next window (see Figure 2), select Install
from a list or specific location (Advanced):
© 2008 MeshNetics
Page 4/22
CREATING, BUILDING & DEBUGGING ZIGBEENET APPLICATIONS
IN ECLIPSE
APPLICATION NOTE
Figure 2. Hardware Update Wizard, starting screen
© 2008 MeshNetics
Page 5/22
CREATING, BUILDING & DEBUGGING ZIGBEENET APPLICATIONS
IN ECLIPSE
APPLICATION NOTE
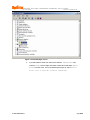
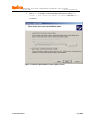
3.
Click Next > to continue. In the next window (see Figure 3), select Don’t
search. I will choose the driver to install. and click Next >
to continue.
Figure 3. Hardware Update Wizard, search options screen
© 2008 MeshNetics
Page 6/22
CREATING, BUILDING & DEBUGGING ZIGBEENET APPLICATIONS
IN ECLIPSE
APPLICATION NOTE
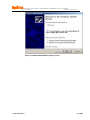
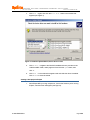
4.
Click Next > again, then click the Have Disk… button in the window that
appears (see Figure 4):
Figure 4. Hardware Update Wizard, device driver screen
5.
Click Browse…, navigate to the WinAVR installation directory and then to the
‘Utils\Libusb\Bin’ folder, select ‘jtagice2.inf’ and click the Open button, then
click OK.
6.
Click Next > in the window that appears and wait while the driver is installed.
Click Finish to close the wizard.
Creating a New project in Eclipse
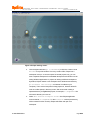
1.
Start Eclipse IDE by running ‘eclipse.exe’. If this is the first time you’re running
Eclipse, a similar screen will appear (see Figure 5).
© 2008 MeshNetics
Page 7/22
CREATING, BUILDING & DEBUGGING ZIGBEENET APPLICATIONS
IN ECLIPSE
APPLICATION NOTE
Figure 5. Eclipse starting screen
2.
Click the rightmost button (Go to Workbench) or click the X button next to
Welcome on top of the window. Like many modern IDEs, Eclipse has a
workspace concept – a common space for several projects, say, you can
have a separate workspace for embedded development and another one for
writing Windows applications. A project can belong to different workspaces.
By default, Eclipse creates a new workspace in the Windows user directory
(C:\Documents and Settings\ or whatever it is called on your
computer). This is not the best place to keep projects in, because WinAVR
tools do not like spaces in directory names. We recommend creating a
separate directory for ZigBeeNet projects, for example, C:\ZigBeeNet. We
will use this directory from now on.
3.
Select File -> Switch workspace -> Other from Eclipse application
menu and enter “C:\ZigBeeNet” in the Workspace: textbox (the directory
will be created if it does not exist). Eclipse will restart and open new
workspace.
© 2008 MeshNetics
Page 8/22
CREATING, BUILDING & DEBUGGING ZIGBEENET APPLICATIONS
IN ECLIPSE
APPLICATION NOTE
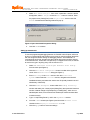
4.
Select File -> New -> Project… from menu, expand the C section is the list
that appears, select C Project and click Next > button to continue. Enter
the project name (“DebugTest”) in the Project name: text box and click
Finish. Sometimes the following window will pop up:
Figure 6. Open Associated Perspective dialog
5.
Just click Yes to continue.
Setting up external tools
To use the programming/debugging features of JTAGICE mkII in Eclipse, we’ll have
to set up 2 “external tools” that will be run every time you need to program the device
with new image and before starting the debugging session. Since WinAVR is a
command-line set of tools, programming the module with image we build is done by
a command-line tool, ‘avarice.exe’. We just set up a “wrapper” for this tool, so that we
do not have to type in anything every time we need to run it.
1.
Select Run -> External Tools -> Open External Tools Dialog…
from the menu (see Figure 5).
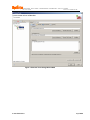
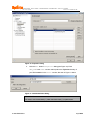
2.
Click the New launch configuration button in toolbar in the upper left
corner of the External Tools dialog (see Figure 7).
3.
Enter Burn image in the Name: text box. Click the Browse File
System… button under the Location: text box, navigate to the WinAVR
installation directory and select the ‘avarice.exe’ file (usually located in the ‘bin’
subdirectory of WinAVR).
4.
Click the Browse Workspace… button under the Working Directory:
text box and select your current project (DebugTest), then press OK. Note that
text box contents change to “${workspace_loc:/DebugTest}”, which is not a
standard path name, but an environment variable (we will discuss these later
in this document).
5.
Type “-2 –repf DebugTest.elf –j usb” in the Arguments: text box.
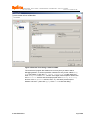
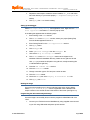
6.
Go to the Common subtab (see Figure 8) and check the External tools
checkbox in the Display in favourites menu list.
7.
© 2008 MeshNetics
Click the Apply button to save new settings.
Page 9/22
CREATING, BUILDING & DEBUGGING ZIGBEENET APPLICATIONS
IN ECLIPSE
APPLICATION NOTE
Figure 7. External Tools dialog, Main subtab
© 2008 MeshNetics
Page 10/22
CREATING, BUILDING & DEBUGGING ZIGBEENET APPLICATIONS
IN ECLIPSE
APPLICATION NOTE
Figure 8. External Tools dialog, Common subtab
The ‘avarice.exe’ program also needs to be run every time you want to start a
debugging session, so we set up another “external tool” entry for this, called Debug
mode (see Figure 7). Click the New launch configuration button again and
enter Debug mode in the Name: text box. Once again, enter full path to ‘avarice.exe’
in the Location: text box and current project path in the Working Directory:
text box. In the Arguments: text box, enter “-2 -j usb :2525” (note the space
between ‘usb’ and ‘:’), then click Apply. Click Close to close the dialog.
© 2008 MeshNetics
Page 11/22
CREATING, BUILDING & DEBUGGING ZIGBEENET APPLICATIONS
IN ECLIPSE
APPLICATION NOTE
Creating a makefile
WinAVR toolchain requires the use of a so-called “makefile” – a plain text file that
contains all the settings (compiler switches/paths/libraries/etc.) required to build the
target image. We supply with a sample makefile that you can use a reference in
future projects (see below).
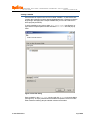
To add a makefile to your project, select File -> New -> File (see Figure 5) or
right-click the Project Explorer window and select New -> File from the pop-up
menu.
Figure 9. New File dialog
Enter “makefile” in the File name: text box and click Finish to close the dialog
(see Figure 9). An empty makefile will be created and opened in the source code
editor. Paste the following sample makefile contents into the editor.
© 2008 MeshNetics
Page 12/22
CREATING, BUILDING & DEBUGGING ZIGBEENET APPLICATIONS
IN ECLIPSE
APPLICATION NOTE
########################################################
# Makefile for the project DebugTest
########################################################
CROSS_COMPILE = avr
CPU = atmega1281
PROJNAME = DebugTest
PROJECT = $(PROJNAME).elf
SHELL = /bin/bash
#### COMPILER FLAGS #######
CFLAGS = -mmcu=$(CPU)
CFLAGS += -Os
CFLAGS += -g
CFLAGS += -Wall -W
CFLAGS += -ffunction-sections
CFLAGS += -Wl,--gc-sections
#Initial DebugTest interval, ms
CFLAGS += -DDebugTest_PERIOD=1000
#### DEFINES FLAGS #######
# Can be AT86RF230, AT86RF230B, AT86RF231, AT86RF212
MAC=AT86RF230
# Can be ATMEGA1281, AT91SAM7X256
HAL=ATMEGA1281
ifeq ($(MAC), AT86RF230)
MAC_LIB=MACrf230
else
ifeq ($(MAC), AT86RF230B)
MAC_LIB=MACrf230b
else
ifeq ($(MAC), AT86RF231)
MAC_LIB=MACrf231
else
ifeq ($(MAC), AT86RF212)
MAC_LIB=MACrf212
else
MAC_LIB=MACrf230
endif
endif
endif
endif
© 2008 MeshNetics
Page 13/22
CREATING, BUILDING & DEBUGGING ZIGBEENET APPLICATIONS
IN ECLIPSE
APPLICATION NOTE
ifeq ($(HAL), ATMEGA1281)
HAL_PATH=HAL/atmega1281
HAL_LIB=HALatmega1281
else
HAL_PATH=HAL/at91sam7x256
HAL_LIB=HALat91sam7x256
endif
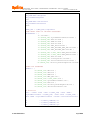
STACK_DIR = $(ZBN_DIR)/Components
##### PATHS FLAGS OF INCLUDES #########
INCLUDEDIRS = \
-I./include \
-I$(STACK_DIR)/SystemEnvironment/include \
-I$(STACK_DIR)/APS/include \
-I$(STACK_DIR)/NWK/include \
-I$(STACK_DIR)/ZDO/include \
-I$(STACK_DIR)/MAC_PHY/include \
-I$(STACK_DIR)/MAC_PHY/MAC_HWD_PHY/include \
-I$(STACK_DIR)/MAC_PHY/MAC_HWI/include \
-I$(STACK_DIR)/$(HAL_PATH)/HAL_HWI/include \
-I$(STACK_DIR)/$(HAL_PATH)/HAL_HWD/include \
-I$(STACK_DIR)/BSP/include \
-I$(STACK_DIR)/ConfigServer/include \
-I$(STACK_DIR)/PersistDataServer/include \
-I$(STACK_DIR)/Security/BuildingBlocks/include
###### LIB #########
LIBDIRS = \
-L$(STACK_DIR)/APS/lib \
-L$(STACK_DIR)/ZDO/lib \
-L$(STACK_DIR)/NWK/lib \
-L$(STACK_DIR)/MAC_PHY/lib \
-L$(STACK_DIR)/$(HAL_PATH)/lib \
-L$(STACK_DIR)/SystemEnvironment/lib \
-L$(STACK_DIR)/BSP/lib \
-L$(STACK_DIR)/Security/BuildingBlocks/lib \
-L$(STACK_DIR)/PersistDataServer/lib
## Libraries
LIBS = -lMain -lAPS -lZDO -l$(HAL_LIB) -lBSP -lNWK lSystemEnvironment -l$(MAC_LIB) -lAPS -lZDO -l$(HAL_LIB) lBSP -lNWK -lSystemEnvironment -lSSPsw -lPersistDataServer
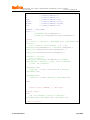
AS
LD
CC
© 2008 MeshNetics
= $(CROSS_COMPILE)-as
= $(CROSS_COMPILE)-ld
= $(CROSS_COMPILE)-gcc
Page 14/22
CREATING, BUILDING & DEBUGGING ZIGBEENET APPLICATIONS
IN ECLIPSE
APPLICATION NOTE
CPP
AR
NM
STRIP
OBJCOPY
OBJDUMP
SIZE
=
=
=
=
=
=
=
$(CROSS_COMPILE)-g++
$(CROSS_COMPILE)-ar
$(CROSS_COMPILE)-nm
$(CROSS_COMPILE)-strip
$(CROSS_COMPILE)-objcopy
$(CROSS_COMPILE)-objdump
$(CROSS_COMPILE)-size
BUILDDIR = $(PRJ_HOME)
objects = \
$(BUILDDIR)/objs/DebugTest.o \
$(STACK_DIR)/ConfigServer/objs/ConfigServer.o
## Build
all: $(objects) $(PROJECT) $(PROJNAME).srec $(PROJNAME).hex
$(objects):
$(CC) $(CFLAGS) $(INCLUDEDIRS) -c $^ -o $@
$(BUILDDIR)/objs/DebugTest.o: $(BUILDDIR)/DebugTest.c
$(STACK_DIR)/ConfigServer/objs/ConfigServer.o:
$(STACK_DIR)/ConfigServer/src/configServer.c
$(PROJECT): $(objects)
$(CC) $(objects)
$(STACK_DIR)/$(HAL_PATH)/lib/WdtInit.o $(CFLAGS)
$(INCLUDEDIRS) $(LIBDIRS) $(LIBS) -lm -o $(PROJECT)
$(SIZE) -td $(PROJECT)
$(PROJNAME).srec:
$(OBJCOPY) -O srec --srec-len 128 $(PROJECT)
$(PROJNAME).srec
$(PROJNAME).hex:
$(OBJCOPY) -O ihex $(PROJECT) $(PROJNAME).hex
#burn:
#
avarice -2epf ${TARGET} -j /dev/ttyS0
## Clean target
clean:
-rm -rf $(TARGET) $(objects) $(PROJECT)
$(PROJNAME).hex $(PROJNAME).eep $(PROJNAME).srec
## End of makefile
© 2008 MeshNetics
Page 15/22
CREATING, BUILDING & DEBUGGING ZIGBEENET APPLICATIONS
IN ECLIPSE
APPLICATION NOTE
Adding source files to the project
Now that we can add a source (.с) file that contains the code we’re going to build to
the project.
Select File -> New -> Source file from the application menu (see Figure 5) or
right-click the Project Explorer window and select New -> Source file from the
pop-up menu. Enter “DebugTest.c” in the Source File: text box and click the
Finish button to continue. Note that you have to specify the ‘.c’ extension of the
file. Here’s the sample code we’re going to use in this example below:
/*******************************************************
LED Blinking Implementation Project: C source
*******************************************************/
#include <apsTimer.h>
#include <leds.h>
#include <taskManager.h>
#include <zdo.h>
#include <configServer.h>
#include <aps.h>
// variables/defines
#define BLINK_DELAY 500 // Period of blinking
static HAL_AppTimer_t blinkTimer;
// functions
void StartBlinkTimer();
void TimerFired();
void ZDO_StartNetworkConf(ZDO_StartNetworkConf_t*
confirmInfo);
void ZDO_MgmtNwkUpdateNotf(ZDO_MgmtNwkUpdateNotf_t
*nwkParams);
void ZDO_WakeUpInd();
void ZDO_SleepInd();
/*******************************************************
Application task.
*******************************************************/
void APL_TaskHandler()
{
StartBlinkTimer();
}
void StartBlinkTimer()
{
blinkTimer.interval = BLINK_DELAY;
blinkTimer.mode
= TIMER_REPEAT_MODE;
blinkTimer.callback = TimerFired;
HAL_StartAppTimer(&blinkTimer);
© 2008 MeshNetics
Page 16/22
CREATING, BUILDING & DEBUGGING ZIGBEENET APPLICATIONS
IN ECLIPSE
APPLICATION NOTE
}
void TimerFired()
{
BSP_ToggleLed(LED_RED);
}
// The following functions MUST be present to build the
executable image
void ZDO_StartNetworkConf(ZDO_StartNetworkConf_t*
confirmInfo)
{
}
void ZDO_MgmtNwkUpdateNotf(ZDO_MgmtNwkUpdateNotf_t*
nwkParams)
{
}
void ZDO_WakeUpInd()
{
}
void ZDO_SleepInd()
{
}
// eof DebugTest.c
Using environment variables in makefile
Notice the following lines in the makefile text:
## Path to Stack
STACK_DIR = ZBN_DIR/Components
## Modules directories paths.
BUILDDIR = $(PRJ_HOME)
ZBN_DIR and PRJ_HOME are environment variables that point to the API folder of
ZigBeeNet installation and directory containing your project files, respectively. By
using variables you can avoid specifying paths directly in the makefile and thus the
need to modify the makefile for every project you create. Instead, you can use the
variables in Eclipse to specify the paths.
1.
Select Project -> Properties from the application menu or right-click the
project name in Project explorer and select Properties from the pop-up
menu.
© 2008 MeshNetics
Page 17/22
CREATING, BUILDING & DEBUGGING ZIGBEENET APPLICATIONS
IN ECLIPSE
APPLICATION NOTE
Figure 10. Properties dialog
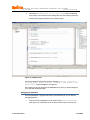
2.
Click the New… button in Properties dialog (see Figure 10). Enter
“ZBN_DIR” in the Name: text box and full path to the ZigBeeNet directory of
your ZDK installation in the Value: text box, like seen in Figure 11 below.
Figure 11. Variable definition dialog
IMPORTANT:
You have to use forward slash (‘/’) rather than back slash (‘\’) in path names.
3.
© 2008 MeshNetics
Click OK to close the window. A new variable will be added to the list.
Page 18/22
CREATING, BUILDING & DEBUGGING ZIGBEENET APPLICATIONS
IN ECLIPSE
APPLICATION NOTE
4.
Repeat the same steps to create the second variable, PRJ_HOME with value
set to the directory of your current project (‘c:/ZigBeeNet/debugtest’ or
similar).
5.
Click Apply, then OK to close the dialog.
Setting up the debugger
Select Run -> Open Debug Dialog… from application menu. Right-click the C/C++
Local application and select New from the pop-up menu.
In the dialog that appears take the following steps:
1.
Enter “Debug” in the Name: text box.
2.
Click Browse next to Project: text box, select your project (DebugTest)
from the list that appears and click OK.
3.
Enter “DebugTest.elf” in the C/C++ Application: text box.
4.
Click Apply button.
5.
Click Debugger tab.
6.
Select gdbserver Debugger from the Debugger: list.
7.
Uncheck the Stop on startup at: checkbox.
8.
Click Browse next to GDB Debugger: text box and navigate to ‘bin’
subfolder of WinAVR installation directory. Select the ‘avr-gdb.exe’ file and
click Open (or just enter the full path to ‘avr-gdb.exe’, usually something like
‘C:\WinAVR\bin\avr-gdb.exe’).
9.
Clear the GDB command file: text box.
10. Click the Connection subtab.
11. Change connection type to TCP and port number to 2525.
12. Click the Common subtab.
13. Check the Debug item in the Display in favourites menu list.
14. Click Apply, then Close.
Building the image
Once we’ve set everything up, it is time to build the image we’re going to debug.
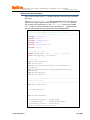
Select Project -> Build project from the application menu. WinAVR tools
output is shown in the console window in the bottom of the screen (see Figure 12).
Programming the device with newly built image
Once the image is successfully built, we need to program the MeshBean with it via
JTAG.
1.
Connect your JTAG device to the MeshBean by using supplied connector and
to your PC using USB cable and power up both devices.
© 2008 MeshNetics
Page 19/22
CREATING, BUILDING & DEBUGGING ZIGBEENET APPLICATIONS
IN ECLIPSE
APPLICATION NOTE
2.
Now select Run -> External tools -> Burn image (we’ve created this
entry earlier). If all connections and settings are fine, then node programming
will start with progress indicator in the console window.
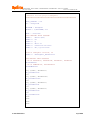
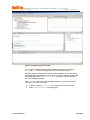
Figure 12. Debug screen
Once the programming is finished, an error message “USB bulk read error:
usb_reap_async: error: A device attached to the system is not
functioning.” might be displayed. Just ignore it.
Don’t forget you have to reprogram the MeshBean every time you make changes to
your code and rebuild the image.
Debugging the application
Once the MeshBean is programmed with the executable image, we can start the
debugging session.
1.
First, let’s set up a breakpoint in one of the functions, void TimerFired()
(see Figure 12). Position the cursor on the second line of this function and
© 2008 MeshNetics
Page 20/22
CREATING, BUILDING & DEBUGGING ZIGBEENET APPLICATIONS
IN ECLIPSE
APPLICATION NOTE
select Run -> Toggle breakpoint from the menu or press Ctrl-Shift-B. The
line will be marked by a round symbol to the left of it.
2.
To start the debugging, first select Run -> External tools -> Debug mode
(this is the second entry we’ve created earlier). This will put your JTAGICE
into debug mode and allow further control of the target device. You need to
run this command every time you want to start a debugging session.
The output in the console window should look like this:
AVaRICE version 2.6, May 15 2007 17:07:24
Defaulting JTAG bitrate to 1 MHz. Make sure that the
target frequency is at least 4 MHz or you will likely
encounter failures controlling the target.
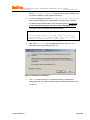
3.
Next, select Run -> Debug from the application menu or press F11. The
following window may appear (see Figure 13):
Figure 13. Perspective confirmation
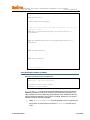
4.
Click Yes to switch the view (or, in Eclipse terminology, perspective) to
debugging mode. The screen layout will change into something like this, seen
in Figure 14:
© 2008 MeshNetics
Page 21/22
CREATING, BUILDING & DEBUGGING ZIGBEENET APPLICATIONS
IN ECLIPSE
APPLICATION NOTE
Figure 14. Project perspective screen
You can switch between debug and project perspectives at any time using the
Debug and C/C++ buttons in the top right corner of the Eclipse window.
Execution should now break on the line we’ve set a breakpoint at. You can use the
vast Eclipse debugging facilities to see stack trace, memory, variables, registers and
many other things. The Window -> Show view menu gives you quick access to
any of the debugging windows.
The Run menu contains most of the debugging features you need, like “step into”,
“step over”, “run to line” and others.
© 2008 MeshNetics
5.
Press F8 or select Run -> Resume from the menu to resume execution.
6.
Select Run -> Terminate to stop debugging.
Page 22/22