1
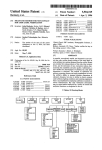
SYDIC-Training Course on
Digital Systems Testing and
Design for Testability
Part II:
Laboratory Exercise
Gert Jervan ([email protected])
Embedded Systems Laboratory (ESLAB)
Linköping University
March, 2003
Lab Exercise
Introduction1
The lab exercise is intended to give some hands-on experience with commercial
test and design for testability (DFT) tools. We will illustrate the features of such
tools and show their placement with respect to the overall design flow. The
exercises are performed with Mentor Graphics DFTAdvisor, FastScan and
FlexTest products.
The first part of the exercise concentrates on test pattern generation and fault
simulation. These concepts will be illustrated based on realistic design examples.
The exercise will also illustrate how these tools fit into the overall design flow.
The second part of the exercise deals with design for testability. In particular, one
of the mainstream DFT technologies - scan insertion - will be used in the
exercise. We will study the practical aspects of scan insertion and learn how test
generation can efficiently be performed for scanned circuits.
1
Parts of this document are copyright © Mentor Graphics Corporation 1991-2002. All rights reserved.
2
Lab Exercise
Top-Down Design Flow with DFT
Figure 1: Mentor Graphics Top-Down Design Flow Tasks and Products
Figure 1 shows the basic steps and the Mentor Graphics tools you would use
during a typical ASIC top-down design flow with a structured DFT strategy (the
DFT activities are shown in gray).
As it is shown, the first task in any design flow is creating the initial RT-level
design, through whatever means you choose. In the Mentor Graphics
3
Lab Exercise
environment, you may choose to create a very-high-level design using System
Architect (or AutoLogic BLOCKS), a high-level VHDL or Verilog description using
QuickHDL, or a schematic using Design Architect. You then verify the design’s
functionality by performing a functional simulation, using either QuickSim II,
QuickHDL, or another vendor's VHDL simulator.
If your design’s format is in VHDL or Verilog format and it contains memory
models, at this point you can add built-in self-test (BIST) circuitry. MBISTArchitect
creates and inserts RTL-level customized internal testing structures for design
memories. Additionally, if your design’s format is in VHDL, you can use
LBISTArchitect to synthesizes BIST structures into its random logic design blocks.
Also at the RTL-level, you can insert and verify boundary scan circuitry using
BSDArchitect (BSDA). Then you can synthesize and optimize the design using
either AutoLogic II or another vendor's synthesis tool. At this point in the flow you
are ready to insert internal scan circuitry into your design using DFTAdvisor. You
then perform a timing optimization on the design because you added scan
circuitry. Once you are sure the design is functioning as desired, you can generate
test patterns. You can use FastScan or FlexTest (depending on your scan
strategy) and ASIC Vector Interfaces to generate a test pattern set in the
appropriate format.
Now you should verify that the design and patterns still function correctly with the
proper timing information applied. You can use QuickSim II, QuickPath, or some
other simulator to achieve this goal. You may then have to perform a few
additional steps required by your ASIC vendor before handing the design off for
manufacture and testing.
Note: It is important for you to check with your vendor early on in your design
process for specific requirements and restrictions that may affect your DFT
strategies. For example, the vendor's test equipment may only be able to handle
single scan chains, have memory limitations, or have special timing requirements
that affect the way you generate scan circuitry and test patterns.
4
Lab Exercise
User Interface Overview
DFT products use two similar graphical user interfaces (GUI): one for BIST
products and one for ATPG products. The BIST graphical user interface supports
MBISTArchitect, LBISTArchitect, and BSDArchitect. The ATPG graphical user
interface supports DFTAdvisor, FastScan, and FlexTest. Both of these user
interfaces share many common elements. This subsection describes these
common elements.
Figure 2 shows a representation of the GUI elements that are common to both
user interfaces. Notice that the graphical user interfaces consist of two windows:
the Command Line window and the Control Panel window.
Figure 2: Common Elements of the DFT Graphical User Interfaces
When you invoke a DFT product in graphical user interface mode, it opens both
the Command Line and Control Panel windows. You can move these two windows
at the same time by pressing the left mouse button in the title bar of the Command
Line window and moving the mouse. This is called window tracking. If you want to
disable window tracking, choose the Windows > Control Panel > Tracks Main
Window menu item.
5
Lab Exercise
The following sections describe each of the user interface common elements
shown in Figure 2.
Command Line Window
The Command Line window, shown in Figure 2, provides several ways for you to
issue commands to your DFT product. For those of you that are mouse oriented,
there are pulldown and popup menu items. For those that are more command
oriented, there is the command line. In either case, the session and command
transcript windows provide a running log of your session.
Pulldown Menus
Pulldown menus are available for all the DFT products. The following lists the
pulldown menus that are shared by most of the products and the types of actions
typically supported by each menu:
♦ File > menu contains menu items that allow you to load a library or design,
read command files, view files or designs, save your session information, and
exit your session.
♦ Setup > menu contains menu items that allow you to perform various circuit or
session setups. These may include things like setting up your session logfiles
or output files.
♦ Report > menu contains menu items that allow you to display various reports
regarding your sessions setup or run results.
♦ Window > menu contains menu items that allow you to toggle the visibility and
tracking of the Control Panel Window.
♦ Help > menu contains menu items that allow you to directly access the online
manual set for the DFT tools. This includes, but is not limited to, the individual
command reference pages, the user’s manual, and the release notes.
Session Transcript
The session transcript is the largest pane in the Command Line window, as shown
in Figure 2. The session transcript lists all commands performed and tool
messages in different colors:
♦ Black text - commands issued.
♦ Red text - error messages.
♦ Green text - warning messages.
♦ Blue text - output from the tool other than error and warning messages.
In the session transcript you can re-execute a command by triple-clicking the left
mouse button on any portion of the command, then clicking the middle mouse
button to execute it. You also have a popup menu available by clicking the right
mouse button in the session transcript.
6
Lab Exercise
Command Transcript
The command transcript is located near the bottom of the Command Line window,
as shown in Figure 2. The command transcript lists all of the commands executed.
You can repeat a command by double-clicking on the command in the command
transcript. You can place a command on the command line for editing by clicking
once on the command in the command transcript.
Command Line
The DFT products each support a command set that provide both user information
and user-control. You enter these commands on the command line located at the
bottom of the Command Line window, as shown in Figure 2. You can also enter
commands through a batch file called a dofile. These commands typically fall into
one of the following categories:
♦ Add commands - These commands let you specify architectural information,
such as clock, memory, scan chain definition.
♦ Delete commands - These commands let you individually “undo” the
information you specified with the Add commands. Each Add command has a
corresponding Delete command.
♦ Report commands - These commands report on both system and userspecified information.
♦ Set and Setup commands - These commands provide user control over the
architecture and outputs.
♦ Miscellaneous commands - The DFT products provides a number of other
commands that do not fit neatly into the previous categories. Some of these,
such as Help, Dofile, and System, are common to all the DFT/ATPG tools.
Others, are specific to the individual products.
Control Panel Window
The Control Panel window, shown in Figure 2, provides a graphical link to either
the functional blocks whose setup you can modify or the flow process from which
you can modify your run. The window also present a series of buttons that
represent the actions most commonly performed.
Graphic Pane
The graphic pane is located on the left half of the Control Panel window, as shown
in Figure 2. The graphic pane can either show the functional blocks that represent
the typical relationship between a core design and the logic being manipulated by
the DFT product or show the process flow blocks that represent the groups of
tasks that are a part of the DFT product session. Some tools, such as DFTAdvisor
or FastScan, have multiple graphic panes that change based on the current step
in the process.
7
Lab Exercise
When you move the cursor over a functional or process flow block, the block
changes color to yellow, which indicates that the block is active. When the block is
active, you can click the left mouse button to open a dialog box that lets you
perform a task, or click the right mouse button for popup help on that block.
Button Pane
The button pane is located on the right half of the Control Panel window, as shown
in Figure 2. The button pane provides a list of buttons that are the actions
commonly used while in the tool. You can click the left mouse button a button in
the button pane to perform the listed task, or you can click the right mouse button
that button for popup help specific to that button.
Getting Help
There are many different types of online help. These different types include query
help, popup help, information messages, Tool Guide help, command usage,
online manuals, and the Help menu. The following sections describe how to
access the different help types.
Query Help
Note: Query help is only supported in the DFTAdvisor, FastScan, and FlexTest
user interfaces.
Query help provides quick text-based messages on the purpose of a button, text
field, text area, or drop-down list within a dialog box. If additional information is
available in the online PDF manual, a “Go To Manual” button is provided that
opens that manual to that information. In dialog boxes that contain multiple pages,
query help is also available for each dialog tab.
You activate query help mode by clicking the Turn On Query Help button located
at the bottom of the dialog box. The mouse cursor changes to a question mark.
You can then click the left mouse button on the different objects in the dialog box
to open a help window on that object. You leave query help mode by clicking on
the same button, but now named Turn Off Query Help, or by hitting the Escape
key.
Popup Help
Popup help is available on all active areas of the Control Panel. You activate this
type of help by clicking the right mouse button on a functional block, process
block, or button. To remove the help window:
♦ Click on any other functional block or button in the control panel
♦ Press any key while the control panel is active
♦ Click anywhere in the window itself
♦ Move the mouse outside of the control panel
8
Lab Exercise
Information Messages
Information messages are provided in some dialog boxes to help you understand
the purpose and use of the dialog box or its options. You do not need to do
anything to get these messages to appear.
Tool Guide
Note: The Tool Guide is only available in the DFTAdvisor, FastScan, and FlexTest
user interfaces.
The Tool Guide provides quick information on different aspects of the application.
You can click on the different topics listed in the upper portion of the window to
change the information displayed in the lower portion of the window. You can
open the Tool Guide by clicking on the Help button located at the bottom of the
Control Panel or from the Help > Open Tool Guide menu item.
Command Usage
You can get the command syntax for any command from the command line by
using the Help command followed either by a full or partial command name. For
example, to list all the “Add” commands in MBISTArchitect, enter:
help add
// ADD DAta Backgrounds ADD MBist Algorithms
// ADD MEmory
To see the usage line for a command, enter the Help command followed by the
command name. For example, to see the usage for the DFTAdvisor Add Clocks
command, enter:
help add clocks
// Add Scan Capture Clocks
// usage: ADD CLocks <off_state> <primary_pin...>
// legal system mode: SETUP
To open the reference page for a command using the PDF viewer, execute the
menu item:
Help > On Commands > Reference Page
Next, select the desired command in the list. The PDF viewer opens to the
reference page for the command.
Online Manuals
Application documentation is provided online in PDF format. You can open the
manuals using the Help menu (all tools) or the Go To Manual button in query help
messages (DFTAdvisor, FastScan, and FlexTest). You can also open a separate
shell window and execute $MGC_HOME/bin/mgc_acro. In the PDF viewer, you
then execute the MGC > Bookcases > DFT Bookcase menu item to open the
bookcase of DFT documentation.
9
Lab Exercise
Help Menu
Many of the menu items use a PDF viewer to display the help text associated with
the topic request. To enable the reader’s proper behavior you should ensure that
you have the proper environment. To do so, select the following menu item:
Help > Set Environment
The Help pulldown menu provides help on the following topics:
♦ Open Tool Guide - Opens the ASCII help tool. For more information, refer to
the preceding Tool Guide section. This menu item is only supported in
DFTAdvisor, FastScan, and FlexTest user interfaces.
♦ On Commands > Open Reference Page - Displays a window that lists the
commands for which help is available. Select or specify a command and click
Display. Help opens the PDF viewer and displays the reference page for that
command.
♦ On Commands > Open Summary Table - Opens the PDF viewer and
displays the Command Summary Table from the current tool’s reference
manual. You can then click on the command name and jump to the reference
page.
♦ On Key Bindings - Displays the key binding definitions for the text entry
boxes.
♦ Open Bookcase - Opens the PDF viewer and displays a list of the manuals
that apply to the current tool.
♦ Open User’s Manual - Opens the PDF viewer and displays the user’s manual
that applies to the current tool.
♦ Open Reference Manual - Opens the PDF viewer and displays the reference
manual that applies to the current tool.
♦ Open Release Notes - Opens the PDF viewer and displays the release note
information for this release of the current tool.
♦ Customer Support - Displays helpful information regarding the Mentor
Graphics Customer Support organization.
♦ How to use Help - Displays text on how to use help.
♦ Setup Environment - Displays a dialog box that assists you in setting up your
Online Help environment and PDF viewer.
10
Lab Exercise
Understanding DFT Tools
This chapter discusses tools used in our exercises. We will use DFTAdvisor for
performing scan insertion and FlexTest for test pattern generation.
Inserting Internal Scan and Test Circuitry –
DFTAdvisor
DFTAdvisor is the Mentor Graphics tool that provides testability analysis and
inserts internal test structures into your design. Figure 3 shows the basic flow for
synthesizing scan circuitry with DFTAdvisor.
Figure 3: Basic Scan Insertion Flow with DFTAdvisor
11
Lab Exercise
You start with a DFT library and a synthesized design netlist. The library is the
same one that FastScan and FlexTest use. The netlist formats, you can use with
DFTAdvisor, will be described in the following section. The design netlist you use
as input may be an individual block of the design, or the entire design.
After invoking the tool, your first task is to set up information about the design—
this includes both circuit information and information about the test structures you
want to insert. The next task after setup is to run rules checking and testability
analysis, and debug any violations that you encounter.
Note: To catch design violations early in the design process, you should run and
debug design rules on each block as it is synthesized.
After successfully completing rules checking, you will be in the DFT system mode.
At this point, if you have any existing scan you want to remove, you can do so.
You can then set up specific information about the scan or other testability circuitry
you want added and identify which sequential elements you want converted to
scan. Finally, with these tasks completed, you can insert the desired test
structures into your design.
DFTAdvisor Inputs and Outputs
Figure 4 shows the inputs used and the outputs produced by DFTAdvisor.
Figure 4: The Inputs and Outputs of DFTAdvisor
DFTAdvisor utilizes the following inputs:
♦ Design (netlist)
The supported design data formats are Electronic Design Interchange Format
(EDIF 2.0.0), GENIE, Tegas Design Language (TDL), VHDL, Verilog, and
Spice.
♦ Circuit Setup (or Dofile)
12
Lab Exercise
This is the set of commands that gives DFTAdvisor information about the circuit
and how to insert test structures. You can issue these commands interactively
in the DFTAdvisor session or place them in a dofile.
♦ Library
The design library contains descriptions of all the cells the design uses. The
library also includes information that DFTAdvisor uses to map non-scan cells to
scan cells and to select components for added test logic circuitry.
The tool uses the library to translate the design data into a flat, gate-level
simulation model on which it runs its internal processes.
♦ Test Procedure File
This file defines the stimulus for shifting scan data through the defined scan
chains. This input is only necessary on designs containing pre-existing scan
circuitry or requiring test setup patterns.
DFTAdvisor produces the following outputs:
♦ Design (Netlist)
This netlist contains the original design modified with the inserted test
structures. The output netlist formats are the same type as the input netlist
formats, with the exception of the NDL format. The NDL, or Network
Description Language, format is a gate-level logic description language used in
LSI Logic’s C-MDE environment. This format is structurally similar to the TDL
format.
♦ ATPG Setup (Dofile)
DFTAdvisor can automatically create a dofile that you can supply to the ATPG
tool. This file contains the circuit setup information that you specified to
DFTAdvisor, as well as information on the test structures that DFTAdvisor
inserted into the design. DFTAdvisor creates this file for you when you issue
the command Write Atpg Setup.
♦ Test Procedure File
When you issue the Write Atpg Setup command, DFTAdvisor writes a simple
test procedure file for the scan circuitry it inserted into the design. You use this
file with the downstream ATPG tools, FastScan and FlexTest.
Test Structures Supported by DFTAdvisor
DFTAdvisor can identify and insert a variety of test structures, including several
different scan architectures and test points. Figure 5 depicts the types of scan and
testability circuitry DFTAdvisor can add.
13
Lab Exercise
Figure 5: DFTAdvisor Supported Test Structures
The following list briefly describes the test structures DFTAdvisor supports:
♦ Full scan — a style that identifies and converts all sequential elements (that
pass scannability checking) to scan.
♦ Partial scan — a style that identifies and converts a subset of sequential
elements to scan. DFTAdvisor provides five alternate methods of partial scan
selection:
-
Sequential ATPG-based — chooses scan circuitry based on FlexTest’s
sequential ATPG algorithm. Because of its ATPG-based nature, this
method provides predicable test coverage for the selected scan cells. This
method selects scan cells using the sequential ATPG algorithm of FlexTest.
-
Automatic — chooses as much scan circuitry as needed to achieve a high
fault coverage. It combines several scan selection techniques. It typically
achieves higher test coverage for the same allocation of scan. If it is limited,
it attempts to select the best scan cells within the limit.
-
SCOAP-based — chooses scan circuitry based on controllability and
observability improvements determined by the SCOAP (Sandia
Controllability Observability Analysis Program) approach. DFTAdvisor
computes the SCOAP numbers for each memory element and chooses for
scan those with the highest numbers. This method provides a fast way to
select the best scan cells for optimum test coverage.
-
Structure-Based — chooses scan circuitry using structure-based scan
selection techniques. These techniques include loop breaking, self-loop
breaking, and limiting the design’s sequential depth.
-
Sequential Transparent — chooses scan circuitry based on FastScan’s
scan sequential requirements. Note that this technique is useful for data
path circuits. Scan cells are selected such that all sequential loops,
including self loops, are cut.
14
Lab Exercise
-
Clocked Sequential —chooses scannable cells by cutting sequential loops
and limiting sequential depth. Typically, this method is used to create
structured partial scan designs that can use FastScan’s clock sequential
ATPG algorithm.
♦ Partition scan — a style that identifies and converts certain sequential
elements within design partitions to scan chains at the boundaries of the
partitions.
♦ Test points — a method that identifies and inserts control and observe points
into the design to increase the overall testability of the design.
Simple DFTAdvisor Tutorial
For better understanding of the DFTAdvisor possibilities we will perform a small
experiment. We have prepared for you an experimental design with regular flipflops (9 inputs, 8 FF-s, 208 gates). The design has highly sequential behavior and
therefore it is very hard to test. (Despite its small size FlexTest ATPG can obtain
fault coverage less than 10%). In this tutorial we will replace all flip-flops with
scannable flip-flops and in the next tutorial we can see the implications of this
technique.
The design is located in the directory ~gerje/dft and is named s208.gn Copy
the file together with the ATPG library file atpglib (located in the same directory)
to your working directory.
Start DFTAdvisor:
% dftadvisor
On the line Design: Press Browse... and select your s208.gn
change format to Genie
If necessary,
At ATPG Library: Press Browse... and select atglib
Press Invoke DFTAdvisor
You will see 2 windows: DFTadvisor and DFTAdvisor Control Panel.
In the design there is 1 clock signals: h, which has to be introduced:
1. In DFTAdvisor Control Panel click on Clocks.
2. Select at Primary Input Clocks: /h
3. Set Off-State: to 0 and press >>Add>>
4. /clock 0 will appear on a pane Defined Clock.
5. Press OK.
Press Done With Setup in DFTAdvisor Control Panel.
15
Lab Exercise
After circuit learning process and DFT rules check choose Setup Identification in
DFTAdvisor Control Panel and choose Full Scan <OK>.
Press Run Identification in DFTAdvisor Control Panel.
Choose Run with Existing Settings.
Window DFTAdvisor Identifiaction Run Statistics appears and there you can
follow the progress of the tool.
Close the window by choosing from the DFTAdvisor Identifiaction Run
Statistics window Dismiss.
For performing necessary DFT modifications (replacement of ordinary flip-flops
with scan flip-flops) select Setup/Run Test Synthesis from the DFTAdvisor
Control Panel.
You will see Setup/Run Test Synthesis window. Leave only Synthesize Scan
Cicutiy into the Design marked. Press OK. In the window Use Existing
Settings or Customize choose Run with Existing Settings.
Save the modified design: DFTAdvisor à File à Save à Netlist & Setup
Files...
Mark Save the New Netlist and Save Setup Files for ATPG and give names for
both (For example s208.scan.gn and s208.scan respectively).
As a result of previous steps, we have modified the design by replacing ordinary
flip-flops with scan flip-flops. All scan flip-flops are connected to one single scanchain. In the next tutorial we can see the implications to the fault coverage after
such modification.
16
Lab Exercise
Generating Test Patterns – FlexTest
FlexTest is the Mentor Graphics ATPG tool for generating test patterns. Figure 6
shows the basic tool flow for FlexTest.
Figure 6: Overview of FlexTest Usage
The following list describes the basic process for using FlexTest:
1. FlexTest requires a structural (gate-level) design netlist and a DFT library.
Every element in the netlist must have an equivalent description in the
specified DFT library. At invocation, the tool first reads in the library and then
17
Lab Exercise
the netlist, parsing and checking each. If the tool encounters an error during
this process, it issues a message and terminates invocation.
2. After a successful invocation, the tool goes into Setup mode. Within Setup
mode, you perform several tasks, using commands either interactively or
through the use of a dofile. You can set up information about the design and
the design’s scan circuitry. Within Setup mode, you can also specify
information that influences simulation model creation during the design
flattening phase.
3. After performing all the desired setup, you can exit the Setup mode. Exiting
Setup mode triggers a number of operations. If this is the first attempt to exit
Setup mode, the tool creates a flattened design model. This model may
already exist if a previous attempt to exit Setup mode failed or you used the
Flatten Model command.
4. Next, the tool performs extensive learning analysis on this model.
5. Once the tool creates a flattened model and learns its behavior, it begins
design rules checking.
6. Once the design passes rules checking, the tool enters either Good, Fault, or
ATPG mode. While typically you would enter the ATPG mode, you may want
to perform good machine simulation on a pattern set for the design.
7. You may also just want to fault simulate a set of external patterns.
8. At this point, you might typically want to create patterns. However, you must
perform some additional setup, such as creating the fault list. You can then run
ATPG on the fault list. During the ATPG run, the tool also performs fault
simulation to verify that the generated patterns detect the targeted faults.
FastScan and FlexTest Inputs and Outputs
Figure 7 shows the inputs and outputs of the FlexTest applications.
Figure 7: FlexTest Inputs and Outputs
18
Lab Exercise
FlexTest utilizes the following inputs:
♦ Design
The supported design data formats are EDDM, Electronic Design Interchange
Format (EDIF 2.0.0), GENIE, Tegas Design Language (TDL), Verilog, VHDL,
and SPICE.
♦ Test Procedure File
This file defines the operation of the scan circuitry in your design. You can
generate this file by hand, or DFTAdvisor can create this file automatically
when you issue the command Write Atpg Setup.
♦ Library
The design library contains descriptions of all the cells used in the design.
FlexTest uses the library to translate the design data into a flat, gate-level
simulation model for use by the fault simulator and test generator.
♦ Fault List
FlexTest can read in an external fault list. It can use this list of faults and their
current status as a starting point for test generation.
♦ Timing File
If you want FlexTest to write non-default timing into the test patterns, you must
specify the timing information in this file.
♦ Test Patterns
FlexTest can read in externally generated test patterns and use those patterns
as the source of patterns to be simulated.
FlexTest produces the following outputs:
♦ Test Patterns
FlexTest generate files containing test patterns. It can generate these patterns
in a number of different simulator and ASIC vendor formats.
♦ ATPG Information Files
These consist of a set of files containing information from the ATPG session.
For example, you can specify creation of a log file for the session.
♦ Fault List
This is an ASCII readable file containing internal fault information in the
standard Mentor Graphics fault format.
19
Lab Exercise
Simple FlexTest Tutorial
In the previous tutorial we inserted internal scan circuitry into the design using
DFTAdvisor. In this tutorial we will use FlexTest to generate a set of test patterns.
We will use this ATPG for two different versions of the design: before and after the
DFT modifications and compare the results.
We start with the original design (s208.gn
modifications)
– the version before DFT
Start FlexTest:
% flextest
On the line Design: Press Browse... and select your s208.gn
change format to Genie
If necessary,
At ATPG Library: Press Browse... and select atglib
Press Invoke FlexTest
You will see 2 windows: FlexTest and FlexTest Control Panel.
In the design there is 1 clock signals: h, which has to be introduced:
1. In FlexTest Control Panel click on Clocks.
2. Select at Primary Input Clocks: /h
3. Set Off-State: to 0 and press >>Add>>
4. /clock 0 will appear on a pane Defined Clock.
5. Press OK.
Press Done With Setup in FlexTest Control Panel.
A window with a title FlexTest - Session Purpose will open.
Choose Pattern Generation.
When you will see a window DRC Warnings Occurred, choose No.
After the Test Pattern Generation mode becomes active, choose Fault Universe.
Select Typical (it means, that we will use a classical stuck-at fault model).
Thereafter choose Test Generation and finally Run with Existing Settings.
You will see a window FlexTest ATPG Run Statistics, where you can follow the
progress of a test pattern generation and fault simulation. As you can see the fault
coverage is extremely low and this explains why we have to insert some sort of
DFT modifications into the design.
20
Lab Exercise
After the process has finished, close the window: FlexTest ATPG Run
Statistics à Dismiss and click on FlexTest Control Panel à Report
Statistics...
A new window appears. Mark Entire Design and click on Report. In the
command line window you can see the statistics about the design and test pattern
generation results.
You can save the results by choosing FlexTest à File à Save à
Transcript....
Finally you can close the tool by choosing Exit
In the previous tutorial we have modified the design by replacing ordinary flip-flops
with scan flip-flops. We should start FlexTest once again to check whether such a
modification has any implications on the fault coverage.
Start FlexTest:
% flextest
On a line Design: Press Browse... and select s208.scan.gn (or the name you
gave to your “scanned” design). If necessary, change format to Genie
At ATPG Library: Press Browse... and select atglib
Press Invoke FlexTest
You will see 2 windows: FlexTest and FlexTest Control Panel.
Introduce a dofile: FlexTest->File->Dofile...
In a window Execute Command File choose Browse... and select
s208.scan.dofile. (or the name you chose in the previous tutorial). Click
appropriate times OK.
Continue with test pattern generation as described above....
You should be able to observe significant increase in the fault coverage figures!
21
Lab Exercise
22