1
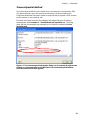
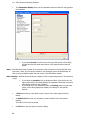
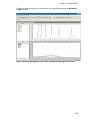
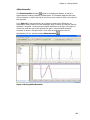
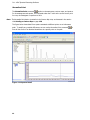
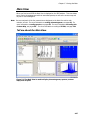
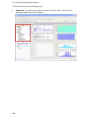
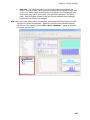
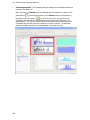
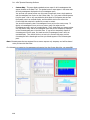
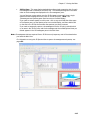
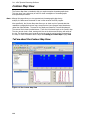
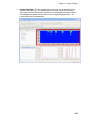
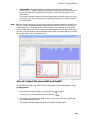
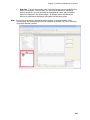
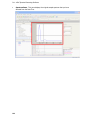
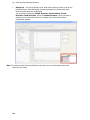
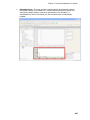
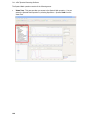
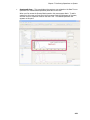
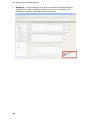
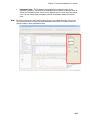
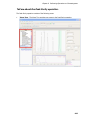
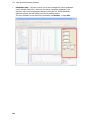
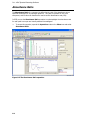
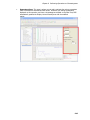
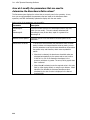
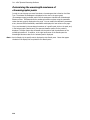
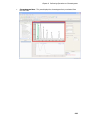
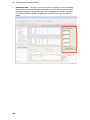
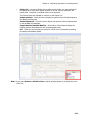
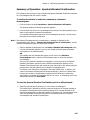
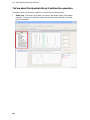
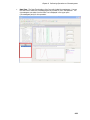
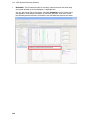
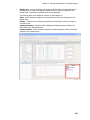
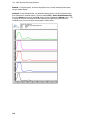
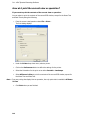
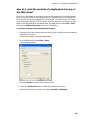
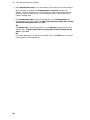
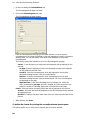
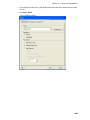
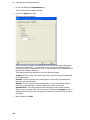
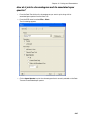
Iris - HPLC Spectral Processing Software
To visually compare how close the apex spectrum of the currently selected
peak matches to additional library spectra:
1. Check Sample on the Hits List.
The peak apex spectrum from the currently selected peak is displayed.
2. Check any number of library spectra on the Hits List that you want to compare.
The selected spectra are displayed in the Results pane.
To examine the Peak Library Search values at different wavelengths:
¾
Enter a new value for Minimum Wavelength and/or Maximum Wavelength.
The Peak Library Search value labels are updated for every peak in the chromatogram.
To examine the effect of using baseline corrected spectra on the Peak
Library Search values:
¾
Check Baseline Correct Spectra.
The Peak Library Search value labels are updated for every peak in the chromatogram.
To add the displayed spectra in the results pane to the Data Tree:
¾
Select Actions > Add All to View.
A dialogue box is be displayed with the message “The data was added successfully”.
On re-displaying the Main View or Chrom/Spectra View the added spectra will appear in
the Data Tree.
To save the results and parameters used in the calculation:
Note: When you save the results of this operation, any existing component lists are deleted and a
new component list is created.
1. Select File > Save Results…
A save dialog appears that asks you to confirm whether or not you want to replace the
component list in the chromatogram’s result file and asks you to confirm whether or not
you want to save the new values to the chromatogram's result file (.RST), and save the
parameters that were used calculate the new values to the associated spectral method
files (.TSM).
2. Click Yes.
A dialog apepars that asks you to confirm that you are sure you want to replace the
component list in the chromatogram’s result file.
3. Click Yes.
Peak Library Search values added to the result file.
274