1
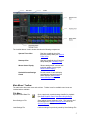
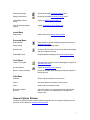
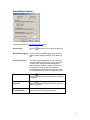
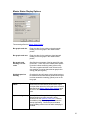
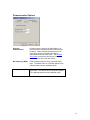
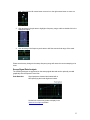
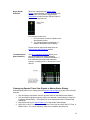
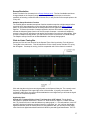
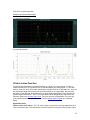
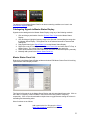
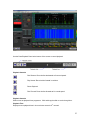
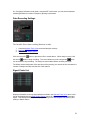
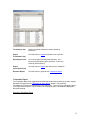
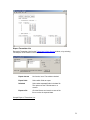
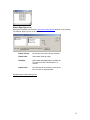
Users Manual Version 1.0.12 Table of Contents Overview ........................................................................................................................... 3 Installation ......................................................................................................................... 3 Minimum Requirements ................................................................................................ 3 Licensing the Software .................................................................................................. 3 Demo Mode................................................................................................................... 4 Software Reference .......................................................................................................... 4 Invisible Waves X Main Window ................................................................................... 4 Main Menu / Toolbar ................................................................................................. 5 General Options Window .............................................................................................. 7 RF Coordinator Assistant Options ............................................................................. 8 Spectral View Options ............................................................................................... 8 Alarm/Status Options ................................................................................................ 9 Master Status Display Options ................................................................................ 10 Downconverter Options ........................................................................................... 11 Spectral Trace View .................................................................................................... 12 Adjusting the Frequency Sweep Range .................................................................. 12 Sweep Signal Data Analysis ................................................................................... 13 Cataloguing Spectral Trace View Signals to Master Status Display ....................... 14 Sweep Resolution ................................................................................................... 15 Click-to-Listen Tuning Bar ....................................................................................... 15 Spectral View Markers ............................................................................................ 16 Click to Listen Function ............................................................................................... 18 Heatmap View ............................................................................................................. 19 Master Status Display ................................................................................................. 20 Master Status Panel ................................................................................................ 20 Cataloguing Signals to Master Status Display ........................................................ 22 Master Status Panel List ......................................................................................... 22 Data Playback Panel ................................................................................................... 24 Dockable Status/Settings Panels ................................................................................ 26 Alarm/Status Settings .............................................................................................. 27 Data Recording Settings ......................................................................................... 28 Signal Peaks List ..................................................................................................... 28 Sweep Settings ....................................................................................................... 29 Spectral View Settings ............................................................................................ 30 Master Status Alarm Settings .................................................................................. 31 RF Coordination Assistant Settings......................................................................... 31 Heatmap Settings .................................................................................................... 36 Sensitivity Settings .................................................................................................. 37 Application Notes ............................................................................................................ 37 Powering On ............................................................................................................... 37 Signals and Sweeping................................................................................................. 38 Suggested Feature Use .............................................................................................. 40 Hardware Notes .......................................................................................................... 42 Contact ............................................................................................................................ 43 2 Overview The Invisible Waves X™ is more than a RF Spectrum Analyzer; it’s your mobile RF Command Center. This new, ground-breaking RF tool encompasses a whole arsenal of “World First” RF analysis, controlling, and monitoring features. Following in the foot steps of the award winning Invisible Waves IW1800 and IW3500, the Invisible Waves X™ continues the tradition of RF Management with the following new features: Catalog & name all RF signals into a Master Status Display RF Level Alert™ to warn when any cataloged signals fall below thresholds UFO Alert™ (Unidentified Frequency Objects™) to warn of rogue interference RF Coordinator™ to identify usable open RF space RF Congestion Scale™ to gauge the severity of local RF Click to Listen™ (CTL - listen-in to all RF signals) RF Event/Alarm Recorder™ and Logger Insta-Save & recall Custom Profiles and Screen Images Traditional RF Spectrum Analyzer Functions Installation *** IMPORTANT *** The setup program must be run before the RF receiver/electronics module is attached to your machine. This is necessary to ensure that the correct drivers are installed and will then later be loaded when the hardware is attached. Insert the Invisible Waves Installation Flash Drive in your computer and run the setup / installation program (e.g. iw_install.msi). When the Setup Wizard runs, follow the prompts for installing the application. Be sure to review the License Agreement as you progress through the installation procedure. When the Setup Wizard has completed then click the ‘Finish’ button. NOTE: The setup program will run 2 separate installations in sequence -- (a) the software and drivers for the receiver/electronics module, and (b) Invisible Waves. Minimum Requirements Operating System: Windows XP, Vista. Windows 7 CPU: 2.0 GHz or above, 32 or 64-bit Memory: 2 GB Hard drive storage: Minimum 200 MB Licensing the Software When the Invisible Waves X software is executed for the first time, the following window appears: 3 Enter the 16-digit software license code you received when you purchased the Invisible Waves X software and click Unlock. The license code tells Invisible Waves X which version of the software was purchased. If a valid code is entered for Invisible Waves LIVE (1.8 GHz), the following message will appear: Likewise, if a valid code is entered for Invisible Waves AV (3.5 GHz), this message will appear: If you elect to click Cancel, the following message indicates that the software will be running in demo mode only: Demo Mode The Invisible Waves X demo-mode functions identically to the non-demo mode, except that communication with the receiver hardware is not possible. This mode is entered into automatically if: 1. The software has not been unlocked by a proper license code. 2. The receiver hardware was not detected. Software Reference This section details the operation of the Invisible Waves X software application. It focuses primarily on functional descriptions and delves somewhat into actual usage to a small degree. More details on actual usage can be found in the Application Notes section. Invisible Waves X Main Window 4 The Invisible Waves X main window includes the following components: Spectral Trace View Real-time graphical plot of the frequency sweep data (see Spectral Trace View). Heatmap View Real-time graphical plot of historical sweep data (see Heat Map View). Master Status Display Shows catalogued RF sources with real-time update of current (see Master Status Display). Dockable Status/Settings Panels Provide control of various display and hardware settings along with status displays (see Dockable Status/Settings Panels). Main Menu / Toolbar The table below lists each menu and sub item. Toolbar icons for available menu items are included where available. File Menu Open Recorded Data File Open a previously recorded sweep data file for playback (see Data Playback Panel, Data Recording Settings). Save Settings to File Save settings current settings to a file. This includes all of the settings in the dockable settings panels and in the General Options window. Load Settings File Loads a settings file previously saved by Save Settings File 5 function. Save Master Status Setup Saves the current configuration of the Master Status Display to a file. Load Master Status Setup Loads Master Status Display configuration file previously saved by the Save Master Status Setup function. Reports Generation of Invisible Waves reports. Further divides into: Master Status Display Report and the Transmitter/Open Spaces Report. Export Exporting of Invisible Waves data. Includes: Master Status Display Transmitters Open Space List Spectral Trace View Data File Spectral Trace View Image Edit Menu Undo/Redo Undo/redo changes made in dockable settings panels and Master Status Display. Delete Delete selected Master Status Panel or Spectral Trace View marker. Properties Open settings window for selected Master Status Panel or Spectral Trace View marker. View Menu Spectral Trace View Show/hide Spectral Trace View window. Heatmap View Show/hide Heatmap View window. Master Status Display Show/hide Master Status Display window. Playback Panel Show/hide Playback Panel. Alarm/Status Display Show/hide dockable Alarm/Status Settings panel. Data Recording Show/hide dockable Data Recording Settings panel. Signal Peaks List Show/hide dockable Signal Peaks List panel. SettingsSweep Show/hide dockable Sweep Settings panel. SettingsSpectral View Show/hide dockable Spectral View Settings panel. SettingsMaster Status Alarm Show/hide dockable Master Status Alarm Settings panel. SettingsRF Coordination Assistant Show/hide dockable RF Coordination Assistant Settings panel. 6 SettingsHeatmap Show/hide dockable Heatmap Settings panel. SettingsSensitivity Show/hide dockable Sensitivity Settings panel. ListsMaster Status Panels Opens the Master Status Panel List. ListsTransmitters/Open Spaces Opens Transmitter & Open Spaces List. Insert Menu Status Panel Adds a panel to the Master Status Display. Scanning Menu Enable Sweep Pause Sweep Starts frequency sweep and displays signal information in Spectral Trace View. Pauses currently running sweep. Reset Sweep Clears the Spectral Trace View window and all sweep data, and then restarts the sweep. Enable MSD Scan Enables/disables updating of the Master Status Display. Tools Menu Listen at Tuning Bar Activates Click-to-Listen function and displays tuning bar in Spectral Trace View. General Options Opens the General Options window. Reset to Factory Settings Resets all dockable panel settings and General Options to factory defaults. Help Menu Contents Shows help documentation contents tree. Search Activates help documentation search function. Index Shows help documentation index. Re-license Invisible Waves X Select this option if you have purchased an upgrade and wish to unlock the new capabilities by entering a new license code. General Options Window The General Options window includes general settings that are not changed frequently and are therefore not included in the dockable settings panels. 7 RF Coordinator Assistant Options Max transmitters Sets the maximum number of transmitter locations determined by the RF Coordination Assistant. Spectral View Options These setting affect the Spectral Trace View. dBm scale min Minimum value displayed in the signal strength scale. dBm scale max Maximum value displayed in the signal strength scale. Max peak markers Maximum number of peak markers displayed. 8 Alarm/Status Options These setting affect the Alarm/Status Settings panel. Alarm log file Click on to. Enable alarm logging Check this box to enable logging of alarms in the Master Status Display Alarms list to the alarm log file. Clear alarm log file The alarm log file is appended to, not overwritten, and can therefore get pretty full. Check this box to clear the alarm log file automatically when the General Options window is closed. This check is not persistent, meaning that it will always be unchecked when the window is opened, and must be checked each time you wish to clear the log file. UFO alarm sound file Click on and select an existing audio file (.WAV format only) that will be played when the UFO alarm is triggered. Low-level alarm sound file and select an existing audio file (.WAV Click on format only) that will be played when the Low-level alarm is triggered. RF congestion threshold (dBm) Noise threshold below which sweep signal data is ignored for the RF congestion calculation. and select a file to output the alarm log 9 Master Status Display Options These setting affect the Master Status Display. Bar graph scale min Enter the value for the minimum signal strength reading for the bar graph in the master status panels. Bar graph scale max Enter the value for the maximum signal strength reading for the bar graph in the master status panels. Bar graph scale warning % of fullscale Specifies the percentage of the bar graph full scale (scale max – scale min) in the master status panels is used to indicate a warning state (yellow zone). This value, together with the scale min and scale max settings, is used to determine bar graph color zoning (red-yellow-green). Highlight panel on warning Checking this box will cause a thick yellow border to be drawn around master status panels whose signal level has entered the warning (yellow) zone on the bar graph. Highlight panel on alarm Checking this box will cause a thick red border to be drawn around master status panels whose signal level has fallen below the low-signal alarm threshold specified in the Master Status Alarm Settings panel. Check the Blink box and the red alarm border will blink. Update during sweep Invisible Waves X is capable of updating the Master Status Panels even while a sweep is being performed for the Spectral Trace View. However, the additional signal sampling will slow down the sweep significantly. Check this box and status panel updating will be turned off while sweeping is enabled. 10 Downconverter Options Adjust to downconverter Check this box to configure Invisible Waves X to function with the optional frequency downconverter hardware. When checked, the frequencies of all signal scan results are shifted and scaled to compensate for the downconverter. The Spectral Trace View min and max plot frequency limits are also changed to reflect the new scaling. Min frequency (MHz) Enter the base frequency of the converted signal input. The default value of 1700 MHz applies to the standard downconverter hardware option. Max frequency (MHz) Enter the maximum frequency of the converted signal input. The default value of 3500 MHz applies to the standard downconverter hardware option. 11 Spectral Trace View The Spectral Trace View basically provides a real-time graphical representation of a signal sweep. Enable sweeping by selecting ScanningEnable Sweep in the main menu. While sweeping is active, the sweep indicator move across the plot area, showing the current frequency being sampled. Plot traces can be turned on/off in the Spectral View Settings panel, and represent the following: Current (green trace) Plot data from current sweeping. Trace plot to the left of the sweep indicator shows signal data from the current sweep, while the plot to the right of the indicator reflects the last sweep. Shadow (gray trace) Plot data from the previous trace. Not affected by position of sweep indicator. Average (yellow trace) Show a running average of the last N traces, where N is specified in the Average over field of the Spectral View Settings panel. Reset the average by clicking on the Reset Avg button in the same panel. Maximum hold (red trace) Shows the maximum signal values across all sweeps. Reset this trace by clicking on the Clear Max button in the Spectral View Settings panel. Adjusting the Frequency Sweep Range The frequency scale of the spectral view specifies the current sweep range. There are several methods available for adjusting the sweep frequency range: 1. Specify exact ranges in the Sweep Settings panel. 2. Click on the button in the toolbar to activate the sweep magnifier function. Then center the mouse magnifier pointer where you would like to zoom in/out the frequency 12 axis. Now click the left mouse button to zoom-in or the right mouse button to zoom out. 3. Click and drag in the plot area to highlight a frequency range, and then double-click in the highlighted region. 4. Click and drag in the frequency scale area to shift the start and end range of the scale. Please note that any change to the sweep frequency range will cause the current sweeping to be reset. Sweep Signal Data Analysis The following analyses are performed on the sweep signal data and can be optionally overlaid graphically onto the Spectral Trace View: Peak Detection Signal peaks are detected and marked with a label specifying their order highest to lowest. Set the limit of how many peaks to display in the Spectral View Options window. 13 Rogue Signal Detection When non-catalogued (see Master Status Display) signals beyond a specific threshold level are detected, a UFO Alarm is triggered (see Alarm/Status window) and the offending signal is marked in the spectral view. The indicator remains until: 1. UFO Alarms are cleared or disabled in the Alarm/Status window. 2. The offending signal is catalogued (i.e.: added to the Master Status Display) Set the minimum signal level threshold in the Master Status Alarm Settings window. Transmitter/Open Space Detection The RF Coordination Assistant allows you to specify parameters for locating available frequency locations for potential transmitters. It then calculates open space and transmitter locations, overlaying them on the Spectral View if desired. Cataloguing Spectral Trace View Signals to Master Status Display Selected signal peaks can be catalogued to the Master Status Display using any of the following methods: 1. Click and drag a peak marker from the Spectral View into the Master Status Display. 2. Click and drag to highlight frequency range in the Spectral View and drag the range into the Master Status Display. The highest level in the selected area will be detected and catalogued. 3. Drag a peak listed in the Signal Peaks List into the Master Status Display. 4. Right-click on the CTL tuning bar in the Spectral Trace View and select Add CTL Freq. to Master Status. The current frequency of the tuner is added to the panels list. 14 Sweep Resolution Select a resolution for the sweep in the Sweep Settings panel. The list of available resolutions changes based on the frequency range of the sweep and a way that helps to reduce the possibility of selecting a resolution that will be too slow, or will provide too few sample points to be of any use. Adaptive Sweep Resolution Function The Invisible Waves standard sweep/scan function sometimes requires multiple sweeps before acquiring all RF data (depending on the resolution and span settings in the Sweep Settings panel). It may therefore take several full sweeps before the full signal level of a transmitter appears. To reduce the number of sweeps required to achieve this maximum results, you can activate the Adaptive Sweep function for the first couple of sweeps. Activation will adaptively sense the rise in the RF waveforms and apply a finer resolution to only those rising signals. After a couple of Adaptive sweep passes, you can click the function off and return to normal sweeps. The adaptive sweep function can enabled/disabled in the Sweep Settings panel. Click-to-Listen Tuning Bar Activate the Click-to-Listen function for the Spectral Trace View by selecting ToolsListen at Tuning Bar in the main menu. This will activate the Click-to-Listen function and the CTL tuning bar will appear. If a sweep is running, it will be suspended until Click-to-Listen is turned off. Click and drag the tuning bar across signal peaks on the Spectral View plot. The currently tuned frequency is displayed in the upper right corner of the window. If properly connected to the computer’s audio input, the receiver will demodulate the tuned signal and you will hear the signal audio out the computers speakers. Application Note: Use the CTL™ feature (Click to Listen™) to listen-in to all RF signals. To help identify transmitters or potential interference, use the CTL tuner function to “listen in.” Please note that the CTL function will tune-in and demodulate any analog signal, i.e., FM radio stations, most VHF and UHF wireless microphones, wireless intercom, 2-way radio, etc., but it will not demodulate digital transmission such as cellular phones or encrypted data. But you can still hear the digital noise from those digital transmissions which will allow for potential signal identification. The CTL 15 tuning indicator can be dragged left or right across the frequency scale in the Spectral Trace View. Once you tune into a transmission, you can right click and select/place the tuned transmission into the Master Status Display as a cataloged signal. Spectral View Markers Double click in any open space in the Spectral View to add a Spectral View Marker. Click on the marker pointer and drag to move the entire marker. Click on the marker label to drag just the label. To delete the marker, right-click on the marker and then select Delete Marker in the pop-up menu. Double click on the marker to bring-up the Marker Settings window. Marker Settings This window lets you customize the appearance of a Spectral View Marker. By default, the markers label will show the frequency and dBm value at the marker’s locations, and will change as the marker is moved. To customize the label text, check the Custom label box and enter the desired marker label. Click the Set Marker Color button to bring-up a color selector from which to choose a new color for the marker. Export Spectral View Plot Data Invisible Waves X can export the currently displayed trace into a field delimited data file. In the main menu, select FilesExportSpectral Trace ViewData File to bring-up the Export Plot Data window. Export data set Select which traces you wish to export. Export fields Select which fields to export. Export data set labels When checked, the first column in the data file will show the data set label enclosed in quotes (“”). Delimited Select what separated fields in the data file. The options are the TAB character or a comma. Export to file Click the Browse and enter the name of the 16 file to receive the exported data. Click OK to complete exporting. Example Plot Data Export File: Export Spectral View Plot Image Export an image of the Spectral Trace View window by selecting FilesExportSpectral Trace ViewImage File in the main menu to bring up the Export Window Image window. Export to Select whether to export to a file, or to the Windows clipboard. File type For file exports, select the image file type to export to. For printing Check this box if the color and layout of the image should be suitable for printing. Export to file Click the Browse and enter the name of the file to receive the exported image. 17 Click OK to complete exporting. Examples of Exported Plot Images: (For printing not checked) (For printing checked) Click to Listen Function To help identify transmitters or potential interference, use the CTL tuner function to “listen in”. Please note that the CTL function will tune-in and demodulate any analog signal, i.e., FM radio stations, most VHF and UHF wireless microphones, wireless intercom, 2-way radio, etc., but it will not demodulate digital transmission such as cellular phones or encrypted data. But even with that said, you can still hear the digital noise from those digital transmissions which will allow for potential signal identification. The CTL tuning indicator can be dragged left or right across the frequency scale in the Spectral Trace View. Once you tune into a transmission, you can rightclick and select/place the tuned transmission into the Master Status Display as a cataloged signal. Application Notes: Click-to-Listen (CTL) set-up: The CTL audio output is a mono, line-level signal appearing on a 3.5mm mini stereo plug. The recommend connection requires running the mini-plug audio output 18 signal into the computer microphone input - adjust levels - and then use the computer audio output to feed headphones, a mixer or powered speakers. Or, take the mini-plug audio output and plug it directly into a mixer audio input (when using this method there is the potential for continuous extraneous noise). In either case, the typical audio mixer inputs could include: Cue Input, Aux, Tape Input; any Bus that will allow headphone or local monitor soloing. Unique Click-to-Listen (CTL) applications Use the CTL function as a playback source; play local FM radio stations. Simply input the FM radio band (88MHz to 160MHz) and drag the CTL Tuning Bar to find an appropriate station. *Use the CTL to monitor other event communications and wireless intercom transmissions. For example, listen-in to emergency 2-way communications, promoter communications or LD communications. Tune into Assisted Listening frequencies to confirm proper transmissions. *Please note that it may be illegal to monitor certain transmissions. Heatmap View The Heat Map (also sometimes referred to as a “Histogram”) displays RF energy over time and therefore provides a visual history ‘look-back’ for intermittent RF “hits” and overall RF activity. The frequency range of the Heatmap View is locked to that of the Spectral Trace View. The Time axis shows time in hours:minutes:seconds format, and will scroll down when sample data time exceeds the programmed time span. When this happens, use the scrollbar to scroll the Heatmap Plot in time. The color of the plot represents the strength of the signal at the given frequency and time, with the Intensity Scale Key showing the corresponding dBm values for the displayed colors. The programmed time span and the intensity scale are both set in the Heatmap Settings panel. (Please note that it may take several initial sweeps before the display begins to draw.) 19 Master Status Display The Master Status Display contains a list of important signals that have been catalogued by the user. Each panel in the display shows a single catalogued signal and is called a Master Status Panel. Master Status Panel The Master Status Panel displays the current signal level of a catalogued signal. Its components are: Panel Label User-supplied label to identify catalogued signal. This is set in the Master Status Panel Settings window. Signal Frequency The frequency of the signal. This is set automatically when a signal is catalogued from the Spectral Trace View window or the Signal Peak List panel. It can also be set manually in the Master Status Panel Settings window. Current Signal Level/ Bar graph Shows the current power level of the signal in dBm and as a color-zoned bar-graph. The zones are: Green – Signal strength is OK Yellow – Warning: signal strength low Red – Alarm: signal strength below threshold. 20 The red zone is determined by the Low signal alarm setting in the Master Status Alarm Settings panel. Click-to-Listen Click on this button to activate the click-tolisten (CTL) function for the panel’s signal. Click again to disable CTL. Clicking the CTL button on panel, will disable CTL running on any other panel, or on the Spectral Trace View. Double-click on the panel to bring-up the Master Status Panel Settings window. Master Status Panel Settings Panel Label Label to uniquely identify catalogued signal. Frequency (MHz) Center frequency of catalogued signal. Bandwidth (MHz) Bandwidth threshold of catalogued signal. Any signal within this range of the center frequency is considered to be this signal. The default value of 0.1 MHz is usually adequate. Color Select a color for the panel. Bypass low-level alarm Check this box to prevent this catalogued signal from triggering a low-level alarm if it drops below the threshold set in the Master Status Alarm Settings panel. Alarm and Warning Condition When a panel’s signal drops below the Low-signal alarm threshold set in the Master Status Alarm Settings panel, a thick, red, blinking border appears around the panel, and the alarm icon is shown. Similarly, when the signal drops to the yellow zone, a yellow border is drawn around the panel, but no icon is shown. 21 The behavior of the Master Status Panel in an alarm or warning conditions can is set in the Alarm/Status Options window. Cataloguing Signals to Master Status Display Signals can be catalogued to the Master Status Display using any of the following methods: 1. Click and drag a peak marker from the Spectral Trace View into the Master Status Display. 2. Click and drag to highlight frequency range in the Spectral View and drag the range into the Master Status Display. The highest level in the selected area will be detected and catalogued. 3. Drag a peak listed in the Signal Peaks List into the Master Status Display. 4. Right-click on the CTL tuning bar in the Spectral Trace View and select Add CTL Freq. to Master Status. The current frequency of the tuner is added to the panels list. 5. Select InsertStatus Panel in the main menu, and enter the desired frequency manually. 6. Manually add a panel in the Master Status Panel List. Master Status Panel List Right-click in the Master Status Display window and select Edit Master Status Panel List to bring up the Master Status Display window. This lists all of the panels in the Master Status Display and their associated frequencies. Click on the Label or Frequency column headers in the list to sort the list by label or frequency, respectively. Click on the column header multiple times to toggle between sorting the column in ascending and descending order. Other functions are as follows: Add Add a panel to the list. Brings up the Master Status Panel Settings window for manual 22 entry of panel settings. Delete Delete selected panels. Edit Edit selected panel settings. Generate Report Creates the Master Status Report. Export Export the Master Status List to a file (see Export Master Status Display List). Master Status Report The Master Status Report can be generated from either the Master Status Panel List or by selecting FileReportsMaster Status Display from the main menu. The user is first required to select a file to contain the report. After the report is generated and saved to the specified file, it is automatically opened in Microsoft Notepad for review and printing. Sample Master Status Report: Export Master Status Display List Exports the Master Status List to a delimited text file. Does not automatically open exported file for display. Export data set No function, leave checked. 23 Export fields Select which fields to export Delimited Select what separated fields in the data file. The options are the TAB character or a comma. Export to file Click the Browse and enter the name of the file to receive the exported data. Sample Export of Master Status Panel List: Data Playback Panel The Invisible Wave X application can playback previously recorded sweep data (see Data Recording Settings). Playback includes complete Spectral Trace View traces and overlays, Heatmap plot and Master Status Display panels. Open a previously recorded data file by selecting FilesOpen Recorded Data File from the main menu, and then selecting the recorded file from the file window. After opening the file, Invisible Waves X will automatically enter playback mode, and the main screen will look like this: 24 Use the Data Playback Panel at the bottom of the screen to control playback. Playback Controls Fast Reverse: Runs timeline backwards at 5x normal speed. Play Normal: Runs timeline forward in real-time. Pause Playback Fast Forward: Runs timeline forwards at 5x normal speed. Playback Controls Slider moves as playback time progresses. Click and drag the slider to scrub through time. Playback Time Displays current playback time in hours:minutes:seconds:10th seconds. 25 Master Status Display Playback Recorded file also includes Master Status Display panel configuration so that during playback, the Master Status Display is loaded with the panels as they existed when the recording was made. The panel configuration is restored to normal when playback is turned off. Dockable Status/Settings Panels The dockable panels provide easy access to functions and parameters that are used frequently. Each panel is capable of being attached anywhere to the left or right side of the application window. They can also be detached to function as a floating window. To move a panel, simply drag it by its title bar to a new position. Panels can be shown/hidden from the View Menu in the main menus or using toolbar buttons. 26 Alarm/Status Settings Cursor Position If the mouse pointer is over the Spectral Trace View plot area, this window will display the position of the cursor in frequency and dBm. If over the Heatmap View it will display the associated frequency. In all other mouse pointer locations, “Not Available” is displayed. RF Congestion Displays current RF Congestion, on a scale of 0%-100%, in both numeric and bar graph form. UFO Alert Indicator Flashes whenever a frequency sweeps detects an un-catalogued (or “rogue”) signal over the threshold set in the Master Status Alarm Settings window. This alarm is optionally accompanied by and audible alert. In addition, an alert icon is placed in the Spectral View plot area at the peak of the rogue signal. The alarm and associated alert icons remain until cleared by clicking the Reset button. Enable UFO Alarm Check to enable UFO alarm and all associated indicators. Uncheck to disable the alarm. Master Status Alarm Log Maintains a list of the most recent low level alarms, along with its associated Master Status Panel label, and the following status words: “SET” – signal has fallen below low-level threshold. “CLEARED” – signal level has returned to above the low-level threshold. Clear this list by clicking on the Reset button. Audible Alarm When checked, each alarm is accompanied by an audio indication (see Alarm/Status Options). Uncheck it to silence audio alarms. Application Note: Use the RF Congestion Scale™ to gauge the severity of local RF. This gauge will help you determine just how much attention and detail will be required in transmitter frequency spacing. 27 Or, if the gauge indicates a really harsh, congested RF environment, you can select transmitter models/types based on minimum frequency spacing requirements. Data Recording Settings The Invisible Waves data recording functions records: 1. Complete Spectral Trace View traces and analysis overlays 2. Heatmap Plot 3. Master Status Display panels Click the record file button to pre-select a file to record data to. When ready to record, click button to begin recording. The record button turns into a stop button which the record can be clicked to stop recording. The sweep must be enabled before recording can begin. The Status section keeps track of the start time of the recording, the amount of time recorded, the number of sweeps recorded, and the size of the data file. Signal Peaks List Displays information on the top signal peaks as marked in the Spectral Trace View. Items in this list can be dragged into the Master Status Display, which will create a panel for the associated signal. This can also be accomplished by right-clicking on the desired peak and selecting Add peak(s) to Master Status. 28 Sweep Settings Frequency Range These fields set the sweep range of the Spectral Trace View. Manual entry Start and Start will automatically adjust the Center and Span values and vice versa. Frequencies entered into the field are assumed to be in MHz; however the units can be explicitly specified by appending the units (“KHz”, “MHz”, “GHz”) to the end of the frequency. Examples of valid frequency entries include: 520.1 MHz 1.3 GHZ 100 KHz. Resolution Select the trace resolution. Selections range from 2 KHz to 3.0 MHz, but are limited based on the range of the sweep. Enable adaptive sweep Check this box to enable adaptive sweeping. Sweep Interlacing The Invisible Waves application employs an interlaced scanning approach that converges on a “sub-resolution” accuracy of either 10 KHz, 25 KHz or 50 KHz, chosen automatically based on the user selected resolution and the range of the sweep. Every interlaced sweep pass is performed at the user specified resolution with each consecutive sweep being offset by the sub-resolution amount. After multiple sweeps, the sub-resolution accuracy is obtained. This approach allows the user to quickly see a “rough sketch” of the signals in the swept range, which each consecutive sweep adding more accuracy to the plot. Adaptive Sweeping Sub-resolution accuracy can also be obtained quickly for signals identified early in the interlaced sweeps by enabling the adaptive sweep function. When enabled, each interlaced sweep at the user-specified resolution is followed by a subsequent “adaptive” sweep that zeros in on detected signals and performs a more accurate scan on that signal. The sweep indicator in the Spectral Trace View turns yellow to indicate that an adaptive sweep is taking place. Application Note: Use the Adaptive Sweep™ function to increase sweep speeds. The Invisible Waves standard sweep/scan function sometimes requires multiple sweeps before acquiring all RF data (depending on the resolution and span settings). So, it may take several full sweeps before the full signal level of a transmitter appears. To reduce the number of sweeps required to achieve these maximum results, you can activate the Adaptive Sweep function for the first couple of sweeps. Activation will adaptively sense the rise in the RF waveforms and apply a finer resolution 29 to only those rising signals. After a couple of Adaptive sweep passes, you can click the function off and return to normal sweeps. Spectral View Settings These settings apply to the Spectral Trace View. Vertical Scale Adjusts the top range of the Signal Strength (dBm) scale. Limited by the dBm scale max value in the Spectral View Options window. Show Traces Enable display of the Current, Average, Maximum hold and Shadow traces by checking the associated box. Reset Average Click this button to reset the averaging function used to calculate the Average trace. Clear Max Click this button to reset the Maximum hold trace. Average over … sweeps Enter how many sweeps to be used in the calculation of the Average trace. Show markers Check this box to show/hide Spectral Trace View markers. Show peak markers Check this box to show/hide Spectral Trace View peak markers (see Sweep Signal Data Analysis). Hide sweep indicator Check this box to hide the sweep indicator line. 30 Master Status Alarm Settings These settings apply to the Master Status Display. UFO alarm (dBm) Threshold of UFO alarm detection. Any non-cataloged signals above this level are considered to be “rogue” and will trigger the UFO Alarm in the Alarm/Status Panel. Low signal alarm (dBm) Threshold of the low signal alarm detection. Any cataloged signals below this level will trigger the Low-level Alarm in the Alarm/Status Panel. Application Notes: Set the UFO Alert™ (Unidentified Frequency Objects™) to warn of unexpected interference. Once all signal are cataloged as Master Status Panels in the MSD adjust the UFO threshold level (typically set to around -85dbm) to warn of rogue interference. If any new, un-cataloged signals appear, the UFO Alert will appear in the Spectral Trace screen, the UFO Alert will flash, and an audio beep is generated from the computer. Set the RF Level Alert™ (Low signal alarm) to warn when any cataloged signal levels fall below assigned thresholds. Once all signals are cataloged as Master Status Panels in the MSD, set the RF Level Alert to warn when any cataloged signal levels fall below assigned thresholds. A RF Level Alert could be an indication that a transmitter has moved into a dead spot, out of range, some source of interference is diminishing the transmitters output, or possibly that the transmitter battery is bad. RF Coordination Assistant Settings 31 The RF Coordination Assistant helps identify potential placement for transmitters by analyzing a spectral sweep and locating “open spaces” in the sweep’s frequency range that are large enough to accommodate a transmitter base on user-specified parameters set in this panel. An “open space” is defined as a frequency range where the ambient signal level does not exceed the threshold value specified in the Noise threshold field. Noise threshold Specifies the signal threshold below which a frequency range can be considered “open space”. Bandwidth The amount open space required to accommodate a single transmitter. Spacing The minimal amount of open space that must exist between transmitters. Show threshold line Check this box to display the noise threshold line in the Spectral Trace View. Show open RF spaces Check this box and open space is represented by a white “glow” around the noise threshold line in the Spectral Trace View. Show transmitters Check this box to show a graphical representation of suggested transmitter placements. Application Note: Scan and use the RF Coordinator™ to identify usable open RF space. Set the parameters for the RF Coordinator (typical settings: 500 KHz Bandwidth, minimum of 500 KHz spacing, and threshold level at 80dbm). Then view both the graphics on the screen and/or the hard data for potential, usable open RF Space. Please remember that you may still have to take into account RF inter-modulation components. Transmitter & Open Spaces List Select ViewListsTransmitters/Open Space in the main menu to bring up the Transmitters & Open Spaces window. 32 Transmitters (list) Shows suggested transmitter locations sorted by frequency. Export (Transmitters list) Click this button to export transmitter list to a data file. Open Spaces (list) List of open spaces showing start frequency, end frequency and frequency span (end freq. – start freq.), sorted by start frequency. Export (Open Spaces list) Click this button to export open spaces list to a data file. Generate Report Click this button to generate the Transmitter Report. Transmitter Report The Transmitter Report lists suggested transmitter placements along with all open space ranges. Generate the report from the Transmitter & Open Spaces window, or by selecting FileReportsTransmitter/Open Spaces in the main menu. The user is first prompted to select a file report will be written to. Upon creation, the completed report is automatically displayed in Microsoft Notepad. Example of Transmitter Report 33 Export Transmitter List Export the Transmitter List from the Transmitter & Open Spaces window, or by selecting FileExportTransmitters in the main menu. Export data set No function, leave Transmitters checked. Export fields Select which fields to export Delimited Select what separated fields in the data file. The options are the TAB character or a comma. Export to file Click the Browse and enter the name of the file to receive the exported data. Sample Export of Transmitter List: 34 Export Open Space List Export the Transmitter List from the Transmitter & Open Spaces window, or by selecting FileExportOpen Spaces in the main menu. Export data set No function, leave Open Spaces checked. Export fields Select which fields to export Delimited Select what separated fields in the data file. The options are the TAB character or a comma. Export to file Click the Browse and enter the name of the file to receive the exported data. Sample Export of Open Spaces List: 35 Heatmap Settings These settings apply to the Heatmap View. Intensity scale Sets the upper dBm limit of the intensity scale. Heatmap plot colors are updated in real-time to reflect the new setting. Time span Enter the amount of time shown in the Heatmap View in the format minutes:seconds. 36 Sensitivity Settings Changes to these settings are immediately reflected in an active sweep. Enable automatic gain control Enables the receiver’s automatic gain control (AGC). IF Gain Specifies manual gain setting of the intermediate filter on a scale from 0 to 100, where 100 is maximum gain. This function is only enabled when Enable automatic gain control is unchecked. Enable RF pre-amp (12 dB increase) Check to enable RF pre-amp. Un-checking reduces receiver sensitivity by 12 dB. Enable input atten. (18 dB drop) Check to reduce receiver sensitivity by an additional 18 dB. Application Notes Note: some of these notes have been included in other areas of this manual. Powering On With the computer powered-up and running Windows, attach the RF receiver to your machine using the USB cable included in the package. If you have the optional Smart LiPO rechargeable battery pack, power it on first followed by the IWx scanner module. The battery pack has a single, multi-colored status LED that will blink once every 2 seconds. The receiver has a single, blue LED that will display two short flashes every second. When the application is running and communicating with the receiver then this pattern will change to one short flash followed by one long flash every second. About the Optional Battery Pack The Smart LiPO battery pack will typically provide power for 3 to 6 hours of continuous use. The external AC/DC adapter is used to recharge the battery pack. The IWx scanner may still be used while the battery is charging. 37 The battery pack will also function as an uninterruptible power source (UPS). Under normal circumstances, the IWx Scanner is powered from the power adapter (via the battery pack) and in case of AC power dropout, the power for the IWx scanner is immediately supplied by the battery pack without any noticeable interruption. The remaining battery charge is indicated in percentages of total charge, corresponding to the following colors: Green = 95-100% (full charge) Yellow = 80% Orange = 60% Orange/red = 40% Red = 20% Flashing red = less than 10% IMPORTANT: 1. Do not deeply discharge the batteries. In contrast to the older NiMH or NiCd type of cells, the LiPo cells have no memory effect and there is no need for a deep discharge to maintain their useful life and capacity. 2. Avoid charging the batteries in excessively cold or excessively hot conditions. The Smart battery pack will automatically prevent charging under such extreme conditions so that the batteries will not suffer any damage, but this may mean that the charge cycle will not be completed. Also, storing the battery pack at very high temperatures will significantly speed up self-discharging and shorten the battery life. Signals and Sweeping LEVELS – The IWx dbm “typical” scale range is from -30dbm down to the RF noise floor at around -120dbm. There are no ‘hard rules’ as to what constitutes a strong signal vs. a weak signal (because it’s all relative to the RF noise floor and interference levels), but generally we say the following: 0dbm to -30dbm: very strong -30 dbm to -70dbm: very good -70dbm to -90dbm: weak, but usable -90dbm to -110dbm: very weak (possibly still usable provided there are no stronger, overpowering interfering signals) -110dbm to -130dbm: not usable RANGE / SPAN – Always select the smallest frequency range required (no need to waste time sweeping frequencies ranges that are not of interest). Start out with a coarse resolution setting (larger value) and then select finer resolutions as necessary. We recommend a 1MHz, 750KHz or 500KHz resolution to start with. We also recommend that you activate the Adaptive Sweep function for the first couple of sweeps as this will greatly reduce the number of sweeps required to achieve maximum signal level readings (please see below, “Use the Adaptive Sweep™ function to increase sweep speeds”). Please keep in mind, as with any RF spectrum analyzer, the greater the frequency span you select (range), the slower the sweep speed will be. Additionally, the finer the resolution setting the slower the sweep speed will be. Therefore, if you attempt to cover 38 a large frequency span and also set the analyzer to a fine resolution, the sweep speed may become very slow. THRESHOLDS – Setting threshold levels for the UFO Alert, Level Alert, and RF Coordinator requires some initial experimentation, but once you have a feel for appropriate threshold levels, you can probably leave the settings as-is for most events/applications. Thresholds levels are the minimum levels (above or below) in which an action will occur. So, for example, when setting the low Level Alert, you will want the threshold level set at a point, maybe 10dbm to 15dbm above the noise floor, or above a source of potential interference. The same applies for the UFO Alert and RF Coordinator because here you will want the thresholds set just above any potential interference levels. IWxAV VERSION – To use the IWxAV version, you must connect the WinRadio Down Converter (DNC) output to the analyzer electronic antenna input and also select (within the IWx software) the 3.5GHz range option. Once connected and selected, the Invisible Waves IWxAV will now operate in the 1.7GHz to 3.5GHz range. Typical applications for this range include 1.9GHz cellular, 2.4GHz Wi-Fi, intercom, remote control equipment, data linking equipment, etc. Please note that you can only select one range at a time, i.e., the standard range of 9KHz to 1.8GHz or the higher range of 1.7GHz to 3.5GHz. OTHER ANTENNAS – You can connect an antenna combiner or antenna distribution amplifier to the RF input of the IWx analyzer. This will allow you to take direct measurements from your external antennas (which is considered ideal) as opposed to using the included broadband antennas. Please keep in mind, when making direct connections to the analyzer, that the maximum input level of the analyzer is 0dbm (1mW). Exceeding this level will burnout the input stage of the analyzer. Quick Notes User Manual: There is an extensive User Guide (under the Help pull-down), plus there is a Help Assistant (question Mark & Pointer) located in tool bar. Zoom-in and out: There are two ways to zoom in and out within the Spectral Trace View: use the Zoom tool (magnifier in the tool bar). Right click zooms in, and left click zooms out. Or, highlight an area by clicking and dragging across an area of interest and then double click on that area and it will zoom into the highlighted region only. Please note that you can also return to the original frequency span by simply using the Undo and Redo functions. Heat Map: The Heat Map (also sometimes referred to as a “histogram”) displays RF energy over time and therefore provides a visual history (‘look-back’) for intermittent RF “hits” and overall RF activity. Please note that it may take several initial sweeps before the display begins to draw. Data Recorder: The Data Recorder allows you to record all of the IWx parameters for extended periods of time so that the data can be reviewed at a later time. Typical applications include determination of intermittent, interfering frequencies, extended RF studies, site surveys, general RF transmission activity, research applications, etc. Please note that it may take several initial sweeps before the data capture begins. 39 Undo / Redo: Remember that there are multiple levels of Undo and Redo, if you make an entry mistake or wish to go back to a previous setting. Custom Profiles: You can ‘globally’ save all settings for later recall with the “Save Settings” selection and you can save the Master Status Display Panels with the “Save Master Status” selections for later recall. These functions are ideal for reoccurring or consecutive touring performances, performances with multiple acts, or for repeatable measurement taking. Hidden feature: In the Spectral Trace View, place your cursor on the MHz scale values across the bottom of the screen and left click & drag to the left or right. You are now sliding the whole frequency scale up or down, yet retaining the span. Suggested Feature Use Pre-setup and baseline readings Use the RF Congestion Scale™ to gauge the severity of local RF. This gauge will help you determine just how much attention and detail will be required in transmitter frequency spacing. Or, if the gauge indicates a really harsh, congested RF environment, you can select transmitter models/types based on minimum frequency spacing requirements. Scan and use the RF Coordinator™ to identify usable open RF space. Set the parameters for the RF Coordinator (typical settings: 500KHz bandwidth, minimum of 500KHz spacing, and threshold level at -80dbm). Then view both the graphics on the screen and/or the hard data for potential, usable open RF Space. Please remember that you may still have to take into account RF intermodulation components. Setting up your wireless equipment Use the Adaptive Sweep™ function to increase sweep speeds. The Invisible Waves standard sweep/scan function sometimes requires multiple sweeps before acquiring all RF data (depending on the resolution and span settings). So, it may take several full sweeps before the full signal level of a transmitter appears. To reduce the number of sweeps required to achieve these maximum results, you can activate the Adaptive Sweep function for the first couple of sweeps. Activation will adaptively sense the rise in the RF waveforms and apply a finer resolution to only those rising signals. After a couple of Adaptive sweep passes, you can click the function off and return to normal sweeps. Use the CTL™ feature (Click to Listen™) to listen-in to all RF signals. To help identify transmitters or potential interference, use the CTL tuner function to “listen in.” Please note that the CTL function will tune-in and demodulate any analog signal, i.e., FM radio stations, most VHF and UHF wireless microphones, wireless intercom, 2-way radio, etc., but it will not demodulate digital transmission such as cellular phones or encrypted data. But you can still hear the digital noise from those digital transmissions which will allow for potential signal identification. The CTL tuning indicator can be dragged left or right across the frequency scale in the Spectral Trace View. Once you tune into a transmission, you can right click and select/place the tuned transmission into 40 the Master Status Display as a cataloged signal (see “Catalog & name all RF signals into the Master Status Display” below). Catalog and name all RF signals into the Master Status Display, (catalog all your transmitters and any interference). Simply highlight (click & drag across), the transmission in the Spectral View and/or use the Click to Drag function to pull the Peak Marker transmissions down into the Master Status Display (MSD) for cataloging. Catalog signals in the Master Status Display (MSD) are called Master Status Panels (they appear as boxes that contain the transmission frequency, name and signal level). These Master Status Panels can be re-ordered by frequency, name or by your choosing. You can also color code them according to type i.e. vocals, instruments, IEM, etc., and based on the Level Alert threshold that you set, the Master Status Panels’ borders will indicate an alert of Yellow as a caution, and flashing Red as urgent attention needed. Each Master Status Panel also has a Speaker Icon for instant Click to Listen (as fast as you can click from one to the next, you can listen in). As mentioned above in the “Use the CTL™ feature (Click to Listen™) to listen-in to all RF signals” the CTL tuning indicator can also be used to catalog signals. Once you tune-in to a transmission, you can right click and select/place the tuned transmission into the Master Status Display as a cataloged signal. Custom Markers By simply right clicking in the Spectral Trace View screen, you can activate the Marker Points feature and insert Markers. These Markers can be custom named, color coded, positioned and resized as desired. Monitor just the Master Status Display. Once all signals and interferers are cataloged, you can close the Spectral Trace View and monitor from the Master Status Display only. With just one click you can switch back to include the Spectral and other displays. Set the RF Level Alert™ to warn when any cataloged signal levels fall below assigned thresholds. Once all signals are cataloged as Master Status Panels in the MSD, set the RF Level Alert to warn when any cataloged signal levels fall below assigned thresholds. A RF Level Alert could be an indication that a transmitter has moved into a dead spot, out of range, some source of interference is diminishing the transmitters output, or possibly that the transmitter battery is bad. Naturally, you would not want to be alerted if a cataloged ‘interference signal’ became weaker (this would be a good thing!). So, when cataloging the interference into the MSD, you can select to ignore the Level Alert for that specific signal. Set the UFO Alert™ (Unidentified Frequency Objects™) to warn of unexpected interference. Once all signal are cataloged as Master Status Panels in the MSD adjust the UFO threshold level (typically set to around -85dbm) to warn of rogue interference. If any new, un-cataloged signals appear, the UFO Alert will appear in the Spectral Trace screen, the UFO Alert will flash, and an audio beep is generated from the computer. 41 Click to Listen™ (CTL) Connections Click-to-Listen™ (CTL) set-up: The CTL audio output is a mono, line-level signal appearing on a 3.5mm mini stereo plug. The recommend connection requires running the mini-plug audio output signal into the computer microphone input - adjust levels - and then use the computer audio output to feed headphones, a mixer or powered speakers. Or, take the mini-plug audio output and plug it directly into a mixer audio input (when using this method there is the potential for continuous extraneous noise). In either case, the typical audio mixer inputs could include: Cue Input, Aux, Tape Input; any Bus that will allow headphone or local monitor soloing. *Please note that it may be illegal to monitor certain transmissions. Unique Click-to-Listen™ (CTL) applications: Use the CTL function as a playback source; play local FM radio stations. Simply input the FM radio band (88MHz to 160MHz) and drag the CTL Tuning Bar to find an appropriate station. *Use the CTL to monitor other event communications and wireless intercom transmissions. For example, listen-in to emergency 2-way communications, promoter communications or LD communications. Tune into Assisted Listening frequencies to confirm proper transmissions. Hardware Notes CTL Audio When the Click-To-Listen™ (CTL) function is not activated, and using the CTL audio output plugged directly into a mixer or amplifier (not via the computer audio in and out), extraneous noise in the form of clicks and pops appears on the audio output. If this is your only method of connection, it is recommend that you use your audio mixer Solo On/Off, Mute or Volume control to diminish the audio level when not accessing the CTL function. If using the recommend CTL connections (computer mic input and headphone output), there are no noise issues. Carrying Case The IWx hardware is packaged and pre-wired into the included carrying case and removable of the components is not recommended for general use. However, if the IWx is to be permanently installed (“fixed rack installation”), please be sure that the components have adequate ventilation. Warnings The IWxLIVE and IWxAV electronics modules, power pack, and IWxAV Down Converter run warm to the touch. Please do not run the system with the carrying case lid closed or run the system without adequate ventilation/airflow. *The IWx is considered a professional, precision test and measurement analyzer, and is intended for professional test and measurement use only. Please note that it may be illegal to monitor certain wireless transmissions. 42 Contact For Technical Support, please contact Kaltman Creations LLC at: [email protected] or call 678-714-2000 43