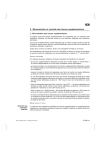
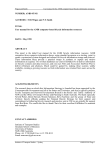
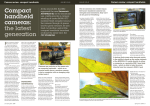
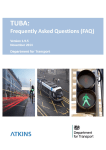
1
Interim Advice Note 159/12 Guidance Note for Traffic Consultants on the Economic Assessment of MM-HSR Schemes INTERIM ADVICE NOTE 159 /12 Guidance Note for Traffic Consultants on the Economic Assessment of MM-HSR Schemes Summary The objective of this document is to assist in the economic assessment of MM-HSR schemes and to assist use of the Initial and Full Responsive Intervention Investment Tool (IFRIIT) by detailing key guidance and information relevant to its use. Instructions for Use This IAN provides guidance and information for immediate use. IAN 159/12 Page 1 of 31 Aug 2012 Interim Advice Note 159/12 Guidance Note for Traffic Consultants on the Economic Assessment of MM-HSR Schemes Contents 1 Introduction 1.1 Background 1.2 Documents Department for Transport Published Documents Highways Agency Published Documents 1.3 Project Control Framework (PCF) 1.4 Required Components of Economic Assessment by PCF Stage 4 4 4 4 4 5 6 2 Initial Assessment during PCF Stage 0 2.1 Guidance for Assessing Transport Economic Efficiency (TEE) Effects 2.2 Guidance for Assessing Other Effects Accidents Journey Time Reliability TEE and Accident Effects due to Maintenance and Construction Costs Reporting 7 7 7 7 8 8 8 8 3 Full Assessments during PCF Stages 1-5 3.1 Guidance for Assessing Transport Economic Efficiency (TEE) Effects 3.2 Guidance for Assessing Other Effects Accidents Journey Time Reliability TEE and Accident Effects due to Maintenance and Construction Costs Reporting 9 9 10 10 11 11 11 11 4 MM-HSR Assumptions 12 5 Contacts 12 Appendices IAN 159/12 13 Page 2 of 31 Aug 2012 Interim Advice Note 159/12 Guidance Note for Traffic Consultants on the Economic Assessment of MM-HSR Schemes 1 Introduction 1.1 Background 1.1.1 This document is intended as a guide for consultants undertaking an economic assessment of schemes involving Managed Motorways - Hard Shoulder Running (MM-HSR) and introduces the Initial and Full Responsive Intervention Investment Tool (IFRIIT). The tool operates in two modes depending on the stage of assessment: i. Initial assessment mode; used for strategy shaping and prioritisation to assess whether MM-HSR is a viable option for a particular location on a link-by-link basis; or Full assessment mode; used in later stages of the Project Control Framework (PCF) to appraise schemes in greater detail. ii. 1.1.2 The objective of this document is to assist in the economic assessment of MM-HSR schemes and the use of the MM-HSR Initial and Full Responsive Intervention Investment Tool. It details key guidelines that the economic assessment and use of the tool must adhere to whilst highlighting assumptions that can be made. 1.2 Documents 1.2.1 The Department for Transport and Highways Agency documents which are relevant to the following guidance in this document are as follows: Department for Transport Published Documents 1.2.2 The Department for Transport publish many documents that outline the various aspects of transport assessment although none deal directly with the subject of MM-DHS. These documents do, however, provide all the information required on economic assessment. Design Manual for Roads and Bridges (DMRB) Volume 12: Traffic Appraisal of Road Schemes; COBA – DMRB Volume 13: Economic Assessment of Road Schemes; QUADRO - DMRB Volume 14: Economic Assessment of Road Maintenance; INCA - Incident Cost Benefit Assessment User Manual; TUBA – Transport User Benefit Appraisal Manual; WebTAG – Transport Analysis Guidance. Highways Agency Published Documents 1.2.3 The use of MM-HSR is a complex and developing process. Additional documents that may assist in the understanding of MM-HSR implementation and possible future developments are: IAN 111 – Managed Motorway Implementation Guide: Dynamic Use of the Hard Shoulder; IAN 112 – Managed Motorway Implementation Guide: Through Junction Hard Shoulder Running. IAN 159/12 Page 3 of 31 Aug 2012 Interim Advice Note 159/12 Guidance Note for Traffic Consultants on the Economic Assessment of MM-HSR Schemes 1.3 Project Control Framework (PCF) 1.3.1 All Major Projects’ road improvement schemes with a value of over £10m are subject to the planning stages presented in the Project Control Framework. The PCF is defined by a simple matrix consisting of a total of 8 PCF Stages. Pre-Project Stage 0 Strategy, Shaping & Prioritisation Stage 1 Option Identification Stage 2 Options Selection Stage 3 Preliminary Design Stage 4 Statutory Procedures & Powers Stage 5 Construction Preparation Stage 6 Construction, Commissioning & Handover Stage 7 Closeout Options Development Construction 1.3.2 For Managed Motorways schemes, Stages 1 and 2 may be combined where there is to be no formal public consultation; and it is possible for Stages 3, 4 and 5 to be combined, where there is no IPC/Statutory Process requirement under Stage 4. 1.3.3 The MM-HSR Initial and Full Responsive Intervention Investment Tool (IFRIIT) should be used to inform economic assessment during Stage 0 and to aid in the production and refinement of the Economic Assessment Report (EAR) throughout Stages 1 to 5 of the PCF process: During PCF Stage 0 IFRIIT can be used in initial assessment mode. During PCF Stages 1-5 IFRIIT should be used in full assessment mode. 1.3.4 During schemes where MM-HSR is being suggested as an alternative option, it may be plausible to use IFRIIT in initial assessment mode during Stage 1; this approach should be discussed with the HA TAME group before being adopted. IAN 159/12 Page 4 of 31 Aug 2012 Interim Advice Note 159/12 Guidance Note for Traffic Consultants on the Economic Assessment of MM-HSR Schemes 1.4 Required Components of Economic Assessment by PCF Stage 1.4.1 As a scheme progresses through the PCF, greater refinement of the economic assessment is required. The initial assessment at Stage 0 is intended to be a guide to the likely impacts of the scheme whilst later stages focus on refining the assessment. As such, not all components of economic assessment are required at each stage. The table below highlights when any given component may be treated as optional. PCF Stage Component 0 Status Cost (to include preliminary assessment of additional maintenance and operational costs) Required Accident analysis Required Impact of maintenance on users Optional Impact of construction on users Optional Journey time reliability Optional Alternative forecasting scenarios Optional Wider economic impacts (impact on Regeneration Areas) Optional Greenhouse gases (carbon) Optional Noise Optional Cost (including full estimate of maintenance and operational cost) Required 1-5 Accident analysis Required Impact of maintenance on users (to include replacement of technology every 15 years) Required Impact of construction on users Required Journey time reliability Required Alternative forecasting scenarios Required Wider economic impacts (impact on Regeneration Areas) Required* Greenhouse gases (carbon) Required Noise Required *This indicates that, in line with standard procedures under WebTAG, an assessment is required to determine the presence of an impact. If an impact is identified then it must be quantified. IAN 159/12 Page 5 of 31 Aug 2012 Interim Advice Note 159/12 Guidance Note for Traffic Consultants on the Economic Assessment of MM-HSR Schemes 2 Initial Assessment during PCF Stage 0 2.1 Guidance for Assessing Transport Economic Efficiency (TEE) Effects 2.1.1 An initial assessment is appropriate for PCF Stage 0 and should be carried out using the IFRIIT tool available from the Highways Agency Traffic Appraisal, Modelling and Economics (TAME) group, or an alternate WebTAG (Web-based Transport Analysis Guidance) compliant process. The benefits predicted from the tool are based on observed flows from the Highways Agency TRaffic Information System (HATRIS) with growth factors from either a scheme traffic model, if available, or otherwise from TEMPRO or the National Transport Model. The tool calculates link transit time benefits, benefits from the relief of queuing, merge delays and vehicle operating cost (VOC) impacts. It does not assess the safety impact or the economic effects of MM-HSR on the wider network beyond the motorway link being considered; neither does it provide data on scheme costs. Scheme costs, calculated in terms of a Present Value Cost, need to be derived outside the tool. 2.1.2 The benefits predicted by the tool over the standard appraisal period, coupled with any additional benefits as outlined in Section 1.4, can then be used in conjunction with scheme costs to ascertain whether MM-HSR is an economically viable option. The methodology to be employed during the initial assessment is given in Appendix A. 2.1.3 The initial assessment mode of IFRIIT is link based, with impacts being calculated for an individual link. When MM-HSR is proposed over consecutive links, the link transit, merging and VOC benefits for each adjoining link on the section of the network being considered for MM-HSR should be added together to provide the overall level of benefits. However, the queuing delays from each link cannot be simply added together as the queuing delay on one link has an effect on the adjacent link(s), therefore only the highest recorded queuing delay calculated from all the links assessed should be used. The methodology to be used when carrying out a consecutive link assessment is given in Appendix B. 2.1.4 The pro forma that should be used to record the economic assessment results is included in Appendix C. If full widening is being considered as an option, IFRIIT should be used to undertake this in order to ensure consistency in the assessment between options. This pro forma therefore includes the option of full widening to simplify reporting. 2.1.5 Appendix D includes the assumptions and details of the calculations undertaken within the initial assessment mode of IFRIIT. 2.2 Guidance for Assessing Other Effects Accidents 2.2.1 An assessment of the effect of MM-HSR on safety is mandatory for the initial assessment stage. Until long term data on the effect of MM-HSR on accident rates are available, it should be assumed that MM-HSR will lead to a 15% reduction in personal injury accident (PIA) rates compared to the Do-Minimum. The reduction is associated with the deployment of variable mandatory speed limits (VMSL) and not with the utilisation of the hard shoulder as a running lane, which is assumed to have a neutral impact. This is based on the reductions achieved from VMSL on the M25, and is an all-day rate, irrespective of the proportion of the day in which MM-HSR is projected to be active. IAN 159/12 Page 6 of 31 Aug 2012 Interim Advice Note 159/12 Guidance Note for Traffic Consultants on the Economic Assessment of MM-HSR Schemes 2.2.2 If Motorway Incident Detection and Automatic Signalling (MIDAS) has not been installed in the Do-Minimum then a further 13% reduction in PIAs can be included (i.e. the accident rate should be reduced by a total of 26% (=1-0.85*0.87)). The initial assessment should be link based using the above factors to derive the scheme safety benefits. 2.2.3 If VMSL and MIDAS are already in place, then the safety assessment should be on the basis of the same accident rate for both the Do-Minimum and Do-Something. Journey Time Reliability 2.2.4 An assessment of the effect of MM-HSR on journey time reliability may be carried out during the initial assessment stage if the required information is available. 2.2.5 Details of what assumptions should be made in the assessment of the impact of MMHSR on journey time reliability are available from the HA TAME group. TEE and Accident Impacts due to Maintenance and Construction 2.2.6 An assessment of the effects of changes in delay due to the maintenance and construction of MM-HSR, using the scheme model, QUADRO or alternative similar assessment, may be carried out for the initial assessment stage if the required information is available. 2.2.7 An outline of the additional maintenance required for an MM-HSR scheme and the likely traffic management regime is included in Appendix E. 2.2.8 During periods of maintenance, the hard shoulder gives scope for areas of the normal running carriageway to be removed without loss of capacity. Once MM-HSR has been implemented this flexibility is not available during periods of high traffic flows, which, in addition to the possibly higher traffic flows under MM-HSR, may lead to an increase in delays during periods of maintenance. Costs 2.2.9 Increased operational costs associated with MM-HSR should be included in the scheme costs for the initial assessment, including any additional staffing costs resulting from additional monitoring by Regional Traffic Control Centre (RTCC) staff and an increased number of patrols by traffic officers. Details of these costs can be obtained from the Managed Motorways Delivery Office. Guidance on incorporating these costs in the economic assessment is included in Appendix F. 2.2.10 The works costs associated with maintenance need to include for the replacement of all MM-HSR and VMSL equipment (excluding gantries) at 15 year intervals, with gantries projected to be replaced at 30 year intervals. Reporting 2.2.11 The report on the initial assessment must include the results of the above assessments providing a comparison of the costs and benefits of MM-HSR and full widening, if applicable, as per the pro forma in Appendix B. The report will also include graphical representations of the benefit stream over time associated with full widening and MM-HSR. IAN 159/12 Page 7 of 31 Aug 2012 Interim Advice Note 159/12 Guidance Note for Traffic Consultants on the Economic Assessment of MM-HSR Schemes 3 Full Assessment during PCF Stages 1-5 3.1 Guidance for Assessing Transport Economic Efficiency (TEE) Effects 3.1.1 For MM-HSR schemes on the Highways Agency (HA) network proceeding beyond Project Control Framework (PCF) Stage 0, a full WebTAG compliant economic assessment must be undertaken. 3.1.2 The full assessment must be based on a validated WebTAG compliant traffic model with variable demand functionality, where appropriate. Allowance must be made for the dynamic nature of hard shoulder running. IFRIIT offers one possible way of accommodating the dynamic nature when run in full assessment mode, although it is possible to modify the standard appraisal using other methods to take the dynamic mechanisms into account. 3.1.3 IFRIIT calculates annualisation factors based on observed base year annual flow profiles combined with flows from models created for annual average weekday AM, interpeak and PM periods, and, where available, off-peak and weekend periods . These annualisation factors can be used with a special version of TUBA (available from the supplier), or an alternate WebTAG compliant process, which allow for varying annualisation profiles in future forecast years. The annualisation factors representing the proportion of the year that MMHSR is active should be assumed to change in a linear fashion between modelled years. The methodology to be employed in a full assessment is given in Appendix G. 3.1.4 The full assessment needs to include all the elements of economic appraisal for a major scheme, including the effects on accidents, maintenance and journey time reliability. The assessment must be undertaken over the standard 60 year appraisal period and it must be remembered that the technological equipment associated with MM-HSR, e.g. CCTV cameras and variable mandatory speed limit (VMSL) signs, will need to be replaced every 15 years, whilst the supporting gantries will need to be replaced on every 30 years. 3.1.5 The full assessment should reflect the operational requirements of MM-HSR including the number of links that would be activated together to form contiguous sections and the hours over which the section would be operational. The results of the initial assessment will help to inform these operational requirements, which will need to be included in the traffic modelling. 3.1.6 IFRIIT also offers the ability to easily identify the control link for each time period for each forecast year, i.e. the link that controls whether or not the scheme would be switched on during a given time period, and thus controls the annualisation factor, although this could be determined from the traffic model. The control link may change between periods and between forecast years. 3.1.7 An economic assessment based on the annual average flows in a modelled period will lead to an understatement of the benefits of MM-HSR. As an extreme example, if the annual average flow for the period is less than the switch on threshold for using the hard shoulder then there would be no benefits predicted at all, even though parts of the year would exceed the threshold. It is therefore necessary to calculate for each modelled time period the annual average flow of when the hard shoulder is switched on and the annual average flow of when it is switched off. 3.1.8 To ensure that the flows on the rest of the network in the model are proportionate to the annual average flows when the hard shoulder is and is not in used, adjustment factors (uplift for when the hard shoulder is in use and depression when it is not) need to be applied to the overall trip matrix. IAN 159/12 Page 8 of 31 Aug 2012 Interim Advice Note 159/12 Guidance Note for Traffic Consultants on the Economic Assessment of MM-HSR Schemes 3.1.9 To facilitate this, IFRIIT calculates a global matrix adjustment factor based upon the ratio between the average Do Something flow in the on periods to the annual average Do Something flow, for each modelled time period and each forecast year. This "uplift" factor will represent an increase to the number of trips in the matrix and is applied to the post variable demand model (VDM) Do Minimum and Do Something matrices to represent the busy portions of the year. It is possible to calculate the uplift factor using alternate tools and the methodology of the calculation is outlined in Appendix G. These matrices should then be assigned for each period and forecast year and the results used in TUBA, or an alternate WebTAG compliant process, together with the calculated annualisation factors to determine the TEE benefits for the scheme. 3.1.10 It should be noted that for environmental assessment purposes it is necessary to obtain traffic flow forecasts for the whole year and not just for those portions of the year when HSR is likely to be switched on. This means that forecasts also have to be prepared for the portions of the year when HSR is likely to be switched off and this necessitates the production of adjusted model matrices that represent the average demands for those times in each forecast year when HSR is switched off. 3.1.11 To facilitate this, IFRIIT calculates a global matrix adjustment factor based upon the ratio between the average Do Minimum flow in the off periods to the annual average Do Minimum flow for each modelled time period. This "depression" factor will represent a reduction to the number of trips in the matrix and is applied to the post VDM Do Minimum matrices to represent the quieter portions of the year. Again, it is possible to calculate the uplift factor using alternate tools and the methodology of the calculation is outlined in Appendix G. These matrices are then assigned for each forecast year and the resultant flow forecasts are applicable to both the Do Minimum and Do Something environmental assessment. 3.1.12 The average of the on and off portions of the year, weighted by the portion of the year in which HSR is predicted to be required by the annualisation factors, would be the annual average so this methodology does not change the total annual flow and merely allows greater resolution for economic and environmental assessment purposes. For some time periods in which the annualisation factors predict the use of MM-HSR for the vast majority of the year (perhaps 90%) a case may be made that this methodology may not be required. Care must also be taken that excessive noise is not caused within the model by the application of this methodology. 3.2 Guidance for Assessing Other Effects Accidents 3.2.1 An assessment of the effect of MM-HSR on safety is mandatory for a full assessment stage. Until long term data on the effect of MM-HSR on accident rates are available, it should be assumed that the introduction of MM-HSR leads to a 15% reduction in personal injury accident (PIA) rates compared to the Do-Minimum. The reduction is associated with the deployment of variable mandatory speed limits (VMSL) and not with the utilisation of the hard shoulder as a running lane, which is assumed to have a neutral impact. This is based on the reductions achieved from VMSL on the M25, and is an all-day rate, irrespective of the proportion of the day in which MM-HSR is projected to be active. IAN 159/12 Page 9 of 31 Aug 2012 Interim Advice Note 159/12 Guidance Note for Traffic Consultants on the Economic Assessment of MM-HSR Schemes 3.2.2 If MIDAS has not been installed in the Do-Minimum then a further 13% reduction in PIA rates can be included for MM-HSR (i.e. the accident rate should be reduced by a total of 26% (=1-0.85*0.87). The full assessment should be based on a full analysis of the modelled network based on WebTAG principles as is required for all major schemes. 3.2.3 If VMSL and MIDAS are already in place, then the safety assessment should be on the basis of the same accident rate for both the Do-Minimum and Do-Something. Journey Time Reliability 3.2.4 An assessment of the effect of MM-HSR on journey time reliability, using INCA or an alternate WebTAG compliant process, must be carried out for a full assessment. The results of this should be reported in the Economic Assessment Report and the Appraisal Summary Table (AST), although in line with current guidance, the results should not be included in the Analysis of Monetised Costs and Benefits (AMCB) table. 3.2.5 Details of what assumptions should be made in the assessment of the impact of MMHSR on journey time reliability are available from the HA TAME group. TEE and Accident Impacts due to Maintenance and Construction 3.2.6 An assessment of the effects of changes in delay due to the construction and ongoing maintenance of MM-HSR, using the scheme model, QUADRO or alternative similar assessment, is mandatory for a full assessment. 3.2.7 An outline of the additional maintenance required for an MM-HSR scheme and the likely traffic management regime is included in Appendix E. 3.2.8 During periods of maintenance, the hard shoulder gives scope for areas of the normal running carriageway to be removed without loss of capacity. Once MM-HSR has been implemented this flexibility is not available during periods of high traffic flows, which, in addition to the possibly higher traffic flows under MM-HSR, may lead to an increase in delays during periods of maintenance. Costs 3.2.9 Increased operational costs associated with MM-HSR should be included in the scheme costs for the full assessment, including any extra staff costs resulting from additional monitoring by RTCC staff and an increased number of patrols by traffic officers. Details of these costs can be obtained from the Managed Motorways Delivery Office. Guidance on incorporating these costs in the economic assessment is included in Appendix F. 3.2.10 The works costs associated with maintenance need to include for the replacement of all MM-HSR and VMSL equipment (excluding gantries) at 15 year intervals, with gantries projected to be replaced at 30 year intervals. Reporting 3.2.11 A full suite of Business Case and Funding products must be produced during PCF Stages 1-5, as laid out in the PCF product descriptions and must include a description of the application of IFRIIT. The Forecasting Report must include details of the flows for both the portions of the year when MM-HSR is predicted to be on and when it is predicted to be off. It should also include the uplift and depression factors for each time period. The Economic Assessment Report (EAR) must include all of the above assessments and detail the costs and benefits of MM-HSR as per the standard Appraisal Summary Table (AST) supporting IAN 159/12 Page 10 of 31 Aug 2012 Interim Advice Note 159/12 Guidance Note for Traffic Consultants on the Economic Assessment of MM-HSR Schemes worksheets; namely the Transport Economic Efficiency (TEE), Public Accounts (PA) and Analysis of Monetised Costs and Benefits (AMCB) tables. It must also include details of the annualisation factors used to calculate future year use of MM-HSR. IAN 159/12 Page 11 of 31 Aug 2012 Interim Advice Note 159/12 Guidance Note for Traffic Consultants on the Economic Assessment of MM-HSR Schemes 4 Underlying MM-HSR Assumptions 4.1.1 All appraisals of MM-HSR should be based on the assumption that hard shoulder running is equivalent to the provision of a full extra lane i.e. the hard shoulder has the same operating capacity as a conventional lane; this assumption should be retained through any assessment. 4.1.2 The results of the M42 MM-HSR pilot have been used to develop an MM-HSR speed/flow curve and to determine the flow at which MM-HSR should be activated. This flow has been determined to be 1,500 vehicles per lane per hour (4,500 vehicles across a three lane carriageway). This is equivalent to a speed of around 60mph. This assumption was developed from the application of MM-HSR at 50 mph but the same activation flow is to be assumed for MM-HSR operating at 60mph. The speed flow curve is available from TAME on request and should be used to represent traffic behaviour under MM-HSR in any assessment. IAN 159/12 Page 12 of 31 Aug 2012 Interim Advice Note 159/12 Guidance Note for Traffic Consultants on the Economic Assessment of MM-HSR Schemes 5 Contacts 5.1.1 Queries on this document should be made to: Roger Himlin Traffic Appraisal, Modelling and Economics, Room 406, City Tower, Piccadilly Plaza, Manchester. M1 4BE Tel: 0161 930 5672 GTN: 4315 5672 Email: [email protected] IAN 159/12 Page 13 of 31 Aug 2012 Interim Advice Note 159/12 Guidance Note for Traffic Consultants on the Economic Assessment of MM-HSR Schemes Appendix A: The Methodology for an Initial Assessment 1. The initial assessment should be based upon splitting a year into a number of flow groups. One basis for this is that used within COBA, which uses eight flow groups to cover four annual average weekday time periods and four annual average weekend time periods, although this is not sufficient resolution for the assessment of MM-HSR and it is suggested that whatever flow groups are used, they should cover a maximum of 250 daytime hours. 2. IFRIIT uses 15 flow groups to describe the year, with the first 12 flow groups each covering 250 hours, with the first flow group covering the busiest 250 hours of the year, the second flow group covering the next busiest 250 hours and so forth. The last three flow groups cover 1,000, 1,000 and 3,760 hours respectively and it is assumed that these will relate to the offpeak hours. 3. IFRIIT requires the user to input observed flow data for the relevant link for every hour in a single year (i.e. 8,760 hours) in descending order of magnitude. The observed data should be available from HATRIS. These flows are used to derive the relationships between standard AM, IP and PM periods and the 15 flow groups representing annual flow. If a full year’s data are not available, the tool will factor the inputs accordingly, assuming the distribution of flows input is representative of the whole year. If the distribution of flows is not representative of the whole year i.e. a whole month’s data are missing then this data should be in-filled. The user should report the percentage of the base year’s data available (out of 8,760 hours) and the methodology agreed with the TAME group used to infill data. If no data is available, default factors are available within IFRIIT. 4. During an initial assessment, a user must also account for traffic growth in future years. If using IFRIIT, the user must input traffic growth data from the scheme traffic model, if available, or if a scheme model is not available, locally adjusted growth factors from the National Transport Model should be used. An initial assessment not undertaken using IFRIIT should also use growth data from these sources. 5. An initial assessment should take into account the effect of geometry on the speed of traffic, in line with the guidance provided in the Design Manual for Roads and Bridges, Volume 13, Section 1, Part 5, Speeds on Links. The curves for the existing motorway should be calculated from these principles, whilst the curve for MM-HSR is available from the HA TAME group. IFRIIT allows the user to input bendiness and hilliness in order to calculate this impact. 6. During an initial assessment, the proportion of vehicle types must be utilised in the benefit calculation. It is suggested that the proportion should be taken from observed manual counts where possible or, if not available, use should be made of the default proportions outlined in the Design Manual for Roads and Bridges, Volume 14, Section 1, Part 5, The Traffic Input to QUADRO. IFRIIT allows either of these sources in Initial assessment mode. 7. An initial assessment should predict the impact of the scheme in each future year over the assessment period. IFRIIT interpolates traffic growth between AM/IP/PM periods in the modelled years to derive a flow for each period in each future year. Flat, i.e. zero, traffic growth is assumed after the final modelled year. From the predicted hourly flows, the flows within the 15 flow groups of each year are then calculated. The flows in each flow group are then capped at the capacity of the widened motorway. This should not occur if growths have been derived from a IAN 159/12 Page 14 of 31 Aug 2012 Interim Advice Note 159/12 Guidance Note for Traffic Consultants on the Economic Assessment of MM-HSR Schemes variable demand model. A similar methodology should be undertaken if utilising a different method to undertake an initial assessment. 8. For each year and each scenario, the speed flow curves should be used to calculate link transit times. 9. An assessment of merge and queuing delay should be included in the initial assessment, in line with the details in Appendix D. Within IFRIIT, the merge delay is calculated as per DMRB Volume 13 and the queuing delay calculated using standard queuing formulae as per DMRB Volume 14 and the higher of these two used to calculate the applicable delay. It is inherently assumed that these sources of delay will either be at the merge with a slip road or the downstream end of the link. 10. The monetised journey time impacts should be a combination of the impact on link transit times and the impact on the predicted queuing/merge delay multiplied by the value of time (VoT) calculated in line with WebTAG Unit 3.5.6, Values of Time and Operating Costs; IFRIIT does this internally for each scenario for each year. 11. The vehicle operating cost (VOC) impacts, in terms of both fuel and non-fuel impacts, should also be calculated in line with WebTAG Unit 3.5.6, and the indirect tax revenue (ITR) changes calculated from the fuel element. The average speeds used to assess the vehicle operating costs should take into account the impact of merge and queuing delay on the speeds predicted by the speed flow curves. This is done inherently within IFRIIT. 12. The annual economic impacts should be provided in discounted and undiscounted form and 10, 20 and 60 year summaries of the discounted benefits should be given. 13. The year that MM-HSR is first required after its installation date should be compared to the opening year of full widening, if this is also being assessed. The summaries should be aggregated from the earlier year of these two years, for each scenario. The discounted benefit streams should also be presented in a graphical form, with the first years in which MM-HSR would be effective indicated. IFRIIT is set up to provide these analyses directly. IAN 159/12 Page 15 of 31 Aug 2012 Interim Advice Note 159/12 Guidance Note for Traffic Consultants on the Economic Assessment of MM-HSR Schemes Appendix B: Consecutive Link Assessment Methodology 1. Each link under consideration must be appraised. 2. The 60 year total benefits for each link must be extracted for inclusion in the following pro forma. 3. The 60 year queuing benefits for each link must be extracted for inclusion in the pro forma. 4. The queuing benefits must be deducted from the total benefits. 5. The maximum individual link 60 year queuing from all the links must be selected for inclusion in the pro forma. 6. The pro forma can then be used to calculate the MM-HSR benefits over consecutive links. Consecutive Link Pro Forma Consecutive Link Benefit Table Total Link 1 Full 60 year benefit (a) Link 1 60 year queuing benefit (b) Link 1 Net benefit excluding queuing benefit Link 2 Full 60 year benefit (d) Link 2 60 year queuing benefit (e) (c) = (a) – (b) Link 2 Net benefit excluding queuing benefit (f) = (d) – (e) Link 3 ……….. Sum of net benefits excluding queuing benefits Maximum recorded queuing benefit Consecutive link benefit (g) = (c) + (f) + … (h) = maximum of (b) or (e) or … (i) = (g) + (h) Table B1: Consecutive Link Benefits IAN 159/12 Page 16 of 31 Aug 2012 Interim Advice Note 159/12 Guidance Note for Traffic Consultants on the Economic Assessment of MM-HSR Schemes Appendix C: Reporting Pro Forma PCF Stage 0 User Benefits Travel Time (1) Queues/Merges MM-HSR D4M Total Total (a) (1) (b) Vehicle Operating Costs (1) (c) Travel Time and Vehicle Operating Costs (2) During Construction (d) During Maintenance (e) TOTAL (f) = (a) + (b) + (c) + (d) + (e) Table C1: TEE table Govt. Funding: Operating Costs (2) Investment Costs MM-HSR D4M Total Total (g) (2) (h) Indirect Tax Revenues (1) NET IMPACT : PVC (i) (j) = (g) + (h) + (i) Table C2: Public Accounts Impact TEE Benefits (f) Accident Benefits (2) (k) Total PVB MM-HSR D4M Total Total (l) = (f) + (k) Govt. Funding: PVC (2) (j) Overall Impact: NPV (m) = (l) – (j) BCR (n) = (l)/(j) Table C3: Analysis of Monetised Costs and Benefits Notes: (1) Both D4M and MM-HSR data to be taken from the MM-HSR IFRIIT tool or alternate appraisal (2) Calculated external to the appraisal IAN 159/12 Page 17 of 31 Aug 2012 Interim Advice Note 159/12 Guidance Note for Traffic Consultants on the Economic Assessment of MM-HSR Schemes Appendix D: Basis of Initial Economic Assessment 1. The calculation of the benefits generated by the scheme should be based on the impacts on journey times, merge delays, queuing delays and vehicle operating costs as well as the impact on indirect tax revenue. Journey Time 2. Journey time information should be derived from speed flow curves developed from data from the M42 MM-HSR pilot. Figure D1 shows the speed flow relationships, which are included within IFRIIT and should be used in any alternate assessment method. MM-HSR APPRAISAL: PROPOSED SPEED FLOW CURVES 120 0, 113.8 110 D3M (based on COBA) D4M (based on COBA) D3M with 50mph HSR D3M with 60mph HSR 4000, 107.8 3000, 107.8 Speed (kph) 100 6213, 94.0 4500, 95.6 90 7608, 85.2 5706, 85.2 80 4500, 81.1 7608, 78.2 70 60 0 1000 2000 3000 4000 5000 6000 7000 8000 Carriageway flow (vph) Figure D1 Merge Delay 3. The calculation of merge delays should use the formula described in the Design Manual for Roads and Bridges, Volume 13, Section 1, Part 6, Junctions in COBA, which states: “Research into merge delays showed that the measurement of actual average delays from on-site observations was exceedingly difficult. Day to day variations in delay were apparent under apparently similar flow conditions. Delays varied considerably with time even within a single peak period. The research was unable to differentiate between delays to the main line and merging streams. Consequently COBA includes a relationship which applies delays (over and above speed/flow effects) to all vehicles passing through the merge area. This is a simple straight line function of the form: Delay = 227 (Capacity Ratio - 0.75) seconds per vehicle, where the capacity ratio is defined as the total upstream demand divided by the capacity of the downstream link.” 4. IAN 159/12 Figure D2 shows the development of merge delay relative to the capacity ratio. Page 18 of 31 Aug 2012 Interim Advice Note 159/12 Guidance Note for Traffic Consultants on the Economic Assessment of MM-HSR Schemes Queuing Delay 5. The formula used in the tool for queuing delay is based on standard queuing theory, assuming queuing commences once capacity has been exceeded. Delay duration is based on the time period being modelled, which in the case of IFRIIT is set to one hour. As the link arrival time is not known the rule of half is applied to give the average delay per queued vehicle. This again is a simple straight line function: Delay = T/2 x (V/C -1), Where T is modelled period, V is traffic volume and C is carriageway capacity. 6. Figure D2 also shows the development of queue delay relative to the capacity ratio. Merge and Queuing Delay 600 Merge Delay Queuing Delay 500 Delay (s) 400 300 200 100 0 0 0.2 0.4 0.6 0.8 1 1.2 1.4 Capacity Ratio - V/C Figure D2 7. For the purposes of an initial assessment merge and queuing delay should be combined to provide a single delay figure. The merge delay should be used up to a point where the delay predicted by the assessment of queuing delay exceeds the predicted merge delay. Figure D3 illustrates the methodology that should be used. Merge and Queuing and Applied Delay 600 Merge Delay Queuing Delay Applied Delay 500 Delay (s) 400 300 200 100 0 0 0.2 0.4 0.6 0.8 1 1.2 1.4 Capacity Ratio - V/C Figure D3 IAN 159/12 Page 19 of 31 Aug 2012 Interim Advice Note 159/12 Guidance Note for Traffic Consultants on the Economic Assessment of MM-HSR Schemes Appendix E Maintenance and Associated Traffic Management Requirements of MM-HSR Introduction 1. This appendix describes typical maintenance and associated traffic management activities that would be required on Managed Motorways, insofar as they impact on driver delays. The information can be used as the basis for including driver delays associated with repairs on Managed Motorways into an economic assessment. Location of Item Density Traffic Management Required for Access Over carriageway Every 850 metres Yes On gantry One per lane (including hard shoulder) on each gantry Yes On gantry, over hard shoulder On every 2nd gantry (every 1700 metres) Yes MIDAS loops Inductance loop cut as loop pair Loops in road surface; controller at roadside HADECS (Highways Agency Digital Enforcement Camera System) Digital camera used for enforcement of dynamic speed limits On gantry, over selected lane On inverse “Jshaped” pole, mounted in the verge One loop pair, per lane (including hard shoulder), every 400m nd One camera every 2 link (junction to junction stretch of motorway) Every 150 to 200 m (depends on road alignment and location of structures) In Emergency Refuge Area Every 850 metres (2 loops per ERA) No - maintenance vehicles park in ERA or lay-bye Fixed camera used to monitor the ERA On pole behind barrier, upstream of ERA Every 850 metres No - maintenance vehicles park in ERA or lay-bye Telephone for emergency use by motorists In ERA, behind barrier Every 850 metres Cabinets to house roadside electronics In verge, behind barrier Various Item Gantry Advanced Message Indicators (AMI) MS4 Variable Message Sign Hard Shoulder Monitoring (HSM) cameras Emergency Refuge Areas (ERA) detector loops ERA cameras Emergency Roadside Telephone Combined Equipment Cabinets Description Lightweight, access free (requires cherry picker to access equipment) Lane signal to display speed limit and lane closure / divert messages Variable message sign with graphics capability Fixed CCTV camera used to check that hard shoulder is clear prior to opening Inductance loop used monitor vehicle entry / exit from ERA Yes Yes Yes No - maintenance vehicles park in ERA or lay-bye No - maintenance vehicles park in ERA or lay-bye Table E1 – MM-HSR Infrastructure Requiring Maintenance and Traffic Management IAN 159/12 Page 20 of 31 Aug 2012 Interim Advice Note 159/12 Guidance Note for Traffic Consultants on the Economic Assessment of MM-HSR Schemes 2. Managed motorway technology equipment will usually be located in roadside cabinets in the verge, near an ERA wherever possible. Some equipment is mounted on columns in the verge or on overhead gantries. There are also detectors buried in the carriageway, including in the ERA pavement. Roadside cabinets in the verge will generally be behind a barrier. In most cases, the equipment would be near an ERA or maintenance lay-by where maintenance vehicles will park. As a result, no traffic management would be required. Equipment located on gantries over running lanes and detectors in the carriageway will require traffic management. Equipment mounted on columns in the verge, over the hard shoulder on gantries and in the ERA pavement will require traffic management. Required Maintenance and Traffic Management Activities 3. Table E2, overleaf, describes the required maintenance and associated traffic management activities for Managed Motorways equipment. Only equipment which would require traffic management in order to be maintained is included. Duration of Works 4. All the activities listed are of short duration, i.e. a few hours. It can be assumed that none of these activities would be undertaken during peak periods. Day time activity would be restricted to the interpeak period, preferably during portions of the year when HSR is not required, and night time activity to times when flows are lowest, e.g. 22:00 and 06:00. A simple assumption would be that the traffic management indicated in the table would be in place for the duration of these periods. 5. The only exception to these restricted access times would be Category 1 defects, which may require traffic management from the time at which the defect is identified until the time it has been made safe. At this time there is no evidence that Managed Motorway sections would be any more prone to Category 1 defects that any comparable section of non-dynamic motorway. Speed Limit within Roadworks 6. There is a system restriction that prevents a ‘red X’ being placed on the hard shoulder without setting speed limits on the rest of the gantry. However, it is possible to close the hard shoulder for maintenance without using the signals, i.e. using cones and signs. In such circumstances, a 50mph restriction is not required. 7. Where running lane 1 is closed it is usual, but not always required, to introduce a 50mph limit. Where two lanes are closed, however, a 50mph limit is always introduced. Table E2 assumes that a 50mph limit is always applied Typical Maintenance Schedule 8. Tables E3 and E4 provide sample schedules of cleaning, inspection and equipment maintenance and associated traffic management requirements for one carriageway of a typical 10km section of Managed Motorway. IAN 159/12 Page 21 of 31 Aug 2012 Interim Advice Note 159/12 Guidance Note for Traffic Consultants on the Economic Assessment of MM-HSR Schemes Item Timing of Work Required Maintenance Gantry Annual inspection Daytime Gantry Principle inspection every six years Daytime AMI (over hard shoulder) Required Traffic Management Hard shoulder plus lane 1 closure to allow access to three successive gantries Speed Limit Length of Length of within Road with Roadworks Roadworks Speed Limit 2 km 50mph 3.6km Hard shoulder plus lane 1 closure to allow access to one gantry 200m 50mph 1.8km Repairs with frequency based on a 17% failure rate Night-time Hard shoulder plus lane 1 closure to allow access to one gantry 200m 50mph 1.8km AMI (over lanes 1 & 2) Repairs with frequency based on a 17% failure rate Night-time Three lanes closed to allow access to three successive gantries 1.8 km 50mph 3.4km AMI (over lane 3) Repairs with frequency based on a 17% failure rate Night-time Two lanes closed to allow access to three successive gantries 1.8 km 50mph 3.4km MS4 Repairs, with frequency based on a 10% failure rate Night-time Hard shoulder plus lane 1 closure to allow access to gantry 200m 50mph 1.8km VMS & AMI Annual Cleaning Annual cleaning Night-time 4.2 km 50mph 5.8km MIDAS loops Repairs, with frequency based on Two lanes closed (L2&3) leaving traffic running on lane 1. If hard a 15% failure rate, spread across shoulder running is possible then also close lane 1 to give a larger loop sets (so every set will have Night-time work area. After having cut and installed the loops in lanes 2 and 3, 400m 2-3 loop failures per year) the TM arrangement would change so that traffic would run in lanes Requirement to replace loops 2&3 and close the HS or lane 1 and the HS as appropriate. when at least two loops fail 50mph 2km HADECS Annual inspection and cleaning Two lanes closed followed by switch to other two lanes to allow access to six successive gantries Night-time Two lanes closed to allow access to one gantry 400m 50mph 2km Hard shoulder closure (assuming ground accessible wash/wipe mechanism) 2.5km N/A N/A Hard shoulder closure to allow access to camera, including alignment 500m N/A N/A HSM cameras Cleaning twice per year Daytime (inter-peak) HSM cameras Repairs with frequency based on a 10% failure rate Night-time ERA loops Repairs with frequency based on a 15% failure rate Night-time Hard shoulder closure to allow access to ERA plus working space 400m N/A N/A ERA cameras Cleaning twice per year Daytime N/A N/A N/A ERA cameras Repairs with frequency based on a 10% failure rate Night-time Hard shoulder closure to allow access to ERA plus working space 400m N/A N/A None, done as part of HSM camera cleaning closures Table E2 –Required Maintenance and Traffic Management IAN 159/12 Page 22 of 31 Aug 2012 Interim Advice Note 159/12 Guidance Note for Traffic Consultants on the Economic Assessment of MM-HSR Schemes Qty per Maintenance 10km Item Section Cleaning/ Inspections per Year Day/ Frequency Traffic Management Requirement Night Gantry 13 1 Day 4 per year AMI & VMS 13 1 Night 2 per year 2 1 Night 2 per year 67 2 Day 8 per year 11 2 Day Included in HSM cameras HADECS cameras HSM cameras ERA cameras (Gantries) HS and lane 1 closed with 50mph limit for 3.6km, four times per year HS and lane 1 closed with 50mph limit for 5.8km, twice per year. Lanes 2 and 3 closed with 50mph limit for 5.8km, twice per year One lane closed with 50mph limit for 2km, twice per year HS closed with no reduced speed limit for 2.5km, eight times per year Table E3 – Sample Cleaning/Inspection Schedule for 10km Section of MM-HSR Maintenance Item AMI (Over lane 1 (HS)) AMI (Over lanes 2, 3, 4) VMS MS4 MIDAS Loop pairs HADECS cameras HSM cameras ERA detector loops ERA cameras Qty per 10km Section 13 39 7 25 2 67 11 11 Repairs per Year 2 2 <1 26 01 7 3-4 1 Traffic Management Frequency 2 per year 2 per year 1 per 2 years 26 per year 1 per year 7 per year 4 per year 1 per year Day/ Night Night Night Night Night Night Night Night Night Table E4 – Sample Repair Schedule for 10km Section of MM-HSR Typical Equipment Renewal Schedule 9. In addition to regular maintenance activities, it will also be necessary for equipment to be renewed at certain intervals. Table E5, overleaf, provides a schedule of equipment renewal periods and associated traffic management requirements for one carriageway of a typical 10km section of managed motorway. Major Maintenance 10. Major maintenance activities requiring prolonged periods of temporary traffic management will need to be assessed using either QUADRO or the scheme traffic model. The traffic flows should be based upon those forecast by the model for the year in which the maintenance is to take place (or, if necessary, interpolated between available forecast years). 11. Use of the hard shoulder as a running lane during periods of high demand may result in predicted traffic volumes higher than in the Do-Minimum. If the analysis indicates that this higher demand will lead to excessive user delays during periods of maintenance when the hard shoulder is unavailable then discussions should take place with the scheme team about further options for the projected maintenance, such as minimum capacity during peak periods or restricting lane closures to offpeak periods. 1 Repairs and cleaning carried out at the same time. IAN 159/12 Page 23 of 31 Aug 2012 Interim Advice Note 159/12 Guidance Note for Traffic Consultants on the Economic Assessment of MM-HSR Schemes Renewal Item Qty per 10km Section Gantry 13 AMI 52 VMS MS4 7 HADECS cameras 2 HSM cameras 67 ERA cameras 11 Renewal Period Traffic Management Requirement (years) Overnight closures 30 (see notes below) Two lanes closed followed by switch 12.5 to other two lanes to allow access to three successive gantries Hard shoulder plus lane 1 15 closure to allow access Two lanes closed to allow 7.5 access to one gantry Hard shoulder closure to 10 allow access to camera Hard shoulder closure to 10 allow access to camera Length of Roadworks Speed Limit Length of Speed Limit Day/ Traffic Management Night Duration Link N/A N/A Night 2 Nights 1.8 km 50mph 3.4km Night 4 Nights 200m 50mph 1.8km Night 7 Nights 400m 50mph 2km Night 2 Nights 500m N/A N/A Night N/A Renewed with N/A HSM cameras N/A Night N/A Table E5 Notes: 1) MIDAS & ERA Loops do not have specific renewal periods as they are constantly being renewing via general maintenance activities. 2) Gantries are the most complex items to renew and would require a complete overnight closure of both carriageways to remove the old gantry and another closure to install the new gantry. The sequence of events would involve: (i) Removal of the electronics from the existing structure - overnight with two lanes closed at any one time and a switch in the middle of the night. This would have to be done twice, once for each carriageway, for a double span gantry. (ii) Removal of the span - overnight complete closure. (iii) Removal of the existing vertical supports and installation of new supports - hard shoulder closure for 24 hours on each carriageway. (iv) Installation of the new span - overnight complete closure; (v) Installation of the new electronics - overnight with 2 lanes closed at any one time and a switch in the middle of the night. This would have to be done twice, once for each carriageway, for a double span gantry. Assuming all gantries are renewed on a link, then the overnight link closures would be used to remove and install all gantries on the link. Additional traffic management before and after the closures may, however, be required for removal/installation of electronics. IAN 159/12 Page 24 of 31 Aug 2012 Interim Advice Note 159/12 Guidance Note for Traffic Consultants on the Economic Assessment of MM-HSR Schemes Appendix F The Inclusion of Operating Costs in the Economic Assessment of MM-HSR 1. This appendix provides advice on incorporating operating cost estimates from the Managed Motorways Operational Cost Model into the economic assessments of individual MM schemes. Further explanation of the cost model is provided in the note entitled "Managed Motorways - Guide to the Operational Cost Model". Any queries concerning the cost model should be directed to the Managed Motorways Operations Programme Office ([email protected]) or the IBI Group ([email protected]). 2. The Managed Motorways Operational Cost Model contains operating cost estimates for individual schemes. The bottom right hand corner of each individual scheme sheet contains the 60 year expenditure profiles of estimated operating costs that need to be incorporated into the scheme economics. 3. The cost estimates represent the additional maintenance, operating and renewal costs compared to non-Managed Motorway operation. No costs are included that would also be incurred in the Do Minimum. 4. The model presents annual costs that incorporate assumptions regarding cost reductions over time for specific cost items (e.g. efficiencies in maintenance, reduced need for Managed Motorway infrastructure and therefore renewals). The Operations Programme Office is of the opinion that such assumptions should be included when estimating the cost profile over 60 years and therefore these should be applied in the version of the costs used in the scheme economic assessment. 5. The costs presented in the model allow for predicted differences between general inflation and inflation in scheme cost items as required by WebTAG Unit 3.5.9. No further adjustment in this regard is necessary when undertaking an economic assessment. 6. The Managed Motorways Operational Cost Model does not include a specific allowance for optimism bias as the estimates already include contingency, and therefore additional optimism bias should not be added. 7. The costs exclude all VAT, whether recoverable or not, therefore there is no need for an adjustment as required by WebTAG. All costs are in 2008 factor costs and the RPI for 2008 is 214.8. 8. The total expenditure and the expenditure profile across the 60 year assessment period should be entered into TUBA from the table in the bottom right hand corner of the individual scheme sheets; the costs including cost reductions over time. All the costs should be entered into TUBA as ‘Operating’ costs regardless of whether they come under the heading of Maintenance, Operations or Renewals. The costs should be entered as costs in the Do Something only. 9. As noted in WebTAG Unit 3.5.9, The Estimation and Treatment of Scheme Costs, the capital costs of non-traffic related maintenance (e.g. drainage, fencing, grass cutting etc.) should appear in the Public Accounts table as operating costs, as should the extra staffing in traffic control centres, whilst the capital costs of traffic related maintenance (e.g. resurfacing, gantry maintenance etc.) should appear as investment costs. IAN 159/12 Page 25 of 31 Aug 2012 Interim Advice Note 159/12 Guidance Note for Traffic Consultants on the Economic Assessment of MM-HSR Schemes 10. In order to represent these costs in the correct category, the capital costs of nontraffic related maintenance should be entered into TUBA as a ‘Maintenance’ cost, the additional operating costs should be included as ‘Operating’ costs and the capital costs of traffic-related maintenance should be entered as ‘Construction’ costs. This categorisation will ensure that the costs are accounted for in the correct categories whilst also highlighting that the additional operating costs of Managed Motorways have been accounted for. 11. The Managed Motorways Operational Cost Model includes an estimate of Present Value Costs for each of the tranche 1 Managed Motorways schemes expressed in 2002 prices. 12. Should costs be required for a new Managed Motorways scheme not presently included in the Managed Motorways Operational Cost Model, the Managed Motorways Operations Programme Office should be contacted. IAN 159/12 Page 26 of 31 Aug 2012 Interim Advice Note 159/12 Guidance Note for Traffic Consultants on the Economic Assessment of MM-HSR Schemes Appendix G: The Methodology for a Full Assessment 1. A full assessment should be undertaken for any scheme that has advanced beyond PCF Stage 0. In line with current Department for Transport guidance, a full assessment must be carried out using a fully validated WebTAG compliant traffic model with variable demand capability. Allowance must be made for the dynamic characteristics of the scheme, either using the MM-HSR IFRIIT tool in full assessment mode, or equivalent methodology. The requirements for modelling a dynamic intervention on the road network are complex, and some general assumptions are required to be made. The standard DfT TUBA program, for determining the economic impact of a scheme using the outputs of a traffic model, has been revised to allow annualisation factors to differ between input years and any alternate economic assessment methodology should follow this requirement. 2. Data from the initial assessment, if available, should be used to inform the preliminary choice of forecast years to be modelled. The initial forecast years should be the opening year of MM-HSR and the intervening years between opening year and design year and between design year and final forecast year when there would be a significant change in the operation of MM-HSR, for example a change in the time periods over which MM-HSR is expected to operate. Forecast years should also cover other significant network changes, such as major links reaching capacity, in line with WebTAG guidance. The traffic model should be constructed to use this information and the MM-HSR speed flow curve on the appropriate links to provide the output for the economic assessment. 3. The initial model should be built on an annual average weekday basis, with at least the standard AM, interpeak and PM time periods. It is assumed that these would be modelled as average hours within their corresponding periods. If the modelling is undertaken on a different basis, advice should be sought from the HA TAME group. Allowance is made within IFRIIT for the modelling of offpeak and weekend periods, although it is acknowledged that most models are not created to cover these periods and therefore data requirements within the tool for these periods is optional. It should be noted, however, that where MM-HSR is being considered against options that would be in place during the weekend, such as full widening, the weekend and potentially off peak periods must be considered in some manner and advice should be sought from the TAME group. 4. The process of creating an MM-HSR model is illustrated in the flowchart at the end of this Appendix. 5. The following assumptions are key to the calculation of MM-HSR benefits: There are no impacts on traffic on the network unless MM-HSR is operating; The hard shoulder has the same capacity as a normal lane; and The annualisation factors representing the proportion of the year that MM-HSR is active will change in a linear fashion between modelled years. 6. Where through junction running (TJR) is to be provided between adjoining links, it can be assumed that the hard shoulder is available through the junctions during hours when MM-HSR is not in operation on the adjoining links, in line with Interim Advice Note 112. It is, however, assumed that the actual impact on traffic of this assumption would be negligible during these periods and need not be explicitly modelled. 7. Since MM-HSR is dynamic and is only active during portions of each time period in which flows exceed the threshold, models based on the annual average time period IAN 159/12 Page 27 of 31 Aug 2012 Interim Advice Note 159/12 Guidance Note for Traffic Consultants on the Economic Assessment of MM-HSR Schemes conditions (flows and speeds) do not correctly identify benefits for annualisation, or provide accurate flows for air quality (AQ) and noise assessments. Models must be converted from an annual average basis to a basis that provides two separate estimates of flows and speeds; one representing the segments of a time period in the year in which MM-HSR is active, and the other to reflect traffic conditions when MMHSR is not active. 8. The full assessment mode of IFRIIT offers a simple tool to do this, although it is possible to do this conversion in other ways. Any such method, including IFRIIT, will require annual flow profile information for the model base year for each scheme link. IFRIIT allows this input for each direction, and has allowance for ten links. Should a scheme be developed with more links and IFRIIT used, advice can be sought from the HA TAME group. If the full base year’s data are not available, it is the responsibility of the user to in-fill the gaps within the data. The user should report the percentage of the base year’s data available (out of 8,760 hours) and the methodology agreed with the TAME group used to infill data. 9. IFRIIT does not determine the presence of bank holidays and provides annualisation factors on the assumption that the AM, IP and PM periods cover all 261 weekdays, rather than the 253 working weekdays. Under the default assumptions of 3 hour AM and PM periods and a 6 hour IP period, this gives maximum annualisation factors of 783 for the AM and PM periods and 1,566 for the IP. The offpeak period is assumed to cover the 12 night-time hours of all 365 days, leading to a maximum annualisation factor of 4,380, whilst the weekend period is assumed to cover the 12 daytime hours of Saturday and the 12 daytime hours of Sunday, leading to a maximum factor of 1,248. These total to cover the full 8,760 hours of a year. 10. Traffic flow data from the annual average-based traffic model, for each time period, for the base year and all forecast years should be used to calculate future year annual flow profiles. At this point a prediction can be made about the hours within each period during which HSR is likely to be required and the relationship between the average flow during these hours and the annual average of the period can be calculated to provide an uplift factor. Equally, the relationship between the average flow in hours when HSR is not required and the annual average period flow will provide a depression factor. IFRIIT calculates these factors for each time period and each year. The application of these factors to the model forms the basis of the split to accommodate the dynamic nature of HSR. 11. If, for some reason, an economic assessment needs to be undertaken and the results of a traffic model are not available, the average flow for each period for the base year could be manually calculated from the annual flow profiles entered and appropriate growth factors applied to these to provide future year flows. This method is also appropriate where the weekend or offpeak has not been modelled and some indication is sought as to whether it may be appropriate to do so. In this case, the offpeak and weekend flows can be calculated in the base year from the flow profiles and then the growth observed in the interpeak period applied to produce future year flows. 12. IFRIIT also identifies the link that should be regarded as the constraining or control link(s) for each period and forecast year. The control link can be defined as the link that determines whether an operational section of MM-HSR links is active or not, and is the link within the section with the highest annualisation factor. The control link tends, in most instances, to be the link with the highest annual flow. To create the models that represent the HSR-on portions of each year, the uplift factors should be applied to the Do-Minimum and Do-Something post-VDM 13. IAN 159/12 Page 28 of 31 Aug 2012 Interim Advice Note 159/12 Guidance Note for Traffic Consultants on the Economic Assessment of MM-HSR Schemes (variable demand modelling) matrices. These uplifted matrices should then be reassigned to the appropriate traffic models and the results passed through into the economic assessment. 14. As environmental assessments require data covering the whole year, the HSR-off portions of the year also need to be modelled. In this case, where the Do-Something does not include any interventions that are present during the entire year, this is equivalent to the Do-Minimum as the MM-HSR will not be in operation, and therefore the depression factors should only be applied to the Do-Minimum post-VDM matrices and the results used for both the with and without scheme cases. 15. In some cases, the Do-Something may include additional non-dynamic interventions, such as junction improvements or adjacent carriageway widening. In these cases, the above assertion that the Do-Something with HSR off is equivalent to the DoMinimum is false and additional modelling is required. A network including the nondynamic Do-Something improvements would be required and the depression factors would need to be applied to post-variable demand matrices from this network. This post-VDM depressed matrix would then need reassignment on this network and the results used in both the economic and environmental assessments. 16. For schemes were it is identified that the annualisation factors for a given period cover the majority of the year; e.g. 90%+, and therefore the calculated uplift factors are minimal, the above methodology need not be applied as the impact will be negligible. Advice on this should be sought from the HA TAME group. Care must be taken where areas of heavy congestion appear within the modelled area, e.g. an urban area in a peak period, as the application of the uplift factor may result in a significant increase in congestion and therefore model noise within the area. Care should be taken to increase model convergence as much as is practicable in order to minimise such effects. 17. Data should be passed to the teams undertaking the environmental assessments (primarily the air quality and noise assessments) alongside an indication of the daily average time that each situation represents. For example, a full assessment has indicated that for a proposed scheme, HSR would be turned on for 1,050 hours of the six hour IP period over the course of the opening year. The average IP flow whilst HSR is on is 5,000 vehicles and 3,500 when it is off. These flows should inform the environmental assessment with the note that the HSR-on flow represents 4 hours of an average weekday in the opening year (=6 x 1,050/(261 x 6)), where the 1,050 refers to the number of hours that HSR is on, 261 is the number of weekdays in a year and 6 is the number of hours in the modelled period), whilst the HSRoff flow represents the remaining 2 hours of the IP in the average weekday. This finer resolution can then be used in the AQ emission and noise assessments. 18. On occasion, a scheme may consist of two separate sections, each with a controlling link. This would lead to complex operational patterns and guidance should be sought from the Highways Agency TAME group early in the modelling process. 19. Another possibility is that the network surrounding a scheme includes a section on which MM-HSR is already present and this section will also have a controlling link. Since this link would be present in both the Do-Minimum and Do-Something, its impact is neutral on the scheme assessment and it is only the new controlling link that is pertinent. It can reasonably be assumed that the neighbouring scheme will be active when the assessed scheme is active and inactive when the assessed scheme is inactive. IAN 159/12 Page 29 of 31 Aug 2012 Interim Advice Note 159/12 Guidance Note for Traffic Consultants on the Economic Assessment of MM-HSR Schemes IAN 159/12 Page 30 of 31 Aug 2012 Interim Advice Note 159/12 Guidance Note for Traffic Consultants on the Economic Assessment of MM-HSR Schemes Appendix H: IAN 159/12- Amendments required to this IAN when used in projects carried out under English DBFO schemes. When used on the M25 DBFO Scheme, this IAN is to be amended as follows: Para No. General Appendix F Paragraph 1 Description M25 DBFO Paragraph 18 (Interpretation) of Standards List applies After “([email protected] or the IBI Group ([email protected])” and insert “ and copied to the Department’s Nominee” When used on all other English DBFO Schemes, this IAN is to be amended as follows: Para No. 1.2 Appendix F Paragraph 1 IAN 159/12 Description Delete the heading and paragraph and insert "Not used" After “([email protected] or the IBI Group ([email protected])” and insert “ and copied to the Department’s Nominee” Page 31 of 31 Aug 2012