1
11
Kyubit AnalysisPortal, Dashboards user manual
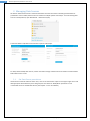
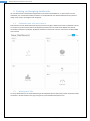
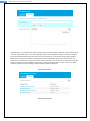
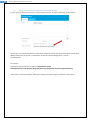
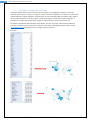
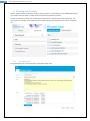
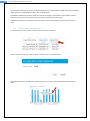
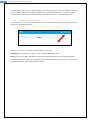
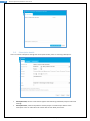
All analysis created within AnalysisPortal for which current user has at least ‘Read’ permission are displayed in
selection form. Displayed list could be filtered by ‘Data Source’ for environments with many analyses. Same
principles works for Query selection.
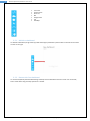
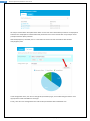
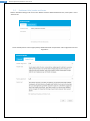
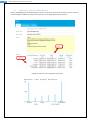
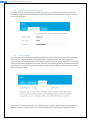
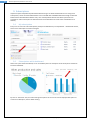
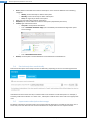
After Analysis/Query is selected, click on ‘Test’ button in tile form to test visualization with selected
analysis/query data.
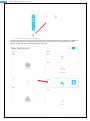
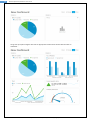
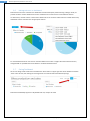
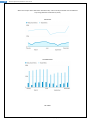
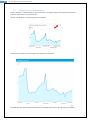
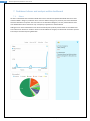
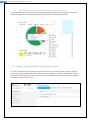
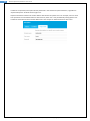
In tile configuration form, user still can change tile (visualization) type, if concludes that given data is more
appropriate to show with different chart type.
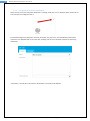
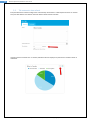
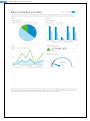
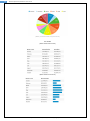
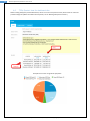
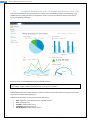
Finally, click ‘OK’ in tile configuration form and tile will present data within dashboard area.
Dashboards with AnalysisPortal user manual, www.kyubit.com - [email protected]