1
25
Kyubit AnalysisPortal, Dashboards user manual
4.6.
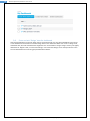
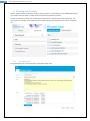
‘TSQL Queries’ data for dashboard tiles
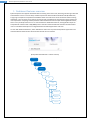
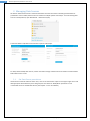
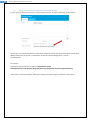
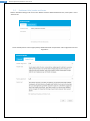
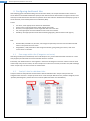
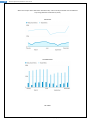
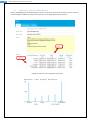
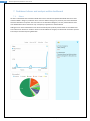
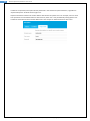
While creating TSQL query for dashboard tiles, values on column axis presents series, while values on rows axis
presents categories. (More information about queries, see ‘6. Working with queries section’)
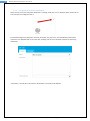
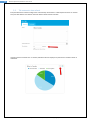
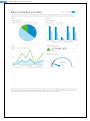
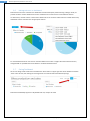
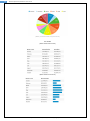
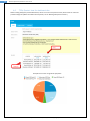
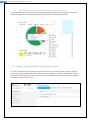
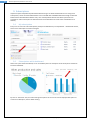
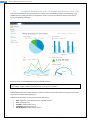
Example of ‘Pie chart’ using above query data…
Dashboards with AnalysisPortal user manual, www.kyubit.com - [email protected]