1
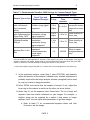
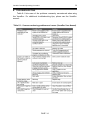
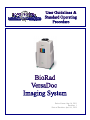
Date of Issue: May 16, 2011
Revision: 1
Date of Revision: April 16, 2012
VersaDoc Standard Operating Procedure
ii
TABLE OF CONTENTS
DISCLAIMER ................................................................................iii
ACKNOWLEDGEMENTS .................................................................... iv
1.
INTRODUCTION........................................................................1
1.1
Purpose of the Standard Operating Procedure .............................1
1.2
Theoretical Background ........................................................1
1.2.1
Electrophoresis.............................................................1
1.2.2
Blotting......................................................................2
2.
INSTRUMENT SPECIFICATIONS.......................................................4
3.
POTENTIAL HAZARDS.................................................................5
4.
PERSONAL PROTECTIVE EQUIPMENT ...............................................5
5.
SPILL AND ACCIDENT PROCEDURES ................................................6
6.
WASTE DISPOSAL PROCEDURES .....................................................6
7.
PROTOCOL .............................................................................7
7.1
Sample Imaging..................................................................7
7.1.1
Start-Up .....................................................................7
7.1.2
Set Software Acquisition Parameters ...................................7
7.2
Cleanup......................................................................... 11
7.3
Image Analysis ................................................................. 11
8.
TROUBLESHOOTING ................................................................ 14
APPENDIX: VERSADOC USER LOG ................................................................................. 17
VersaDoc Standard Operating Procedure
iii
DISCLAIMER
The materials contained in this document have been compiled from sources
believed to be reliable and to represent the best opinions on the subject. This
document is intended to serve only as a starting point for good practices and
does not purport to specify minimal legal standards. No warranty, guarantee,
or representation is made by Laurier as to the accuracy or sufficiency of
information contained herein, and Laurier assumes no responsibility in
connection therewith.
VersaDoc Standard Operating Procedure
iv
ACKNOWLEDGEMENTS
The following individuals of Laurier contributed to the writing, editing, and
production of this manual: Gena Braun (Instrumentation Technician), Jiangxiao
Sun (Instrumentation Technician).
This manual was prepared for Laurier. Any corrections, additions or comments
should be brought to the attention of the Instrumentation Technician at
519-884-0710 ext. 2361.
Issued: May 2011
Revised: April 2012
VersaDoc Standard Operating Procedure
1
1. INTRODUCTION
1.1 Purpose of the Standard Operating Procedure
This standard operating procedure (SOP) is NOT a substitute for training
and/or reading the appropriate manuals before use. All principle
investigators and supervisors should document that training has been
received by students and staff who will be using the VersaDoc Imaging
System.
This SOP is intended to promote consistent and safe use of the VersaDoc
Imaging System. This SOP covers the potential hazards, personal protection
requirements, spill and accident procedures, waste disposal considerations,
and instrument operation for the VersaDoc Imaging System [henceforth
referred to as the VersaDoc].
1.2 Theoretical Background
The VersaDoc can be used to image DNA, RNA, or proteins on
electrophoresis gels, blots, or plates. Electrophoresis can be conducted in a
variety of ways to obtain different information, including: agrose gel
electrophoresis, native polyacrylamide gel electrophoresis (PAGE), sodium
dodecyl sulfate-PAGE (SDS-PAGE), isoelectric focusing, difference in gel
electrophoresis (DIGE), and 2-dimensional electrophoresis. Following separation
by electrophoresis, DNA, RNA, or proteins can be stained and detected or
further transferred onto a blot to allow for more specific detection. Blotting
techniques include Southern, Northern, and Western blotting, and a wide
variety of visual and fluorescent detection methods.
1.2.1 Electrophoresis
Electrophoresis of nucleic acids is typically carried out on agrose gels, and
separation is based entirely on molecular size. Polyacrylamide gels are used for
nucleic acid separation for short DNA or RNA strands, and provide high
resolution for applications such as DNA sequencing.
Protein electrophoresis encompasses a much wider variety of techniques.
Proteins can have a variable charge, depending on the chemical composition
and the environmental conditions. Native PAGE separates protein fragments or
peptides based on the mass-to-charge ratio of each fragment, and does not
alter the secondary structure of the protein, allowing retention of biological
2
VersaDoc Standard Operating Procedure
activity. Alternatively, PAGE can be combined with sodium dodecyl sulfate
(SDS) which denatures and neutralizes the protein, allowing separation based
exclusively on molecular size. Isoelectric focusing combines a pH gradient with
applied voltage to separate proteins based on their isoelectic point. Two
dimensional electrophoresis combines IEF and SDS-PAGE to separate proteins
based on both isoelectric point (first) and molecular weight (second).
Following electrophoresis, the gel can be stained and visualized, or
blotted. Gel straining techniques indiscriminately stain all of the nucleic acids
or proteins in a gel. DNA and RNA gels are commonly stained using ethidium
bromide and detected using fluorescence. Protein gels are stained using
coomassie blue or silver for UV detection, or Sypro gel stain and CyDyes for
fluorescence detection. Stained electrophoresis gels only provide information
on the size or size-to-charge ratio, or the size and isoelectric point in 2-D
separations.
1.2.2 Blotting
Southern blotting refers to DNA analysis, Northern blotting to RNA, and
Western blotting to proteins (this nomenclature is based on the name of the
researcher that developed the DNA blotting technique; Edward M. Southern).
Blotting a gel after electrophoresis transfers the separated nucleic acids
or proteins to a membrane composed of either nitrocellulose or polyvinylidine
difluoride membranes (PVDF). The membrane is then immersed in a solution
that contains a nucleic acid probe or an antibody. The probe or antibody is
labeled with a fluorescent dye or linked to an enzyme, and will adhere to a
specific DNA or RNA sequence or a specific protein (antigen) on the membrane.
If using a fluorescent dye, the location of the DNA, RNA, or protein can be
visualized by fluorescence excitation and image collection. Multiple dyes and
antibodies can be used to detect more than one protein at once (fluorescence
multiplexing). If using an enzyme, the linked probe or antibody can be
detected as a result of chemiluminescence (CL) or chemifluorescence (CF). The
enzymes usually used are horseradish perioxidase (HRP) or alkaline phosphatase
(AP). For chemiluminescent detection, HRP or AP cause oxidation or
dephosphorylation of a substrate on the membrane, this then produces light at
the location of the nucleic acids or protein of interest. If hydrogen peroxide
and phenols are present, this reaction is enhanced and extended up to 1000
fold, and called enhanced chemiluminescence (ECL). For chemifluorescent (CF)
detection, HRP or AP cause oxidation or dephosphorylation of a substrate,
PAGE 2
3
VersaDoc Standard Operating Procedure
converting it to a fluorescent molecule. CF provides a number of benefits
including higher signal amplification than direct fluorescence labeling, and
longer signal lifetime that CL because the substrate only emits light upon
fluorescence excitation. A CF substrate can therefore be imaged several times.
See Figure 1-1 for a flowchart of basic blotting and detection methods.
See: http://www.molecularstation.com/protein/troubleshooting-westernblots/ for useful troubleshooting tips for Western Blots.
Electrophoresis
Proteins
DNA/RNA
Ethidium
Bromide
Agrose Gels
Native PAGE
SDS-PAGE
IEF
Strand
length
Mass to
charge ratio
Molecular
size
Isoelectric
point
Stain and
visualize
Stain and
visualize
Blot and Identify
Reporter Enzymes
HRP
Enhanced
chemiluminescence
detection
UV / Blue
light dyes
Fluorescent
Dyes
Silver Stain
Coomassie Blue
Sypro Ruby
CyDye (DiGE)
Fluorescent Dyes
AP
Colorimetric
detection
Figure 1-1: Separation of DNA, RNA, or protein samples using electrophoresis is followed by
blotting and identification of specific fragments using reporter enzymes or fluorescent dyes.
PAGE 3
4
VersaDoc Standard Operating Procedure
2. INSTRUMENT SPECIFICATIONS
The VersaDoc is a quantitative imaging system for digital image acquisition
from single and multi-colour fluorescent, chemifluorescent, and colourimetric
blots, gels, or plates, up to 25 x 25 cm in size. The system includes a light tight
enclosure and uses one of two cooled CCD cameras designed for high sensitivity
and high resolution. The 4000 camera has 2,184 x 1,472 pixels (3.2 megapixels)
and a pixel size of 6 mm2, which provides very high resolution. The 5000
camera has 512 x 512 pixels (less than 0.5 megapixels) with a pixel size of 24
mm2, resulting in lower resolution but higher sensitivity for weak signal
applications. The 4000 camera is always installed in the Versa Doc; contact the
Instrumentation Technician if you need to use the 5000 camera.
Two standard lenses are available for the VersaDoc. One is 28-80 mm
zoom lens, and one is 50 mm f/1.4 fixed lens. The zoom lens is suitable for
most fluorescence and colorimetric applications, and both large and small
samples. The fixed lens has high light collection efficiency and is recommended
for chemilluminescence applications, but can also be used for other sample
types. The fixed lens is always installed in the Versa Doc; contact the
Instrumentation Technician if you need to use the zoom lens.
The UV transilluminator drawer should remain in the instrument at all
times and is used for fluorescent applications. Colourimetric samples require
use of the White Light Conversion Screen, and chemiluminescent samples
should be placed on the upper chemiluminescent tray. The sample trays are
resistant to most research chemicals, but should be washed with a small
volume of water and wiped dry with a kimwipe immediately following
imaging.
The VersaDoc is equipped with 4 emission filters, as follows:
-
Filter #1 (520 long-pass): optimized for single colour detection of
ethidium bromide, DNAStar, SYBR Green, SYBR Gold, Radiant Red, SYPRO
Orange, SYPRO Red, SYPRO Ruby, Texas Red, Cy2, Cy3, and most
flyorescein and rhodamine derivatives
-
Filter #2 (530 band-pass 60): independent detection of green (i.e.
FITC) fluorescence in multiple coloured samples.
PAGE 4
5
VersaDoc Standard Operating Procedure
-
Filter #3 (610 long-pass): independent detection of red (i.e. Texas
Red) fluorescence in multiple coloured samples.
-
Filter #4: clear filter for white light applications
If you are acquiring 1D gel images, use the instrument control software,
Quantity One, which includes preset imaging parameters for the following
sample types and dyes: Nucleic Acid Gels, Protein Gels, Blotting,
Densitometry, Fluorophores, Multiplex and Custom (you can define
parameters for your own applications). To do image analysis and quantitation
of your 1D gel, you should the ImageLab software, not Quantity One. ImageLab
is available on the VersaDoc computer, and additional copies can be obtained
from the Instrumentation Technician.
If you are running 2D gel analysis, use the software PD Quest, which is capable
of both image acquisition and image analysis of 2D gels. The software manual
and a tutorial of PD Quest cane be found in a folder on the desktop of the
computer for the 4000 system. (Note: The computer for the 5000 camera has
only has Quantity One installed).
3. POTENTIAL HAZARDS
The VersaDoc uses a powerful source of UV radiation and may cause
damage to unprotected eyes and skin. The door safety interlock and the
plastic UV shield protect the user from accidental exposure; however it is
advisable to use additional protection including UV protective eyewear, lab
coat, and gloves.
4. PERSONAL PROTECTIVE EQUIPMENT
Standard laboratory protective equipment, including latex
or nitrile gloves and a lab coat, are highly recommended.
Additional UV protective eyewear is strongly recommended.
Closed-toe and heel footwear constructed of resistant material
is also required for all laboratory activities. See the WLU
Laboratory Health and Safety Manual1 for additional information
on personal protective equipment.
1
www.wlu.ca/documents/23120/Laboratory_Health_%26_Safety_Manual.pdf
PAGE 5
6
VersaDoc Standard Operating Procedure
5. SPILL AND ACCIDENT PROCEDURES
All accidents, incidents and near misses involving instruments must be
reported as promptly as possible to the Environmental/Occupational Health and
Safety (EOHS) Office via the WLU Employee Accident/Incident/Occupational
Disease Report form.2 All incidents that result in critical injuries must be
reported immediately to the EOHS Office by telephone (ext 2874).
Additional details regarding incident reporting can be found in the WLU
Accident Incident Procedure.3
The WLU Laboratory Health and Safety Manual provides detailed
instructions for dealing with major and minor spills. Do not attempt to clean up
a spill if you have not been properly trained, or if you are unsure of the proper
procedures. Before using ANY hazardous materials, make sure you
understand the proper clean-up procedure. The Environmental/Occupational
Health and Safety Office is also available to provide guidance at ext. 2874. See
the WLU Laboratory Health and Safety Manual1 for further details.
All users must clean up any spills that occur in or around the VersaDoc
working area, including the plates inside VersaDoc hood, the lab bench, and
the floor. Although the plates (White light conversion plate, UV
transilluminator tray , Chemilluminescent tray) are resistant to most
chemicals, they can be damaged if exposed to chemicals for a long time or by
inappropriate cleaning.
NOTE: If you are running DNA gels using Ethidium Bromide, please do
NOT touch any other parts of the instrument with contaminated gloves (i.e.
computer, bench, outside of instrument etc). Please make sure you clean
up all possible EtBr contamination thoroughly.
6. WASTE DISPOSAL PROCEDURES
All WHIMIS, Department, and Health and Safety guidelines must be
followed for disposal of all chemicals used for analysis. All sample and
chemical disposal must be done in the user’s lab (NOT SR416) and disposal
must conform to the guidelines set out by the EOHS Office. See the WLU
Laboratory Health and Safety Manual1 and the Biosafety Manual4 for more
details.
2
https://www.wlu.ca/forms/706/AccidentIncidentInvestigationReportForm.pdf
http://www.wlu.ca/documents/33337/Accident_Investigation_%26__Reporting_Procedure.pdf
4
www.wlu.ca/documents/23632/Biosafety_Manual_March_15_2007_Final.pdf
3
PAGE 6
7
VersaDoc Standard Operating Procedure
7. PROTOCOL
The instructions provided in this protocol are only intended to serve as a
reminder; all users must be trained before using the VersaDoc for the first
time.
The 4000 camera is always left in the instrument as it is used the most often.
It is highly recommended that you try imaging with this camera first, and only
switch to the 5000 camera if absolutely necessary. Contact the
Instrumentation Technician if this is the case.
7.1 Sample Imaging
7.1.1 Start-Up
1. Turn on the camera 4000 power supply.
2. Make sure the VersaDoc enclosure door is closed and then turn on the
VersaDoc using the power switch on the right side at the back of the
enclosure and allow the initialization to complete (wait until only the
green power light is illuminated).
3. Unless you know that you require the 5000 camera from running previous
samples of the same type (and the Instrumentation Technician has
already changed the camera for you), turn on the computer labeled
“CAMERA 4000” and enter password (VD4000).
4. After starting up the system, it is best to wait 10 or 15 minutes to allow
the camera to cool before imaging, resulting in better sensitivity. Final
sample preparation and software acquisition parameters can be set
during this time. Remember to fill in the log book if you are leaving for
sample preparation, indicating to others that the instrument is in use.
7.1.2 Set Software Acquisition Parameters
1. Start the Quantity One software from the desktop.
2. Select File VersaDoc.
3. Under Step I, click on “Select” and choose the desired application.
a. If you are analyzing a colorimetric sample, you will be prompted
to insert the White Light Conversion Screen on the UV tray. The
Conversion Screen is stored in the cupboard below the imager,
and should be placed carefully on the UV tray with the rubber
gasket side down.
PAGE 7
8
VersaDoc Standard Operating Procedure
b. If you are imaging a chemiluminescent sample, select “chemihigh” initially, and if the image collected in steps 13 and 14 is still
very weak, try “chemi-super”, or “chemi-ultra”.
4. If you are analyzing a sample with multiple dyes, set up a channel for
each dye by clicking on each channel tab, selecting “enable channel”,
and choosing the desired application for that channel.
5. If none of the applications satisfy your sample, you can select Custom,
then Edit, to create a new VersaDoc application. Fill in the required
information (Name, Filter, Illumination, Gain, and binning) click on OK.
6. Check that the sample trays are clean, and place the sample onto the
correct tray. Note, if the trays appear dirty, wipe with a kimwipe and DI
water.
a. If imaging a fluorescent sample, place it directly on the UV
transilluminator tray (on the bottom). Note: If possible, it is best
to remove the glass or plastic plates of a gel sandwich before
imaging as the glass and plastic may fluoresce when exposed to
UV light and contribute to a higher background signal.
b. If imaging a colorimetric sample, it is placed on the White Light
Conversion screen, which is then placed on the UV tray. Note:
This screen can be removed from the instrument, so the sample
transfer can also be done in your lab.
c. If imaging a chemiluminescent sample, it is placed on the
chemiluminescent tray (unless it is larger than 8x8 cm, in which
case it should be placed on the UV tray). Note: This screen can be
removed from the instrument, so the sample transfer can also be
done in your lab.
7. If NOT imaging a sample on the upper chemiluminescence tray, make
sure to remove it.
8. Set the camera iris by adjusting the aperture ring (aka f-stop). If imaging
samples with weak signals (i.e. chemilumnescent samples), set the fstop to a lower number (this opens the iris to allow more signal to reach
the detector). If imaging samples with a strong signal (i.e. colorimetric
samples), set the f-stop to a high value to avoid saturating the detector.
Refer to Table 7-1 for recommended settings.
PAGE 8
9
VersaDoc Standard Operating Procedure
Table 7-1: Recommended VersaDoc 4000 Settings for Common Sample Types
Recommended Settings*
Signal Type and
Exposure
Sample Type or Dye
Expected Strength
F-stop
Time
Notes
(seconds)
Protein gel stained
White light
with colorimetric
Visible, strong signal
5.6 or
conversion screen
0.1 to 5.0
dye (coomassie,
expected
higher
required on lower
silver)
tray
Protein gel stained
Fluorescent
5.6 or
Place directly on
with fluorescent dye excitation, strong
1.0 to 10
higher
lower tray
(Sypro Ruby, GFP)
signal expected
Ultraviolet
Ethidium Bromide
excitation,
1.4 to
Place directly on
1.0 to 15
DNA gel
moderatly strong
5.6
lower tray
signal expected
Chemiluminescent or
enhanced
Place on upper
Western Blot or Dot
chemiluminescent,
1.4
100-500
chemiluminescent
Blot
weak signal
tray**
expected
* These settings assuming the 4000 camera and fixed lens are installed. The 4000 camera and the fixed
lens are suitable for most applications, however, If the signal is very weak, or the sample is too large (it
appears cropped in the image), please speak to the Instrumentation Technician about using the 5000
camera or zoom lens. DO NOT attempt to change the camera or lens yourself.
** Unless the sample is larger than 8x8 cm, in which case it should be placed on the lower tray.
9. In the acquisition window, under Step II, select POSITION, and manually
adjust the position of the sample if needed (note: minimal adjustment is
probably required as the image analysis software (imagelab) can be used
to crop and rotate an image as needed).
10. Select FOCUS and confirm that the sample is focused. If not, adjust the
focus ring on the camera to match up the other red arrow sticker.
11. Under Step III, set the exposure time: Please Note: The Iris (f-stop) and
exposure time have similar influences on your images. For example, a
brighter image can be acquired by a smaller f-stop numer or longer
exposure time. You can adjust both parameters to get best images.
a. Refer to table 7-1 for recommended exposure times, and click
Preview to see the image.
PAGE 9
10
VersaDoc Standard Operating Procedure
b. For a new sample type, select “Optimize exposure” and enter the
following (Optimize cannot be used for multi-channel imaging),
make sure “Highlight saturated pixels” is selected, “Save Images”
is not selected.
i. For a chemluminescent sample (i.e. Western blot) enter
100 for the starting exposure, 600 for the total exposure,
and 10 for the number of exposures.
ii. For a colourimetric sample (i.e. coomassie blue or silver)
enter 0.1 for the starting exposure, 10 for the total
exposure, and 20 for the number of exposures.
iii. For a fluorescent sample (i.e. sypro ruby, GFP) or a UV
sample (i.e. ethidium bromide) enter 1 for the starting
exposure, 10 for the total exposure, and 10 for the number
of exposures.
12. Press OK. The images taken with different exposure times will be visible
on the screen as they are collected.
13. Click Window Tile to see all of the collected images. You can rightclick on an image and select Image Report to view the collection
parameters for that image. Note: The brightness and contrast of each
image is automatically adjusted after image collection but this affects
the appearance of the image only, not the actual density.
14. To check the density of the last image, right click on the image and
select Density at Cursor, then left click on one of the darkest bands in
your image. The maximum density is 65,000 and an optimized image will
have a maximum density close to, but not at, 65,000.
a. If the maximum density in the last image (with the longest
exposure time) is far below 65,000, re-collect the image with a
longer exposure time or a smaller f-stop setting (or, if doing a
chemilumnescent sample, change the selected method to “chemiSuper” or “chemi-Ultra”). If this does not result in sufficient
sensitivity, you need to switch to the 5000 camera (Contact the
Instrumentation Technician).
b. If the maximum density in the image is 65,000 the camera
detector was likely saturated (and the pixels appear red). Select
PAGE 10
11
VersaDoc Standard Operating Procedure
an image with a shorter exposure time or re-collect the data with
a larger f-stop setting.
15. Choose the optimized exposure time and click on Acquire.
16. When a satisfactory image has been obtained, save the final image as a
TIFF file and a “.1sc” file. Image analysis can be conducted in ImageLab
(see section 7.3).
7.2 Cleanup
The sample trays are resistant to most research chemicals, but should be
washed with a small volume of water and wiped dry with a kimwipe or soft
sponge IMMEDIATELY following imaging.
7.3 Image Analysis
Image analysis can be carried out in ImageLab. This software is available on
the VersaDoc computers and a copy can be optained from the Instrumentation
Technician.
For informative tutorials on ImageLab, see:
Image Analysis:
https://sas.elluminate.com/site/external/jwsdetect/playback.jnlp?psid=201009-07.2117.M.9EF814CC7FF199166934248F198E09.vcr&sid=voffice
OR Select “Tutorials” when you open the ImageLab software.
The following protocol provides a basic outline for densitometry and MW
analysis:
1. Click on the ImageLab software and open the saved image.
a. If the sample was labeled with multiple dyes, or you want to
merge more than one image of the same sample, then open all of
the images for that sample and select Image Tools, then “Merge”.
Note: Merged images are best used for illustration purposes
ONLY. All quantitation should be done on original, un-merged,
images.
PAGE 11
12
VersaDoc Standard Operating Procedure
2. If analyzing a blot or gel, follow steps 3 through 6. If analyzing a plate,
skip to step 7.
3. All image analysis options are listed in the toolbar on the left side of the
screen. It is usually best to start at the top of the list with “Image
Tools”:
a. Crop the image as desired using the Crop button, move the red
lines, and then right click to crop the image.
b. Rotate the image by using the Custom button tool and aligning the
crosshairs with the vertical and horizontal planes of the image,
then right click on the image.
4. Return to the Image Tools main menu and click on “Lanes and Bands”:
a. Under the Lanes Tab:
i. Click on Automatic to allow the software to detect the
bands, or click on Manual, and then enter the number of
lanes in the image.
ii. Then use the tools under “All Lanes” and “Single Lane” to
adjust the width, shape, and location, of the band lanes.
iii. Use Background Subtraction to remove background signal
using the software. Note: a larger “disk size”
of
approximately 10, is best for visible stains such as a
coomassie gel, and a smaller disk size of 2-3 is better for
fluorescent and chemiluminescent gels. Set the desired disk
size and click “Apply”.
b. Under the Bands Tab:
i. Click on Detect Bands to allow the software to detect the
bands, or manually add and adjust the bands using the Add,
Delete, and Adjust buttons. After automatic detection, the
bands can still be adjusted or deleted as desired.
ii. To see a more detailed image of the band locations, click
on “Lane Profile” at the top of the screen. Band locations
can be adjusted in this window as well.
c. Return to the Image Tools main menu.
PAGE 12
13
VersaDoc Standard Operating Procedure
5. If you have a MW standard lane included in your image, click on “MW
Analysis”. If not, skip to step 6 for band intensity quantitation
(densitometry).
a. Use the checkboxes under the lanes to indicate which lane
includes the MW standards.
b. Click on the “Change” button to select the appropriate set of MW
standards. If the desired standard set is not listed, add it using
the New button.
c. The resulting curve can be viewed using the “Standard Curve”
option from the menu at the top of the screen.
d. To see the calculated MW values, click on the desired lane, and
then choose “Analysis Table” from the top menu. Alternatively,
click on “Report” to generate a complete list of all lanes along
with images.
e. Return to the Image Tools main menu.
6. To perform densitometry, click on “Quantity Tools”:
a. Use the “Relative” tab to determine the density of each band
relative to one of the bands in the image. Use Select to choose
the reference band.
b. Use the “Absolute” tab if the actual concentrations of more than
one band are known. Use Select to choose the known reference
bands and enter the known values. At least two bands must be
chosen to create the calibration curve. The resulting curve can be
viewed using the “Standard Curve” option from the menu at the
top of the screen.
c. Return to the Image Tools main menu.
7. If analyzing the image of a plate, use the “Volume Tools” button.
8. To add any text or highlight a band using an arrow, click on the
“Annotation Tools” button.
9. When all quantitation is complete, click on Analysis Table or Report to
generate a list of the final results.
10. Save the quantified image under a different name from the original file.
PAGE 13
14
VersaDoc Standard Operating Procedure
8. TROUBLESHOOTING
Table 8-1 lists some of the problems commonly encountered when using
the VersaDoc. For additional troubleshooting tips, please see the VersaDoc
manual.
Table 8-1: Common sectioning problems and causes (VersaDoc User Manual)
PAGE 14
15
VersaDoc Standard Operating Procedure
PAGE 15
16
VersaDoc Standard Operating Procedure
REFERENCES
Hands-on training with Sean Taylor (BioRad Field Application Specialist,
December 1, 2010).
VersaDoc User Manual.
http://www.biorad.com/webroot/web/pdf/lsr/literature/VERSADOC_MANUAL_MP1REV_F.PDF
Accessed: December 2, 2010.
Wilfrid Laurier University Environmental/Occupational Health and Safety
Office. 2007. Laboratory Health and Safety Manual.
www.wlu.ca/documents/23120/Laboratory_Health_%26_Safety_Manual.pdf
PAGE 16
VersaDoc Standard Operating Procedure
17
APPENDIX: VERSADOC USER LOG
PAGE _____
VersaDoc Standard Operating Procedure
DATE
NAME & EXTENSION
SUPERVISOR
SAMPLE DESCRIPTION
(GEL OR BLOT AND
DYES/TAGS USED)
CAMERA AND LENS
USED
TRAY USED
□ 4000 & ZOOM LENS
□ 4000 & FIXED LENS
□ 5000
□ 4000 & ZOOM LENS
□ 4000 & FIXED LENS
□ 5000
□ 4000 & ZOOM LENS
□ 4000 & FIXED LENS
□ 5000
□ 4000 & ZOOM LENS
□ 4000 & FIXED LENS
□ 5000
□ 4000 & ZOOM LENS
□ 4000 & FIXED LENS
□ 5000
□ 4000 & ZOOM LENS
□ 4000 & FIXED LENS
□ 5000
□ 4000 & ZOOM LENS
□ 4000 & FIXED LENS
□ 5000
□ 4000 & ZOOM LENS
□ 4000 & FIXED LENS
□ 5000
□ 4000 & ZOOM LENS
□ 4000 & FIXED LENS
□ 5000
□ 4000 & ZOOM LENS
□ 4000 & FIXED LENS
□ 5000
□ WHITE TRAY
□ UPPER CL TRAY
□ LOWER (NO) TRAY
F-STOP
NUMBER
OPTIMIZED
EXPOSURE TIME
PROBLEMS /
COMMENTS
PAGE _____
VersaDoc Standard Operating Procedure
DATE
NAME & EXTENSION
SUPERVISOR
SAMPLE DESCRIPTION
(GEL OR BLOT AND
DYES/TAGS USED)
CAMERA AND LENS
USED
TRAY USED
□ 4000 & ZOOM LENS
□ 4000 & FIXED LENS
□ 5000
□ 4000 & ZOOM LENS
□ 4000 & FIXED LENS
□ 5000
□ 4000 & ZOOM LENS
□ 4000 & FIXED LENS
□ 5000
□ 4000 & ZOOM LENS
□ 4000 & FIXED LENS
□ 5000
□ 4000 & ZOOM LENS
□ 4000 & FIXED LENS
□ 5000
□ 4000 & ZOOM LENS
□ 4000 & FIXED LENS
□ 5000
□ 4000 & ZOOM LENS
□ 4000 & FIXED LENS
□ 5000
□ 4000 & ZOOM LENS
□ 4000 & FIXED LENS
□ 5000
□ 4000 & ZOOM LENS
□ 4000 & FIXED LENS
□ 5000
□ 4000 & ZOOM LENS
□ 4000 & FIXED LENS
□ 5000
□ WHITE TRAY
□ UPPER CL TRAY
□ LOWER (NO) TRAY
F-STOP
NUMBER
OPTIMIZED
EXPOSURE TIME
PAGE _____
PROBLEMS /
COMMENTS
VersaDoc Standard Operating Procedure
PAGE _____