1
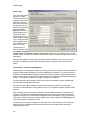
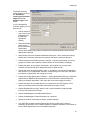
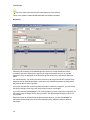
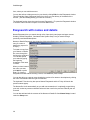
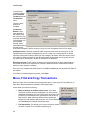
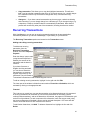
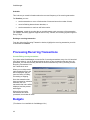
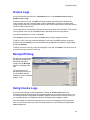
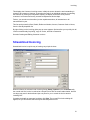
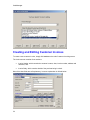
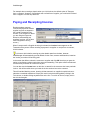
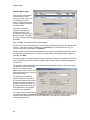
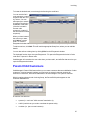
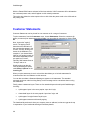
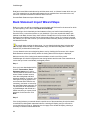
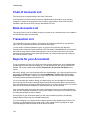
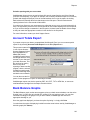
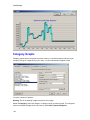
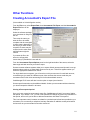
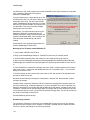
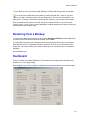
Reports
Periodic reporting with your accountant
CashManager does not have any period close-offs as such, apart from the end of the financial
year itself. Consequently, if you print, for example, the Summary Cashbook Report for one month,
go back and change the amount of one of the transactions, then re-run the report, the closing
bank balance will naturally differ from that shown on the first report. This will mean that the
opening balance for the next month will also differ.
If you send your figures to your accountant more often than once a year, you need to keep this in
mind. The figures they receive for the second period will not include anything from the first period,
so if you need to change a transaction in the first period, let them know the details of that change
so they can make the appropriate correction in their books for the first period.
For more information, contact your local Support Centre.
Account Totals Export
If you want to export your data to a spreadsheet like Microsoft Excel, you can create a special
export file by selecting Account Totals Export from the File | Export menu.
This process creates a file
in one of three formats Comma Separated Values,
Excel Spreadsheet, of
dBase (dbf) format,
containing monthly actual
and budget totals for every
account in your chart and
your bank accounts. This
file can then be read by
Excel or any other
reporting or data crunching
program, with the columns
containing monthly totals,
and rows containing chart
and bank account details.
You can then use the full
power of other programs to report on and analyse the data.
CashManager reports can also be saved as PDF, XLS, RTF, TXT or HTM files, or sent as an
email attachment, straight from the Report Preview window.
Bank Balance Graphs
The Bank Balance graph, as the name suggests, plots your bank account balance over the entire
financial year. You can elect to included one, several or all your bank accounts. You can also
nominate a heading for the graph, but if you leave it blank, CashManager will choose an
appropriate heading for you.
Once the graph has displayed, you have the option of printing it - simply click Print.
You also have the option of displaying in table format the actual values used by CashManager to
build the graph (click Values).
103