1
1.5 Terminology Related to Flicker
1
Instantaneous Flicker Sensation IFS
2
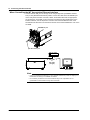
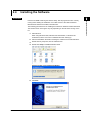
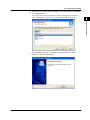
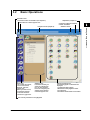
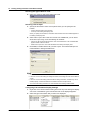
Block Diagram of the Flicker Meter in IEC 61000-4-15 Edition 1.1
Block 1
Voltage
Input
Detector and
Gain Control
Input Voltage
Adaptor
Block 2
dB
0
-3
Demodulator
with
Squaring
Multiplier
-60
120V60Hz 42 120
Signal Generator
for Calibration
Checking
Range
Selector
0.5
ΔV
% 1.0
V
2.0
5.0
10.0
20.0
1
0.05
Hz
230V50Hz 35 100
0
8.8
Block 5
Block 4
Block 3
Hz
Weighting
Filter
A/D
Converter
1st Order
Sliding
Mean
Filter
Squaring
Multiplier
Sampling
Rate
>= 50Hz
Output
Interfaces
Pst and Plt
3
Pst and Plt Operations
Squaring and
Smoothing
Calibration Filters
64 Level
Classifier
Product Overrview
The output of block 4 of the flicker meter. For details on the flicker meter, see IEC
61000-4-15.
Statistical Evaluation
of Flicker Level
4
Note
This method does not necessarily match the processing method of the WT3000.
5
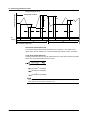
Cumulative Probability Function CPF
This function determines the probability density function of the flicker level from the
instantaneous flicker sensation and accumulates the levels of the function from the
highest level.
6
Example in Which Flicker Levels 0 to 6400 [P.U] Are Divided into 10 Flicker Classes
Probability Density
Cumulative Probability Function
(CPF)
5760
9
5760
5760
5120
8
5120
5120
4480
7
3840
6
3200
5
3840
3200
4480
3840
3200
2560
2560
4
2560
1920
3
1920
1280
2
1280
1280
640
1
640
640
0
0
0
Time
40
20
0
Density (%)
1920
100
80
60
40
20
0
8
Flicker Level (P.U.)
6400
Flicker Level (P.U.)
10
4480
7
6400
6400
Flicker Class
Flicker Level (P.U.)
Output of Block 4
9
10
0
11
Cumulative Probability (%)
Note
The WT3000 performs processing different from the figure above to compute the CPF more
accurately.
12
13
14
Index
IM 761922-07E
1-15