1
Department of Physical Geography
and Quaternary Geology
Implementation of a Geoserver
application for GIS data
distribution and manipulation
Karteek Kommana
Master’s thesis
Physical Geography and Quaternary Geology, 45 Credits
NKA 79
2013
Preface
This Master’s thesis is Karteek Kommana’s degree project in Physical Geography and
Quaternary Geology at the Department of Physical Geography and Quaternary Geology,
Stockholm University. The Master’s thesis comprises 45 credits (one and a half term of fulltime studies).
Supervisors have been Göran Alm at the Department of Physical Geography and Quaternary
Geology, Stockholm University and Stefan Ene, Department of Human Geography,
Stockholm University. Examiner has been Peter Schlyter at the Department of Physical
Geography and Quaternary Geology, Stockholm University.
The author is responsible for the contents of this thesis.
Stockholm, 12 June 2013
Lars-Ove Westerberg
Director of studies
Abstract
Accessibility and Interactivity are keywords of information today and that is equally important in
science as anywhere else. When scientists share information it benefits if it is intuitive, informative
and simple and does not demand expert skills in complicated formats. This master thesis has the aim
to investigate open source software tools to design a web map application that can be used by any
institute or NGO to distribute their data over internet.
The Java platform to be implemented is the open source OpenLayers which allow users to view and
potentially manipulate GIS map data through a web map application. Whatever GIS data made
available on the Geoserver (the host site for the application) can be shared to users worldwide. The
user can then: add from a list of available data layers, choose background (e.g. Google Earth, Open
Street Map, etc.), zoom in and out, pan, change symbols and colors, add their own data on top and
start animation (if applicable).
The data distributed from the Geoserver can also be viewed and accessed from smartphones which
opens the possibility to make the public part of the larger data gathering task of specific scientific
inventories like observations of migrating birds, or whatever indicator a specific scientist is interested
in. Data is uploaded to the Geoserver and can then be analyzed and the result is distributed to the
public.
Keywords: OpenLayers, Java, Geoserver
Table of Content
ABSTRACT ........................................................................................................................................... 1
INTRODUCTION ................................................................................................................................. 5
Objectives: ....................................................................................................................................................... 6
Case study: The Land Uplift .............................................................................................................................. 6
Web Mapping .................................................................................................................................................. 7
Classification of web mapping: ........................................................................................................................... 7
Architecture of Interactive mapping .............................................................................................................. 7
Data types....................................................................................................................................................... 7
Web server ..................................................................................................................................................... 8
Tiling ............................................................................................................................................................... 8
Open Geospatial Consortium.............................................................................................................................. 9
Web Map Service ........................................................................................................................................... 9
OGC- WMS ...................................................................................................................................................... 9
EPSG: ................................................................................................................................................................. 10
OpenLayers: ...................................................................................................................................................... 10
Client-side:.................................................................................................................................................... 11
OL library: ..................................................................................................................................................... 11
Web map application: .................................................................................................................................. 11
Google/Yahoo/Bing/ and other APIs: ........................................................................................................... 11
OpenLayers Layer: ........................................................................................................................................ 12
Map Controls: ............................................................................................................................................... 12
Controls in detail .......................................................................................................................................... 13
Web page design: ............................................................................................................................................. 13
Geoserver: ........................................................................................................................................................ 14
RESULTS: ........................................................................................................................................... 15
Detail explanation of Script: ........................................................................................................................... 17
CONCLUSION:................................................................................................................................... 19
Problems during project: ................................................................................................................................ 20
Future work: .................................................................................................................................................. 20
ACKNOWLEDGEMENT .................................................................................................................. 20
REFERENCES .................................................................................................................................... 21
APPENDIX 1-GEOSERVER INSTRUCTIONS: ........................................................................... 23
Web administration interface:.......................................................................................................................... 23
Server: .......................................................................................................................................................... 23
Data: ............................................................................................................................................................. 23
Layer group:.................................................................................................................................................. 24
Services:........................................................................................................................................................ 24
Tile catching: ................................................................................................................................................ 24
Map projections: .......................................................................................................................................... 24
Introduction
Data sharing and distribution over the internet may seem to be difficult and expensive for persons
representing e.g. NGO’s or local folklore societies etc. There is still an increasing need to share their
data to the public. For example, statistical geospatial data are difficult to understand if it is presented
as tables or graphs. The users’ understanding can be improved by showing the data on a map. The
process of showing data on a map over the web is termed as “Web Mapping” or “Internet Mapping”.
Showing the data on a map requires geospatial coordinates of the data. The use of internet mapping
has been getting vast popularity for past few years. By the end of 1999 there were about 40 million
maps were produced over the Internet per day and two years later almost reached over 200 million
per day (Schütze, 2007). This tremendous increase of the use of internet mapping shows the
importance of showing/sharing spatial information over internet. On February 2005 the release of
Google maps created a revolutionary change in the concept web mapping. Google maps were
introduced with dynamic mapping with more user interface tools that made it successful (Ramsey).
Continues development of GIS technology and in special web mapping can provide smart and selfservice applications. Municipalities in England has successfully implemented web mapping
applications to improve the citizen services and recognize savings (Directions Staff, 2009). Web
mapping applications come with menus and functions easy to understand and users can browse or
search for information through the web. The level of information provided can be varied according to
the intended user and the access to data can be regulated through the use of login and password if
so desired. With easy access to information via the internet, there has been increased participation
from the communities on issues relating to community (Majid, Haron, & Rafee, 2007). With the
introduction of Google Maps and Bing Maps people are exposed to the GIS solutions in their
smartphones, tablets and computers. This widespread use increases the familiarity of reading
information from web maps. Municipalities using this web map technology have the tool to provide
and spread large quantities of information online. This gives citizens 24/7 access to information
which vastly reduces phone calls to government offices. Some of examples of map services that
government agencies provide are:
1. A web map application that can be used for crime complains by pointing location.
2. Providing information about the construction projects that are ongoing which can cause
traffic delays.
Through web map service, users can also process and manipulate spatial data online such as doing
simple analyses using the spatial data. This analysis can be done by customizing the user interface
with simple analysis functions. One example is the Slaithwaite Web GIS (Carver et al., 2005) which
provides the community with markup functions on the web that lets the user to comment on the
data directly on the map. In planning, web mapping applications can also support the concept of egovernance through the internet, the two-way interactions between government and citizens,
government and government as well as government and NGO’s (Montagna, 2005).
The use of web map applications is increasing in both public and private sectors. These web based
GIS projects often face challenges like: lack of financial resources, lack of technical expertise, and lack
of documentation about how non-technical users can make use of web based GIS. It is difficult to
evaluate whether these advantages of technology can really lead to the improvements suggested by
their proponent’s: improve public participation, transparency in government, literacy in Web GIS,
better data driven decision making by community based organizations.
In recent times use of internet has improved greatly with no doubt geospatial information has
become a part of people’s day to day life. Online street maps like Google maps, Google Earth and
Yahoo maps are popular and are combined with social networking sites like blogs, wiki, personal
publishing. This trend has increased in recent times. One popular site states that, it has more than 40
million unique visitors per month (Nivala, Brewster, & L, 2008) which clearly show the popularity of
web mapping technology in the public. The biggest advantage of adapting web for developing
applications includes:
1. No local installations required.
2. Automatic upgrade of new features for all users.
3. Worldwide access from any device connected to the internet.
The aim of this project is to see if it is possible to design a web map application by using open sources
so that the end user does not need technical skills to work with it. The outcome of this project will in
that case be a web map application that can be used by any institute or NGO. The data of any
individual person can be shared over the internet with no or low cost and with only basic technical
knowledge.
Objectives:
The specific objective of this project is to design a web based mapping application suitable for a
university department or NGO that should be able to:
1.
2.
3.
4.
5.
6.
Supply maps from the research activities to the public.
Supply maps to the restricted users (e.g.: other research groups, different organizations).
Data on the map should be selectable, editable, zoomable, pannable etc. on Google Maps.
Animate the map layers of an application.
Users own data should be possible to superimpose on the map object in the application.
To validate how useful is a system like this for e.g. NGO’s and other local society or private
person.
To test suitable methods for implementing the above objectives an already existing data set was
used. This data comes from an earlier project at the department and it deals with the effects of a
change in shoreline due to the isostatic uplift that has its origin in the melting of the ice cover over
Scandinavia during the last stages of the last glaciation and is briefly discussed below.
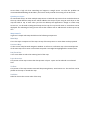
Case study: The Land Uplift
To describe change during the last 7000 years in shoreline configuration in northern Uppland,
southeast Sweden, 17 overgrown lakes have been interpreted by diatom analysis and AMS
radiocarbon dates on terrestrial macrofossils. Also 20 archaeological sites expected to be shore
bound were dated and their locations measured. The sites studied are spread c. 60 km in east-west
and c. 70 km in north-south direction. From these 37 sites a multi-linear regression was performed
and used to determine the expected elevation of the Baltic shoreline for a given age and a given
position in the map coordinate system. The data analysis showed that the rate of isostatic uplift was
faster the further to the north you are and faster the further back in time you look. The radio-carbon
dating of the archaeological and lake sediment samples were between 5000 BC to 2000 BC. As a
result from the analysis it is possible to produce maps of the position of the shoreline from a given
age, so called paleogeographic maps. A set of maps separated by 500 years from 5000 BC and
extrapolated to 1500 AD were constructed. These maps are now used to illustrate the web map
application in this exam project work (Risberg, Alm, & Goslar, 2005).
Web Mapping
Presented Spatial data as a map over the internet is termed Internet Mapping, Web Mapping, netbased etc. showing data on the map over the internet is not only a simple web mapping, along with
presenting the data it should also provide simple tools like zoom bar and panning over the map.
Classification of web mapping:
Web mapping is divided into static and interactive maps. Static maps are simply mapped pictures
that can be fit into the web page with no user interaction, whereas interactive maps are more
advanced maps which allow users to interact with the data on the map. The only interaction that the
user can have in static maps is panning around the map which does not alter anything on the map.
Architecture of Interactive mapping
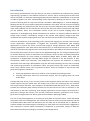
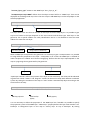
Map object on the web page communicate with the web server to display data on the map which are
stored on a web server. For example when the user is zooming in the map, the map client requests
map tiles from map server and are displayed on the map. The server will generate new maps
corresponding to the zoom level. The newly generated maps will be sent to the map object and the
web map client displays it on the map that is integrated in the web page. The picture below shows
the architecture of web mapping.
Figure 1. Client-Server Architecture (Mitchell, 2005)
Data types
A web browser can usually be able to display various types of raster data on the map in PNG or JPG
format, but browsers are still not able to support a variety of vector formats.
Web server
A web server is the place where map data are stored. It is usually installed in a separate machine.
Popular free web servers include Geoserver, Tomcat, MapServer etc. Later in the report we focus on
Geoserver which is used especially to store Geo-referenced data.
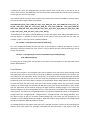
Tiling
Tiling is a fairly new development - it is the process of dividing a large map into small pieces in the
form of square tiles and send these separately from the server which improves the performance of
the web map. Map tiling can be done in two ways, client-side or server-side. The map can be pretiled in the server before the map is loaded into the web page. This will improve the loading time of
the map but the main drawback of this is that, it is a time consuming process. But once the tiles are
made in the server the tiles can instead directly be sent from the server. There is also a possibility to
tile the map at different zoom levels on the server. On the client-side, the user selects the interested
area and map client requests the tiles from the server. The size of map tile increase twice in height
and width for each increasing zoom level on the map.
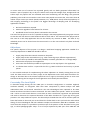
When the user zooms in or out into the place of interest the server will generate the map for that
particular area. At zoom to maximum extent on the map the user may not recognize the map tiles
but when zooming in repeatedly it is possible to see the map appear in the form of squares.
Figure 2. Determination of Tiles to be loaded (Schütze, Web Mapping, 2007)
Open Geospatial Consortium
The Open Geospatial Consortium (OGC) was formed in 1994 from the Open GRASS Foundation
(OGF). It is a non-profit organization working in collaboration with more than 480 companies (by
2013) government organizations and universities all over the world. The major objective of the OGC
is to develop international standards for geospatial data and to set standards for public use. OGC
standards come with a technical documentation and encodings. OGC® and OpenGIS® are the
trademarks of OGC standards. The standards allow the developers to create complex spatial
information and make it accessible to public and can be useful in different kinds of applications
(Open Geospatial Consortium).
Web Map Service
The fundamental component of web mapping application is its map image. The Web Map Service
(shortly as WMS) is the standard process of accessing map data from the server where map data are
stored. When user interacts with the map, map tiles will be generated on the server and be sent back
to the map. WMS generates map data in the form of image whether it is a vector or raster data. A
simple WMS request can look like below.
http://localhost:8080/geoserver/topp/wms?service=WMS&version=1.1.0&request=GetMap&laye
rs=topp:tasmania_cities&styles=&bbox=145.19754,-43.423512,148.27298000000002,40.852802&width=512&height=427&srs=EPSG:4326&format=image/png
A quick explanation of the above WMS is:
1.
2.
3.
4.
5.
6.
Server details (a WMS 1.1.0 request)
Request type (WMS GetMap)
Layer name (topp:tasmania)
Projection (EPSG:4326)
Bounding box (in this case, latitude/longitude coordinates)
Image size and format (512x427 PNG)
OGC- WMS
The OpenGIS® Web Map Service Interface Standard (WMS) provides a simple HTTP interface for
requesting geo-registered map images from one or more distributed geospatial databases. A WMS
request defines the geographic layer(s) and area of interest to be processed. The response to the
request is one or more geo-registered map images (returned as JPEG, PNG, etc.) that can be
displayed in a browser application. The interface also supports the ability to specify whether the
returned images should be transparent or not so that layers from multiple servers can be combined.
When a Web Map Service fulfills the WMS specifications of the OGC, it is referred to as an OGC
conforming WMS. This means that requests to and responses from the WMS must be done according
to a specific standard. The following three queries fall under current OGC specifications (with the
third being optional).
1. GetCapabilities
queries the WMS' capabilities.
2. GetMap
requests a specific map.
3. GetFeatureInfo
requests information on individual map objects.
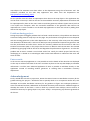
The figure below illustrates the relationships between some OGC web services, as well as the main
operators (as defined by the OGC web services).
Figure 3. OGC Web Services Architecture (Hazzard E. , 2011)
EPSG:
Geographic coordinates describing the position of an object on the earth's surface refer as an earth
model rather than the Earth itself. There are many ways to represent objects in the model with
different coordinates. The European Petroleum Survey Group (EPSG) designed a model with geodetic
parameters in 1985 for internal use in their company. In 1995 they make the data public to their
Petro Technical Open Software Corporation data model. In 2005 EPSG was reformed to the
International Association of Oil and Gas Producers (OGP). OGP is a group of companies working on
exploration and mining world-wide. The dataset includes coordinate systems, datum
transformations, projections, units and other related information. The information was gathered
from various petroleum companies, government agencies that are responsible for geodetic in that
specific country. EPSG dataset is available for free download and are worldwide accepted coordinate
system and transformation information. Data will be frequently updated at least 2-6 times in a year
depending on the data they get (EPSG, 2012).
OpenLayers:
OpenLayers (OL) is a Java script library running on the client side. It is completely open source and
can be freely accessed. Having programming knowledge will make it easier to work with OL but even
non-programmers can be able to handle it as everything is stored in the OL library. It is not owned by
any company and it is been developed by group of developing communities. It is possible to
download the Java script library locally or on the server and edit the library according to the user
need. It works in almost all the modern web browsers and some older like IE6.
Client-side:
OL works on the local machine of the user, it particularly runs on the user's web browser.
OL library:
OL is a Java script library which is developed by a group of brilliant people and can be either
downloaded from the OL website or accessed from the repository on the OL website
(www.openlayers.org). OL library is an API (Application Programming Interface) which provides tools
to build web mapping applications. When a web mapping application is made from scratch, mapping
part of the application can be used from OL library. For example if you want to setup a blog, it is not
necessary to build it from scratch instead existing sources like WordPress or Blogger can be used to
build an application on top of it. The same for web mapping, it can be created from scratch or use
examples from the OL library which has been built and tested by a strong community.
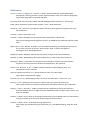
Web map application:
Web map application could simply be any application of internet that uses maps. For example,
showing the population density in different regions of a city on map which are geo-referenced or it
could be showing water bodies (geo-referenced) on a particular area in a map
Figure 4. Server Client model (Hazzard E. , 2011)
The core process of any web application called “Server/Client Model”. In the case of web mapping OL
acts as a web map client which request map data from the map server (E.g.: WMS server).
Web map client:
The primary duty of the client is to get a map from the map server. When the user interacts with the
map by panning, zooming or looking at a particular area on the map, the client should request that
particular map from the server and display it on the map. OL does all client work by using
asynchronous JavaScript (AJAX).
Web map server:
A map server simply provides maps to the web map client. There are many different map servers
that are available; WMS examples are Google Maps, Bing Maps. Yahoo Maps etc. these map servers
allow the client to select different parts of the map. With OL it is possible to use multiple back end
servers like Yahoo, Google, Bing etc.
Google/Yahoo/Bing/ and other APIs:
Google, Yahoo and other APIs provide their map service on the map objet as background map (OL
does the same). These APIs works on client side like OL. Google maps are very powerful which can
allow GIS tools on the map (which can also be done with OL). The biggest disadvantage of using
Google is there will be no access to its backend server. As there is not possible to access the backend
server there is high rick that something can happen in Google server. To solve this problem OL
recommend downloading the OL library and save it locally instead of accessing it from OL server.
OpenLayers Layer:
As mentioned earlier, OL allow multiple map servers or backend map servers that can deliver data to
the map. These different map servers will be added to the map as layers using OL. Each layer on the
map will add on top of each other just like the desktop GIS applications. Google or Yahoo map
servers etc., can be used as background maps and on top of it any kind of raster or vector data can be
displayed. The advantage of using vector data is that it allows user to add GIS tools to the map on top
of it.
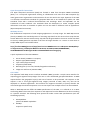
Map Controls:
In general a simple web map should have the following components:
Main Map:
This is the major component of the map. On top of the map raster or vector data can be projected.
Overview Map:
It’s also a main map but with navigation window. It will act as a reference map. The zoomed portion
of the main map can be seen on the whole map with a rectangle box highlighted the zoomed area.
Pan/Zoom Bar:
It is a zoom slider to select the zooming level of the map.
Layer Overview:
This portion of the map contains the data present in layers. Layers can be selected or unselected
here.
Toolbar:
This portion of the map contains GIS tools like panning button, zoom button etc. The tool box can be
placed on the map or outside the map.
Scale Bar:
Scale bar shows the current scale of the map.
Figure 5. Components of Web Mapping Application OpenLayers (Schütze, Web Mapping, 2007)
Controls in detail
With the rapid growth of the internet and web mapping the concept of map interaction has gained
greater importance. In modern web mapping applications user has more specific interactive tools on
the map. It is possible to display data on the map in any region of the world. Pan /zoom bar can be
used to pan the map in any direction and the zoom bar can be used to zoom the map from global to
local level. Layer overview of the map allows the user to select the specific data on the map which
will be very useful to compare different data on the map. GIS tools can also be added to the map in
the tool box which will allow the user to create points, lines or even polygons on the map. For a more
advanced web mapping Ajax has been used to connect the map with the other objects on the web
page.
Web page design:
In order to build a web page some basic things are required:
1. Page construction(e.g. HTML)
2. Styling(e.g. CSS)
3. Page interaction (e.g. JQuery)
HTML is the standard and universally accepted markup language used to construct the web page.
HTML stands for “Hyper Text Markup Language”. HTML defines the structure of the web page using
standard tags which are enclosed in angle brackets (e.g.: <html>) and attributes. All the HTML tags
are coming up with pair i.e., beginning tag and ending tag (<html>,</html>). The closing tag looks
exactly same as beginning tag with extra back slash “/” before the tag name. There are several
hundreds of HTML tags are available in the language, all the tags are not required to construct a web
page. Two basic tags are necessary to construct a web page web without those pages cannot be build
(W3Schools, HTML Tutorial).
<!DOCTYPE html>
<html>
tag)
this tag defines the page as HTML
starting the script with. All the script lies under this tag.(Beginning
<body>
content of the page resides under this tag. (Beginning tag)
<h1>My First Heading</h1>
this tag is for heading on the web page (Both tags)
<p>My first paragraph. </p>
this tag is for a paragraph on the web page. (Both tags)
</body>
this tag in the script closes the beginning tag <body> (Close tag)
</html>
this tag in the script closes the beginning tag <html> (Close tag)
CSS standards for “Cascading Style Sheet”. It defines the style of HTML objects on the web page.
Using CSS, it is possible to display or adjust the position of different objects like table, paragraph,
heading, copyright etc. on the web page. A simple style for a paragraph in a web page below
(W3Schools, CSS Tutorial).
<p style="color:sienna;margin-left:20px">This is a paragraph.</p>
Defines color of the paragraph.
It defines the paragraph should be 20 pixels distant from the left
margin.
JQuery is a client side JavaScript library that can be used to create dynamic web pages. With JQuery it
is possible to navigate to the web page and to e.g. create animations on the page. The simple JQuery
script shows below.
$(document).ready(function() {
$("#p").click(function() {
$("h1").css("background-color","red");
});
});
When user click on the paragraph on the page, JQuery triggers background color to red for h1
heading on the web pagen (W3Schools, JQuery Tutorial).
Geoserver:
Geoserver is a Java based server that can allow map creating and data sharing. It is completely open
source and work under OGC standards. It can allow display/sharing the well-spatial data to the world
through the web. Geoserver comes with a WMS that can fit into other Java applications like
OpenLayers and can create maps of different formats. It comes with inbuilt “Geotools” which is an
open source Java GIS toolkit that allows GIS operations on the map. Geoserver can display data on
the any popular modern mapping applications like “Google Maps”, “Google Earth”, “Yahoo Maps”
etc.; even it can connect to the traditional desktop GIS tools like ESRI ArcGIS. Complete instruction of
the Geoserver installation is provided in the appendix of this report (Geoserver).
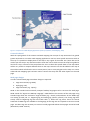
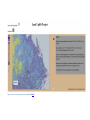
Results:
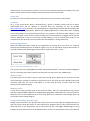
To create the dynamic web page HTML, CSS and JQuery have been used in this project. Tiff files were
produced for 500 year intervals from 5000BC to 1500AD using traditional desktop GIS tool ArcMap.
After the production of the layers they were imported to the Geoserver in order to display them on
the modern map servers like Google Maps, Google Earth, and Open Street Map etc.
On the web page data were projected in two different map projection systems. Swedish map
projection system SWEREFF99 TM and used for world mapping WGS84 lat/long system. When the
page load map with data projected on the Swedish projection system will be shown. In Swedish
projected map data includes a background map from “lantmateriet”. So, there will be only data
layers without any background map like Google Maps. Other map can be shown by pressing the
button “Show/Hide data on World Map”. Data projected on the world map were semi-transparent in
order to see the background map to know the difference between the past and present. User can see
both maps on the page or can hide one by clicking on buttons on the web page. On the right side of
the page description of the data has been given in Swedish (target people on this project are
comfortable with Swedish language). Finally the biggest challenge of the project is to animate the
layers in a series to show how the land has been raised and this was done by using the Giff animator
tool. Layers were imported to the Giff animator in order 5000 BC to 1500 AD and produce animated
Giff image. The animated image has placed in the server and displayed with HTML tags. The HTML
script that has used to create the web page can be shown in Script.
Figure 6. Screenshort of the designed web map application (Result)
Detail explanation of Script:
The web map application is designed by using HTML, CSS and Jquery. In this section a detailed
explanation of the script will be given.
<div id="map" style="height:500px;width:500px;float:left;">
The above block tag will create the “Map Object “on the web application. Inside this “div” element
Java scripting was written using OpenLayers library. When creating the map object it is required to
define the map controls. There are two ways to define controls to the map object one way is to give
basic default controls to the map object controls like zooming and panning around the map. The
second way is to define user specific controls to the map, only controls that are defined will apply to
the map object. In this project map object were given default controls in the beginning to make sure
that it contains minimum controls and later specific controls were defined like “Scalebar”, “Panel”,
“Layer”, “Mouse Position” etc. map object with default controls can be created like below.
var map = new OpenLayers.Map('map', { controls: []});
In OpenLayers to
create a new object
you need to say
“var” before the
object name on the
left side followed
by the name of the
object need to be
created.
This is the
OpenLayer
code to create
map object on
the web map
application.
Name of map
object. It can
be anything
not
necessarly
”map”
This is the
control
secton for
map object.
Controls []
means apply
default
controls to
the map.
Note: it is very important to keep an eye on comma, colon and apostpie in the script. They are very
important and without them the script won’t work.
After the map object created layers need to be added to the map. There is no limit to the number,
any number of vector data or raster data or even both together can be added to the map. Similar like
creating the map object, layers follow the same rules as below. For better understanding the script
was written in different rows.
var wms_layer_0_Kr = newOpenLayers.Layer.WMS
('0_Kr','http://130.237.175.39:8080/geoserver/wms/land_upplift',
{layers: '0_Kr', transparent: "true", format: "image/png"}
,{maxExtent: new OpenLayers.Bounds(585000, 6600000, 740000, 6722500), maxResolution: 'auto',
projection:"EPSG:3006", units: "m"},{isBaseLayer: false},{visibility: true});
“var wms_layer_0_Kr” creates a new WMS layer “wms_layer_0_Kr”.
“newOpenLayers.Layer.WMS” defines that the object created will be a “WMS layer” that can be
displayed on the background map. This is the Java script to add WMS layers on the map object on the
web map application.
'0_Kr' , 'http://130.237.175.39:8080/geoserver/wms/land_upplift'
Adress of WMS layer on the Geoserver
Layer name
The layer name is the one that can be seen on the layer list on the map object. It is possible to give
any kind of name to the layer depends on the user interest and the data type. Each layer on the
geoserver has a specific address for easily identification and it is not allowed to have the same
address for more than one layer.
{layers: '0_Kr', transparent: "true", format: "image/png"}
Layer name on geoserver
Asssign properties to the WMS layer
When a WMS layer is imported to the goeserver it is necessary to give it a unique name. It is possible
to assign different properties to the layer. “Transparent: true” means the WMS layer is allowed to
make transparent if needed. And “format: image/png” defines that the layer superimposed on the
map is a png image that is generated by the geoserver.
{maxExtent: new OpenLayers.Bounds(585000, 6600000, 740000, 6722500), maxResolution: 'auto'
Image resolution
Image size
“OpenLayer. Bounds” defines the position of the layer on the world map. The values will be obtained
in geoserver in both “meters” and “degrees”. Values can be used in maps with different coordinate
system. By setting the resolution of the map to “auto” makes it automatically adjust according to the
zoom level on the map.
projection:"EPSG:3006", units: "m"},{isBaseLayer: false},{visibility: true}
WMS layer projcection
Define base layer
property
Visibility property
It is not necessary to define the projection of the WMS layer but if needed It is possible to specify
the projection system of the WMS layer.” isBaseLayer” property defines the layer time weather it is a
baselayer or background layer on the map or overlay layer on top of baselayer. By setting
“visibility:true” when the webpage open the layer will be seen on the map. It can also be set to
“false” which restricts the WMS layer to show on the map automatically but can be seen by selecting
on the layer list over the map object.
In the above way all the layers were created. Then all the layers need to be added to the map object.
This can be done using the block script below:
map.addLayers([wms_layer_5000_fKr, wms_layer_4500_fKr, wms_layer_4000_fKr, wms_layer_35
00_fKr, wms_layer_3000_fKr, wms_layer_2500_fKr, wms_layer_2000_fKr, wms_layer_1500_fKr,
wms_layer_1000_fKr, wms_layer_500_fKr, wms_layer_0_Kr, wms_layer_500_eKr, wms_layer_100
0_eKr, wms_layer_1500_eKr, wms_layer_Point_Data]);
“map.addLayers” will add the created WMS layers to the map object. After adding the WMS layers to
the map object it is possible to create controls on the map for user interaction with the map. For
example “scale” on the map can be created like below.
var scalebar = new OpenLayers.Control.ScaleLine();
Tip: in the traditional desktop GIS tools top layer on the list will be visible on the map but in case of
OpenLayers it doesn’t follow such rules. There is a way to define the layer order by defining a control
to layer list as below.
var layer = new OpenLayers.Control.LayerSwitcher({'ascending':false});
map.addControl(layer);
by setting the ‘ascending:false’ the top layer on the layer list always appears on the map other layers
will be added below it.
Conclusion:
The aim of this project is to investigate open source software tools that can be used to design a web
map application that can be used by any institute or NGO to distribute their data over internet. The
case study that was undertaken shows clearly that it is possible to share spatial data with minimum
technical skills and low or no cost. In the case study the performance of the web map application was
tested with raster and vector data to compare its performance. Raster data requires little more time
to fetch data from the map server than vector data. Raster images used in the case study are high
resolution and have large size (around 250 MB each layer) gives decent performance, which shows
that the application can be used for sharing even high resolution satellite images. In the case study
data was displayed on both Google Maps and as a map specifically for Swedish data using SWEREF99
TM projection. The reason for using Google Maps is its popularity worldwide. There are four different
Google base maps: “Google Hybrid”, “Google Streets”, “Google Physical” and “Google Satellite”. User
can select anyone in the list, for better understanding and if the layers are half transparent it is
possible to see the background map though it. Data that needs to be projected on the Google Maps
should be prepared in WGS 84 projection system.
On a Swedish specific map object, data that have a Swedish projection system can be superimposed.
Data on both maps objects are pannable, zoomable and select/unselect on the layer list over the
map object. The animation was done earlier at the department using the Gif animator tool. The
animation provided on the web map application was taken from the department site
http://ww2.ink.su.se/living_maps/.
For the specific users who want to superimpose their data on the map object in the application this
can be done in two ways. Data can be sent to the Stockholm university department where data will
be superimposed by them or the users need to install the geoserver software (open source) and run
it on his/her own computer. After the successful installation of the geoserver data need to be
imported into it. Users are able to run the web map application on their own server by adding their
data to the map object.
Problems during project:
During the project the biggest problem that has faced is with Geoserver. The problem was related to
extensive loading times for map layers on the page. The performance of the geoserver was compared
with the existing geoserver on the other department in the university. After many tries the problem
was detected to be data itself. A new set of data layers was produced and imported to geoserver and
test the performance and after that it works fine. Another problem we have noticed is with Java
Runtime Environment (JRE). In the project latest version of JRE was used version JRE 7 that created
problems by giving high load on the server and degrades the performance of geoserver. To solve this
problem JRE 6 version instead is used which works fine. Finally the whole project feels like very
challenging as it related to IT technologies which makes little difficult to understand the tools and
work on them.
Future work:
In the current web map application it is not possible to see the details of the data that are displayed
on the map. It will be much better if the user can select any data on the map that display its attribute
information. It will be more advanced application if there is possible to add data directly on the
application instead of installing another geoserver or sending data to Stockholm university
department.
Acknowledgement
Firstly I would like to thank my supervisor, Goran Alm Senior lecturer at Stockholm University for his
guidance during the project. I would also like to specially thank as a co-supervisor Stefan Ene, GISdeveloper and teacher Stockholm University for his guidance to figure out technique problems. I
want to thank Rolf Jacobson, Webmaster at Stockholm University who shares his valluble thoughts to
develop the results of the thesis. I want to thank my examinor Peter Schlyter, Senior Lecturer at
Stockholm University for giving shape to my views. Finally I am expressing my heartiest gratitude to
all of them.
References
Carver, S., Evans, A., Kingston, R., & Turton, I. (2005). Virtual Slaithwaite: A Web Based Public
Participation 'Planning for Real'® System. Retrieved 06 24, 2013, from School of Geography:
http://www.geog.leeds.ac.uk/papers/99-8/#1
Directions Staff. (den 29 October 2009). GIS Web Mapping Enables Self Service - and Savings.
EPSG. (2012). Geomatics Guidance Note number 7, part 1. OGP Publication.
Geoserver. (u.d.). Geoserver User Manual. Hämtat från http://docs.geoserver.org/latest/en/user/
den 24 06 2013
Hazzard, E. (2011). OpenLayers 2.10 .
Hazzard, P. (2002). Web Map Service Implementation Specification. Hämtat från
http://portal.opengeospatial.org/files/?artifact_id=1081&version=1&format=pdf den 24 06
2013
Majid, Haron, H. W., & Rafee, M. (2007). The Use of Web GIS Among Local Authorities:A Survey of
the Contents and Level of Services. Kuala Lumpur: Dept. of Urban and Regional
PlanningUniversiti Teknologi Malaysia.
MapQuest. (2007). MapQuet. Hämtat från http://www.mapquest.com/ den 24 06 2013
Mitchell, T. (2005). Web Mapping Illustrated. Sebastopol, CA, USA: Oreilly & Associates Inc.
Montagna. (2005). A Framework for the Assessment and Analysis of Electronic Governament
Proposals. Electronic Commerce Researh and Appliactions, 4(3), 204-219.
Nivala, A. M., Brewster, S., & L, T. (2008). Usability Evaluation of Web Mapping Sites. The
Cartographic Journal, 129-138.
Open Geospatial Consortium. (n.d.). Retrieved 06 24, 2013, from About OGC:
http://www.opengeospatial.org/ogc
Peterson, M. P. (n.d.). Webmapping at the start of the new millennium - state of art. 3-17.
Ramsey, P. (u.d.). Mashing up the Enterprise. Hämtat från http://www.refractions.net:
http://www.refractions.net/expertise/whitepapers/mashups/mashups/ den 24 06 2013
Risberg, J., Alm, G., & Goslar, T. (2005). Variable Isostatic Uplift Paterns During the Holoene in
Southeast Sweden, Based on High-Resolution AMS Radiocarbon Dating of Lake Isotopes. The
Holocene, 847-857.
Schütze, E. (2007). Current state of technology and potential of Smart Map Browsing in web browsers
using the example of the Free web mapping application OpenLayers.
Schütze, E. (2007). Thesis - Smart Map rowsing. Hämtat från
http://www.smartmapbrowsing.org/html/index_en_9.html#webmapping_tiling den 24 06
2013
Schütze, E. (2007). Web Mapping. Hämtat från Smart Map Browsing:
http://www.smartmapbrowsing.org/html/index_en_9.html#id7 den 27 06 2013
W3Schools. (u.d.). CSS Tutorial. Hämtat från W3Schools: http://www.w3schools.com/css/default.asp
den 24 06 2013
W3Schools. (u.d.). HTML Tutorial. Hämtat från W3Schools:
http://www.w3schools.com/html/default.asp den 24 06 2013
W3Schools. (u.d.). JQuery Tutorial. Hämtat från W3Schools:
http://www.w3schools.com/jquery/default.asp den 24 06 2013
Appendix 1-Geoserver Instructions:
Note: Before installing the geoserver you have to install JRE on the server the reason for this is
geoserver runs on the Java Runtime Environment (JRE). Without this geoserver will not work.
Geoserver can be installed on a physical server or as a virtual server. Geoserver is used to store
layers on the server in order to make them available on the internet. Here are instructions for
installing geoserver on a standalone machine.
1. Download the geoserver application from their website (www.geoserver.org). You need to
select the latest version which will usually be on the top of the list.
2. After downloading, follow the instructions for installation.
3. During the installation you need to select the type of installation as “Install as service” which
makes it run on the server.
4. Geoserver runs default on port 8080. It is possible to change the port according to the user
requirement. It is important to know that two geoserver applications cannot run on the same
port, they must run on different ports.
5. Default credentials for geoserver are “admin” and “geoserver”. It is highly recommended to
change the password for the reason to avoid others to login and change or delete the data.
6. After successful installation, geoserver is ready to use.
Web administration interface:
This is the place where you will do the entire configuration for geoserver including importing data,
editing layers, delete layers etc. This web administration can be accessed via a web page which is by
default “localhost: <port>/geoserver/web”. The port number can vary according to the user need.
You need to login with the credentials to access the administration page. After successful login to the
page you will see different sections on the left side of the page which will be briefly described below.
Server:
In this section there will find information about the configuration tools for geoserver, contact
information for the public in a WMS capability document and importantly this section will use for
debug the server problems.
Data:
Here you have the possibility to add data to the server. First you need to create a work space to store
the data. In case of large data it will be very useful to have a separate workspace for different data. In
geoserver there is a possibility to store three different types of Geo data, vector, raster and WMS.
There is also a possibility to connect PostGIS database to geoserver. In this project we will be
discussing extensively about vector and raster type data and more specifically in vector type our
focus will be importing shape files. There is a specific procedure to import data into the geoserver
which will be described below.
1. You need to create a workspace for your data. Give it a suitable name which should make
sense. It is recommended to separate the data by storing them in separate workspace to
avoid confusion in the longtime.
2. Data will be imported into geoserver by creating a store. A store can be a vector, raster or
WMS.
3. After adding the data it is possible to preview the data on a map using the “Layer preview”
option. To do that go to layer preview on the list of the lawyers find your layer and press on
OpenLayers to see it on the map or you can download KML format of the data to view it on
Google Earth.
Layer group:
This is a very useful feature that can help to combine different layers in the geoserver. Here you can
create a single layer by selecting multiple layers that already exist in the geoserver. The important
thing to know is that you can only combine different layers that are in the same workspace. It is not
possible to combine layers in different workspaces.
Services:
Data presentation in geoserver can be served to the web in three different types WCS, WFS and
WMS. Web coverage service (WCS) is the data type that provides available information in a specific
format that can be used in the scientific modeling. Web feature service (WFS) is a service that
renders data including feature geometry and its attributes. This type of data supports data query on
the web. This WFS service is available for vector data. Finally and most common data service that are
widely used is a web map service (WMS) which provides the data in map tiles. This service is typically
for raster data.
Tile catching:
As we discuss above geoserver provides raster data in the form of map tiles. When the user interact
with zooming or panning around the map server needs to generate the tiles. In case of large raster
data, the server takes a long time to render image into the web page which makes the user
inconvenient, to reduce this rendering time it is possible to catch the map tiles and store in geoserver
before the user interact with the map. By doing this server does not have to generate tiles instead it
will use the already generated tiles that are stored in “Tiles Layer” section.
Map projections:
It is possible to use different projections for different countries. This feature will help the user to
display his data on specific projection. It is possible to create EPSG projections and use that
projection when tiling the layer.