1
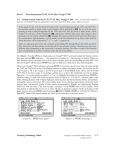
12 Graphing Technology Guide: TI-92 The TI-92 can graph piecewise-defined functions by using the “when” function. The “when” function is not on any of the keys but can be found in the CATALOG or typed from the keyboard. The format of the when( function is when(condition, trueResult, falseResult, unknownResult) where the falseResult and unknownResult are optional arguments. x 2 + 2, x < 0 , you want to graph x2 + 2 when the condition x < 0 is true For example, to graph the function f (x) = x − 1, x ≥ 0 and graph x – 1 when the condition is false. First, clear any existing functions in the Y= screen. Then move to the y1 line and press W H E N (X 2nd < 0, X ∧ 2 + 1 , X – 1) ENTER (Figure 5.28). Then press GRAPH to display the graph. Figure 5.29 shows this graph in a viewing rectangle from –5 to 5 in both directions. This was done in Dot style, since the TI-92 will (incorrectly) connect the two sides of the graph at x = 0 if the function is graphed in Line style. Figure 5.28: Piecewise-defined function Figure 5.29: Piecewise-defined graph Other test functions, such as ≤, ≥ and ≠ as well as logic operators can be found on the Test sub-menu of the 2nd MATH menu. 5.2.4 Graphing a Circle: Here is a useful technique for graphs that are not functions but can be “split” into a top part and a bottom part, or into multiple parts. Suppose you wish to graph the circle of radius 6 whose equation is x2 + y2 = 36. First solve for y and get an equation for the top semicircle, y = 36 − x 2 , and for the bottom semicircle, y = − 36 − x 2 . Then graph the two semicircles simultaneously. Use the following keystrokes to draw this circle’s graph. First clear any existing functions on the Y= screen. Enter 36 – X ∧ 2) ENTER (-) 2nd 36 − x 2 as y1 and − 36 − x 2 as y2 (see Figure 5.30) by pressing 2nd – X ∧ 2) ENTER. Then press GRAPH to draw them both (Figure 5.31). Figure 5.30: Two semicircles 36 Figure 5.31: Circle’s graph – standard WINDOW Instead of entering − 36 − x 2 as y2, you could have entered –y1 as y2 and saved some keystrokes. On the TI-92, try this by going into the Y= screen and pressing Ï to move the cursor up to y2. Then press CLEAR (-) Y 1 (X) ENTER (Figure 5.32). The graph should be as before. Copyright © Houghton Mifflin Company. All rights reserved.