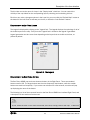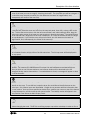
1
San Bruno
Hydrologic Data Management
System
Users’ Manual
Water Resources & Information
Management Engineering, Inc.
April 2007
Water Resources & Information
Management Engineering, Inc.
1451 River Park Drive, Suite 142, Sacramento, CA 95815
Phone: 916-564-2236 Fax: 916-564-1639
E-mail: [email protected]
www.wrime.com
SAN BRUNO
HYDROLOGIC
DATA MANAGEMENT SYSTEM
(HDMS)
USERS’ MANUAL
Prepared by
April 2007
San Bruno HDMS Users’ Manual
TABLE OF CONTENTS
TABLE OF CONTENTS ................................................................................................................................. i
List of Figures ......................................................................................................................................... i
SECTION 1 INTRODUCTION................................................................................................................... 1-1
1.1 Objective of the Users’ Manual...................................................................................................1-1
1.2 Contact Information.....................................................................................................................1-2
SECTION 2 LOGGING IN AND TROUBLESHOOTING .............................................................................. 2-1
2.1 Logging in to the HDMS System..................................................................................................2-1
2.2 Troubleshooting ...........................................................................................................................2-1
SECTION 3 DESCRIPTION OF THE USER INTERFACE ........................................................................... 3-1
3.1 Description of Graphical User Interface (GUI)............................................................................3-1
SECTION 4 NAVIGATION THROUGH THE HDMS SYSTEM..................................................................... 4-1
4.1 How to Use the Groundwater Data .............................................................................................4-1
4.2 How to Use the Groundwater Level Contours ............................................................................4-2
4.3 How to Use the Hydrology Data...................................................................................................4-2
4.4 How to Use the Modflow Model Data .........................................................................................4-3
4.5 How to Use the State and Federal Databases...........................................................................4-4
4.6 How to Use the Base Map ...........................................................................................................4-5
4.7 How to Use the Water Districts ...................................................................................................4-5
4.8 How to Use the Images................................................................................................................4-6
4.9 How to Use Data in the Query Results Panel Below the Main Display Panel ..........................4-7
4.10 How to Use the Buffer Tool .................................................................................................... 4-11
4.11 How to Print ............................................................................................................................ 4-12
LIST OF FIGURES
Figure 2-1. Sign-In Screen.................................................................................................................2-1
Figure 3-1. Graphical User Interface Screen ...................................................................................3-1
Figure 3-2. Layer List Showing Three Selection Boxes/Buttons Beside the Name of Each
Member of the Group.........................................................................................................................3-3
I
San Bruno HDMS Users’ Manual
Table of Contents
Figure 3-3. The Legend .....................................................................................................................3-4
Figure 4-1. “Groundwater Data” Layer List, Legend, and “Water Quality” Graphical Display ......4-1
Figure 4-2. “Groundwater Level Contours” Layer List and GIS Map Displaying the
Contours for “Water Level 10 2001” ................................................................................................4-2
Figure 4-3. Hydrology Data Layer List ..............................................................................................4-3
Figure 4-4. Modflow Model Layer List and GIS Map Showing the Grid for “Model Grid”..............4-3
Figure 4-5. “State/Federal Databases” Layer List, GIS Map Indicating the Locations of
“USGS Stream Flow” Data, and a Browser Window Displaying Data in Graphical Format............4-4
Figure 4-6. Base Map Layer List and Legend ..................................................................................4-5
Figure 4-7. “Water Districts” Layer List and GIS Map Showing the Private Water Districts
in Blue .................................................................................................................................................4-6
Figure 4-8. Images Layer List............................................................................................................4-6
Figure 4-9. “Groundwater Data” Layer List with “Water Quality” Selected as the Active
Layer and the GIS Map Displaying the Use of the “Select by Rectangle” Active Tool....................4-7
Figure 4-10. “Water Quality” Data Displayed as Text in the Query Results Panel Below the
Main Display Panel.............................................................................................................................4-8
Figure 4-11. Browser Window Displaying the “Water Quality” Data From a Particular Well ........4-8
Figure 4-12. Text Box in the Query Results Panel Showing the “Precipitation” Data ...................4-9
Figure 4-13. Browser Window Showing the “Precipitation” Data at a Particular Location...........4-9
Figure 4-14. Browser Window Displaying the “Precipitation” Data as Text................................ 4-10
Figure 4-15. “Query” Tool Shown in Query Results Panel Below the Main Display Panel ......... 4-10
Figure 4-16. “Query” Tool Showing Search Options Selected ..................................................... 4-11
Figure 4-17. Results of “Query” Tool Displayed as Text in the Query Results Panel ................. 4-11
Figure 4-18. “Buffer” Tool Shown in Adjustable Display Area ..................................................... 4-12
Figure 4-19. GIS Map Displaying the Results of the “Buffer” Tool.............................................. 4-12
ii
San Bruno HDMS Users’ Manual
SECTION 1
INTRODUCTION
The San Bruno Hydrologic Data Management System (HDMS) was developed to streamline data
compilation and dissemination, provide more powerful analysis tools, and facilitate data extraction in
a format that can be integrated into the groundwater model and linked with a geographic information
system (GIS).
The HDMS is a password-protected, GIS-based web application and is menu-driven for ease of use.
It integrates familiar tools such as Microsoft (MS) Excel and MS Access in a GIS environment, so that
a user can extract the data from the database and send it to Excel to create a pre-formatted graph by
the push of a single button.
The San Bruno HDMS incorporates the readily available digital data at the time of development of
the HDMS. These data include:
Water level, water quality, and precipitation data from the San Mateo County
database;
Pumping rates from the City of San Bruno; and
Well construction, boring logs, e-logs, water level, and water quality data from the
monitoring wells installed as part of this project.
Additionally, stakeholders were involved in the development of the HDMS through informational
updates during meetings held to discuss other basin-wide issues. It was originally intended that the
HDMS would be provided to San Mateo County’s Environmental Health Division as a replacement for
its current system of spreadsheet files. However, since the grant application was submitted, San
Mateo County Environmental Health no longer functions as the monitoring lead for the groundwater
basin. The San Francisco Public Utilities Commission (SFPUC) has taken up this role. It is hoped
that SFPUC will incorporate the HDMS into their ongoing annual groundwater monitoring reports.
1.1 OBJECTIVE OF THE USERS’ MANUAL
The objective of the Users’ Manual for the San Bruno Hydrologic Data Management System is to
provide San Bruno staff with the necessary information to understand the basic operations and
navigations of the software. This manual focuses on explaining how to use the San Bruno HDMS in
order to access relevant data.
The User Manual provides instructions on the following main tasks:
Login and Troubleshooting;
Familiarization of the user with the Graphical User Interface (GUI); and
Navigation through the HDMS system.
1-1
San Bruno HDMS Users’ Manual
Introduction
1.2 CONTACT INFORMATION
Please contact the following person if you have any question on the use of the HDMS.
Jim Blanke
Senior Hydrogeologist
WRIME, Inc.
1451 River Park Drive, Suite 142
Sacramento, CA 95815
(916) 564-2236
Email: [email protected]
1-2
San Bruno HDMS Users’ Manual
SECTION 2
LOGGING IN AND TROUBLESHOOTING
2.1 LOGGING IN TO THE HDMS SYSTEM
Step 1: Open Internet Explorer. Other browsers are not supported.
Step 2: Type the following address in the Internet Explorer address bar:
http://gis.wrime.com/iwris/sanbruno
You will see the following screen:
Figure 2-1. Sign-In Screen
Step 3: Enter your Username and Password and then click the “Sign in” button.
You will see a “Disclaimer Notice”; please read the notice and click “OK” to acknowledge the notice.
Once you are successfully logged in, the Graphical User Interface (GUI) screen will appear. The GUI is
discussed in the next section.
2.2 TROUBLESHOOTING
There are a few typical problems encountered with the HDMS. Please review the following to
attempt to resolve any problems.
Make sure you are using Internet Explorer.
Allow popups – that is, make sure your popup blocker is turned off.
Close all HDMS windows and log on again.
Be patient after you make a click, especially when you click on the “Refresh Map”
button.
2-1
San Bruno HDMS Users’ Manual
SECTION 3
DESCRIPTION OF THE USER INTERFACE
3.1 DESCRIPTION OF GRAPHICAL USER INTERFACE (GUI)
The San Bruno HDMS GUI is described in this section.
Left Panel
Title Bar
Left Bottom Box
Main
Display
Panel
Right Panel
Query Results Panel
Figure 3-1. Graphical User Interface Screen
3-1
San Bruno HDMS Users’ Manual
Description of the User Interface
EXPLANATION OF THE USER INTERFACE
The San Bruno HDMS map interface is divided into six parts:
Part 1: The top bar is the Title Bar. This also includes the link to the Help page which
contains a PDF version of this manual.
Part 2: The Left Panel shows the available GIS layers, the legend, and the “Refresh Map”
action button.
Part 3: The Right Panel provides access to different GIS and database tools.
Part 4: The Main Display Panel (at the center of the screen) displays the GIS map.
Part 5: The Query Results Panel below the Main Display Panel is where results of queries are
displayed in text format.
Part 6: The Left Bottom Box lists the Active Tool and Active Layer.
EXPLANATION OF THE LEFT PANEL TABS
The Left Panel has two tabs on the top. The two tabs (“Layers” and “Legend”) toggle with each other;
that is, the display on the Left Panel changes based on the selected tab.
The “Layers” tab displays the GIS layers that are available on the San Bruno HDMS.
The “Legend” tab dynamically builds a legend for the map that is displayed.
The button on the lower portion of the Left Panel is the “Refresh Map” button. Click this button to
refresh the map every time you make changes on the Layer list, or check the “Auto Refresh” box to
refresh the map after every layer change. Please be patient with this – do not make many fast clicks
as that may hang the system. Let the results of a previous request be completed before you make
another request. Please note that this application calls upon a great deal of data and it takes time
to load these data.
EXPLANATION OF THE LEFT PANEL LAYER LIST
Once you select the “Layers” tab, the list of available GIS layers in the San Bruno HDMS is displayed
on the Left Panel. The Layer list is used to control which layers are visible on the map, and which
layer is the “Active” layer for the San Bruno HDMS map tools, such as “Hyperlink”, “Identify”, and
“Select”, on the Right Panel.
The Layer list is grouped by categories; within each group there are one or more map layers. Groups
may be expanded/collapsed by clicking the book stack icon beside the group name. The Layer list
3-2
San Bruno HDMS Users’ Manual
Description of the User Interface
contains: Groundwater Data, Groundwater Level Contours, Hydrology Data, Modflow Model Data,
State/Federal Databases, Base Map, Water Districts, and Images.
Once a category has been chosen, there are three selection boxes/buttons beside the name of each
layer.
Figure 3-2. Layer List Showing Three Selection Boxes/Buttons
Beside the Name of Each Member of the Group
The first check box is used to control the visibility of the map features in a layer and is referred to as
the “Visibility” box in this manual. If you check the box, the corresponding map features will be
visible on the Main Display Panel. If you uncheck the box, the features of the layer will be removed
from the map. Make sure you click the “Refresh Map” button after checking or unchecking the
“Visibility” box, or utilize the “Auto Refresh” feature.
Next is a radio button, which is used to control the “Active/Inactive” status of a map layer. An
“Active” map layer is a layer on which all queries are executed, such as “Hyperlink”, “Identify”, and
“Select”. Therefore, in order to utilize the “Hyperlink” function and other query functions, you must
make the corresponding layer “Active”. At any time, only one GIS map layer can be “Active”. To
make a layer the “Active” layer, simply click the radio button next to the layer name. Once you make
a selection of the Active Layer, the layer name will be highlighted. The current Active Layer is always
listed in the Left Bottom Box of the San Bruno HDMS interface. The name of the active map tool
(Active Tool) is also displayed there.
3-3
San Bruno HDMS Users’ Manual
Description of the User Interface
The third box next to the name of a layer is the “Display Label” check box. You can control the
visibility of the map labels for the corresponding layer by checking and unchecking this box.
Each time you make a change anywhere in the Layer list, you must click the “Refresh Map” button on
the bottom of the Left Panel to activate your choice, or utilize the “Auto Refresh” feature.
EXPLANATION OF THE LEFT PANEL LEGEND
The Legend is displayed by clicking on the "Legend" tab. The Legend displays the symbology for all of
the visible layers on the map. Every time the "Legend" tab is clicked a new legend is generated.
Legend generation can take some time depending on the layers that are visible at the time, so
please be patient.
Figure 3-3. The Legend
EXPLANATION OF THE RIGHT PANEL BUTTONS
The San Bruno HDMS map tools are shown as buttons in the Right Panel. These are standard
buttons used in GIS. The larger buttons are the more frequently used buttons, while the smaller
buttons are used less frequently. If you mouse over a button for a few seconds, a text box will pop
up displaying the name of the button.
The following is a list of the map tools found on the San Bruno HDMS User interface Right Panel, and
a description of how each one can be used.
The magnifying glass with the plus sign is used to zoom in on a specific point on the map. To use
the tool, select the zoom in icon from the tool bar, then click, or drag a box on the map. To draw the
3-4
San Bruno HDMS Users’ Manual
Description of the User Interface
zoom-in box, click the left mouse button, and, while holding it down, drag the cursor to the other
corner of the area you want to magnify, releasing the button. The specified area will be enlarged. If
you click the map, the point on which you click becomes the center of magnification, and,
subsequently, the center of the new map.
The magnifying glass with the minus sign is used to zoom out from the map to view a larger area.
To use the tool, select the zoom out icon from the map tool panel, then click, or drag a box on the
map. To draw the zoom-out box, click the left mouse button, and, while holding it down, drag the
cursor to the other corner of the area you want to reduce, releasing the button. The specified area
will be reduced and a larger area of the map is displayed. As a rule, the smaller the box, the larger
the area displayed. If you click the map, the point on which you click becomes the center of
magnification, and, subsequently, the center of the new map.
The full extent tool allows you to quickly zoom out to the map's maximum extent (full view). To use
the full extent function, simply click on the full extent icon. The full map area will be displayed in
the map panel.
The lighting bolt is the Hyperlink tool. This tool allows you to query features on the map for URLs to
websites. For instance, the USGS Stream Flow layer has web addresses associated with them.
When you click on one of these stations a new browser window will be launched to the US
Geological Society station data website. If no web address is found, a message will appear to alert
you of the situation.
The stylized "i" icon is the Identify tool. This tool allows you to retrieve attribute information about
features on the map. To use this tool, make the layer you would like to identify features on the
active layer. Only feature layers are identifiable - images do not possess attribute information that
you can retrieve. Once you have specified an Active Layer, position your cursor on top of the feature
you are interested in, and click with the left mouse button. The identify results will appear in the
Query Results Panel below the Main Display Panel.
The hand is the pan tool. Panning is a useful function that allows you to move around the map
without changing the scale. Think of it as shifting a paper map across a desktop in order to view a
3-5
San Bruno HDMS Users’ Manual
Description of the User Interface
different portion of it. To use the pan tool, select the pan icon from the tool bar, then click and hold
down the left mouse button. Drag the map in the direction you want to pan, releasing the mouse
button when you are done.
Click this button to view the overview map.
The query button selects features from the Active Layer based on a more complex attribute query.
The selected features will be highlighted in the map and their attributes will appear in the bottom
frame of the browser.
Selects features from the Active Layer based on a keyword or string search. Search is not casesensitive. The selected features will be highlighted in the map and their attributes will appear in the
bottom frame of the browser.
Measures distance on the map. Use the mouse to draw a line or polygon defining the distance or
area you want to measure.
This button allows you to set units for the distance measured by using the button described above.
The button allows you to set a buffer zone, based on distance around a selected feature. The
buffer zone will be shown on the map as a highlighted area.
This is the rectangle selection tool. You can select this button and draw a rectangle on the map
area. The features of the Active Layer within the rectangle will be highlighted and their attributes
will appear in the Query Results Panel below the Main Display Panel of the user interface.
This is also a selection tool as above; but it allows the user to draw a polygon by clicking on points
and closing the polygon. The features of the active layer within the polygon will be highlighted and
their attributes will appear in the Query Results Panel below the Main Display Panel of the user
interface.
3-6
San Bruno HDMS Users’ Manual
Description of the User Interface
Erases the selections made on the map.
Prepares the map view area to be sent to the printer.
The button performs a search for a place or feature name by searching the GNIS database. This
database contains location references to all text that appears on all USGS quad maps.
Find a location on the map using coordinates in UTM formats.
3-7
San Bruno HDMS Users’ Manual
SECTION 4
NAVIGATION THROUGH THE HDMS SYSTEM
4.1 HOW TO USE THE GROUNDWATER DATA
Open the “Groundwater Data” category from the Layer list, then choose the layer that you would like
to make active and/or visible.
For example, you may check the “Visibility” box (the first box) for the “Water Quality” layer to view
locations on the GIS map of that feature. Then click the “Refresh Map” button, or check the “Auto
Refresh” box in the lower Left Panel. To view the map Legend, click on the “Legend” tab on the Left
Panel. Although you may choose to view multiple layers on the map, only one layer can be the Active
Layer. This layer is chosen by selecting the radio button, which highlights the selection.
You may now query a particular feature, defined by a point on the map, within the Active Layer of
data. For example, select the “Hyperlink” tool on the Right Panel and then click on a particular point
on the map representing a well location. The result of this query is displayed in a graphical format in
a new browser window.
Figure 4-1. “Groundwater Data” Layer List, Legend,
and “Water Quality” Graphical Display
4-1
San Bruno HDMS Users’ Manual
Navigation through the HDMS System
4.2 HOW TO USE THE GROUNDWATER LEVEL CONTOURS
Open the “Groundwater Level Contours” category from the Layer list and choose the layer that you
would like to make active and/or visible.
For example, you may choose to make the Water Level of 10/2001 to be both the Active Layer and
visible on the map by checking the first box and selecting the second button next to the “Water Level
10 2001” layer. Click the “Refresh Map” button. The chosen layer is then displayed on the map
with contour lines, which are labeled with their numerical value.
Figure 4-2. “Groundwater Level Contours” Layer List and GIS Map
Displaying the Contours for “Water Level 10 2001”
4.3 HOW TO USE THE HYDROLOGY DATA
Open the “Hydrology Data” category from the Layer list.
The “Precipitation” layer may be selected. By checking the “Visibility” box and selecting the Active
Layer, you will be able to view and query points on the GIS map that contain precipitation data.
4-2
San Bruno HDMS Users’ Manual
Navigation through the HDMS System
Figure 4-3. Hydrology Data Layer List
4.4 HOW TO USE THE MODFLOW MODEL DATA
Open the “Modflow Model” category from the Layer list. In this group, the “Model Grid” and the
“Water Use Budget Zone” layers are available.
Select one of the layers as the Active Layer and check the “Visibility” box to display a grid on the GIS
map. Click the “Refresh Map” button if the “Auto Refresh” box is not checked.
For example, select the “Model Grid” layer as the Active Layer and check the “Visibility” box to view
the grid as an overlay on the map. Be patient as this feature may take some time to load.
Figure 4-4. Modflow Model Layer List and GIS Map
Showing the Grid for “Model Grid”
4-3
San Bruno HDMS Users’ Manual
Navigation through the HDMS System
4.5 HOW TO USE THE STATE AND FEDERAL DATABASES
Open the “State/Federal Databases” category from the Layer list.
Select one of the databases from the category list as the Active Layer and/or select the “Visibility”
box to display the locations on the GIS map as points. In order to display the name of these
locations, select the “Display Label” box (third box).
For example, select the “USGS Stream Flow” category from the Layer list and check all three
boxes/buttons. Click the “Refresh Map” button. The “USGS Stream Flow” category is now the Active
Layer and its locations are displayed as points on the GIS map. In addition, the labels of the features
are shown on the map next to their respective point. This data can now be queried. Select the
“Hyperlink” tool as the Active Tool. Click on one of the point features on the GIS map. A new
browser window will open. In this case, the “USGS Stream Flow” data for that location is displayed in
a graphical format in the new window.
Figure 4-5. “State/Federal Databases” Layer List, GIS Map Indicating
the Locations of “USGS Stream Flow” Data, and a Browser Window
Displaying Data in Graphical Format
4-4
San Bruno HDMS Users’ Manual
Navigation through the HDMS System
4.6 HOW TO USE THE BASE MAP
Open the “Base Map” category from the Layer list. This category of the Layer list modifies the GIS
display of various geologic regions and water bodies as well as highways, cities, and counties.
Checking or unchecking the “Visibility” box of these layers changes the display of the GIS map. The
selected features of the map are also displayed in the Legend by clicking on the “Legend” tab on the
Left Panel.
Figure 4-6. Base Map Layer List and Legend
4.7 HOW TO USE THE WATER DISTRICTS
Open the “Water Districts” category of the Layer list and select from either “Federal”, “State”, or
“Private” layers.
For example, choose the “Private” layer as the Active Layer and check the “Visibility” box and the
“Display Labels” box. Click the “Refresh Map” button. The private “Water Districts” are highlighted
on the GIS map and labeled accordingly. Queries may be made on this layer by selecting a tool from
the Right Panel. Data about the districts is displayed in the Query Results Panel below the Main
Display Panel.
4-5
San Bruno HDMS Users’ Manual
Navigation through the HDMS System
Figure 4-7. “Water Districts” Layer List and GIS Map
Showing the Private Water Districts in Blue
4.8 HOW TO USE THE IMAGES
Open the “Images” category from the Layer list. This category changes the image of the GIS map.
For example, by unchecking the “Relief Map” box, the GIS map will become colorless.
Figure 4-8. Images Layer List
4-6
San Bruno HDMS Users’ Manual
Navigation through the HDMS System
4.9 HOW TO USE DATA IN THE QUERY RESULTS PANEL BELOW THE MAIN DISPLAY
PANEL
The Query Results Panel below the Main Display Panel is used to display data in a text format
generated by using an Active Tool selected from the Right Panel. The Active Tool chosen is displayed
in the lower Left Bottom Box along with the Active Layer.
Example 1 – Water Quality Data using the Select by Rectangle Tool. Select the “Groundwater Data”
category from the Layer list. Choose “Water Quality” as the Active Layer. Select the “Select by
Rectangle” Active Tool from the small buttons on the Right Panel and choose an area on the GIS
map by clicking on the map and moving your mouse to create a rectangle outlined on the map. Once
you have done this, the “Water Quality” wells selected as your Active Layer are displayed as points
within the area you have selected with the tool.
Figure 4-9. “Groundwater Data” Layer List with “Water Quality” Selected
as the Active Layer and the GIS Map Displaying the Use
of the “Select by Rectangle” Active Tool
A list of the selected wells is displayed in text format in the Query Results Panel below the Main
Display Panel. The selected wells are identified with various data labels, including ID number, well
name, and x-y coordinates.
4-7
San Bruno HDMS Users’ Manual
Navigation through the HDMS System
Figure 4-10. “Water Quality” Data Displayed as Text
in the Query Results Panel Below the Main Display Panel
The data for each well may be accessed by clicking on one of the highlighted “ID’s” on the left side of
the text box. When a well is selected, a new browser window will open on your computer screen.
This window displays the collected data for the chosen well in a graphical format as shown below.
The graph is labeled with the name of the well and the units of measurement. A “drop-down” menu
is displayed at the top of the graph and different data may be selected by moving your mouse to this
position and clicking on the blue arrow. The data may also be viewed in a text format by clicking on
the “Text Delimited Format” link at the bottom of the graph. A new browser window will open to
display the data in text format.
Figure 4-11. Browser Window Displaying the “Water Quality” Data
From a Particular Well
4-8
San Bruno HDMS Users’ Manual
Navigation through the HDMS System
Example 2 – Precipitation Data using the Identify Tool. Select the “Hydrology Data” category from
the Layer list. Choose “Precipitation” as the Active Layer and check the “Visibility” box to display the
features on the GIS map. Select the “Identify” Active Tool by clicking on the large button labeled
“Identify” on the Right Panel. You may now click on one of the points displayed on the map. A text
box will appear in the Query Results Panel below the Main Display Panel.
The text box contains the ID of the data point, along with the name of the location, and the
coordinates of the location.
Figure 4-12. Text Box in the Query Results Panel Showing the “Precipitation” Data
The “Precipitation” data at this location may be viewed by clicking the “ID” (in this case “DC”). Once
you have clicked on this ID, a new browser window will appear on your computer screen. This
window displays the “Precipitation” data according to date for the chosen location.
Figure 4-13. Browser Window Showing the “Precipitation” Data
at a Particular Location
4-9
San Bruno HDMS Users’ Manual
Navigation through the HDMS System
This data may also be viewed in a text format by clicking on the “Text Delimited Format” link below
the graph. Clicking on this link opens a new window labeled with the location and displaying the
data in a text format.
Figure 4-14. Browser Window Displaying the “Precipitation” Data as Text
Example 3 – Production Well Data using the Query Tool. Select the “Groundwater Data” category
from the Layer list. Choose “Production Wells” as the Active Layer. Select the “Query” Active Tool
from the small buttons on the Right Panel. The “Query” selection guide will display in the Query
Results Panel below the Main Display Panel. A particular data point within the Active Layer of
“Production Wells” may be found using the “Query” selection guide. The selection guide is
characterized by a number of drop-down menu items, which are discussed below.
Figure 4-15. “Query” Tool Shown in Query Results Panel
Below the Main Display Panel
The “Field” menu selects the identifying value for which you are searching (coordinates, name, ID,
etc.).
4-10
San Bruno HDMS Users’ Manual
Navigation through the HDMS System
The “Operator” menu selects the operator by which the value searches.
The “Value” text box is where the value you are searching for is entered.
The “Get Samples” button can display possible choices after you have chosen a Field value.
Once you have chosen a “Field”, “Operator”, and “Value”, click the “Add to Query String” button and
the box will display the text indicated by your search.
Click on the “Execute”, “Undo”, or “Clear” buttons to execute, end, or change a search.
You may also use the buttons on the right side to aid in your search.
For example, search for the “Production Wells” data for well with well name “SB 12”. First, select
“WELLNAME” from the “Field” menu. Select “=” in the “Operator” box. Enter “SB 12” in the “Value”
box. Click on “Add to Query String”. Click the “Execute” button.
Figure 4-16. “Query” Tool Showing Search Options Selected
A text box will appear in place of the “Query” selection guide showing the “Production Well” of well
name “SB 12”. The data of this well may now be accessed as previously shown.
Figure 4-17. Results of “Query” Tool Displayed as Text in the Query Results Panel
4.10 HOW TO USE THE BUFFER TOOL
The “Buffer” tool may be used to display a secondary feature within a buffer zone based on a
distance around an initial feature.
For example, select “Groundwater Data” from the Layer list and choose “Water Quality” as the
Active Layer. Select an area using the “Select by Rectangle Tool” as the Active Tool to display
the wells within the chosen region. The wells are displayed as points on the GIS map. Now,
click on the “Buffer” button to select the “Buffer” tool as the Active Tool. Text will display in
the Query Results Panel below the Main Display Panel.
4-11
San Bruno HDMS Users’ Manual
Navigation through the HDMS System
Figure 4-18. “Buffer” Tool Shown in Adjustable Display Area
The first selection box in the “Buffer” tool is a drop down menu that chooses the features to
highlight. In this case, “Production Wells” has been chosen as the secondary feature to highlight.
The box to the right is a text box where the distance around the primary feature is input, in this case
“Water Quality” wells is the primary feature, and the distance from the primary feature is “5” miles.
Click the “Create Buffer” button. A buffer zone is created and displayed on the GIS map as a
highlighted area. Additionally, the “Production Wells” are displayed as points within the area.
Figure 4-19. GIS Map Displaying the Results of the “Buffer” Tool
4.11 HOW TO PRINT
To print the Main Display Panel, click on the small “Print” icon on the Right Panel. Text will display in
the Query Results Panel below the Main Display Panel. Click the “Create Print Page” button. A new
browser window opens with the “Map Image”, “Overview Map Image”, and “Legend” displayed. You
may then use the “File/Print” menu item to send the display to your printer.
4-12
San Bruno HDMS Users’ Manual