1
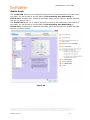
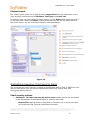
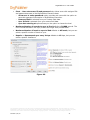
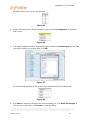
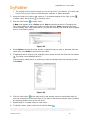
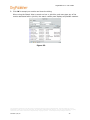
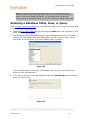
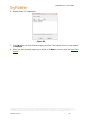
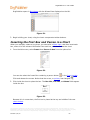
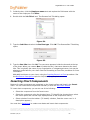
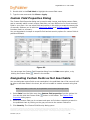
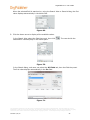
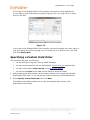
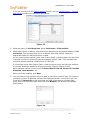
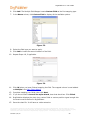
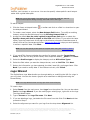
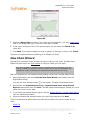
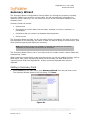
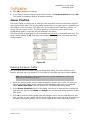
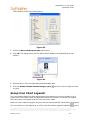
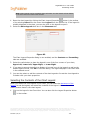
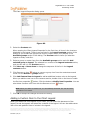
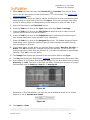
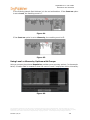
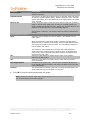
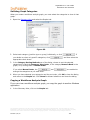
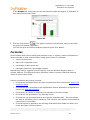
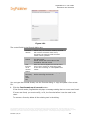
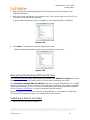
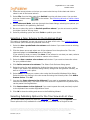
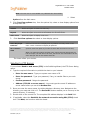
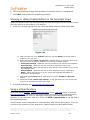
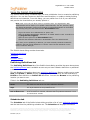
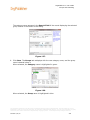
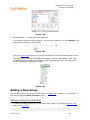
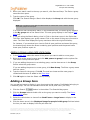
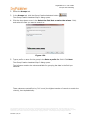
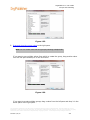
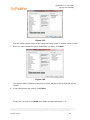
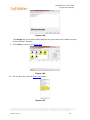
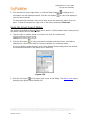
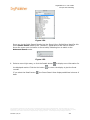
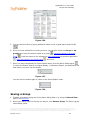
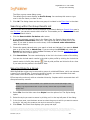
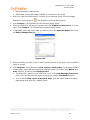
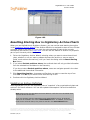
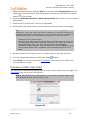
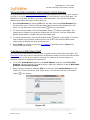
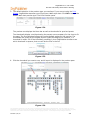
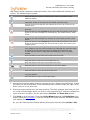
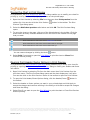
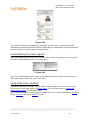
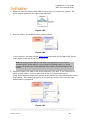
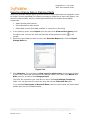
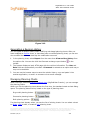
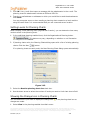
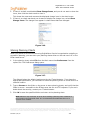
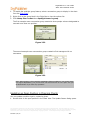
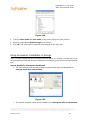
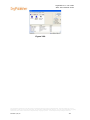
OrgPublisher 11 User Guide
Formatting Charts
or you can open the Chart Legend Properties dialog. The settings you select for the legend
are applied to the current style.
Note: Depending on where you place the legend, some boxes in the chart may be
covered. You may want to modify the legend settings to better fit the legend within a
blank area of the Chart View.
Formatting the Chart Legend
You can format the chart legend to better fit your chart scheme.
The legend default uses:
•
a 1 column list
•
a width of 200 pixels
•
a height that is automatically calculated to fit the number of items in the legend
To change the format of the chart legend:
1. Open the chart legend by clicking the Legend Properties button
in the toolbar or by
selecting Insert from the Main menu then Legend from the options list. If the legend is
already displayed in the chart, you can also click on the legend to open it. The Chart
Legend dialog opens at the Placement tab.
2. Select the Formatting tab. This tab provides options for outline style, color, gradient,
and dimensions, as well as a preview section.
3. In the Format section, select the Outline style you want to use by scrolling through
the available options and clicking on the one you want.
4. Accept the default to Show outline for the legend, or clear the check box if you do not
want to display the outline.
5. Select the Outline width using the up or down-arrow. The allowed range is between 1 5 pixels.
6. In the Use Custom Dimensions section, select the check box if you want to the legend
to be a different size. Using the up and down-arrows for each field, select the Box
width (range 40 - 999), Box height (range 40 - 999), Number of columns (1 - 20),
and Column wrap style.
7. In the Color section, use the pull-down options in each field to select the Background
color, Gradient color, Gradient style, Shadow color, and Outline color.
8. The Preview section to the right of the dialog provides a sample of what the legend
looks like as you make each change. When you get the format you want, click OK to
accept the changes and close the dialog.
Aligning the Chart Legend
When you enable the chart legend in your chart, you can select the placement of the
legend, format the legend, and select the contents of the legend. You can also add or
modify custom items in the chart legend.
The information contained in this document is confidential and proprietary to Peoplefluent®. This information may not be
distributed or used for any purpose other than the evaluation of Peoplefluent® solutions, nor may it be disclosed to any party
without the prior written consent from Peoplefluent®. Copyright © 2001 - 2013 Peoplefluent®. All Rights Reserved.
Revised 7/31/13
131