1
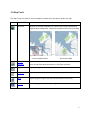
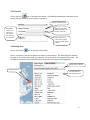
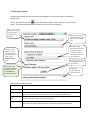
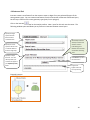
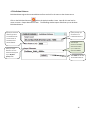
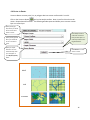
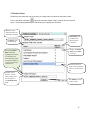
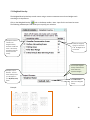
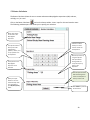
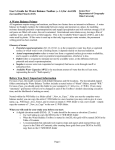
Geospatial Analysis Tool
User Manual
January 29, 2013
User Manual
Regional Environmental Assessment (REA) Toolkit
January 29, 2013
Author: Government of Canada, Environment Canada
National Wildlife Research Centre
Table of Contents
1.0 BREA Webmap ........................................................................................................................................ 3
2.0 Navigation Tools...................................................................................................................................... 4
3.0 Map Tools................................................................................................................................................ 5
3.1 Table of Contents ................................................................................................................................ 6
3.2 Measure tool ....................................................................................................................................... 7
3.3 Print tool ............................................................................................................................................. 9
3.4 Identify Tool ........................................................................................................................................ 9
4.0 Analysis Tools ........................................................................................................................................ 10
4.1 Buffer Vector ..................................................................................................................................... 11
4.2 Select by Attributes ........................................................................................................................... 12
4.3 Select by Location ............................................................................................................................. 13
4.4 Intersect Tool .................................................................................................................................... 14
4.5 Euclidean Distance ............................................................................................................................ 15
4.6 Vector to Raster ................................................................................................................................ 16
4.7 Reclass Raster ................................................................................................................................... 17
5.0 Raster Tools:.......................................................................................................................................... 18
5.1 Weighted Overlay ............................................................................................................................. 19
5.2 Raster Calculator ............................................................................................................................... 20
2
1.0 BREA Webmap
This web-based GIS tool-kit has been developed to include a variety of tools for the display and analysis
of existing and new information to support the Beaufort Regional Environmental Assessment. It
includes baseline information and research on a number of environmental factors including flora and
fauna, water, air and climatic factors, ice and geo-hazards as well as cultural, sociological and
infrastructure information.
To access the webmap, log on to the NWRC webpage and select the BREA map, under the Maps tab.
The following figure provides an overview of the portal layout.
Navigation Tools
Map Tools
Search Bar
Basemap selector
Data
Map Window
GIS data
layers
Data
loaded
in map
Map Scale
Current cursor action
Current User
3
2.0 Navigation Tools
The Navigation Tools are used for map navigation within the map window.
Icon
Name
Function
Zoom In
Zoom in by dragging a box on the map or by double clicking on the map.
Zoom Out
Zoom out by dragging a box on the map.
Pan
Pan the map by dragging the map.
Full Extent
Zoom to the full extent of the map. By default, this is the extent of the
BREA study area.
Back Extent
Go back to the previous extent of the map after navigating.
Next Extent
Go forward again through the sequence of extents you have been viewing
on the map.
4
3.0 Map Tools
The Map Tools are used for map navigation, data access and query within the map.
Icon
Name
Function
Overview
Displays an overview map when the spatial location of the detailed map
might be hard to determine. Displays in the bottom left corner of the map.
vs.
Overview Map Enabled
No Overview Map
Table of
Contents
Opens the table of contents. The table of contents lists all the layers on
the map and shows what the features in each layer represent.
Legend
Displays the legend for a map layer.
Measure
Measure distance, area and coordinates on the map.
Print
Export a graphic image of the map currently visible on the screen.
Identify
Identify a geographic feature by clicking on them.
5
3.1 Table of Contents
Click the Table of Contents
tool on the Map Tools toolbar.
The following window opens and allows you to view available layers and turn on (make visible)/turn off
layers. The table of contents also gives you access to tools you will need to work/process/manipulate
your data.
These are 3 ‘folders’
which contain different
types of data. Base Data
contains VEC, VSEC and
GE Potential data
viewable to all users.
Analysis Toolbar: Set of
tools for manipulating
GIS data.
Click VEC to view a
list of VEC layers.
Click VSEC to view a
list of VSEC layers.
An empty box means the
layer is turned off (or not
visible on the map).
A box with a checkmark
means the layer is turned
on (or visible on the
map).
Moves the position of a
layer up or down the list
in the table of contents.
Displays a list of GE
Potentials layers.
Transparency slider: The
slider in the left position
shows the layer as 100%
opaque and the slider in
the right position is 100%
transparent.
6
Public Data: Data shared
and viewable by all users.
Represents ‘Sensitivity
Layers’ and ‘Risk Layers’
in raster format.
Displays list of
sensitivity layers.
Move Layer to “My
Data”: Moves a public
layer to your “My Data”
folder for processing and
analysis.
Refresh: Click to refresh
the layer list if your
layer is not visible.
Click on Risk Layers to
view a list of risk layers.
My Data: Data the user is
creating/manipulating;
viewable only to only the
current user.
Click on Vector
Layers to view a list
of vector layers.
Refresh: Click to refresh
the layer list if your
layer is not visible.
Displays list of
Raster Layers.
Uploads Layer to
the current folder.
Move to Public: Move a raster
layer to the public folder.
Perform a Weighted
Overlay calculation.
Perform Raster
Calculator operations.
7
3.2 Measure tool
Click the Measure
tool on the Map Tools toolbar.
The following window opens and allows you to specify what you would like to measure.
1) Select the ‘Basic Measurement’ type, and ‘Units’.
2) Click the point of interest on the map where you want to start measuring the distance or area.
3) Move the pointer to the next point of interest and click to measure the distance or area. If you
want to continue measuring distances to other points or adding more vertices to your polygon,
simply move the pointer to another location and click to add additional vertices.
4) Double-click where you want to end the line or polygon.
The distance/area are displayed in the measurement window.
Select a Feature
to measure.
Measure a Line
Select the units you
would like to measure
in: meters, kilometers,
miles or feet.
Select which layer you
would like to measure
features from.
Measure a Polygon
The last measurement
performed is
displayed here.
Displays last distance
measurement.
Displays coordinates
(Degree Min Sec) for
the ‘Select a Feature’
option only.
Displays a list of past
measurements from
one polygon or line.
Length is displayed for
Lines, and Area and
Perimeter are displayed
for polygons.
Displays the total length
area or perimeter.
8
3.3 Print tool
Click on the Print
tool on the Map Tools toolbar. The following window opens and allows you to
specify what you would like to print (export to graphic).
Specify an output file name.
Select the file format:
PNG8, PDF, PNG32, JPG,
GIF, EPS, SVG, SVGZ.
Click Print to
export map. A
new tab will
open with the
map where you
can save to file.
Select a page layout:
Letter (8.5x11), Ledger
(11x17) and Letter (Large
Legend).
3.4 Identify Tool
Click on the Identify
tool on the Map Tools toolbar.
Click on a location in your map to identify the features at that location. The ‘Identify Results’ window
will appear. Choose the layer which you would like to show results for from the drop down menu. The
attributes are presented in the ‘Identify Results’ window and the feature will be highlighted.
Specify a layer to identify.
Highlighted feature.
List of attributes for
the identified feature.
9
4.0 Analysis Tools
The Analysis Tools are used to manipulate and process vector and raster data (found under Table of
Contents).
Icon
Name
Function
Buffer Vector
Creates buffer polygons around input features to a specified distance.
Select by
Attributes
Select By Attributes allows you to provide an SQL query expression that
is used to select features that match the selection criteria.
Select by Location
The Select By Location tool lets you select features based on their
location relative to features in another layer.
Intersect
Computes a geometric intersection of the input features. Features or
portions of features which overlap in both layers will be written to the
output feature class.
Euclidean
Distance
Calculates, for each cell, the Euclidean distance to the closest source.
Vector to Raster
Converts point, line, or polygon data into a raster surface (1 km cells)
Reclass Raster
The Reclass tool allows the user to reclassify or change input cell values
to alternative values.
10
4.1 Buffer Vector
You can create a buffer around selected points, lines, or area features. For instance, you might use
buffers to show an ecological zone around a waterway, or the area around a contaminated well. You
can buffer more than one feature at once, but a separate buffer will be created around each feature.
Click on the Buffer Vector
tool on the Analysis toolbar. The following window opens and allows
you to specify what you would like to buffer.
Specify the layer you
would like to buffer.
Note: The layer must
be turned on in the
Table of Contents to be
able to select it.
Dissolve output
buffers. Checked will
perform the dissolve.
(See below for more
info on dissolve.)
Specify an output
filename.
Specify the buffer
distance. Note: for
polygons only, a
negative number can
be used to buffer
within the polygon.
Click Submit to run
the Buffer tool. The
new buffer layer will
appear in your
My Data (vector)
folder.
This example buffer will export a new vector
layer with all wells buffered by 1000m.
Dissolving output buffers:
- This check box allows the user to specify if a dissolve should be performed to remove buffer overlap.
- NONE (Unchecked box): An individual buffer for each feature is maintained, regardless of overlap.
- ALL (Checked box): All buffers are dissolved together into a single feature, removing any overlap.
POINT
LINE
POLYGON
INPUT
OUTPUT
DISSOLVE
TYPE: NONE
OUTPUT
DISSOLVE
TYPE:
DISSOLVE
11
4.2 Select by Attributes
Select By Attributes allows you to provide an SQL query expression that is used to select features that
match the selection criteria and export those features to a new layer.
Click on the Select by Attributes
tool on the Analysis toolbar. Note: Input for this tool must be
vector. The following window opens and allows you to specify your selection.
Specify the layer to
perform the selection
against. Layer must
be turned on in the
table of contents.
The list of fields for
that layer are
displayed (which you
can use to create your
query).
Selected field.
Click Get Unique
Values to see the
values for the selected
field when creating a
query expression.
The list of unique
values for a
selected field are
displayed here.
Expression building
tools used to
create a query.
Build a query in the
selection widow by
using the expression
building tools (and
double clicking fields
and unique values) or
by typing in the query.
Specify an output
filename. The new
data layer with your
queried selection will
appear in your
My Data (vector)
folder.
SELECT * FROM forms
the first part of the
SQL expression and is
automatically supplied
for you.
This example query
will export a vector file
with all the northern
communities that are
in the province of
Yukon.
Click Submit to perform
your selection.
12
4.3 Select by Location
The Select By Location tool lets you select features based on their location relative to features in
another layer.
Click on the Select by Location
tool on the Analysis toolbar. Note: Input for this tool must be
vector. The following window opens and allows you to specify your selection.
Specify the target
layer from which
features will be
selected.
Specify the source layer
that will be used to select
features from the target
layer.
Choose the spatial
relationship rule that will
be used for selection:
‘intersect’, ‘are within’,
‘are completely within’, or
‘are contained by’.
Specify an output
filename. The new
data layer with your
queried selection will
appear in your
My Data (vector)
folder.
Click Submit to perform
your selection.
This example query
will export a vector file
with all the well sites
that are within the
CWS Key Habitat Sites.
Progress bar
appears when the
tool is processing.
Spatial Selection Method details:
Rule
Definition
intersect
Intersect returns any feature that either fully or partially overlaps the source feature(s).
are within
To be selected, the geometry of the target feature must fall inside the geometry of the source
feature. Selected features and source features can have overlapping boundaries.
To be selected, all parts of the target features must fall inside the geometry of the source
feature(s) and cannot touch the source's boundaries.
are completely
within
are contained by
This method differs from the Are completely within method in that the geometry of the target
feature must fall inside the geometry of the source feature including its boundaries.
13
4.4 Intersect Tool
Intersect creates a new feature from the common areas or edges of any two selected features of the
same geometry type. You can create a new feature from the intersection of features of different layers,
but the layers must be of the same geometry type (point, line or polygon).
Click on the Intersect
tool on the Analysis toolbar. Note: Input for this tool must be vector. The
following window opens and allows you to perform an intersect between vector layers.
Specify the target
layer from which
features will be
intersected with.
Specify the source
layer that will be used
to intersect features
from the target layer.
Specify an output
filename. The new
data layer with your
intersect will appear in
your My Data (vector)
folder.
This example intersect
will export a vector file
with the common
(intersecting) area
between mineral claims
and muskox harvesting
areas.
Click Submit to perform
the intersection.
Progress bar
appears when the
tool is processing.
Example intersect:
14
4.5 Euclidean Distance
Euclidean distance gives the measured distance from each cell in the raster to the closest source.
tool on the Analysis toolbar. Note: Input for this tool can be
Click on the Euclidean Distance
vector or raster. Output data will be raster. The following window opens and allows you to calculate
Euclidean distance.
Specify the maximum
distance (m) which
accumulative values
cannot exceed. If
exceeded, values
become NoData.
Specify an output
filename. The new
raster data will appear
in your My Data
(raster) folder.
Specify the layer you
would like to run
Euclidean Distance on.
This example
performs a Euclidean
distance calculation
up to a maximum
distance of 6000m.
Click Submit to calculate
the Euclidean Distance.
15
4.6 Vector to Raster
Vector to Raster converts point, line, or polygon data into a raster surface with 1 km cells.
Click on the Vector to Raster
tool on the Analysis toolbar. Note: Input for this tool must be
vector. Output data will be raster. The following window opens and allows you to convert a vector
layer to a raster layer.
Specify the target
layer which you would
like to convert from
vector to raster.
This example vector to
raster will convert the
Peary Caribou layer to a
raster layer based on the
target field: Herd.
Specify the target field
which you would like
to use to convert to
raster.
Specify an output
filename. The new
raster data layer with
your will appear in
your My Data (raster)
folder.
Click Submit to convert
vector to raster.
VECTOR
RASTER
POINT
LINE
POLYGON
16
4.7 Reclass Raster
The Reclass tool allows the user to reclassify or change input cell values to alternative values.
tool on the Analysis toolbar. Note: Input for this tool must be
Click on the Raster Calculator
raster. The following window opens and allows you to specify your selection.
Specify the raster
target layer which you
would like to reclassify
The Value you will
be reclassifying.
This example Reclass
Raster reclassifies
Tug/Barge and Tanker 4,
and reclassifies Gov
vessel, Passenger vessel,
and Govt vessel (Nor) to
2. General Cargo Ship is
reclassed to 0.
Specify an output
filename. The new
raster data layer with
your will appear in
your My Data (raster)
folder.
Reclass Value must
be between 0-5.
Reclass value 0 =
transparent
Assign a new Reclass
Value for each Value
in the layer.
Double click the ‘0’ to
assign a new reclass value.
Type in a new value from
0-5.
Click Submit to convert
vector to raster.
17
5.0 Raster Tools:
The Raster Tools are used to manipulate and process raster data (found under Table of Contents, My
Data, Raster Layers).
Icon
Name
Function
Upload Layer
Allows the user to upload a raster layer to their My Data (raster) folder
so the layer can be incorporated into the analysis.
Move To Public
Moves a raster layer (values 0-5) from the My Data folder to the Public
Data folder so other users may access the layer.
Weighted Overlay
Overlays several rasters using a common measurement scale and
weights each according to its importance.
Raster Calculator
Allows the user to create and execute Map Algebra expressions (add,
subtract, multiply, etc.) in a tool.
18
5.1 Weighted Overlay
The Weighted Overlay Overlays several rasters using a common measurement scale and weights each
according to its importance.
Click on the Weighted Overlay
tool on the Raster toolbar. Note: Input for this tool must be raster.
The following window opens and allows you to specify your selection.
Specify the rasters to
include in the
weighted overlay.
Checked: includes the
raster in the overlay.
Unchecked: excludes
the layer from the
overlay.
Specify an output
filename. The new
raster data layer with
your will appear in
your My Data (raster)
folder.
Specify the weight by
typing in a value from
1-99. All weights must
sum to 100.
This example weighted
overlay combines three
rasters with their
respective weights.
Click Submit Job to
perform the weighted
overlay.
Example:
19
5.2 Raster Calculator
The Raster Calculator allows the user to create and execute Map Algebra expressions (add, subtract,
multiply, etc.) in a tool.
Click on the Raster Calculator
tool on the Raster toolbar. Note: Input for this tool must be raster.
The following window opens and allows you to specify your selection.
Raster layers which
can be used in the
Map Algebra
expression.
The operator buttons
allow you to enter
mathematical
(addition, division, and
so on) operators into
the expression.
The expression is the
Map Algebra
expression to be
executed.
Specify an output
filename. The new
raster data layer with
your will appear in
your My Data (raster)
folder.
Calculator buttons
allow you to enter
numeric values into
the expression.
Build an expression by
using the operator
tools (and double
clicking fields and
unique values) or by
typing in the
expression.
This example calculation
takes the Fishing Areas
raster and multiplies all
cells by a value of 25.
Click Submit to perform
the calculation.
20