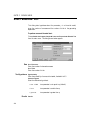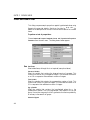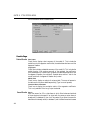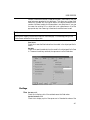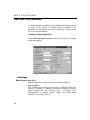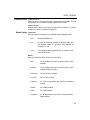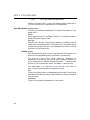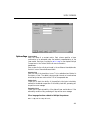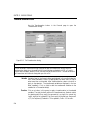
1
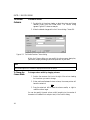
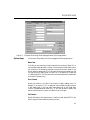
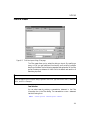
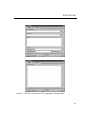
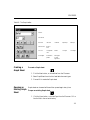
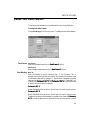
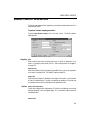
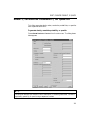
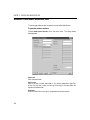
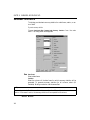
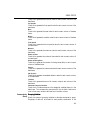
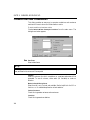
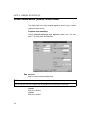
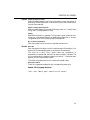
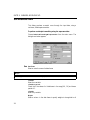
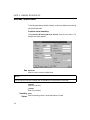
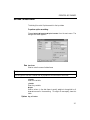
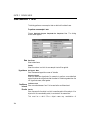
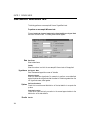
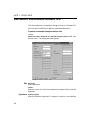
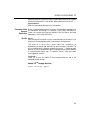
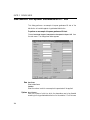
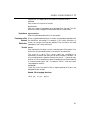
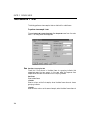
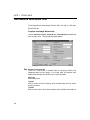
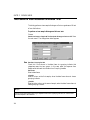
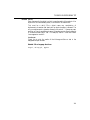
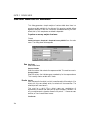
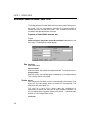
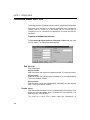
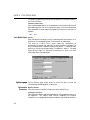
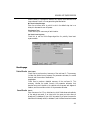
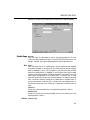
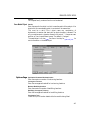
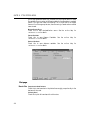
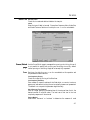
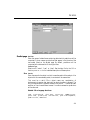
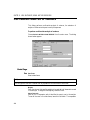
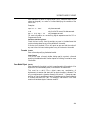
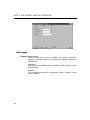
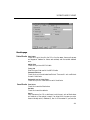
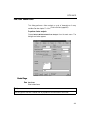
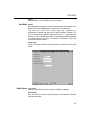
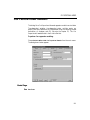
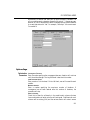
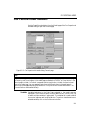
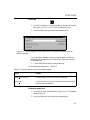
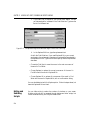
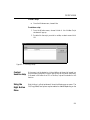
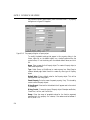
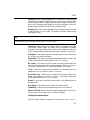
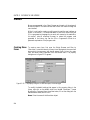
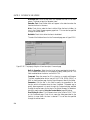
PLOT PROPERTIES
Window Specify the type of window used in the computations.
Number of Output Points Specify the number of equally spaced points at
which to calculate the density.
Window Width Specify the width of the window used in the computations.
The default is calculated using the formula: log(length(x%, base=2) + 1. The
standard error for a Gaussian window is width/4. For the other windows
width is the width of the interval on which the window is non-zero.
From and To Specify the lower bound (minimum) and upper bound
(maximum) for the data you wish to use. The default, Auto (automatic
calculation), uses the minimum and maximum values in the data provided.
Cut Specify the fraction of the window width that the x values are to be
extended by. The default is 0.75 for the Gaussian window and 0.5 for the
other windows.
Remove NA’s Specify whether missing values should be removed before
estimation or not.
Histogram Bars
For histograms you can specify the standard fill attributes (color, pattern and
background) and border attributes (style, color and weight).
Draw Bars Specify whether to draw borders for the individual bars of the
histogram.
Draw Histograms Specify whether to draw histogram. Disable this to draw
only the density line.
Density Line
For density lines you can specify the standard line attributes (style, color and
weight).
Draw Line Specify whether to draw the density line. Disable this to draw
only the histogram.
Line & Scatter
Plots (2D)
Data to Plot
Specify the names or column numbers of your X and Y columns. If you
specify only one column of data (X or Y), an integer sequence will be used for
the missing column of data.
Line
For line and scatter plots, you can specify standard line attributes (style, color,
and weight) and line break options. The line style is set to None for scatter
plots.
319