1
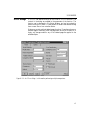
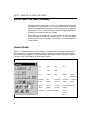
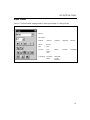
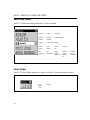
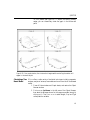
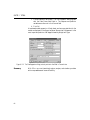
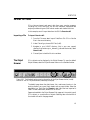
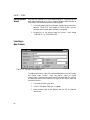
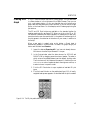
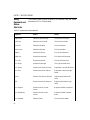
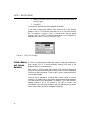
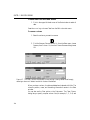
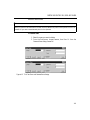
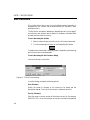
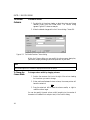
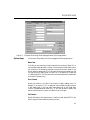
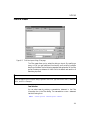
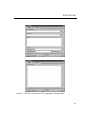
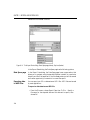
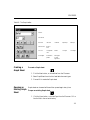
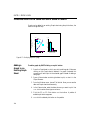
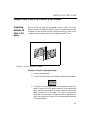
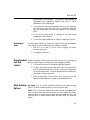
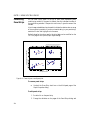
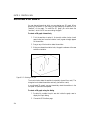
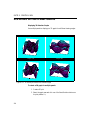
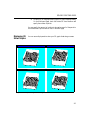
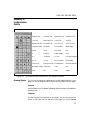
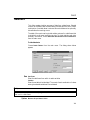
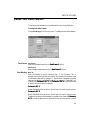
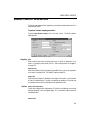
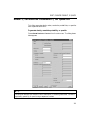
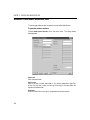
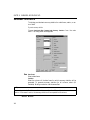
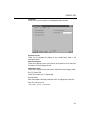
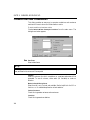
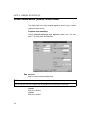
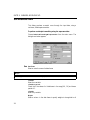
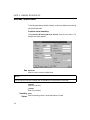
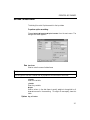
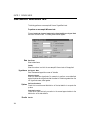
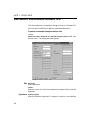
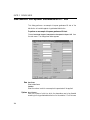
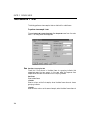
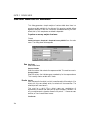
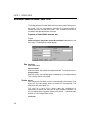
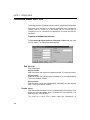
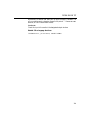
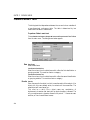
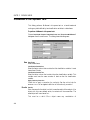
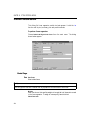
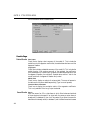
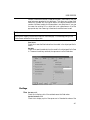
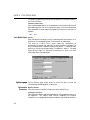
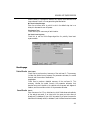
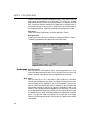
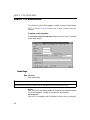
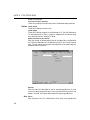
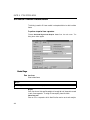
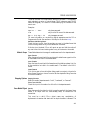
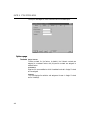
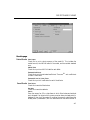
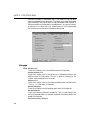
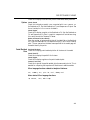
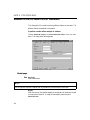
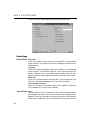
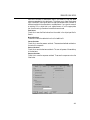
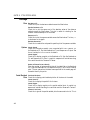
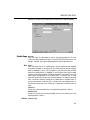
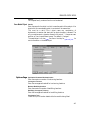
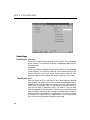
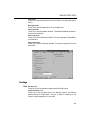
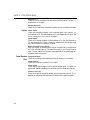
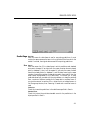
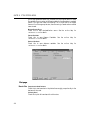
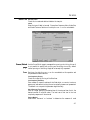
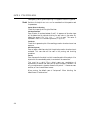
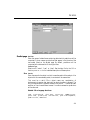
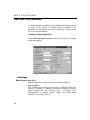
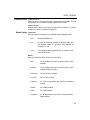
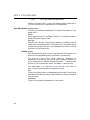
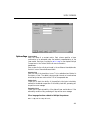
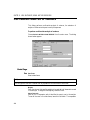
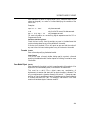
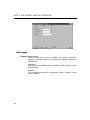
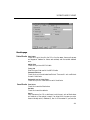
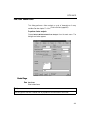
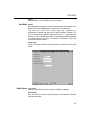
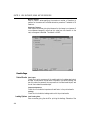
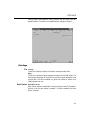
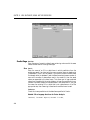
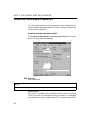
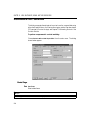
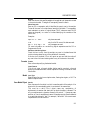
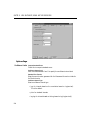
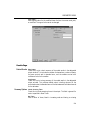
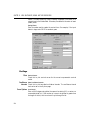
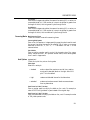
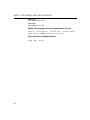
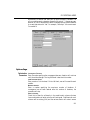
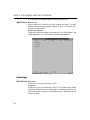
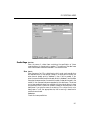
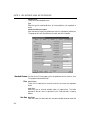
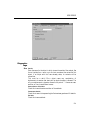
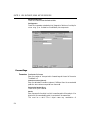
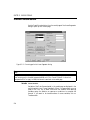
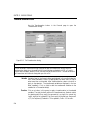
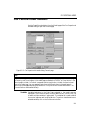
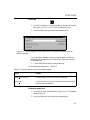
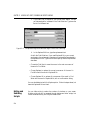
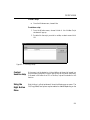
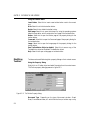
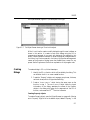
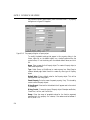
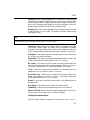
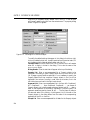
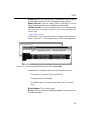
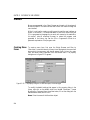
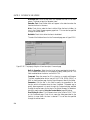
PLOT PROPERTIES
Pie Charts
Data to Plot
Specify the name or column number of your data under the X column. The
column should contain only positive values; if negative values are
encountered, the absolute value of the negative numbers is used in calculating
the size of each pie slice.
Comment plots can be combined with pie charts; see the discussion of
comment plots earlier in this chapter.
Specs/Fills
Plot Margin
Start Angle Specify the starting angle (in degrees) of the first pie slice. The
default angle is 0, which means the first slice is positioned starting at an
imaginary horizontal line drawn from the pie's center to the right edge of the
pie. The remaining pie slices are positioned after the first slice in a counterclockwise fashion. A starting angle of 90 positions the first pie slice at the top
of the pie.
For pie charts you can choose a solid color for each slice, fill the pie with a
series of shades determined by a range of colors, or specify new colors for the
filled slices using the standard color dialog.
See the information on fills in the section Common Plot Properties (page
300) for details on fill and color attributes.
Labels
You can have one or two labels for each slice of your pie charts, or choose to
have no labels at all.
Label 1 and Label 2 Type For the pie labels you can specify the label style.
If you choose Decimal, Scientific (e), Scientific (E) or Mixed, the data values
are used as labels.
If you choose Decimal%, Scientific%, or Mixed%, the percentage of the pie
represented by the slice is used.
If you select Column you need to specify the column containing the pie
labels. The column may contain either character or numeric data.
If you select None, no labels are drawn.
See the section Formatting 2D Axis Labels (page 244) for information on
other label type options.
Precision Specify the number of displayed digits after the decimal.
Column If Column was chosen for the Label style, specify the name of the
column containing the slice labels.
Data Set Specify the name of the data set containing the column of labels.
325