1
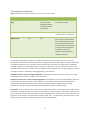
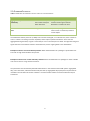
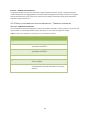
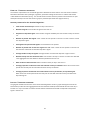
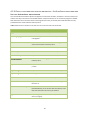
HTML FILE - THRESHOLD ALGORITHM The html file output file for the Threshold algorithm is divided into three sections. The first section includes a table with information of the pathogen, algorithm, parameter settings for the test run and the text written under additional information (if any). The second section contains summary measures from the test run (see description below) and in the last section a graph is presented (for details see Jpeg file section). Summary measures for the Threshold algorithm: Total number of tested days: Number of days in the test run. Number of signals: Total number of signals in the test run. Proportion of days with signal: Total number of signals divided by the total number of days in the test run. Number of periods with signals: Total number of time periods in the test run that contains at least one day with a signal. Starting dates for periods with signals: The start date for the periods. Number of periods with at least two signals in a row: Total number of time periods in the test run that contains at least two consecutive days with a signal. Average number of days for signals: Average number of consecutive days that a signal is active.. Number of days with zero observed cases: Total numbers of days in the test run with zero observed cases aggregated over the detection window specified for the test run. Mean number of observed cases: Mean number of cases per day in the test run. Average proportion of observed cases with unknown country of infection: Mean value over the test period over the daily rate of cases with unknown country of infection. Average proportion of observed cases with unknown country of infection, for days with signal: Mean value over the test period over the daily rate of cases with unknown country of infection for days with signals. JPEG FILE- THRESHOLD ALGORITHM The jpeg file created from the test run for the threshold algorithm contain a graph showing the value of the test statistic (number of cases aggregated of over the detection window) and threshold value for each day in the test run. Days in the test run where the test statistic exceeds the threshold corresponds to days with a signal in the test run. 19