1
2.4 FARRINGTON ALGORITHM
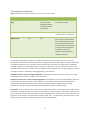
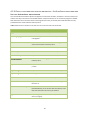
TABELL 4 PARAMETERS FOR FARRINGTON ALGORITHM TO BE SET IN THE CASE INTERFACE
Parameter
Default value
Allowed values
Comment
Detection window (start
date)
2003-01-01
Dates that that
ensures at least
1460 days between
start date and date
for detection.
A long detection window gives
less random variation
Alpha value
0.01
0<Value<1
A large value gives higher
sensitivity and lower specificity
Weeks in plot
100
>10
Number of weeks presented in
plot. Analysis is performed for
each week presented. Analysis
relies on data previous to the
week analyzed. This means that
an early first week (high value
of “Weeks in plot”) also
requires an early start date in
“Detection window”.
The Farrington algorithm (Farrington et al, 1996) compares the current number of cases to a threshold
computed from historical data in the previous years. A signal is given when data differ from what is expected in
a statistically significant way, for at least one of the last two weeks. A week in Farrington starts on Mondays
and ends on Sundays. Since the CASE system is running on a daily basis, a signal is more likely to occur in the
end of the week because the number of cases are added up during the week. The Farrington algorithm in CASE
is used for surveillance of pathogen data aggregated on a national level.
Examples of when to use the Farrington algorithm: The pathogen incidence varies over seasons, but is quite
stable between years. Data are available from several years.
Examples of when not to use the Farrington algorithm: Historical data are missing for the pathogen (the result
would show a large random variation). The pathogen has an incidence or frequency of reporting that has
changed over the past years (would result in many false positives/negatives signals). There are large
fluctuations in pathogen incidence not explained by calendar time (large random variation).
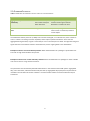
Parameters: Three parameters can be altered by the CASE administrator in the interface of the CASE system:
the detection window (start date), the alpha value and weeks in plot (see table 4). The detection window is set
by start date and specifies which time period should be included in the computation of the threshold limit. The
alpha value is set based on how sensitive the analysis needs to be. The value of the parameter weeks in plot
sets the number of weeks in the plot produced by the Farrington algorithm.
8