1
2.2 SATSCAN POISSON MODEL
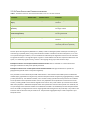
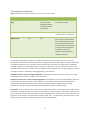
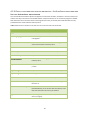
TABELL 2 PARAMETERS FOR SATSCAN DISCRETE POISSON MODEL TO BE SET IN THE CASE INTERFACE
Parameter
Default value
Allowed values
Comment
Detection window
(days)
180
Integers ≥ 90
A large value gives less
random variation
Population at risk
(percent)
50
0<Value<50
A high value allows for
both small and large
clusters
Aggregated days
7
Integers > 0
A value of 7 adjusts for
weekly variation
Alpha value
0.05
0<Value<1
A large value gives higher
sensitivity and lower
specificity
SaTScan discrete Poison model (Kulldorff, 1997) is used to investigate spatial clustering of cases during a
specified period, using a discrete Poisson model, taking population density at different locations into account.
Clusters are not restricted to regional boundaries. The algorithm gives a signal when data differ from what is
expected in a statistically significant way.
Examples of when to use the SatScan discrete Poisson model: Data are available on a sub-national level. The
pathogen incidence is similar at different locations when there is no current outbreak. Outbreaks are likely to
be spatially clustered.
Examples of when not to use the SatScan discrete Poisson model: The pathogen incidence varies with
demographic factors, such as age distribution; so that there is a constant spatial clustering (would result in
many false positives signals). Routines for detecting and reporting pathogen vary between locations (would
result in many false positives signals). Outbreaks are spread out geographically (would result in many false
negative signals).
Four parameters can be altered by the CASE administrator in the interface of the CASE system: the detection
window (days), population at risk (percent), aggregated days, and the p-value (see table 2). The detection
window, set as number of days, specifies the time period to be included in the computation of the expected
number of cases. The population at risk specifies the maximum size of the clusters; a setting of 50% means that
the algorithm will scan for very small clusters up to clusters that include 50% of the population. The p-value is
set based on how sensitive the analysis needs to be. The parameter aggregated days is used to adjust for cyclic
temporal trends.
6