1
366
MSETTLE USER MANUAL
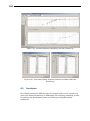
MSettle result
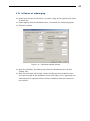
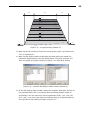
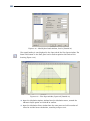
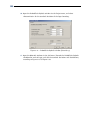
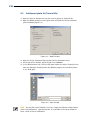
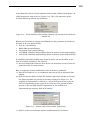
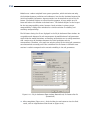
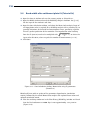
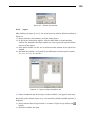
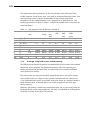
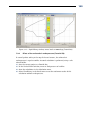
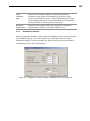
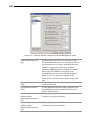
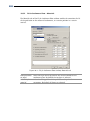
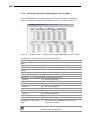
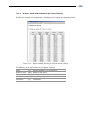
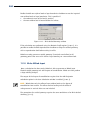
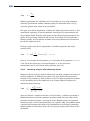
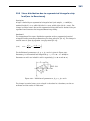
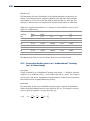
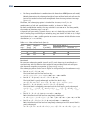
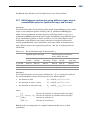
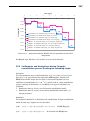
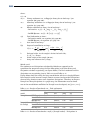
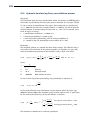
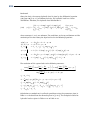
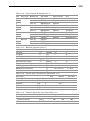
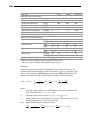
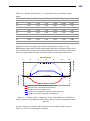
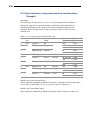
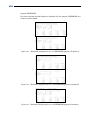
In the Calculation Options window, the Preconsolidation pressure within a layer is
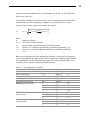
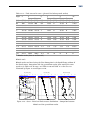
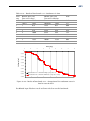
adapted for each benchmark according to Table 22-13. The settlements calculated by
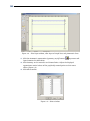
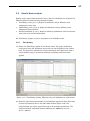
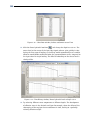
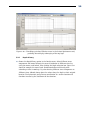
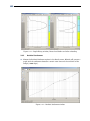
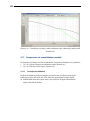
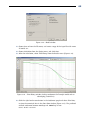
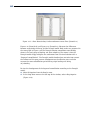
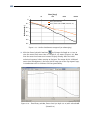
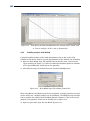
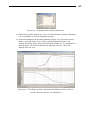
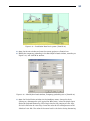
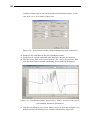
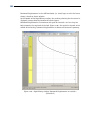
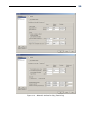
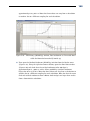
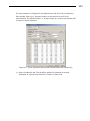
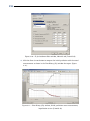
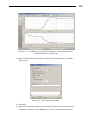
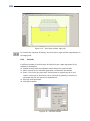
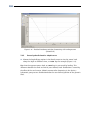
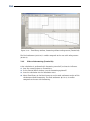
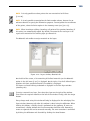
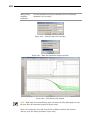
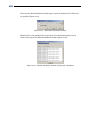
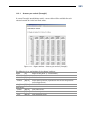
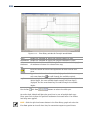
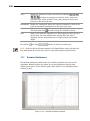
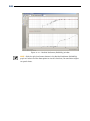
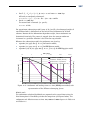
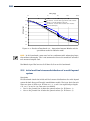
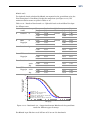
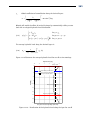
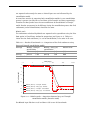
MSettle are exported to the spreadsheet using the View Data option in Time-History
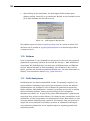
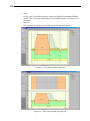
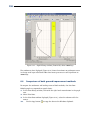
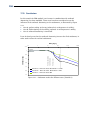
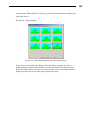
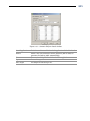
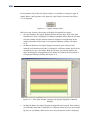
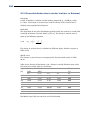
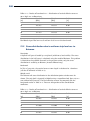
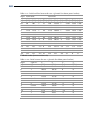
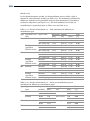
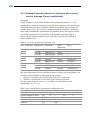
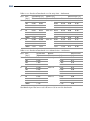
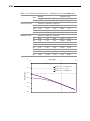
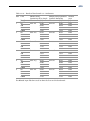
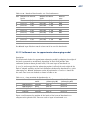
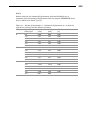
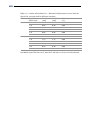
window for comparison (see Figure 22-11). The final settlements and initial preconsolidation are respectively given in Table 22-14 and Table 22-15.
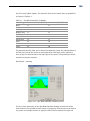
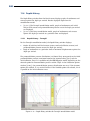
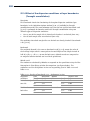
Table 22-14 – Results of benchmark 3-7 – Final settlements for different preconsolidation types
Type Type within the Type in time
Benchmark MSettle
layer
[mm]
File
[mm]
Pc
Constant
Constant
16.60
bm3-7a 16.60
Correction t=0
16.60
bm3-7b 16.60
Corr. every step 12.29
bm3-7c 12.29
Variable
Constant
16.85
bm3-7d 16.85
(parallel to
Correction t=0
16.85
bm3-7e 16.85
effective stress) Corr. every step 12.42
bm3-7f 12.42
OCR Constant
Constant
14.50
bm3-7g 14.50
Correction t=0
14.50
bm3-7h 14.50
Corr. every step 11.24
bm3-7i 11.24
Variable
Constant
14.50
bm3-7j 14.50
(parallel to
Correction t=0
14.50
bm3-7k 14.50
effective stress) Corr. every step 11.24
bm3-7l 11.24
POP Constant
Constant
11.55
bm3-7m 11.55
Correction t=0
11.55
bm3-7n 11.55
Corr. every step 9.75
bm3-7o 9.75
Variable
Constant
11.55
bm3-7p 11.55
(parallel to
Correction t=0
11.55
bm3-7q 11.55
effective stress) Corr. every step 9.75
bm3-7r 9.75
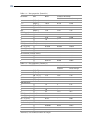
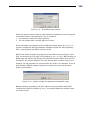
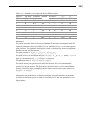
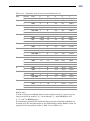
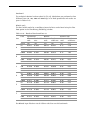
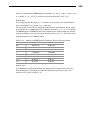
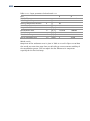
Table 22-15 – Results of benchmark 3-7 – Initial pre-consolidation pressure
distribution for different pre-consolidation types
Type Type within the Depth
Benchmark MSettle
layer
[m NAP]
[kPa]
File
[kPa]
Pc
Constant
-0.025
8.00
bm3-7a to c 8.00
-0.075
13.10
13.10
Variable
-0.025
7.70
bm3-7d to f 7.70
-0.075
13.10
13.10
OCR Constant
-0.025
9.24
bm3-7g to l 9.24
-0.075
15.72
15.72
POP Constant
-0.025
12.70
bm3-7m to r 12.70
-0.075
18.10
18.10
Error
[%]
0.00
0.00
0.00
0.00
0.00
0.00
0.00
0.00
0.00
0.00
0.00
0.00
0.00
0.00
0.00
0.00
0.00
0.00
Error
[%]
0.00
0.00
0.00
0.00
0.00
0.00
0.00
0.00