1
Excel Live CARE
USER GUIDE
74-3556-9 (US)
EN2B-0183 GE51 R0404
74-3556-9 (US)
EN2B-0183 GE51 R0404 (Europe)
Copyright © 2004 Honeywell Inc. • All Rights Reserved
Excel Live CARE
V5.00.00
USER GUIDE
Software License Advisory
This document supports software that is proprietary to Honeywell Inc. and/or to third
party software vendors. Before software delivery, the end user must execute a
software license agreement that governs software use. Software license agreement
provisions include limiting use of the software to equipment furnished, limiting
copying, preserving confidentiality, and prohibiting transfer to a third party.
Disclosure, use, or reproduction beyond that permitted in the license agreement is
prohibited.
74-3556-9 (US)
EN2B-0183 GE51 R0404 (Europe)
74-3556-9 (US)
EN2B-0183 GE51 R0404 (Europe)
LIVE CARE
CONTENTS
OVERVIEW
...........................................................................................................................
1
APPLICABLE LITERATURE
...........................................................................................................................
1
LIVE CARE CONCEPTS
...........................................................................................................................
2
GETTING STARTED
...........................................................................................................................
Connect to Controller (Online Monitoring) ..........................................................
Initiate Controller Simulation...............................................................................
Initiate Live CARE ..............................................................................................
On-Line Help ......................................................................................................
3
3
4
5
7
EXIT LIVE CARE
...........................................................................................................................
7
TYPICAL PROCEDURES
...........................................................................................................................
Select a Plant and the Communication Interface................................................
Simulate Controller Operation ............................................................................
Simulation Window ........................................................................................
Simulation Setup.......................................................................................
View User Addresses .........................................................................................
View Control Strategy.........................................................................................
View Switching Logic ..........................................................................................
Monitoring...........................................................................................................
Monitor(s) Dialog Box ....................................................................................
Monitor Hardware Points ...............................................................................
Monitor Software Points.................................................................................
Monitor Flag Points........................................................................................
Monitor XFM Points .......................................................................................
Search for Datapoints via Keyboard .........................................................
Monitor Points in “No Response” Mode .........................................................
Monitor Points in “Manual Override” Mode ....................................................
Monitor Z-Registers .......................................................................................
Monitor XFM Z-Registers...............................................................................
Fix/Unfix Points ..................................................................................................
Modify Flag Points ..............................................................................................
Modify Z-Registers .............................................................................................
View/Change Symbol Information ......................................................................
View/Change Symbol Inputs..........................................................................
View/Change Symbol Parameters .................................................................
Change XFM Internal User Addresses and Mapped Parameters ..................
Modify XFM Z-Registers ................................................................................
8
9
12
13
15
18
19
21
23
26
27
28
29
30
33
33
34
35
36
39
41
42
44
45
46
48
50
SET CARE.INI FILE ENTRIES
........................................................................................................................... 52
ERROR MESSAGES
........................................................................................................................... 54
General Error Messages .................................................................................... 54
Simulation Error Messages ................................................................................ 55
INDEX
........................................................................................................................... 58
i
74-3556-9 (US)
EN2B-0183 GE51 R0404 (Europe)
74-3556-9 (US)
EN2B-0183 GE51 R0404 (Europe)
ii
LIVE CARE
OVERVIEW
General
Excel Live Computer Aided Regulation Engineering (“Live CARE”) software provides
functions to check Excel 50, 80, 100, 500, 600, and Excel Smart, for correct control
operation. You can check operation either via physical connection to a Controller or
by using simulation software to mimic controller operation. You can monitor
hardware and software points as well as z-registers from the schematic, control
strategy, or switching logic functions. You can also "fix" points and modify z-registers
(set them to specific values and have the controller maintain those values). You can
view user addresses, control strategy and switching tables in the schematic.
Excel Live CARE software matches the functions and windows in Excel CARE
software to provide an easily recognizable format.
Manual Assumptions
You should know and understand Excel CARE software and its schematic, control
strategy, and switching logic functions. See Excel CARE User Guide 74-5587 (US) /
EN2B-0182 ( Europe) for details.
Manual Organization
This manual contains the following chapters:
This Overview states the purpose of Live CARE, required operator knowledge, and
manual organization. In addition, newly implemented features are described.
Live CARE Concepts provides general information on Live CARE software, its
relationship to other software, and its performance capacity.
Getting Started explains how to connect to a controller (physically or by simulation),
initiate Live CARE software, exit Live CARE software, and how to use the on-line
help function. The chapter also describes the Live CARE main window.
Typical Procedures includes step-by-step instructions for Live CARE functions.
These functions include:
• Select a Plant and the Communication Interface to specify a project, controller,
and plant for viewing and monitoring.
• Simulate Controller Operation to simulate an Excel 50, 80, 100, 500, or 600
Controller; vary the speed of controller simulation; change date and/or time in the
controller; and select continuous or step-wise functioning.
• View User Addresses to display user addresses in the schematic view.
• View Control Strategy to display the control strategy for the selected plant.
• View Switching Logic to display switching logic for the selected plant.
• Fix/Unfix Points to change point mode (automatic to manual and vice versa) and
assign point values or statuses.
• Modify Flag Points to change flag point values
• Modify Z-Registers to change z-register values
• View/Change Symbol Information to view/change input and internal control
symbol parameters, internal user addresses, mapped parameters and zregistersof XFMs.
• Error Messages provides a list of error messages that can display and explains
probable causes and solutions.
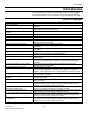
APPLICABLE LITERATURE
Form No.
Title
74-5587 (US)
EN2B-0182 (Europe)
Excel CARE User Guide
Description of Excel CARE and procedures to use Excel CARE functions.
74-5577 (US)
EN2B-0184 (Europe)
Excel CARE Control Icons User Guide
Descriptions of the control strategy icons in CARE.
EN2B-162
74-3594 (US)
EN2B-0185 (Europe)
RACL Editor User Guide
Graphical Editor for creation oft strategy logic programs for Excel 500 controllers.
ASPECD Editor User Guide
Provides functions to modify the user interface for Excel Operator Terminals.
1
74-3556-9 (US)
EN2B-0183 GE51 R0404 (Europe)
OVERVIEW
LIVE CARE
LIVE CARE CONCEPTS
Purpose
Data Changes
This chapter provides general information on Live CARE software, its relationship to
other software, and its performance capacity.
Live CARE can change control strategy symbol parameters, point mode, and
manual values in the controller database. Live CARE does not save any other
changes (for example, point value or status changes).
Capacities
Live CARE can monitor any point/z-register in a plant. The maximum number of
monitored points at any one time is 20 per controller.
Communication
Live CARE can either communicate directly with a controller (online) or simulate
controller function via simulation software.
Live CARE communicates directly with controllers via the B Port (XI584 Port) on the
controller and the serial port (RS-232-C) on the back of the Personal Computer
(PC).
Live CARE simulates controller function if you select the static simulator interface
option. See the Getting Started chapter for direct-connect and simulation
procedures.
Excel Building Supervisor
Both Excel Building Supervisor software and Live CARE software can communicate
with the same controller. Since the Excel Building Supervisor ("XBS") communicates
with the controllers via the C-bus and Live CARE communicates through the B port,
both programs can run concurrently without problem.
XI584 and Live CARE
Live CARE and XI584 software both use the controller B Port and thus cannot be
running at the same time if Live CARE is directly connected to the controller.
System Performance
Response time for Live CARE varies depending on controller type, the number of
points/z-registers being monitored, and the number of other programs running at the
same time as Live CARE.
The more points/z-registers being monitored, the slower the controller responds. To
speed response and reduce message traffic, Live CARE requests that the controller
only report point changes by exception, that is, if a point does not change value or
status, the controller does not issue a message to Live CARE. In contrast to points
z-registers are polled continously according to a defined poll cycle time.
74-3556-9 (US)
EN2B-0183 GE51 R0404 (Europe)
2
LIVE CARE
GETTING STARTED
Purpose
This chapter describes how to connect to the desired controller or start the
simulation software; start Live CARE software; and display on-line help. In addition,
newly implemented features and the Live CARE main window are described.
The first step is to decide whether to directly connect to a controller or to simulate
controller function. The next two sections discuss each option.
Connect to Controller (Online Monitoring)
Purpose
Requirements
Physically connect controller to Excel CARE Personal Computer (PC) so that Live
CARE can read the controller database.
The PC must be within 49 ft. (15m) of the controller. At greater distances (up to 3281
ft. [1000m]), you must add a line driver.
Use a XW567 Connection Cable, 25-pin straight-through PC-to-modem cable, and
an Opto-Isolator to connect the PC and controller. The Opto-Isolator SP400A is
available from Black Box Corporation, P.O. Box 12800, Pittsburgh, PA 15241 ([412]
746-5500; FAX order number 1-800-321-0746 within the US and 412-746-0746
outside the US). Also use Power Supply PS015 from Black Box to power the OptoIsolator.
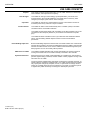
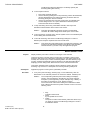
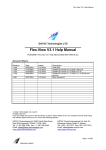
Procedure (Hardware)
1. Exit CARE. Turn off power switches of the PC and printer (if used).
a.
Insert plug on the XW567 connection cable into the socket on the front
of the controller computer module.
b.
Insert the other plug on the XW567 connection cable into the DTE side
of the Opto-Isolator. Connect Power Supply PS015 to the Opto-Isolator
and set the single-throw DIP switch to the DTE side.
c.
Keep the distances between the PC and controller short (less than 16
feet [5 m] either side of the Opto-Isolator) so that the power supply
conversion from the RS-232 signal lines is not compromised.
d.
Connect one end of the 25-pin straight-through PC-to-modem cable to
the serial interface socket on the back of the PC (COM 1 or COM 2).
e.
Connect the other end of the cable to the 25-pin DCE socket on the
Opto-Isolator.
EXCEL
CONTROLLER
CPU MODULE
CRT
RS 233c
EXT BUS
EXT 100
PARALLEL
INTERFACE
SOCKETS
SERIAL
INTERFACE
SOCKET
L1
L2
L3
L4
L5
L6
BLACK BOX
OPTO-ISOLATOR
(SP400A) WITH
POWER SUPPLY (PS015)
25-PIN
STRAIGHT-THROUGH
PC-TO-MODEM CABLE
XW567
CABLE
DCE
CONNECTOR
(25 PIN SOCKET)
DTE
CONNECTOR
(25 PIN PLUG)
C6978
2. Insert the PC power supply cable into the socket on the back of the PC.
3. Insert the plug on the power supply cable into a wall socket.
3
74-3556-9 (US)
EN2B-0183 GE51 R0404 (Europe)
TYPICAL PROCEDURES
LIVE CARE
4. If there is a printer:
a.
b.
c.
d.
Insert the printer connection cable into the socket on the back of the
printer.
Insert the other end of the printer connection cable into the socket on
the back of the PC.
Insert the printer power cable into the socket on the printer.
Insert the printer power cable into a wall socket.
5. To start the PC, apply power in the following order:
a.
b.
c.
Switch ON (I) the controller computer module, if not yet running.
Switch ON (I) the printer.
Switch ON (I) the PC.
Always switch on the printer before switching on the PC. Always switch off the
printer after switching off the PC.
RESULT:
Screen display depends on the setup of the software in the PC. To
operate Live CARE, Windows and Excel CARE software must be
running.
6. If Windows is not running (only a DOS prompt on the screen, for example,
c:>), type win to initiate Windows.
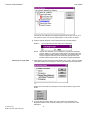
7. When Windows is running, click the Start menu.
8. Select Programs and HONEYWELL XL 5000, then click on CARE 3.00.00
RESULT:
Procedure (Software)
The Excel CARE window displays. Use the Initiate Live CARE
section to open a Live CARE window.
To perform online monitoring see the following sections:
• Initiate Live CARE
• Select a Plant and the Communication Interface
• Typical Procedures
Initiate Controller Simulation
Purpose
CARE generates an application program for a controller after a successful controller
translation. Live CARE simulation software creates a simulated controller in your PC
workstation that maintains application files, interprets RACL programs, and executes
Time Programs so you can evaluate controller applications before they are
downloaded into a controller.
Some of the advantages of using the simulation tool for DDC static testing are:
• You can debug controller applications in accelerated real-time.
• There are debug productivity savings due to the elimination of Excel 500 and 600
I/O module selection and addressing during testing.
• There are debug productivity savings due to the elimination of the B port
controller download during testing.
• You can save and load a controller simulation for repeated tests.
• You can debug an application using a single time step mode.
• You can fix global point values.
• Simulation eliminates the time required for controller address assignment.
Description
The simulation is a “static” simulation, that is, you can set input point values, run the
controller application, and view output point values, but the software does not
simulate any field inputs/outputs.
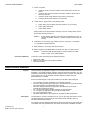
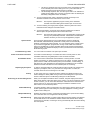
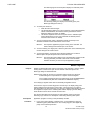
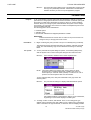
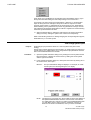
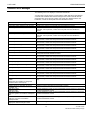
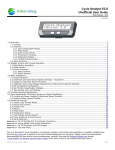
The following diagram illustrates simulation software operation along with CARE and
Live CARE. The user specifies setup commands (for example, simulated controller
74-3556-9 (US)
EN2B-0183 GE51 R0404 (Europe)
4
LIVE CARE
TYPICAL PROCEDURES
date and time, step size) and operation commands (for example, continuous or step
operation, acceleration of real-time). Simulation software creates a simulated
controller from CARE controller application program files and runs its application
program. Simulation software communicates with Live CARE software to receive
point requests and fix value commands and then return new point values based on
controller operation.
User
CARE
Time and Elapsed
Time Display
Controller Application
Program Files
Setup and
Operation
Commands
Parameter
Changes
Live CARE
Simulation Software
Simulated Controller
Point Requests,
Parameter Changes,
and
Fix Value Commands
Point Values,
Parameter
Values, and
Controller
Alarms
Requirements
Live CARE
The controller you want to simulate must have one or more attached plants and be
translated. See CARE User Guide 74-5587 (US) / EN2B-0182 ( Europe) for
procedures.
NOTE: Only Excel 50, 80, 100, 500, 600, and Excel Smart Controllers can be
simulated.
Procedure
To perform simulation see the following sections:
•
•
•
•
Initiate Live CARE
Select a Plant and the Communication Interface
Simulate Controller Operation
Typical Procedures
Initiate Live CARE
Purpose
Assumption
Procedure
Open the Live CARE window to select a plant and check its control functions.
Excel CARE is running and is the active window on the PC. Live CARE is only
available within Excel CARE.
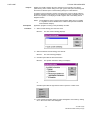
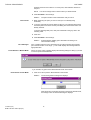
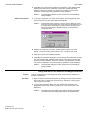
1. Select a controller in Excel CARE that has at least one attached and translated
plant.
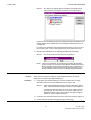
2. Click menu item Database, then dropdown item Select to display the Select
dialog box. Or, click the Select button in the button bar below the menu bar.
3. Click desired project name (or folder icon).
RESULT:
The plants and controllers associated with the selected project
display.
4. Click desired controller name (or controller icon) or attached plant, then click
OK.
RESULT:
If you have not already selected the project, the Enter Project
Password dialog box displays. Enter password and click OK.
5
74-3556-9 (US)
EN2B-0183 GE51 R0404 (Europe)
TYPICAL PROCEDURES
LIVE CARE
A new window displays with controller name in the title and
controller information in the window.
5. Click menu item Controller, then dropdown items Tools, Live CARE. This item is
available only if the currently active (selected) CARE window is a controller or
attached plant window.
RESULT:
The Live CARE main window and the Open Plant dialog box
concurrently display.
To continue with opening a plant see the Select a Plant and the Communication
Interface section. For description of the Live CARE main window see the
following sections.
Title Line
The title line contains the System menu (CARE symbol), the software name (Live
CARE and window control icons.
Menu Bar
The menu bar contains two items, File and Help.
The File menu item provides options to select a plant (Open); and exit Live CARE
(Exit).
- See the Select a Plant section to use the Open item.
- See the Exit Live CARE chapter to use the Exit item.
The Help menu item displays a list of help topics that you can click and display. The
Help menu item also includes an About Live Care... function that displays the About
Live Care dialog box with software version copyright notice, and memory available.
- See the On-Line Help section in this manual for details on the on-line
help function.
74-3556-9 (US)
EN2B-0183 GE51 R0404 (Europe)
6
LIVE CARE
TYPICAL PROCEDURES
On-Line Help
Purpose
The Help menu item provides access to an on-line version of this user guide and the
About Live Care dialog box.
You can also display the on-line user guide by clicking the Help button in any dialog
box or window. When you click a Help button, the help topic related to that dialog
box or window displays.
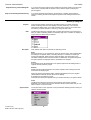
Procedure
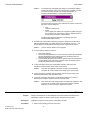
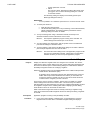
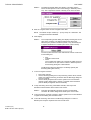
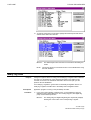
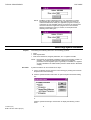
1. Click Help menu bar item.
RESULT:
A dropdown list displays with help topics and an About Live Care...
item:
Contents displays the contents page of the on-line user guide.
Overview displays the same overview information as in this manual.
Topics List presents a list of the other sections of this manual that
are on-line.
Search for... displays the Search dialog box so that you can type or
select words and find them in the on-line user guide.
Using Help opens the standard Windows help file. The help file
describes how to use the help function in general.
Applicable Literature displays a list of the form numbers and titles of
manuals related to Live CARE.
About Live CARE... displays the About Live CARE dialog box.
2. Click desired topic or About Live Care.
RESULT:
Text relating to the selected topic displays. Or, for the About Live
Care item, the About Live Care dialog box displays with software
version, copyright notice, and memory available.
EXIT LIVE CARE
Purpose
Procedure
Stop all point monitoring and terminate the Live CARE session.
Click File menu item, then dropdown item Exit.
RESULT:
The Live CARE window closes and the Excel CARE main window
redisplays.
7
74-3556-9 (US)
EN2B-0183 GE51 R0404 (Europe)
TYPICAL PROCEDURES
LIVE CARE
TYPICAL PROCEDURES
Purpose
This chapter includes step-by-step instructions for the following functions:
• Select a Plant and the Communication Interface to select a project, controller,
and plant for viewing and monitoring.
• View User Addresses to display user addresses in the schematic view.
• View Control Strategy to display the control strategy for the selected plant.
• View Switching Logic to display switching logic for the selected plant.
• Simulate Controller Operation to vary the speed of controller simulation, change
date and/or time in the controller, and select continuous or step-wise functioning.
• Monitoring to start and stop monitoring of points, z-registers and XFM points.
• Fix/Unfix Points to change point mode (automatic to manual and vice versa) and
assign point values or statuses.
• Modify Flag Points to change flag point values
• Modify Z-Registers to change z-register values
• View/Change Symbol Information to view/change input and internal control
symbol parameters, internal user addresses, mapped parameters and z-registers
of XFMs.
General Procedure
You must first select a project, controller, and plant. After you make your selections,
Live CARE displays the schematic and user addresses for the plant. You can begin
monitoring hardware, software and flag points by clicking the arrow heads for the
hardware points or the abbreviations in the software points line. In addition, you can
monitor z-registers by selecting the Z-Registers dropdown item from the View menu.
Or, you can select one of the view options to display control strategy loops or
switching logic tables. If you select another view, you can stop current point /zregister monitoring and select other points/z-register to monitor, or continue current
monitoring and add more points/z-registers for Live CARE to monitor.
If you are simulating controller operation rather than connecting to a controller, you
can manipulate simulation values to affect monitored points and test controller
reaction.
The following sections describe how to perform these functions.
74-3556-9 (US)
EN2B-0183 GE51 R0404 (Europe)
8
LIVE CARE
TYPICAL PROCEDURES
Select a Plant and the Communication Interface
Purpose
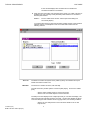
Procedure
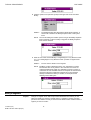
Select a project, controller, or plant; or switch to another project, controller or plant.
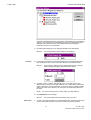
1. In the Live CARE main window, click File, then dropdown item Open.
or
Select the desired plant or controller in CARE, click Controller, then dropdown
item Live CARE (see Initiate Live CARE section)
RESULT:
The Open Plant dialog box displays.
2. Click desired project name (or folder icon).
RESULT:
The plants and controllers associated with the selected project
display in the “Plant and Controller” box.
3. Click desired plant name (or plant icon). Select only attached plants. Attached
plants list below the controller where they are attached.
4. Click OK. This button is not active if the selected plant is not attached.
RESULT:
The Communications dialog box displays next if you changed to a
different project, controller, or plant.
Software stops all point monitoring in the previously selected plant.
If you changed a point's mode (auto to manual or manual to auto)
and did not return it back to the original mode, a dialog box
9
74-3556-9 (US)
EN2B-0183 GE51 R0404 (Europe)
TYPICAL PROCEDURES
LIVE CARE
displays. This dialog box says that one or more point modes were
changed and not returned back to the original mode. Click OK to
continue. Or, click Cancel to keep the controller selection and
correct point mode.
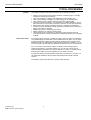
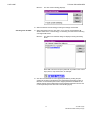
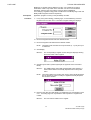
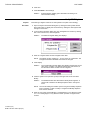
5. Type the four-digit password for project. The default password is 3333 as
definied in the care.ini file. If the password was changed via a portable
operator’s terminal such as the XI581/582 or XI584, you need to enter the new
password; see site supervisor if unknown.
6. Click the desired serial port that you wish to use (default is Com 1).
7. Click the type of interface connection you are using. Static Simulator initiates
simulation software. If you select Static Simulator, the Ports option becomes
inactive (gray).
8. Click OK.
Or, to exit without making these selections, click Cancel.
RESULT:
If you click OK, software checks whether or not controller name
matches the name in the controller and whether or not controller
password matches the password in the Communications dialog box
(if a password is required).
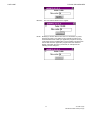
If the selected controller name does not match the name in the
controller, an error dialog box displays telling you the incorrect
controller name and giving the selected name and the name in the
controller. Click OK to close the message box. The Open Plant
dialog box redisplays for another selection.
If the password does not match that in the controller, an error dialog
box displays. Click OK to close the message box. The
Communications dialog box redisplays to allow you to reenter a
valid password.
When controller name and password are correct, software initiates
communication with the selected controller and updates the
schematic, hardware point, and software point monitor dialog
boxes for that plant. The display defaults to the user addresses
view. The following window is an example of a plant schematic
display.
74-3556-9 (US)
EN2B-0183 GE51 R0404 (Europe)
10
LIVE CARE
TYPICAL PROCEDURES
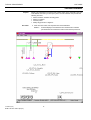
Schematic Window
If you are simulating controller operation rather than connecting to a controller, the
Live CARE Simulation window displays over the bottom part of the Live CARE
window. See the Simulate Controller Operation section for details on manipulating
simulation values.
Title Line
The same title line displays as for the main Live CARE window.
Menu Bar
The same menu bar displays as for the main Live CARE window with the addition of
a View menu item.
The View menu item provides options to view control strategy, switching logic, and
user addresses for a selected plant.
NOTE: See the View Control Strategy, View Switching Logic, and View User
Addressessections for details on these items.
11
74-3556-9 (US)
EN2B-0183 GE51 R0404 (Europe)
TYPICAL PROCEDURES
LIVE CARE
Schematic
Schematic displays for the selected plant. This schematic is the same as the one
created during the Excel CARE process.
View Area
The view area displays the control strategy, switching logic tables, or user addresses
for the plant. You select which function displays here by clicking View, then one of
the dropdown items.
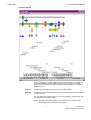
Hardware Points
The physical points assigned to the plant display on this line. These triangles are the
same as those shown in Excel CARE. To highlight the user address, position mouse
cursor over the triangle and hold down the mouse button. If you click an arrow head,
software begins monitoring the point.
Software Points
The software points assigned to the plant in the control strategy display on this line
just as they do in Excel CARE. In addition, the name of the software point displays
above the abbreviated point type. For example, VA is the type (analog pseudopoint)
and Heat_Degree_Days is the name of the point. To highlight the user address,
position mouse cursor over the triangle and hold down the mouse button.
Software points added in the CARE switching logic function appear in the software
points line in the first available position.
If you click the abbreviated type (in the box), software begins monitoring the point.
Z-Registers
XFMs
Z-registers can be accessed by the Z-Register dropdown item from the View menu,
by clicking a flag point in the software points line or by clicking an XFM symbol.
For XFMs internal user addresses and mapped parameters can be monitored by
selecting the XFM control symbol or by the XFM-Points dropdown item from the
View menu.
Status Bar
The status bar displays the names of the currently selected project, controller, and
plant as well as the current mode (always Normal).
Scroll Bar
The scroll bar allows you to move the schematic and other plant items to the right or
left to view all plant components. Click within the bar to the left or right of the thumb
(white square), or click the left or right arrows to move the view left or right.
Continuing Procedures
When selecting Static Simulator in the Communications dialog box see the Simulate
Controller Operation and the Monitoring sections for further steps.
When selecting B-Port in the Communications dialog box see the Monitoring section
for further steps.
Simulate Controller Operation
Purpose
Requirements
Enable DDC application static checkout without requiring controller hardware. You
can vary speed of controller simulation, change date and/or time in the controller,
and select continuous or single-time step simulation.
This procedure assumes you initiated simulation software as described in the Initiate
Controller Simulation section.
The static simulator option is available only for Excel 50, 80, 100, 500, 600, and
Excel Smart Controllers.
Simulation software maintains a window in the foreground at the bottom of the Live
CARE window. This window allows you to control the simulation while Live CARE
displays the changing values of monitored points. The simulation tool displays
controller alarm messages, for example, when an analog input is commanded from
automatic to manual operation.
74-3556-9 (US)
EN2B-0183 GE51 R0404 (Europe)
12
LIVE CARE
TYPICAL PROCEDURES
Procedure
Simulating controller operation and monitoring point/z-register value and status
changes are dynamic actions that require adjustments in the simulation window and
the Live CARE window.
The Monitoring, Fix/Unfix Points and Modify Z-Registers sections describe how to
control and display point and z-register values and statuses in the Live CARE
window.
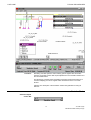
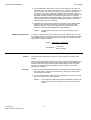
Following is a description of the Simulation window with guidelines for using its
features.
Simulation Window
Simulation Speed
Control Bar
13
74-3556-9 (US)
EN2B-0183 GE51 R0404 (Europe)
TYPICAL PROCEDURES
LIVE CARE
The speed control bar allows to operate the controller faster than real time
(maximum of 18 times faster). For example, you could execute and test the
equivalent of an 8-hour day’s program in 30 minutes.
Simulation speed is limited by the hardware platform. For example, a 386, 20 MHz
PC is limited to 1.7 times simulation speed. You can set the speed faster, but the
simulation will continue to operate at 1.7 times real time.
Click the left or right arrows to set the speed slower (left) or faster (right). Or, move
the thumb (white box) in the scroll bar to the left or right.
Start Button
Start the controller application program and run continuously. To stop the program,
click the red Stop button. To run the controller program for a set amount of time, use
the Step button.
This button is not active if no application is loaded.
Step Button
Start the controller application program and run for a specific length of time. Step
time (“size”) is set in the simulation setup window. Default is controller cycle time.
If Step Size is shorter than the length of the DDC Cycle Time for the controller
application program, the simulation will run one complete execution cycle and stop.
Click the Setup button to display the setup window and change step size, if desired.
See Simulation Setup Window description later in this section.
Example: You can use Step Size to set up a simulation to run the equivalent of a
day of controller operation. Or, just 2 hours or just 15 minutes.
This button is not active if no application is loaded.
Stop Button
Stop the simulation. The simulation window remains on display so you can restart
the simulation as desired.
This button is not active if no application is loaded.
Setup Button
Help Button
Simulated Time
Display the setup window. The setup window allows you to set date and time in the
controller; define the length of time for a step simulation; save and restore a
simulation session; and change DDC cycle time for the controller application
program. See the Simulation Setup Window description later in this section.
Display the on-line help topic related to the simulation window.
Date and time assigned to the controller. You can change date and time in the
simulation setup window. Click the Setup button to display the setup window. See
Simulation Setup Window description later in this section.
Example: You may want to change date and time to test controller operation on
Sundays or Holidays.
Elapsed Time
74-3556-9 (US)
EN2B-0183 GE51 R0404 (Europe)
Length of time the simulation has been running. This time does not match real time if
the Simulation Speed control bar is set faster than normal. Note that at normal
speed, some workstations may operate slower than real time.
14
LIVE CARE
TYPICAL PROCEDURES
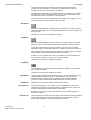
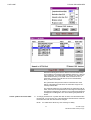
Simulation Setup
Menu Items
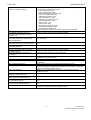
The File menu item has the following dropdown selections:
Open
Display the Open dialog box to find and select a
previously saved simulation file (.SSV).
Save
If the current application was loaded from an .SSV file or
previously saved, this function saves the current state of
the simulation into the current .SSV file. Otherwise, it
displays the File Save As dialog box so you can enter a
file name to receive a saved copy of the simulation.
Default file extension is .SSV.
For example, you can use the File Save function to save
a simulation session so that you can continue testing with
the same controller configuration at a later time. The
saved controller simulation session includes all the I/O
point manual values as well as a snapshot of all
applications.
Save As
Display the File Sav As dialog box to enter a file name to
receive a saved copy of the simulation. Default file
extension is .SSV.
Exit
Terminate simulation software.
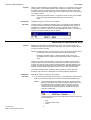
IMPORTANT
Do not execute the Exit menu option if the Live CARE application is
operating. The following message displays if you try to exit the simulation
application before Live CARE:
LIVE CARE SIMULATION
Live CARE still connected!
Please disconnect before exiting simulator.
Click OK to close the message box. Then, exit Live CARE (File, Exit in the
Live CARE window).
15
74-3556-9 (US)
EN2B-0183 GE51 R0404 (Europe)
TYPICAL PROCEDURES
LIVE CARE
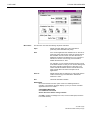
The Help menu item has dropdown items that go directly to help sections relevant to
the item. The About CARE Simulation item displays a dialog box that has the current
software version number and copyright notice.
Simulation Start
Date, Time
Date and time to assign to the controller. Default is
current PC date and time. Date and time format follow
that defined in the international setting in the Windows
Control Panel. For example, you may want to change
date and time to test controller operation on Sundays or
Holidays.
You can use the following methods to change date and
time assignment:
• Select and type over date and time parts.
• Click the up and down arrows.
• Double-click date to display a calendar:
Click the left and right arrows to select different years
and/or months. Click a date to select it. When the desired
date is selected, click OK to save the date and close the
dialog box.
Simulation Step
Size
Length of time the simulation should run when you select
the Step button in the Simulation window. Default is
controller DDC cycle time. Integer values only. Select
and type over to change or click the up and down arrows
to change.
If Step Size is shorter than the length of the DDC Cycle
Time for the controller application program, the
simulation will run one complete execution cycle and
stop.
Example: You can use Step Size to set up a simulation to
run the equivalent of a day of controller operation. Or,
just 2 hours or just 15 minutes.
DDC Cycle Time
Length of the cycle time CARE calculated during
translation of the controller application program. Select
and type over to change or click the up and down arrows
to change.
OK
Cancel
74-3556-9 (US)
EN2B-0183 GE51 R0404 (Europe)
Save changes and close the dialog box.
Close the dialog box without saving any changes.
16
LIVE CARE
TYPICAL PROCEDURES
Help
Display the related on-line help topic.
17
74-3556-9 (US)
EN2B-0183 GE51 R0404 (Europe)
TYPICAL PROCEDURES
LIVE CARE
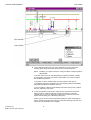
View User Addresses
Purpose
Display user addresses for hardware and software points in the schematic. This view
is the default view when you first open a plant. The user address view provides the
following functions:
•
•
•
•
Procedure
Monitor software, hardware and flag points
Monitor z-registers
Fix/Unfix points
Modify flag points and z-registers
1. Click menu item View, then dropdown item User Addresses.
RESULT:
74-3556-9 (US)
EN2B-0183 GE51 R0404 (Europe)
Software displays user addresses from hardware and software
points beneath the schematic and above the software points line.
18
LIVE CARE
TYPICAL PROCEDURES
Parts of the schematic do not appear in the window, use the scroll
bar at the bottom of the window to change the view to include the
rest of the schematic. Click in the bar or the left and right arrows to
move the schematic left or right.
2. For monitoring software, hardware and flag points, and z-registers see the
Monitoring section.
For fixing points see the Fix/Unfix Points section.
For modifying flag points and z-registers see the Modifiy Flag Points and Modify
Z-Registers sections.
3. To view a control loop or view a switching table, select the View, Control
Strategy and Switching Logic option respectively.
4. To exit the user addresses function, select another function from the File or
View menu items. Software continues monitoring any points that you set up for
monitoring unless you turn them off (via point/z-register monitor dialog box or
Monitor(s) dialog box).
View Control Strategy
Purpose
Display control strategy loops for the selected plant. The Control Strategy view
provides the following functions :
•
•
•
•
•
•
•
Procedure
Monitor software, hardware and flag points
Monitor z-registers
Monitor XFM points
Fix/Unfix points
Modify flag points and z-registers
Change internal and input parameters of symbols
Change internal user addresses, mapped parameters and z-registers of XFMs
1. Click main window item View, then dropdown item Control strategy.
RESULT:
The View Control Strategy dialog box displays with a list of control
strategy loops for the selected plant.
If no control loop was previously selected for the current plant, the
first loop in the list is automatically selected. Otherwise, the last
control loop viewed is highlighted.
2. Check/uncheck End current monitoring box, as desired. If the box is checked
when you click OK, software stops all existing point/z-register monitoring and
closes the Monitor(s) dilaog box. If not checked, software continues all point/zregister monitoring. The default mode for this box is checked. If this option is
gray, there is no current monitoring.
3. Click desired loop name. Then click OK. (Or, a shorter method is to double-click
the loop name).
RESULT:
The View window displays the selected control strategy loop with all
control symbols and connected hardware and software points. You
can scroll the window with the scroll bar.
19
74-3556-9 (US)
EN2B-0183 GE51 R0404 (Europe)
TYPICAL PROCEDURES
LIVE CARE
4. For monitoring points and z-registers see the Monitoring section.
For fixing points see the Fix/Unfix Points section.
For modifying flag points and z-registers see the Modifiy Flag Points and Modify
Z-Registers sections.
For Viewing/changing control symbol internal and input parameters see the
View/Change Symbol Inputs and View/Change Symbol Parameters sections.
For viewing/changing internal user addresses, mapped parameters or zregisters of XFMs see the Change XFM Internal User Addresses and Mapped
Parameters and Change XFM Z-Registers sections respectively.
5. To view a different control loop, reselect the View, Control Strategy option.
6. To exit the control strategy function, select another function from the File or
View menu items. Software continues monitoring any points/z-registers that you
set up for monitoring unless you turn them off (via point window or Monitor(s)
window).
74-3556-9 (US)
EN2B-0183 GE51 R0404 (Europe)
20
LIVE CARE
TYPICAL PROCEDURES
Intermediate Values
You cannot monitor intermediate values between control symbols in a control
strategy loop unless you assign a software point to the values. To assign software
points, return to CARE, add a software point (to the schematic, control strategy, or
switching logic), and retranslate and download the new database to the controller.
Restart Live CARE and select that new software point for monitoring.
View Switching Logic
Purpose
Procedure
Display switching tables for the selected plant. Software automatically begins
monitoring all points/z-registers in a switching table when you select it.
1. Click main window item View, then dropdown item Switching logic.
RESULT:
The View Switching Table dialog box displays with a list of User
Addresses that have switching tables in the selected plant. The
dialog box also shows the command values available for the
selected User Address. If this is the first time you are selecting a
switching table, the first User Address in the list is selected;
otherwise, the most recently selected User Address and command
value are selected.
2. Check/uncheck End current monitoring box, as desired. If the box is checked
when you click OK, software stops all existing point/z-register monitoring
(excluding the points/z-registers in the selected switching table). If not checked,
software continues all point/z-register monitoring for points/z-registers already
being monitored. Default mode for this box is checked. This option is gray if
there is no current monitoring.
3. Click desired User Address.
RESULT:
Software displays available command values for the selected User
Address.
4. Click desired command value. Then click OK. (Or, a shorter method is to
double-click the value.)
RESULT:
The View window displays the selected switching table. The table
looks just as it does in Excel CARE, except that there are two
additional columns.
One new column appears after User Address. The column is gray
and contains the current value/state of the point. Engineering unit
does not display.
A second column appears between the delay columns and the truth
table. This new column has bold vertical lines to distinguish it from
the previous columns. The new column shows the logical equivalent
of the left side of the table. A 0 displays if the evaluation was false;
a 1 displays if the evaluation was true.
Software automatically begins monitoring all points in the displayed
switching table.
21
74-3556-9 (US)
EN2B-0183 GE51 R0404 (Europe)
TYPICAL PROCEDURES
LIVE CARE
5. To fix a switching table point, click point value/state in the gray area in the
switching table. See the Fix/Unfix Points section for more information.
NOTE: Modifiying a z-register value from a flag point within a switching table is
not possible.
To monitor points not in the switching table (for example, hardware, software
and flag points), click point arrow head or abbreviation. For more information,
see the Monitoring section.
To fix points not in the switching table see the Fix/Unfix Points section
To modify flag points and z-registers not in the switching table see the Modifiy
Flag Points and Modify Z-Registers sections.
To view a table for a different User Address and monitor those points, reselect
the View, Switching Logic option.
6. To exit the Switching Logic function, select another function from the File or
View menu items. Note that software continues monitoring any points/zregisters that you set up for monitoring unless you turn them off (via point/zregister monitor dialog box or Monitor(s) dialog box).
Another way to exit is to close the Monitor(s) dialog box. When the dialog box
closes, software stops all point monitoring, closes the switching logic view, and
selects the user addresses view to display.
74-3556-9 (US)
EN2B-0183 GE51 R0404 (Europe)
22
LIVE CARE
TYPICAL PROCEDURES
Engineering Unit
and Mode Display
Hysteresis and Delays
Point engineering unit and mode(manual or
auto) do not display in the switching table. To view engineering unit and mode,
display the Fix Point dialog box by clicking point value/state in the gray area in the
switching table.
Truth table values do not reflect time delays that may be in the switching table.
Hysteresis is reflected in switching tables. Therefore, the values have to change by
the hysteresis value to cause the output to change. You can change time delays by
clicking on the time delay field and changing the time.
Monitoring
Purpose
Display point/z-register value or status (status only for points) as it changes in the
controller. Live CARE provides concurrently monitoring of the following items:
•
•
•
•
•
Hardware points
Software points
Flag points
XFM points (internal user addresses and mapped parameters)
Z-registers in general, corresponding to flag points and XFMs
There are two ways to monitor items. The first way is to display a monitor dialog box
that shows value/state, engineering unit, and mode (automatic or manual) of the
item. The second way is to select a switching table in the View Switching Logic
function. Software automatically monitors all items in the switching table without
displaying monitor dialog boxes. Both functions can be used at the same time.
This section describes monitoring via displaying monitor dialog boxes for the
selected items. Refer to the View Switching Logic section for a description of
monitoring switching table items.
NOTE: The way to access the above mentioned items for monitoring is different.
You find a detailed description in the corresponding Monitor sections. The
basic procedure is described as follows.
Assumption
Procedure
The plant is open and the communication interface is selected (B-Port or Static
Simulator).
1. Select the desired view from the View menu.
2. To monitor software or hardware points, click the point on the hardware and
software points line respectively.
To monitor z-registers select the Z-Register dropdown item from the View
menu, enter the file and index numbers into the fields in the Select Z-Register
dialog box and click Display.
RESULT:
Concurrently two dialog boxes display.
On the left-hand side of the screen, the Monitor(s) dialog box
appears.
It is shown after you activate the first item to be monitored. The
Monitor(s) dialog box controls point monitoring by providing
functions to restart monitoring, freeze monitoring, refresh screen
displays, and stop monitoring. You can also restack point/z-register
monitor dialog boxes on the right-hand side of the screen if you
moved some and want to put them all back in a column by using
cascade or tile.
23
74-3556-9 (US)
EN2B-0183 GE51 R0404 (Europe)
TYPICAL PROCEDURES
LIVE CARE
Refer to the Monitor(s) Dialog Box section for detailed description.
On the right-hand side of the screen each point/z-register selected
is diplayed in a monitor dialog box indicating that the point is
currently being initialized . For z-registers the current value is
displayed. The following figures show some monitor dialog box
examples for hardware points, software points and z-registers.
3. Click Start in the simulation software window at the bottom of the screen when
Static Simulator was selected for the communication interface. When directly
communicating with a controller via the B-Port or LonWorks communication
interface monitoring starts automatically after initializing.
RESULT:
Each point´s monitor dialog box shows the user address for the
point in the title line, its current value (for example 302.0) and
engineering unit (for example, Deg or blank), the status (for
example On or Off, Normal or Alarm). For z-registers the current
value is displayed. The current mode of the monitor dialog box is
indicated as either Auto or Manual and the LED symbol at the left
corner in one of the following colors:
• Gray
Indicates normal mode.
• Green
A point update has occurred. A z-register was polled. A zregister is polled as long as the monitor box is open and the
Freeze or Refresh option in the Monitor(s) dialog box is not
selected.
• Yellow
The point is in alarm. Note that the yellow LED shows only if
you toggle in and out of the Monitor(s) dialog box. There is
no automatic refresh.
The following figures show the monitor dialog box examples after
initializing for the corresponding hardware points, software points,
and z-registers shown above.
3. To check point/z-register functions:
•
•
74-3556-9 (US)
EN2B-0183 GE51 R0404 (Europe)
Note value and state changes (state changes for points only).
Use the Monitor(s) dialog box to stop monitoring, freeze values/statuses,
refresh values/statuses, and restart monitoring as desired. See the
Monitor(s) dialog box section for details.
24
LIVE CARE
TYPICAL PROCEDURES
•
•
Use the Fix dropdown item from the system menu (click window symbol)
in an individual point monitor dialog box to fix a point value/state as
desired (see the Fix/Unfix Points section for details).
Use the Modify dropdown item from the system menu in an individual zregister monitor dialog box to change a z-register value as desired (see
the Modify Z-Registers section for details).
4. To stop monitoring when using a simulated controller, click Stop in the
simulation software window at the bottom of the screen.
RESULT:
This stops the application program running in the simulated
controller. All monitor dialog boxes remain open on the screen.
5. To end monitoring one single point/z-register, click the system menu in the
individual monitor dialog box and select Close.
6. To end all monitoring, click Close in the Monitor(s) dialog box or select a
different plant via Open dropdown item from the File menu.
RESULT:
Special Points:
Point Monitoring Limits:
Points From Other Controllers:
This closes all monitor dialog boxes. The application program is still
running in the (simulated) controller. Click STOP in the simulation
software window if you want to stop the application program.
There are three special points that Live CARE always monitors: STARTUP,
SHUTDOWN, and EXECUTING_STOPPED. These points are automatically
attached to each EXCEL 5000 controller. You can check the status of these points
to prove that the application programs are running. Excel CARE User Guide 745587 (US) / EN2B-0182 ( Europe) describes these points and their active/passive
modes in detail. User addresses display in bold if you hold down the mouse button
while selecting a point.
You can monitor a maximum of 20 points per controller.
Live CARE connects directly to a controller and cannot look at points on other
controllers unless they are global points on the connected controller.
Intermediate Values:
You cannot monitor intermediate values between control symbols in a control
strategy loop unless you assign a software point to the values. To assign software
points, return to CARE, add a software point (to the schematic, control strategy, or
switching logic), and retranslate and download the new database to the controller.
Restart Live CARE and select that new software point for monitoring.
Reporting by Exception:
To reduce message trafficLive CARE requests that the controller only reports point
changes by exception, that is, if a point does not change value or status, the
controller does not issue a message to Live CARE.
Polling:
In case a flag point or a z-register has been selected, the displayed value in the
monitor dialog box will be polled as long as the monitor dialog box is open and the
Freeze or Refresh option in the Monitor(s) dialog box is not selected.
Positioning of monitor dialog boxes
When you scroll plant information via the scroll bar, the point display and monitor
dialog boxes remain at the same place on the screen. You cannot scroll them off the
screen. However, you can move them elsewhere. Click title line and hold down the
mouse button as you move the monitor dialog box elsewhere. Release mouse
button when it is in the desired position.
Double Monitoring
If a point/z-register is being monitored and you click it again, software does not open
another point/z-register monitor dialog box; it simply highlights the existing point/zregister monitor dialog box.
Multiple Monitoring
Start Monitoring
Software can monitor a point in a switching logic table and in a point monitor dialog
box at the same time. For z-registers this is not possible.
When using static simulator, monitoring starts after the point/z-register was selected
and the Start button in the simulation software window was clicked. When directly
connected to a controller, monitoring is running automatically after the monitor dialog
box was opened.
25
74-3556-9 (US)
EN2B-0183 GE51 R0404 (Europe)
TYPICAL PROCEDURES
LIVE CARE
Stop Monitoring a Point/Z-Register
Stop All Point/Z-Register Monitoring
If you close the point/z-register monitor dialog box (click the System menu and then
select Close, or double-click the System menu), software stops monitoring the
point/z-register.
If you close the Monitor(s) dialog box (Close button), software stops all point/zregister monitoring and removes all point/z-register monitor dialog boxes from the
screen.
Monitor(s) Dialog Box
Purpose
Path
Procedure
Control point/z-register monitoring by providing functions to restart monitoring,
freeze monitoring, refresh screen displays, and stop monitoring. You can also
restack point dialog boxes on the right-hand side of the screen if you moved some
and want to put them all back in a column by using cascade or tile:
The Monitor(s) dialog box appears after you select the first item to be monitored or
after you select a switching table in the switching logic view. It remains on display as
long as there are items being monitored.
Click desired radio button to perform the following actions:
Start
Restart monitoring, if you stopped it or chose the Freeze option. Set by default after
the dialog box is opened. When connecting directly to a controller, monitoring is
running automatically. When using the static simulation, the Start button in the
simulation software window has to be clicked on additionally. Z-registers are polled
and point updates are displayed when a value/state has changed.
Freeze
Stop updating point values/statuses in the point/z-register monitor dialog boxes. Zregisters are not polled any longer.
Refresh
Display the latest values/statuses in the point/z-register monitor dialog boxes and
then freeze the display again.
During the Freeze and Refresh states, software still updates point and z-register
values/statuses internally but the values do not display.
Z-registers are not polled any longer.
This technique allows fast updates when you restart monitoring or request a refresh.
Close
The Monitor(s) dialog box closes and all monitoring stops (point/z-registers
disappear). The current plant and view selection remain on the screen and you can
either continue or exit Live CARE.
System menu
74-3556-9 (US)
EN2B-0183 GE51 R0404 (Europe)
The System menu in the upper left corner provides the following functions when you
click the window symbol:
26
LIVE CARE
TYPICAL PROCEDURES
Move
Change cursor to the positioning cursor to move the dialog box.
Close
Stop monitoring and close the Monitor(s) dialog box. This function is the same as
the Close radio button in the Monitor(s) dialog box.
Cascade
Displays points/z-registers in cascade format. Repositions all point/z-register monitor
dialog boxes in a column down the right-hand side of the screen.
Tile
Displays points/-z-registers in tile format.
Help
Display the on-line help for the Monitor(s) dialog box.
NOTE: After selecting Cascade or Tile, Live CARE saves the last setting and uses
it during the next monitoring session.
Monitor Hardware Points
Purpose
Display hardware point value or status as it changes in the controller.
There are two ways to monitor points. The first way is to display a point monitor
dialog box that shows point value/state, engineering unit, and mode (automatic or
manual). The second way is to select a switching table in the View Switching Logic
function. Software automatically monitors all points in the switching table without
displaying monitor dialog boxes. Both functions can be used at the same time.
This section describes point monitoring via point selection. Refer to the View
Switching Logic section for a description of monitoring switching table points.
Assumption
Procedure
Application program is running in the (simulated) controller.
1. In any view (control strategy, switching logic, or user addresses), click the arrow
head on the hardware points line to monitor the desired hardware point.
RESULT:
The corresponding hardware point monitor dialog box displays
showing the user address in the title line, the current value (for
example 302.0) and engineering unit (for example, Deg or blank), or
the status (for example On or Off, Normal or Alarm). The current
mode of the monitor dialog box is indicated as either Auto or
Manual and the LED symbol at the left corner in one of the following
colors:
• Gray
Indicates normal mode.
• Green
A point update has occurred.
• Yellow
The point is in alarm. Note that the yellow LED shows only if
you toggle in and out of the Monitor(s) dialog box. There is
no automatic refresh.
The following figures are examples of displays for an analog point
and digital point respectively:
27
74-3556-9 (US)
EN2B-0183 GE51 R0404 (Europe)
TYPICAL PROCEDURES
LIVE CARE
The Monitor(s) dialog box displays if not already opened (see
Monitor(s) Dialog Box section).
2. To check point functions:
•
•
•
Note value and state changes
Use the Monitor(s) dialog box to stop monitoring, freeze values/statuses,
refresh values/statuses, and restart monitoring as desired. See the
Monitor(s) dialog box section for details
Use the Fix dropdown item from the system menu in individual point
monitor dialog boxes to fix a point value/state as desired (see the
Fix/Unfix Points section for details).
3. To stop monitoring when using a simulated controller, click Stop in the
simulation software window at the bottom of the screen.
RESULT:
This stops the application program running in the simulated
controller. All monitor dialog boxes remain open on the screen.
4. To end monitoring one single point, click the system menu in the individual point
monitor dialog box and select Close.
5. To end all monitoring, click Close in the Monitor(s) dialog box or select a
different plant via Open dropdown item from the File menu.
RESULT:
This closes all monitor dialog boxes. The application program is still
running in the (simulated) controller. Click STOP in the simulation
software window if you want to stop the application program.
Monitor Software Points
Purpose
Display software point value or status as it changes in the controller.
There are two ways to monitor points. The first way is to display a point monitor
dialog box that shows point value/state, engineering unit, and mode (automatic or
manual). The second way is to select a switching table in the View Switching Logic
function. Software automatically monitors all points in the switching table without
displaying monitor dialog boxes. Both functions can be used at the same time.
This section describes point monitoring via point selection. Refer to the View
Switching Logic section for a description of monitoring switching table points.
Assumption
Procedure
Application program is running in the (simulated) controller.
1. In any view (control strategy, switching logic, or user addresses), click the
abbreviation on the software points line to monitor the desired software point.
RESULT:
The corresponding software point monitor dialog box displays
showing the user address in the title line, the current value (for
example 0.1) and engineering unit (for example, Deg or blank), or
the status (for example On or Off, Normal or Alarm).
The current mode of the monitor dialog box is indicated as either
Auto or Manual and the LED symbol at the left corner in one of the
following colors:
• Gray
Indicates normal mode.
• Green
A point update has occurred.
• Yellow
The point is in alarm. Note that the yellow LED shows only if
you toggle in and out of the Monitor(s) dialog box. There is
no automatic refresh.
74-3556-9 (US)
EN2B-0183 GE51 R0404 (Europe)
28
LIVE CARE
TYPICAL PROCEDURES
The following figures are examples of displays for software points:
The Monitor(s) dialog box displays if not already open (see
Monitor(s) Dialog Box section).
2. To check point functions:
•
•
•
Note value and state changes
Use the Monitor(s) dialog box to stop monitoring, freeze values/statuses,
refresh values/statuses, and restart monitoring as desired. See the
Monitor(s) dialog box section for details
Use the Fix dropdown item from the system menu in individual point
monitor dialog boxes to fix a point value/state as desired (see the
Fix/Unfix Points section for details).
3. To stop monitoring when using a simulated controller, click Stop in the
simulation software window at the bottom of the screen.
RESULT:
This stops the application program running in the controller. All
monitor dialog boxes remain open on the screen.
4. To end monitoring one single point, click the system menu in the individual point
monitor dialog box and select Close.
5. To end all monitoring, click Close in the Monitor(s) dialog box or select a
different plant via Open dropdown item from the File menu.
RESULT:
This closes all monitor dialog boxes. The application program is still
running (simulated) controller. Click STOP in the simulation
software window if you want to stop the application program.
Monitor Flag Points
Purpose
Display of selected flag point value as it changes in the controller. A value is polled
as long as the monitor box is open and the Freeze or Refresh option in the
Monitor(s) dialog box is not selected. .
NOTES: Flag points can be seen as z-registers and the format of a flag point
monitor dialog box is equivalent to a z-register monitor dialog box.
The z-register and flag points access respectively can be enabled/disabled
in the CARE.INI file (see SET CARE.INI FILE ENTRIES chapter).
For modifying z-register values refer to the Modify Z-Registers section.
There are two ways to monitor flag points. The first way is to display a flag point
monitor dialog box that shows the current value. The second way is to select a
switching table in the View Switching Logic function. Software automatically monitors
all z-registers and points in the switching table without displaying monitor dialog
boxes. Both functions can be used at the same time.
This section describes point monitoring via point selection. Refer to the View
Switching Logic section for a description of monitoring switching table points.
Assumption
Procedure
Application program is running in the (simulated) controller.
1. In any view (control strategy, switching logic, or user addresses), click the
desired flag point (abbreviations are: FA = analog flag point, FD=digital flag
point) on the software points line.
29
74-3556-9 (US)
EN2B-0183 GE51 R0404 (Europe)
TYPICAL PROCEDURES
LIVE CARE
RESULT:
The Analog Flag and Digital Flag dialog box respectively displays
showing the current value of the corresponding z-register. The title
line shows the flag type (FD, FA) and the user address, for
example, FD:BoilerFailure, FA:Temperature Slope.
.
The LED symbol at the left corner indicates the current mode of the
flag point monitor dialog box:
• Gray
Indicates normal mode.
• Green
The z-register was polled. The z-register is polled as long as
the monitor box is open and the Freeze or Refresh option in
the Monitor(s) dialog box is not selected.
The Monitor(s) dialog box displays if not already open (see
Monitor(s) Dialog Box section).
2. Overwrite the current value if desired by typing the value into the New Value
field and clicking Modify. For digital flags it is only allowed to enter 0 or 1. For
analog flags it is only allowed to enter a positive or negative float number.
RESULT:
The new value is written to the z-register.
3. To check point (z-register) functions:
•
•
•
Note value changes
Use the Monitor(s) dialog box to stop monitoring, freeze values/statuses,
refresh values/statuses, and restart monitoring as desired. See the
Monitor(s) dialog box section for details
Use the Modify dropdown item from the system menu in individual point
monitor dialog boxes to change a z-register value as desired (see the
Modify Flag Points section for details).
4. To stop monitoring when using a simulated controller, click Stop in the
simulation software window at the bottom of the screen.
RESULT:
This stops the application program running in the (simulated)
controller. All monitor dialog boxes remain open on the screen.
5. To end monitoring one single point/z-register, click the system menu in the
individual monitor dialog box and select Close.
6. To end all monitoring, click Close in the Monitor(s) dialog box or select a
different plant via Open dropdown item from the File menu.
RESULT:
This closes all monitor dialog boxes. The application program is still
running in the controller. Click STOP in the simulation software
window if you want to stop the application program.
Monitor XFM Points
Purpose
Assumption
Procedures
74-3556-9 (US)
EN2B-0183 GE51 R0404 (Europe)
Display values/statuses of XFM datapoints which are internal user addresses or
parameters mapped to software points as they changed in the controller.
Application program is running in the (simulated) controller.
1. Select Control strategy from the View menu.
30
LIVE CARE
TYPICAL PROCEDURES
RESULT:
The View Control Strategy displays.
2. Select the desired control strategy including the XFM(s) and click OK.
Selecting from all XFMs
3. Select XFM-Points from the View menu, if you want to choose between all
XFMs included in the control strategy. For selecting one XFM see the Selecting
one single XFM section.
RESULT:
The Select User Address dialog box displays showing all existing
XFMs.
Each XFM is shown as unique symbol with its position in the control
loop (column, row) and its name, for example:
4. View the user addresses and the mapped parameters by clicking the plus
symbols at the XFM, Internal Data Points and Mapped Parameters symbol. If
there are no internal data points and/or mapped parameters available for the
desired XFM the Internal Data Points and/or Mapped Parameters structure can
not be expanded (see the XFM enth in the following figure).
31
74-3556-9 (US)
EN2B-0183 GE51 R0404 (Europe)
TYPICAL PROCEDURES
LIVE CARE
For Internal user addresses and mapped parameters their type, such as VA or
VD, and their name, such as Heat_Degree-Days or P08_Factor are shown.
5. Click the internal datapoint or the mapped parameter and click Display.
RESULT:
The corresponding monitor dialog box is displayed.
NOTE: Internal user addresses can be assigned to software and hardware
points in CARE. For monitoring see the Monitor Hardware Points and
Monitor Software Points sections respectively. Since parameters can
only be mapped to software points (except flag points) refer to the
Monitor Software Points section for monitoring mapped parameters.
Selecting one single XFM
1. After selection of the control loop as described in step 1 and 2, open the Symbol
Information dialog box by clicking the control symbol with the left mouse button.
or
Display the context menu by clicking the control symbol with the right mouse
button.
4. In the Symbol Information dialog box, click Internal User Addresses and
Mapped Parameters and confirm by clicking OK. In the context menu, click
Datapoints.
74-3556-9 (US)
EN2B-0183 GE51 R0404 (Europe)
32
LIVE CARE
TYPICAL PROCEDURES
RESULT:
The Select User Adress dialog box displays showing all internal
user addresses and mapped parameters of the selected XFM.
If there are no internal data points and/or mapped parameters available for the
desired XFM the Internal Data Points and/or Mapped Parameters structure is
not expanded.
For Internal user addresses and mapped parameters their type, such as VA or
VD, and their name, such as Heat_Degree-Days or P08_Factor are shown.
5. Click the internal datapoint or the mapped parameter and dick Display.
RESULT:
The corresponding monitor dialog box is displayed.
NOTE: Internal user addresses can be assigned to software and hardware
points in CARE. For monitoring see the Monitor Hardware Points and
Monitor Software Points sections respectively. Since parameters can
only be mapped to software points (except flag points) refer to the
Monitor Software Points section for monitoring mapped parameters.
Search for Datapoints via Keyboard
Purpose
Procedure
Quick search to find special datapoint name (mapped parameter or internal
datapoint) in the Select User Address dialog box.
1. In the Select User Address dialog box, type the complete name or single
characters (search entry) of the datapoint name you want to find.
RESULT:
CARE automatically finds the first name that matches the search
entry. CARE finds matched datapoint names in closed folders too.
If a datapoint name you search for is not found, CARE continues
searching with the next search entry you enter. CARE does not
distinguish between upper-case and lower-case letters except on
umlauts or country specific characters.
2. To find the next name that matches the same search entry click the asterics (*).
3. To find a different datapoint name enter the new search entry.
Monitor Points in “No Response” Mode
33
74-3556-9 (US)
EN2B-0183 GE51 R0404 (Europe)
TYPICAL PROCEDURES
LIVE CARE
Purpose
.
Display of a DIO hardware point value/status, which is in “no response” mode, which
means that the communication between DIO module and controller is interruppted.
A hardware point in “no response mode” can be changed to manual or automatic
mode and fixed respectively. Refer to the Fix/Unfix Points section for fixing a point in
“no response” mode.
NOTE: Monitoring hardware points in “no response” mode can only be accessible
when Live CARE communicates directly with a controller via
B port.
Assumption
Procedure
Application program is running in the controller.
The procedure for monitoring a hardware point in no response mode is parallel to
monitoring a normal hardware point (see the Monitor Hardware Points section). In
comparison to a hardware point which is not in no response mode, the monitor
dialog box for a point in no response mode additionally shows only a “no response”
symbol to the right hand side of the LED symbol.
Monitor Points in “Manual Override” Mode
Purpose
.
Display value and status of a hardware point, which is in “manual override” by a
distributed IO (DIO) Module (XFR 522 or XFR 524). This concerns only the DO and
AO types of the DIO modules.
NOTES: A hardware point in “manual override” mode is in remote mode and cannot
be changed to manual or automatic mode and fixed respectively.
Monitoring hardware points in “manual override” mode can only be
accessible when Live CARE communicates directly with a controller via
B port.
There are two ways to monitor points. The first way is to display a point monitor
dialog box that shows point value/state, engineering unit, and mode (automatic or
manual). The second way is to select a switching table in the View Switching Logic
function. Software automatically monitors all points in the switching table without
displaying monitor dialog boxes. Both functions can be used at the same time.
This section describes point monitoring via point selection. Refer to the View
Switching Logic section for a description of monitoring switching table points.
Assumption
Procedure
Application program is running in the controller.
1. In any view (control strategy, switching logic, or user addresses), click the arrow
head on the hardware points line to monitor the desired DIO hardware point.
RESULT:
The corresponding monitor dialog box displays showing the user
address in the title line, the current value (for example, 302.0) and
the engineering unit (for example, Deg or blank), or status (for
example, ON or OFF, Normal or Alarm . If a selected point is in
manual override, the hand symbol at the left side and the term
“Remote” indicates this.
The LED symbol at the left corner indicates the current mode of the
monitor dialog box:
• Gray
Indicates normal mode.
• Green
74-3556-9 (US)
EN2B-0183 GE51 R0404 (Europe)
34
LIVE CARE
TYPICAL PROCEDURES
A point update has occurred.
• Yellow
The point is in alarm. Note that the yellow LED shows only if
you toggle in and out of the Monitor(s) dialog box. There is
no automatic refresh.
The Monitor(s) dialog box displays if not already opened (see
Monitor(s) Dialog Box section).
IMPORTANT
It is not possible to fix a hardware point which is in “manual override” mode.
2. To check point functions:
•
•
Note value and state changes
Use the Monitor(s) dialog box to stop monitoring, freeze values/statuses,
refresh values/statuses, and restart monitoring as desired. See the
Monitor(s) dialog box section for details
3. To stop monitoring when using a simulated controller, click Stop in the
simulation software window at the bottom of the screen.
RESULT:
This stops the application program running in the controller. All
monitor dialog boxes remain open on the screen.
4. To end monitoring one single point/, click the system menu in the individual
point monitor dialog box and select Close.
5. To end monitoring, click Close in the Monitor(s) dialog box or select a different
plant via Open dropdown item from the File menu.
RESULT:
This closes all monitor dialog boxes. The application program is still
running in the (simulated) controller. Click STOP in the simulation
software window if you want to stop the application program.
Monitor Z-Registers
Purpose
Display of a selected z-register value as it changes in the controller. The value is
polled as long as the monitor dialog box is open (green LED symbol is flashing) and
the Freeze or Refresh option in the Monitor(s) dialog box is not selected. Refer to
the Modify Z-Registers section for modifying z-registers.
NOTES: Z-registers access can be enabled/disabled in the CARE INI file (see SET
CARE.INI FILE ENTRIES chapter).
Z-registers can be accessed in general, from special flag points, and from
XFMs. With the procedure described in this section you can select and
monitor any existing z-register. For this you must know the file and index
number from the z-register you want to monitor.
There are two ways to monitor z-registers. The first way is to display a z-register
monitor dialog box that shows the current value. The second way is to select a
switching table in the View Switching Logic function. Software automatically monitors
all z-registers and points in the switching table without displaying monitor dialog
boxes. Both functions can be used at the same time.
Refer to the Monitor Flag Points section for directly monitoring z-registers of flag
points and to the Monitor XFM Z-Registers section for directly monitoring z-registers
of an XFM.
Assumption
Procedure
Application program is running in the (simulated) controller.
1. In any view (control strategy, switching logic, or user addresses), choose ZRegisters from the View menu. The Select Z-Register dialog box displays.
35
74-3556-9 (US)
EN2B-0183 GE51 R0404 (Europe)
TYPICAL PROCEDURES
LIVE CARE
2. Into the Z-Register File field enter the desired number.
3. Into the Z-Register Index field enter the desired number.
NOTE: The fields for file and index do accept numbers (0 …9) only and up to
3 characters. The z-register number is equal to the parameter file
number of the submodule that contains the z-register. The parameter
list printout shows which file number is assigned to which submodule.
4. Click Display.
RESULT:
The corresponding monitor dialog box displays showing the current
value of the z-register. The title line displays z-register identification
in brackets (file number, index).
The LED symbol at the left corner indicates the current mode of the
z-register monitor dialog box:
• Gray
Indicates normal mode.
• Green
The z-register was polled. The z-register is polled as long as
the monitor box is open and the Freeze or Refresh option in
the Monitor(s) dialog box is not selected.
5. To check z-register functions:
•
•
•
Note value changes
Use the Monitor(s) dialog box to stop monitoring, freeze values, refresh
values, and restart monitoring as desired. See the Monitor(s) dialog box
section for details
Use the Modify dropdown item from the system menu in individual zregister monitor dialog boxes to change a z-register value as desired
(see the Modify Z-Registers section for details).
6. To stop monitoring when using a simulated controller, click Stop in the
simulation software window at the bottom of the screen.
RESULT:
This stops the application program running in the controller. All
monitor dialog boxes remain open on the screen.
7. To end monitoring one single z-register, click the system menu in the individual
z-register monitor dialog box and select Close.
8. To end all monitoring, click Close in the Monitor(s) dialog box or select a
different plant via Open dropdown item from the File menu.
RESULT:
This closes all monitor dialog boxes. The application program is still
running in the (simulated) controller. Click STOP in the simulation
software window if you want to stop the application program.
Monitor XFM Z-Registers
74-3556-9 (US)
EN2B-0183 GE51 R0404 (Europe)
36
LIVE CARE
TYPICAL PROCEDURES
Purpose
Display of an XFM z-register value as it changes in the controller. The value is
polled as long as the monitor dialog box is open (green LED symbol is flashing) and
the Freeze or Refresh option in the Monitor(s) dialog box is not selected.
Z-registers can be accessed in general, from flag points, and from XFMs. With the
procedure described in this section you can select and monitor z-registers from any
XFM control symbol. For modifying an XFM z-register refer to the Modify XFM ZRegisters section.
NOTE: The Z-Registers option in the Symbol Infomation dialog box is not visible,
if z-registers access is disabled in the CARE.INI file (see SET CARE.INI
FILE ENTRIES chapter).
Assumption
Procedure
Application program is running in the (simulated) controller.
1. Select Control Strategy from the View menu.
RESULT:
The View Control Strategy displays.
2. Select the desired control strategy and click OK.
RESULT:
The control strategy displays.
3. Click the symbol with the left mouse button.
RESULT:
The Symbol Information dialog box displays.
or
Click the symbol with the right mouse button to open the context menu.
4. In the Symbol Information dialog box select Z-Registers and confirm by clicking
OK. In the context menu click Z-Register.
37
74-3556-9 (US)
EN2B-0183 GE51 R0404 (Europe)
TYPICAL PROCEDURES
LIVE CARE
RESULT:
The Select Z-Register dialog box displays. The dialog caption
shows the XFM position in the control strategy in brackets (column,
row). The z-register file number is already set to match the XFM.
5. Enter the z-register index into the Z-Register Index field.
NOTE: The field do accept numbers (0 …9) only and up to 3 characters. The
Z-Register File field is disabled.
6. Click Display
RESULT:
The corresponding monitor dialog box displays showing the current
value of the z-register. The title line displays the XFM name,
followed by the position in brackets (column, row), followed by the
z-register identification in brackets (file number, index number).
The LED symbol at the left corner indicates the current mode of the
monitor dialog box:
• Gray
Indicates normal mode.
• Green
The z-register was polled. The z-register is polled as long as
the monitor box is open and the Freeze or Refresh option in
the Monitor(s) dialog box is not selected.
The Monitor(s) dialog box displays if not already opened (see
Monitor(s) Dialog Box section).
7. To check z-register functions:
•
•
•
Note value changes
Use the Monitor(s) dialog box to stop monitoring, freeze values, refresh
values, and restart monitoring as desired. See the Monitor(s) dialog box
section for details
Use the Modify dropdown item from the system menu in individual zregister monitor dialog boxes to change a z-register value as desired
(see the Modify Z-Registers section for details).
8. To stop monitoring when using a simulated controller, click Stop in the
simulation software window at the bottom of the screen.
RESULT:
This stops the application program running in the simulated
controller. All monitor dialog boxes remain open on the screen.
9. To end monitoring one single z-register, click the system menu in the individual
z-register monitor dialog box and select Close.
10. To end all monitoring, click Close in the Monitor(s) dialog box or select a
different plant via Open dropdown item from the File menu.
74-3556-9 (US)
EN2B-0183 GE51 R0404 (Europe)
38
LIVE CARE
TYPICAL PROCEDURES
RESULT:
This closes all monitor dialog boxes. The application program is still
running in the (simulated) controller. Click STOP in the simulation
software window if you want to stop the application program.
Fix/Unfix Points
Purpose
To fix a point means to change point mode from automatic to manual. To unfix a
point means to change point mode from manual to automatic. Automatic (Auto) tells
the system to update point value/status according to sensor or actuator readings.
“Manual” allows you to assign a point value/status that the system cannot change.
For example, you can assign a low value to an outdoor air temperature point to see
how the controller will react.
The following points can be fixed/unfixed:
• Hardware points
• Software points
• Internal user addresses and mapped parameters of XFMs
IMPORTANT
Software maintains the manual value or status for the point and does not
change it until you change point mode to Auto.
Procedures
1. Begin monitoring the point you want to fix (if it is not already being monitored).
The Monitoring section describes monitoring for hardware, software and XFM
points. The View Switching Logic section describes monitoring for switching
tables.
Fix a point
2. To fix a point that has a point dialog box (that is, non-switching table points),
click the System menu in the monitor point dialog box and select Fix Point.
RESULT:
A check mark is added to the Fix Point dropdown item.
NOTE: The monitor dialog box remains open as long as the Fix Point
dropdown item is checked irrespective of whether the point is in
manual (fixed) or automatic mode (unfixed). In order to fix or unfix a
point the Fix Point dropdown item must be checked.
To fix a switching table point, click point value/state in the gray area in the
switching table.
RESULT:
The point monitor dialog box displays with Manual/Auto options.
User address displays in the dialog box title line. Point value/status,
engineering unit, and mode display in the dialog box.
3. To assign a value or status, click Manual. Then, for an analog point, type
desired value in the field to the right of Manual. For a digital point, type desired
status in the field to the right of Manual, or click down arrow to display possible
39
74-3556-9 (US)
EN2B-0183 GE51 R0404 (Europe)
TYPICAL PROCEDURES
LIVE CARE
statuses and click one to select it. For a flex point, click selections relevant to
the point.
NOTE: You cannot change value or status unless you select Manual.
4. Click Command to save settings.
RESULT:
Unfix a Point
The point remains at that value/status until you unfix it.
1. Begin monitoring the point you want to unfix (if it is not already being
monitored).
2. To unfix a point that has a point dialog box (that is, non-switching table points),
click the System menu in the monitor point dialog box and click Fix Point if not
already checked.
To unfix a switching table point, click point value/state in the gray area in the
switching table.
3. Click Auto.
4. Click Command to save settings.
RESULT:
Error Messages
Points Remain in Manual Mode
Software begins updating point value/status according to its
sensor/actuator setting.
If the controller returns an error message from an invalid command (for example,
point command value out of range....), Live CARE displays the message with the
appropriate data.
When you close a plant, software displays the following dialog box asking if you want
to scan for points in Manual Mode.
If you click No, any points set to Manual Mode remain in that mode.
Points Return to Auto Mode
1. Click Yes to return points in Manual Mode to Auto Mode.
RESULT:
The Scanning Points message box displays.
After all points in the project have been scanned for Manual Mode,
the Change Points to Auto Mode dialog box displays.
74-3556-9 (US)
EN2B-0183 GE51 R0404 (Europe)
40
LIVE CARE
TYPICAL PROCEDURES
2. To change points back to Auto Mode, highlight the desired points with SHIFT
and left mouse button and click OK.
RESULT:
The selected points are returned to Auto Mode and the dialog box
closes.
NOTE: The Change Points to Auto Mode function is not available when using
the static simulator.
Modify Flag Points
Purpose
Change a z-register value from a flag point. Modifiying a z-register value is different
from the “Fix” mechanism for points, because the value is only written to the
controller once and is not maintained afterwards. After the next poll cycle the
previous value is established.
For modifiying z-registers in general refer to the Modify Z-Registers section. For
modifying z-registers of XFMs refer to the Modify XFM Z-Registers section.
Assumption
Procedure
Application program is running in the (simulated) controller.
1. In any view (control strategy, switching logic, or user addresses), click the
desired flag point (abbreviations are: FA = analog flag point, FD=digital flag
point) on the software points line.
RESULT:
The Analog Flag and Digital Flag dialog box respectively displays
showing the current value of the corresponding z-register.
41
74-3556-9 (US)
EN2B-0183 GE51 R0404 (Europe)
TYPICAL PROCEDURES
LIVE CARE
2. Click the system menu (window symbol) at the upper left corner and select
Modify.
RESULT:
The additional New value field and the Modify button appears. A
check mark is added to the Modify dropdown item in the system
menu.
NOTE: The monitor dialog box remains open as long as the Modify dropdown
item is checked. In order to modify a flag point the Modify dropdown
item must be checked.
3. Enter the new value and click Modify. For digital flags it is only allowed to enter
0 or 1. For analog flags it is only allowed to enter a positive or negative float
number.
RESULT:
The new value is written to the z-register.
NOTE: Modifiying a value is different from the "Fix" mechanism on points,
because the value is only written to the controller once and is not
maintained afterwards. While your application program is running it
could seem as if the modified value is not accepted. That stems from
the fact that the RACL application program has in the meantime
already overwritten the value you entered, for example see the
following monitor dialog box.
Modify Z-Registers
Purpose
74-3556-9 (US)
EN2B-0183 GE51 R0404 (Europe)
Change a z-register value. With the procedure described in this section you can
select and modify any existing z-register, that is, z-registers in general, from flag
points and from XFMs. For this you must know the file and index number from the zregister you want to monitor.
42
LIVE CARE
TYPICAL PROCEDURES
Modifiying a z-register value is different from the "Fix" mechanism for points,
because the value is only written to the controller once and is not maintained
afterwards. After the next poll cycle the previous value is established.
For modifiying z-registers of flag points or XFMs refer to the Modify Flag Points and
Modify XFM Z-Registers sections respectively.
Assumption
Procedure
Application program is running in the (simulated) controller.
1. In any view (control strategy, switching logic, or user addresses), choose ZRegisters from the View menu. The Select Z-Register dialog box displays.
2. Into the Z-Register File field enter the desired number.
3. Into the Z-Register Index field enter the desired number.
NOTE: The fields for file and index do accept numbers (0 …9) only and up to
3 characters.
4. Click Display.
RESULT:
The corresponding z-register monitor dialog box displays showing
the current value of the z-register.
5. Click the system menu (window symbol) at the upper left corner and select
Modify.
RESULT:
The additional New value field and the Modify button appears. A
check mark is added to the Modify dropdown item in the system
menu.
NOTE: The monitor dialog box remains open as long as the Modify dropdown
item is checked. In order to modify a z-register the Modify dropdown
item must be checked.
6. Enter the new value and click Modify. For digital flags it is only allowed to enter
0 or 1. For analog flags it is only allowed to enter a positive or negative float
number.
RESULT:
The new value is written to the z-register.
43
74-3556-9 (US)
EN2B-0183 GE51 R0404 (Europe)
TYPICAL PROCEDURES
LIVE CARE
NOTE: Modifiying a value is different from the "Fix" mechanism on points,
because the value is only written to the controller once and is not
maintained afterwards. While your application program is running it
could seem as if the modified value is not accepted. That stems from
the fact that the RACL application program has in the meantime
already overwritten the value you entered, for example see the
following monitor dialog box.
View/Change Symbol Information
Purpose
View/Change the following items from control strategy symbols:
• Inputs
• Internal parameters
• Internal user addresses, mapped parameters, and z-registers of XFMs
NOTE: Not all items are necessarily available for each control strategy symbol. For
example, only XFMs have internal user addresses and mapped
parameters. The Z-Registers option is generally not available, if z-registers
access is disabled in the CARE.INI file (see SET CARE.INI FILE ENTRIES
chapter).
Procedure
Symbol Information can be accessed in two ways:
1. First, if not already opened, open the control strategy by clicking View and then
dropdown item Control strategy.
2. Click the symbol with left mouse button to open the Symbol Information dialog
box.
or
Click the symbol with the right mouse button to display the following context
menu.
74-3556-9 (US)
EN2B-0183 GE51 R0404 (Europe)
44
LIVE CARE
TYPICAL PROCEDURES
Items which are not availbable for the selected symbol are disabled, that is, gray in
the Symbol Information dialog box and totally missing in the context menu.
For example, The Inputs option is inactive/missing, if there are no “entered-value”
inputs for the symbol. For example, if all inputs to a PID are outputs from other
symbols, physical points, or pseudopoints, the Inputs option is gray. Parameters is
inactive/missing, if the symbol does not provide any parameters to assign. Internal
User Addresses and Mapped Parameters as well as z-registers are inactive/missing
unless the symbol selected is an XFM.
3. Select the desired item by clicking the radio button in the Symbol Information
dialog box and by clicking the option in the context menu respectively.
Refer to the following sections for viewing/changing the corresponding items (Inputs,
Parameters etc.) of a control symbol.
View/Change Symbol Inputs
Purpose
Procedure
View/Change input parameter values for a control symbol in the plant control
strategy.
During control symbol assignment in Excel CARE, you assign inputs and outputs for
control symbols. Live CARE allows you to change these input parameters and save
them to the CARE database and controller.
1. Open the Symbol Information dialog box by clicking the control symbol with the
left mouse button or display the context menu by clicking the control symbol
with the right mouse button.
2. In the Symbol Information dialog box, click Inputs and confirm by clicking OK. In
the context menu, click Inputs.
RESULT:
The Input Parameters dialog box displays. For example, for a PID
control symbol, the following dialog box can display:
NOTE: The dialog box is the same as in Excel CARE except for the addition of
the Update CARE database check box. If this box has a checkmark,
Live CARE writes any changes you make to the CARE database when
you click OK. If the box does not have a checkmark, changes you
make are not saved in the database, when you leave Live CARE.
45
74-3556-9 (US)
EN2B-0183 GE51 R0404 (Europe)
TYPICAL PROCEDURES
LIVE CARE
3. In Input Parameters dialog boxes of I/Os, you can change any input that is a
parameter only if the input box does not have an x. If there is a checkmark, you
cannot change it. You also cannot change an input point into a parameter or
vice versa. If you need to make those changes, use Excel CARE. There are
also special conditions for the RAMP and SEQ control icons and for XFMs. See
the RAMP and SEQ Operation note following this procedure. For changing
Internal user addresses, mapped parameters , and z-registers of XFMs see the
Change XFM Internal User Addresses and Mapped Parameters and Modify
XFM Z-Registers sections respectively.
4. Click OK to save changes and update the controller file. If the Update CARE
database check box has a checkmark, software also updates the CARE
database. Otherwise, software only updates the controller. The check box
defaults to checkmark (always update the CARE database).
RESULT:
RAMP and SEQ Operation
The dialog box closes and the View Control Strategy window
displays.
In CARE, you define minimum and maximum inputs and outputs as well as a ratio.
The controller does not store these values. It stores minimum and maximum outputs
and translated values that represent slope and y intercept. The following formulas
represent the controller translation:
SLOPE =
MaxOutput — MinOutput
MaxInput — MinInput
Y INTERCEPT =
MinOutput
Slope * MinInput
View/Change Symbol Parameters
Purpose
View/Change internal parameter values for a control symbol in the plant control
strategy.
During control symbol assignment in Excel CARE you assign internal parameters for
some symbols related to the symbol function, for example, proportional band and
derivative time for the Proportional-Integral-Derivative (PID) symbol. Live CARE
allows you to change these internal parameters and save them to the CARE
database and controller.
Procedure
1. Open the Symbol Information dialog box by clicking the control symbol with the
left mouse button or display the context menu by clicking the control symbol
with the right mouse button.
2. In the Symbol Information dialog box, click Parameters and confirm by clicking
OK. In the context menu, click Parameters.
RESULT:
74-3556-9 (US)
EN2B-0183 GE51 R0404 (Europe)
The corresponding dialog box for internal parameters displays. The
following figures show an example for a PID and an XFM control
symbol.
46
LIVE CARE
TYPICAL PROCEDURES
Note that the dialog boxes are the same as in Excel CARE except
for the addition of the Update CARE database check box. If this box
has a checkmark, Live CARE writes any changes you make to the
CARE database when you click OK. If the box does not have a
checkmark, changes you make are not saved in the database,
when you leave Live CARE.
Also, parameters dialog boxes include an information line at the
bottom of the dialog box that shows the valid value range for the
currently selected item.
The parameter dialog box of an XFM shows the parameters with its
index, value and unit. All parameters that are mapped to data points
are marked as mapped by an asterics. The corresponding datapoint
is displayed in the Mapped to: line when selecting the parameter in
the list.
Control symbols other than XFMs
3. To change parameters for a symbol other than an XFM, enter the desired value
into the field. You can change any of the parameters that are framed. Unframed
Parameters are static text and cannot be changed.
NOTE: Live CARE does not do any error checking for validity.
47
74-3556-9 (US)
EN2B-0183 GE51 R0404 (Europe)
TYPICAL PROCEDURES
LIVE CARE
4. Click OK to save changes and update the controller file. If the Update CARE
database check box has a checkmark, software also updates the CARE
database. Otherwise, software only updates the controller. The check box
defaults to a checkmark (always update the CARE database).
RESULT:
XFM control symbols
The parameter dialog box closes and the View Control Strategy
window displays.
3. To change a parameter of an XFM control symbol, click the parameter, enter
the new value into the New Value field and click Modify.
RESULT:
Software starts limit checking. If the new value is within the range
as shown in the information line at the bottom of the dialog box, it is
accepted without a warning. If the value exceeds the high or low
limit a warning dialog box appears asking if you reallly want to
change the value.
4. Clicking Yes accepts the new value, clicking No discards the new value.
NOTE: The limits are float values stored in the *.csd file for each XFM.
5. Click OK to confirm the modified parameter.
6. Click OK in the parameter dialog box to save changes and update the controller
file. If the Update CARE database check box has a checkmark, software also
updates the CARE database. Otherwise, software only updates the controller.
The check box defaults to a checkmark (always update the CARE database).
RESULT:
The parameter dialog box closes and the View Control Strategy
window displays.
Change XFM Internal User Addresses and Mapped Parameters
Purpose
Procedure
Change values/statuses of XFM datapoints which are internal user addresses or
mapped to parameters.
1. Open the Symbol Information dialog box by clicking the control symbol with the
left mouse button or display the context menu by clicking the control symbol
with the right mouse button.
2. In the Symbol Information dialog box, click Internal User Addresses and
Mapped Parameters and confirm by clicking OK. In the context menu, click
Datapoints.
RESULT:
74-3556-9 (US)
EN2B-0183 GE51 R0404 (Europe)
The Select User Adress dialog box displays showing all internal
user addresses and mapped parameters of the selected XFM.
48
LIVE CARE
TYPICAL PROCEDURES
The XFM is displayed prefixed by the position of the XFM in the control strategy
(column, row). If there are no internal data points and/or mapped parameters
available for the desired XFM the Internal Data Points and/or Mapped
Parameters structure is not expanded.
3. Click the internal datapoint or the mapped parameter and dick Display.
RESULT:
Fix Point
The corresponding monitor dialog box is displayed.
4. For changing value/status of the internal datapoint or the mapped parameter
click the System menu in the monitor point dialog box and select Fix Point.
RESULT:
A check mark is added to the Fix Point dropdown item. The point
monitor dialog box displays with Manual/Auto options.
5. To assign a value or status, click Manual. Then, for an analog point, type
desired value in the field to the right of Manual. For a digital point, type desired
status in the field to the right of Manual, or click down arrow to display possible
statuses and click one to select it. For a flex point, click selections relevant to
the point.
NOTE: You cannot change value or status unless you select Manual.
6. Click Command to save settings.
RESULT:
Unfix Point
The point remains at that value/status until you unfix it.
1. To unfix a internal user address or a mapped parameter, click the System menu
in the monitor point dialog box and click Fix Point if not already checked.
49
74-3556-9 (US)
EN2B-0183 GE51 R0404 (Europe)
TYPICAL PROCEDURES
LIVE CARE
2. Click Auto.
3. Click Command to save settings.
RESULT:
Software begins updating point value/status according to its
sensor/actuator setting.
Modify XFM Z-Registers
Purpose
Procedure
View/Change z-register values of an XFM symbol in the plant control strategy.
1. Open the Symbol Information dialog box by clicking the XFM symbol with the
left mouse button or display the context menu by clicking the XFM symbol with
the right mouse button.
2. In the Symbol Information dialog box, click Z-Registers and confirm by clicking
OK. In the context menu, click Z-Registers.
RESULT:
The Select Z-Register dialog box displays.
3. Enter the z-register index into the Z-Register Index field.
NOTE: The field do accept numbers (0 …9) only and up to 3 characters. The
Z-Register File field is disabled and cannot be changed.
4. Click Display.
RESULT:
The corresponding monitor dialog box displays showing the current
value of the z-register. The title line displays the symbol name, Z
and the file and index number from the z-register.
5. Click the system menu (window symbol) at the upper left corner and select
Modify.
RESULT:
The additional New value field and the Modify button appears. A
check mark is added to the Modify dropdown item in the system
menu.
NOTE: The monitor dialog box remains open as long as the Modify dropdown
item is checked. In order to modify a z-register the Modify dropdown
item must be checked.
6. Enter the new value and click Modify. For digital flags it is only allowed to enter
0 or 1. For analog flags it is only allowed to enter a positive or negative float
number.
74-3556-9 (US)
EN2B-0183 GE51 R0404 (Europe)
50
LIVE CARE
TYPICAL PROCEDURES
RESULT:
The new value is written to the z-register.
NOTE: Modifiying a value is different from the "Fix" mechanism on points,
because the value is only written to the controller once and is not
maintained afterwards. While your application program is running it
could seem as if the modified value is not accepted. That stems from
the fact that the RACL application program has in the meantime
already overwritten the value you entered, for example see the
following monitor dialog box.
51
74-3556-9 (US)
EN2B-0183 GE51 R0404 (Europe)
LIVE CARE
SET CARE.INI FILE ENTRIES
Besides others the following entries concerning z-registers are relevant for Live
CARE and can be changed:
Z-Register Access
Z-registers access can be set in the [User Privileges] section as follows:
Example:
[User Privileges]
CanAccessZRegs=1
The “CanAccessZRegs” entry must be set to 1 to enable z-register access. No, off
or 0 disables z-register access. If access is disabled the Z-Registers dropdown item
from the View menu and the Z-Registers option in the Symbol Information dialog box
is not visible. In addition, disabled z-register access effects flag points, that they also
can not be accessed.
Z-Register Poll Cycle
The minimum time between 2 z-register poll actions can be set in the [LiveCARE]
section as follows:
Example:
[LiveCARE]
MinZRegisterPollCycle=5 ; time value in seconds
The value is read as integer number and values less than 1 will be treated as 1.
Default value is 5 seconds.
Password
The password can be set in the [LCDisp Goodies] section:
[LCDisp Goodies]
XL500DefaultPassword=3333
The pasword can be set to a 4 digit numeric value. Default value is 3333.
Port, Interface
The default selection for the Port and Interface options in the Communications
dialog box can be set in the [LCDisp Goodies] section as follows:
[LCDisp Goodies]
XL500SetPortDefault=1
XL500SetSimulatorDefault=1
The PortDefault can be set to 1 through 4. 1 sets COM1, 2 sets COM2 to default
port, etc.
The SimulatorDefault can be set to 0 or 1. 1 sets the Simulator to the default
Interface, 0 sets the B-Port to the default interface.
Procedure
1. Double-click the CARE.INI file in the WINDOWS folder (by default) to open
the file via Notepad Editor.
2. Edit the desired entries and select Save from the File menu.
74-3556-9 (US)
EN2B-0183 GE51 R0404 (Europe)
52
LIVE CARE
TYPICAL PROCEDURES
53
74-3556-9 (US)
EN2B-0183 GE51 R0404 (Europe)
LIVE CARE
ERROR MESSAGES
This chapter lists error messages that may display during Live CARE operation
and describes possible causes. In addition, a second error message table lists
error messages that may occur while you are running a simulation in Live CARE.
General Error Messages
Error Message
Out of local memory
Out of global memory
Cannot connect to network, no devices on
network
Controller Name mismatch
Cannot determine controller type
No valid comm ports in system
Invalid LDVSLTA.SYS driver in config.sys
Too many switching logic monitors
Data Server has disconnected
Unable to Connect to Data Server
Unable to get the data from the controller
Error assigning address to the controller
Unable to enter service pin mode
Controller already in use
Comm Manager not logged into controller
No SLTA Network Management Nodes
available
Error on i/f port
No message within timeout period
Specified key already exists
Error occurred accessing network
Could not verify delivery of message to dest
Message not received within specified
timeout period
Cannot determine controller type
74-3556-9 (US)
EN2B-0183 GE51 R0404 (Europe)
Possible Causes
Windows cannot allocate any local memory. Exit Windows and re-start your
computer.
Windows cannot allocate any global memory. Exit the application and close
other applications to free more memory.
Exit the Commissioning Tool and add devices to the network using CARE.
The Controller and CARE database have different names. You are probably
attached to the wrong controller.
Controller files not found. Retranslate controller.
Your computer’s communication port(s) are already in use or improperly
configured.
The SLTA Driver is corrupted. Reboot the PC. If that does not work, reinstall
Live CARE.
Switching Logic Monitors are monitors just like the Point Monitors. The
controller in use may have a point display limitation.
The Data Server has disconnected prematurely. Exit Live CARE and restart.
The Data Server will not start. Exit Live CARE. If the LCSRVR icon is still
active, close it.
The Communications Manager for the controller type is failing the Advise
Request for point updates. The controller in use may have a point display
limitation.
The Communications Manager is failing the address assignment. The
controller may not be responding.
Exit and restart Live CARE.
Another tool is logged into the device that you are trying to access. Wait until
the other tool has logged out of the device and try again. If no other tool is
logged in, wait for device to time out on login (usually 1 minute) and try again.
Connection with device has failed. Check power to device, wiring, SLTA or BPort connection, and power.
Exceeded limit of SLTA devices on network. Remove one or more SLTAs from
network and try again.
Cannot communicate to SLTA or B-Port. Check power to interface device and
wiring connection.
Device is not responding to message. Check connection between interface
device and network. Check network connection to device. Verify device is
powered. You may need to cycle power on device.
Detected duplicate ID for device. Use different physical device or remove other
device from network using Network Configuration in CARE.
Cannot communicate to SLTA or B-Port. Check power to interface device and
wiring connection. You may need to cycle power on SLTA.
Device is not responding to message. Check connection between interface
device and network. Check network connection to device. Verify device is
powered. You may need to cycle power on device.
Device is not responding to message. Check connection between interface
device and network. Check network connection to device. Verify device is
powered. You may need to cycle power on device.
Controller files not found. Retranslate controller.
54
LIVE CARE
ERROR MESSAGES
Simulation Error Messages
The following errors can display in unusual circumstances.
Your first step in most cases is to verify that the CARE data file for the selected
controller was translated after the last changes were made so that all data file
parameters are correct and up-to-date. If the same error displays after a new
translation, contact the Honeywell Technical Assistance Center.
Error Message
" Bad ""defined"" constant Parameter"
(characters) String passed in was too long
(file name) File existence error
(file name) File I/O Error
(file name) File size is larger than maximum
(file name) has a bad checksum
(file name) has a short file header
(file name) is too long to load
(file name) is truncated
(file name) Memory error
(file name) was not found
(name) Controller File is not open
(name) Header Version incorrect
(name) Illegal application ID
(name) Padding state is wrong
(name) Section open status error
(name) The handle could not be locked
(name) Unknown section ID referenced
(name) Write protection status wrong
A controller is already connected to Live
CARE!
Disconnect the controller or change the
simulator service name (Port).
Cannot determine controller type
Current version is: Simulator %1 Excel
Controller %2
DDE Server Error
Unknown Topic.
DDE Server Error
Unknown System conversation OnRequest
item.
DDE Server Error
Unknown Live Care conversation
OnRequest item.
DDE Server Error
Digital point state text length invalid.
Possible Cause
Design error. Report to Honeywell Technical Assistance Center.
Design error. Report to Honeywell Technical Assistance Center.
The named controller file is missing from the CARE directory. Retranslate the
controller. If error persists, contact the Honeywell Technical Assistance
Center.
Hardware error.
The named file is not an application file or is corrupted. Retranslate the
controller. If error persists, contact the Honeywell Technical Assistance
Center.
The file is not an application file or is corrupted. Retranslate the controller. If
error persists, contact the Honeywell Technical Assistance Center.
The file is not an application file or is corrupted. Retranslate the controller. If
error persists, contact the Honeywell Technical Assistance Center.
The file is not an application file or is corrupted. Retranslate the controller. If
error persists, contact the Honeywell Technical Assistance Center.
The file is not an application file or is corrupted. Retranslate the controller. If
error persists, contact the Honeywell Technical Assistance Center.
Design error. Report to Honeywell Technical Assistance Center.
The file does not exist. Retranslate the controller. If error persists, contact the
Honeywell Technical Assistance Center.
The file is not an application file or is corrupted. Retranslate the controller. If
error persists, contact the Honeywell Technical Assistance Center.
The file is not an application file or is corrupted. Retranslate the controller. If
error persists, contact the Honeywell Technical Assistance Center.
The file is not an application file or is corrupted. Retranslate the controller. If
error persists, contact the Honeywell Technical Assistance Center.
The file is not an application file or is corrupted. Retranslate the controller. If
error persists, contact the Honeywell Technical Assistance Center.
The file is not an application file or is corrupted. Retranslate the controller. If
error persists, contact the Honeywell Technical Assistance Center.
Design error. Report to Honeywell Technical Assistance Center.
The file is not an application file or is corrupted. Retranslate the controller. If
error persists, contact the Honeywell Technical Assistance Center.
The file is not an application file or is corrupted. Retranslate the controller. If
error persists, contact the Honeywell Technical Assistance Center.
Error message associated with the Simulator master mode. Test mode error
only.
Controller files not found. Retranslate controller.
Attempt to load an obsolete saved simulation session.
Another application made an unrecognized DDE request. Report to Honeywell
Technical Assistance Center.
Another application made an unrecognized DDE request. Report to Honeywell
Technical Assistance Center.
Another application made an unrecognized DDE request. Report to Honeywell
Technical Assistance Center.
The controller application files are corrupted. Retranslate the controller.
55
74-3556-9 (US)
EN2B-0183 GE51 R0404 (Europe)
ERROR MESSAGES
DDE Server Error
Digital point state text copy failed.
DDE Server Error
Flex point copy failed.
DDE Server Error
Point request search failed.
DDE Server Error
Point request encountered an unknown type
of point.
DDE Server Error
Zregister search failed.
DDE Server Error
Parameter search failed.
DDE Server Error
Advise start point base search failed.
DDE Server Error
Advise start invalid parameter file number.
DDE Server Error
Advise start invalid parameter file index.
DDE Server Error
Advise start invalid item type.
DDE Server Error
Poke unknown item.
DDE Server Error
Write point search failed.
DDE Server Error
Poke point failed.
DDE Server Error
Poke parameter failed.
DDE Server Error
Poke ZRegister failed.
DDE Server Error
Advise start invalid ZRegister.
DDE Server Error
ZRegister search failed.
Error Reading Point Auto Value.
Error reading flex point class.
Error reading point engineering units.
Error reading point Hand Value.
File Error.
File is optional and will be ignored.
74-3556-9 (US)
EN2B-0183 GE51 R0404 (Europe)
LIVE CARE
The controller application files are corrupted. Retranslate the controller.
The controller application files are corrupted. Retranslate the controller.
A request was made for a non-existent user address. Retranslate the
controller.
A request was made for an unknown point type. Retranslate the controller.
A request was made for a non-existent z-register. Retranslate the controller.
The parameter does not exist. Retranslate the controller.
A point referenced in an advise start transaction does not exist. Retranslate
the controller. If error persists, contact the Honeywell Technical Assistance
Center.
A racl parameter referenced in an advise start transaction does not exist.
Retranslate the controller. If error persists, contact the Honeywell Technical
Assistance Center.
A racl parameter referenced in an advise start transaction does not exist.
Retranslate the controller. If error persists, contact the Honeywell Technical
Assistance Center.
An advise start transaction was received that was not recognized. Retranslate
the controller. If error persists, contact the Honeywell Technical Assistance
Center.
The item does not exist. Retranslate the controller. If error persists, contact the
Honeywell Technical Assistance Center.
The point does not exist. Retranslate the controller. If error persists, contact
the Honeywell Technical Assistance Center.
The point does not exist. Retranslate the controller. If error persists, contact
the Honeywell Technical Assistance Center.
The parameter does not exist. Retranslate the controller. If error persists,
contact the Honeywell Technical Assistance Center.
The Z register does not exist. Retranslate the controller. If error persists,
contact the Honeywell Technical Assistance Center.
The Z register does not exist. Retranslate the controller. If error persists,
contact the Honeywell Technical Assistance Center.
The Z register does not exist. Retranslate the controller. If error persists,
contact the Honeywell Technical Assistance Center.
The point does not exist. Retranslate the controller. If error persists, contact
the Honeywell Technical Assistance Center.
The point does not exist. Retranslate the controller. If error persists, contact
the Honeywell Technical Assistance Center.
The point does not exist. Retranslate the controller. If error persists, contact
the Honeywell Technical Assistance Center.
The point does not exist. Retranslate the controller. If error persists, contact
the Honeywell Technical Assistance Center.
The file could be missing, or in use by another application, or there could be a
hardware problem.
The following controller file is missing from the CARE directory. This file is not
required to operate the Simulator.
Time Schedules file *.ZPG
56
LIVE CARE
File is required for correct simulator
operation. Continue Loading?
Global Memory Allocation Failed!
Incompatible Simulation Save File!
Save file version: Simulator %1 Excel
Controller %2
Live CARE Simulation requires a system
icon size of 32x32 pixels - please use a
different video driver.
Live CARE still connected!
Please disconnect before exiting simulator.
Local Language Resource File not found Terminating Simulator
Memory Free Failed
Minimum compatible version: Simulator %1
Excel Controller %2
"No CARE path found - defaulting to
""C:\\CARE""."
No Program Loaded
No timer available
Not Implemented Yet
NULL Parameter passed in
RACL Application Not Running.
RACL Time Overflow
Severe Internal Error %d in Module %d.
Application will terminate now.
Severe Internal Error! Unused Function %s
called. Application will terminate now.
The selected file is neither a controller file
nor a simulation save file
"Unknown code tag %1 found by code
coverage tracer, Disable tracing?"
Unknown flex point class
ERROR MESSAGES
One of the following controller files is missing from the CARE directory. This
file is required to operate the Simulator.
RACL program file *.RAL
RACL parameter file *.RAP
RACL intermediate register file *.RAZ
RACL timer register file *.RAT
ASPECD program file *.ADL
Time Schedules file *.ZPG
Data Point Description file *.IPL
Point Descriptors file *.KLX
Alarm text file *.ALX
State text file *.ZSX
Engineering unit text file *.PHX
Characteristics data file *.KDX
Configuration data file *.KFX
Edit the controller in CARE to create the necessary file. Retranslate.
Design error. Report to Honeywell Technical Assistance Center.
Attempt to load an obsolete saved simulation session.
Attempt to run the simulator with EGA or other rare display adapters that use
other icon sizes.
Error message associated with the Simulator master mode. Test mode error
only.
The LCUSA.DLL file that comes with Live CARE software is missing.
Windows internal malfunction.
Attempt to load an obsolete saved simulation session.
Check Live CARE .INI file to correct CARE path.
An attempt was made to start the simulator before loading a controller
application. Test mode error only.
Other applications are using all the Windows timers.
User has accessed a future function not implemented in the current release of
the Simulator.
Design error. Report to Honeywell Technical Assistance Center.
Corruption of the racl program, illegal operations, etc., as detected by the
XL500 racl interpreter. Retranslate the controller. If error persists, contact the
Honeywell Technical Assistance Center.
Divide by zero overflow. Design error. Report to Honeywell Technical
Assistance Center.
Design error. Report to Honeywell Technical Assistance Center.
Design error. Report to Honeywell Technical Assistance Center.
Error message associated with the Simulator master mode. Test mode error
only.
Error message associated with the Simulator master mode. Test mode error
only.
The point class does not exist. Retranslate the controller. If error persists,
contact the Honeywell Technical Assistance Center.
57
74-3556-9 (US)
EN2B-0183 GE51 R0404 (Europe)
LIVE CARE
INDEX
modifying 42
monitoring 30
Freeze monitoring 27
A
Automatic mode 40
return points to 41
G
General error messages 55
General procedure 9
Getting started 4
B
B port 3
select as communication interface 10
H
C
Hardware points 13
monitoring 28
Hysteresis 24
Capacities
Live CARE 3
CARE.INI file
set entries 53
Change
input parameter 46
mapped XFM parameter 49
parameter 47
point mode 40
points to automatic mode 41
symbol information 45
XFM internal user address 49
Communication 3
Communication interface
select 10
Connect to controller 4
procedure 4
Control strategy
display 20
view 20
I
Initiate Live CARE 6
Input parameter
change 46
view 46
Intermediate values 26
L
Limit
checking
XFM parameter 49
Limit checking
XFM parameter 1
Literature 2
Live CARE
capacities 3
concepts 3
exit 8
general procedure 9
getting started 4
initiate 6
main window 7
menu bar 7
new features 1
overview 1
response time 3
scroll bar 13
simulate controller operation 13
simulation
diagram 5
status bar 13
title line 7
typical procedure 9
view area 13
Live CARE and CARE
operation diagram 5
LonWorks 10
D
DDC cycle time 16
Delays 24
Display
control strategy 20
switching logic 22
user addresses 19
Display latest values/statuses 27
Double monitoring 26
E
End current monitoring 20
Engineering unit 24
Error messages 41
general 55
simulation 56
Excel Building Supervisor (XBS) 3
EXECUTING_STOPPED 26
Exit Live CARE 8
F
FA 31
FD 31
Fix point 50
automatic mode 40
manual mode 40
Flag points
74-3556-9 (US)
EN2B-0183 GE51 R0404 (Europe)
M
Main window 7
menu bar 7
scroll bar 13
status bar 13
58
LIVE CARE
INDEX
select 10
Point monitoring limits 26
Points
from other controllers 26
in manual override mode 35
remain in manual mode 41
return to auto mode 41
Points in no response mode 35
Polling 26
Ports 3, 10
Positioning monitor dialog boxes 26
title line 7
Manual mode 40
points remain in 41
Manual override mode 35
Manual value 40
Mapped XFM parameter
change 49
displayed 48
Menu bar 7
Message traffic 26
Mode 24
Modify
flag points 42
XFM z-registers 51
z-registers 43
Monitor(s) dialog box 27
Monitoring
close command 27
double points 26
end 20
flag points 30
freeze command 27
general procedure 24
hardware points 28
intermediate values 26
limits 26
message traffic 26
monitor(s) dialog box 27
multiple poin 26
online 4
points
in no response mode 35
points from other controllers 26
points in manual override mode 35
polling 26
positioning monitor dialog boxes 26
refresh command 27
reporting by exception 26
restart command 27
software points 29
special points 26
start command 27
stop all point monitoring 27
XFM z-registers 38
z-registers 36
Multiple monitoring 26
R
RACL Editor
General 2
Overview 2
RAMP operation 47
Refresh monitoring 27
Reporting by exception 26
Response time for Live CARE 3
Restart monitoring 27
Return to auto mode 41
RS-232-C 3
S
Schematic window 12
Scroll bar 13
Search
flag via keyboard 34
pseudopoint via keyboard 34
Select
communication interface 10
plant 10
SEQ operation 47
Serial port 3
Set CARE.INI file entries 53
Setup simulation 16
SHUTDOWN 26
Simulate controller operation 13
Simulation 13
error messages 56
setup 16
step size 16
window 14
Simulation diagram 5
Software points 13
monitoring 29
Special points 26
Start monitoring 26, 27
STARTUP 26
Static simulator
select as communication interface 10
Status bar 13
Stop
all point monitoring 27
monitoring point 27
updating point values/statuses 27
Switch to another project 10
Switching logic
delays 24
display 22
engineering unit display 24
hysteresis 24
mode display 24
view 22
N
New features 1
No response mode 35
O
Onine help 8
Online monitoring 4
Open plant 10
Opto-isolator 4
P
Parameter
change 47
view 47
Plant
open 10
59
74-3556-9 (US)
EN2B-0183 GE51 R0404 (Europe)
INDEX
LIVE CARE
Symbol information
change 45
view 45
System performance 3
T
Title line 7
Typical procedures 9
U
Unfix point 41, 50
Update CARE database 48
User addresses
display 19
view 19
V
View
area 13
control strategy 20
input parameter 46
parameter 47
switching logic 22
symbol information 45
user addresses 19
X
XBS 3
XFM
change internal user address 49
change mapped parameter 49
modify z-register 51
parameter limit checking 1
XFM internal user address
change 49
XFM parameter limit checking 1, 49
XFM z-registers
modifying 51
monitoring 38
XFMs 13
XI584 and Live CARE 3
XI584 port 3
XW567 Connection cable 4
Z
Z-registers 13
modifying 43
monitoring 36
74-3556-9 (US)
EN2B-0183 GE51 R0404 (Europe)
60
61
74-3556-9 (US)
EN2B-0183 GE51 R0404 (Europe)
Automation and Control Solutions
Honeywell International Inc.
Honeywell Limited-Honeywell Limitee
1985 Douglas Drive North
35 Dynamic Drive
Golden Valley, MN 55422
Scarborough, Ontario M1V 4Z9
USA
Canada
http://www.honeywell.com
http://www.honeywell.ca
74-3556-9 (US)
EN2B-0183 GE51 R0404 (Europe)
Printed in Germany
Honeywell GmbH
Böblinger Straβe 17
D-71101 Schönaich
Germany
http://europe.hbc.honeywell.com
Subject to change without notice