1
STEPS User Manual
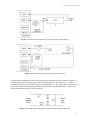
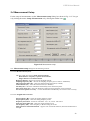
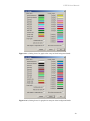
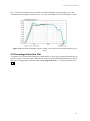
Figure 2.22 Standard Windows dialog box for choosing colors
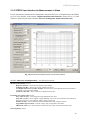
2.8.3 Editing Plotted Curve
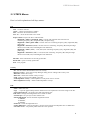
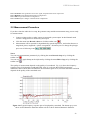
For editing plotted curve we use following commands:
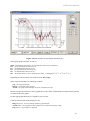
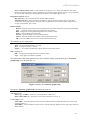
Smooth Magnitude - smoothes magnitude in octave bands:
1/1 octave,
1/2 octave,
1/3 octave.
Scale level - scales the magnitude level.
LF box diffraction - scales frequency response with transfer function of LF loudspeaker box diffraction.
Cut below cursor - cuts plotted curve below the cursor position.
Cut above cursor - cuts plotted curve above the cursor position.
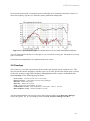
Menu commands 'Cut bellow cursor', 'Cut above cursor' and 'Scale level' are normally used to
“combine” two graphs; one for the high frequency and the other for the low frequency response.
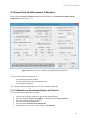
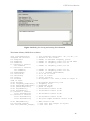
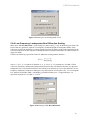
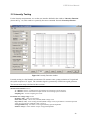
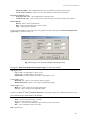
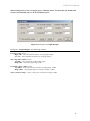
Menu command 'Scale level' - opens dialog box (shown in Fig. 2.23) in which user enters arbitrary
level (in dB) to scale the magnitude response.
31