1
STEPS User Manual
When testing tweeters use even larger power reduction factor. It is best that you assume that
tweeter can withstand only 1-2 W of continuous power.
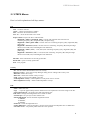
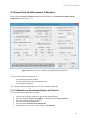
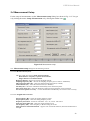
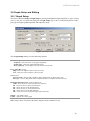
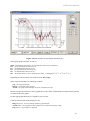
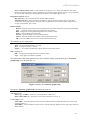
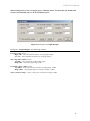
Figure 3.13 Dialog box Graph Margins
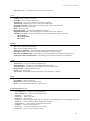
Dialog box ‘Graph Margins’ has following controls:
Frequency range section
High (Hz) - enters maximum frequency for right graph margin.
Low (Hz) - enters minimum frequency for left graph margin
SPL range (dB re 20uPa) section
Top (dB) – enters top margin in dB for SPL graph
Range (dB) – enters SPL graph range in dB
Excitation Voltage (dBV) section
Top (dBV) – enters top margin for excitation voltage graph, in dBV
Range (dBV) – enters graph range for excitation voltage, in dBV
Show excitation voltage - check to show plot of excitation voltage in dBV
51