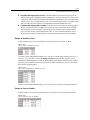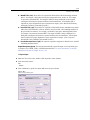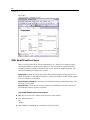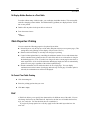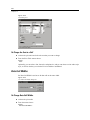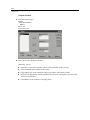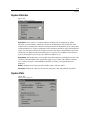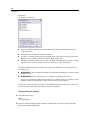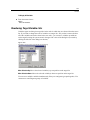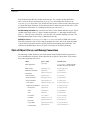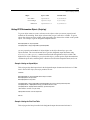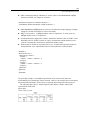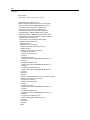
1
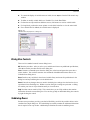
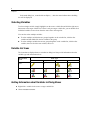
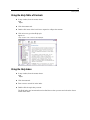
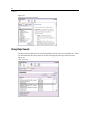
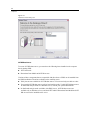
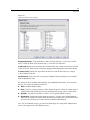
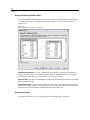
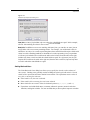
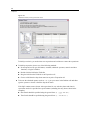
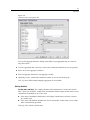
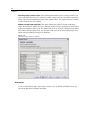
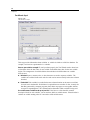
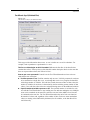
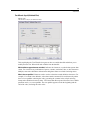
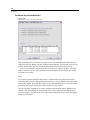
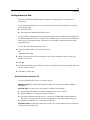
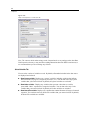
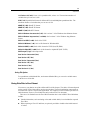
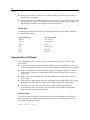
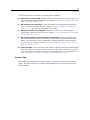
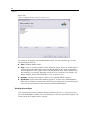
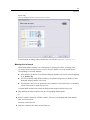
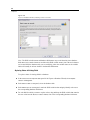
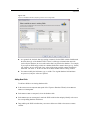
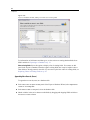
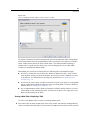
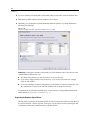
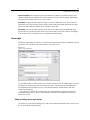
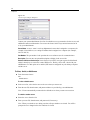
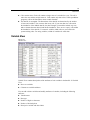
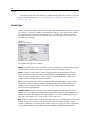
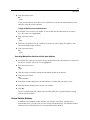
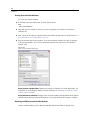
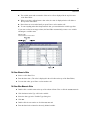
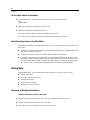
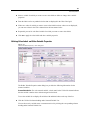
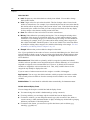
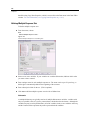
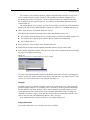
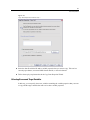
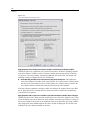
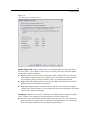
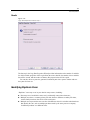
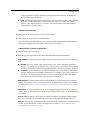
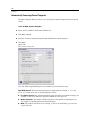
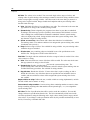
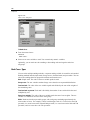
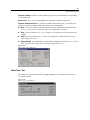
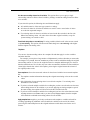
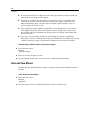
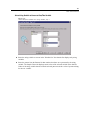
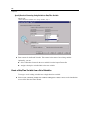
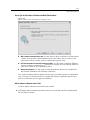
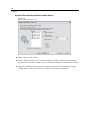
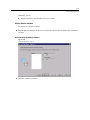
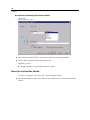
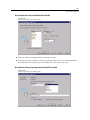
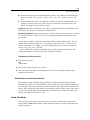
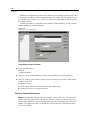
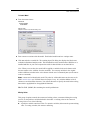
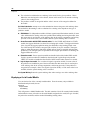
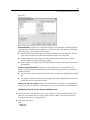
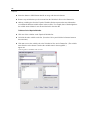
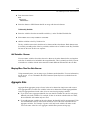
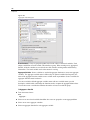
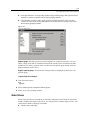
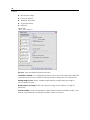
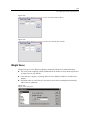
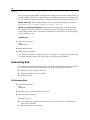
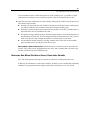
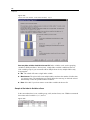
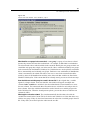
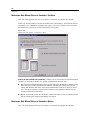
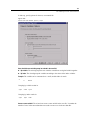
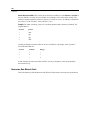
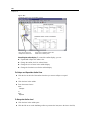
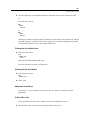
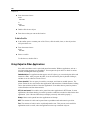
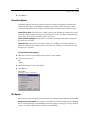
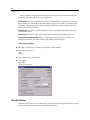
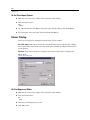
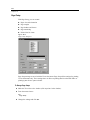
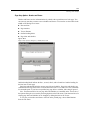
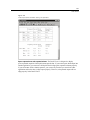
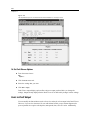
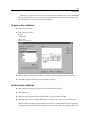
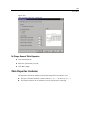
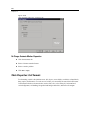
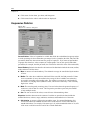
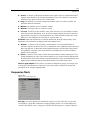
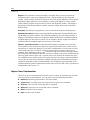
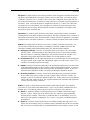
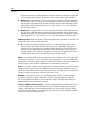
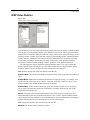
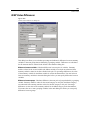
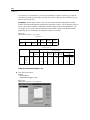
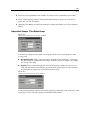
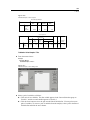
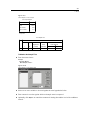
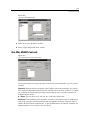
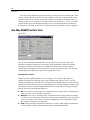
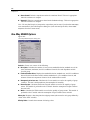
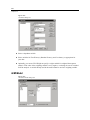
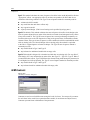
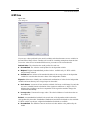
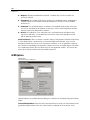
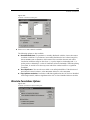
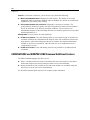
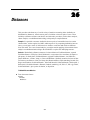
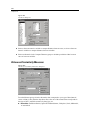
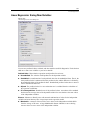
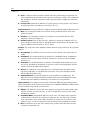
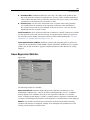
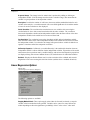
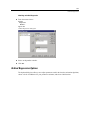
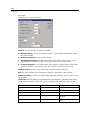
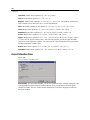
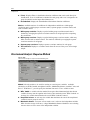
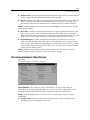
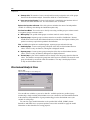
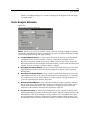
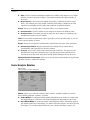
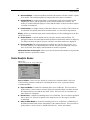
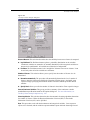
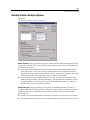
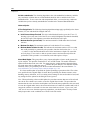
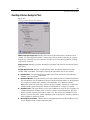
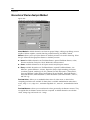
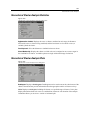
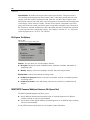
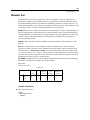
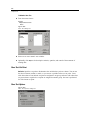
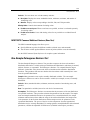
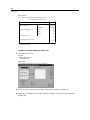
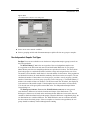
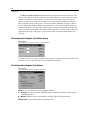
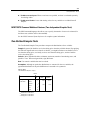
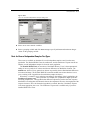
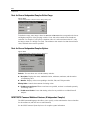
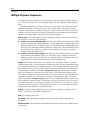
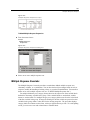
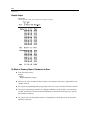
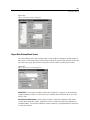
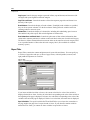
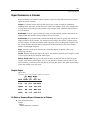
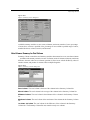
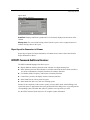
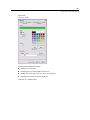
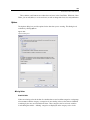
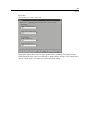
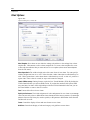
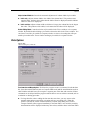
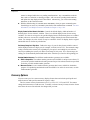
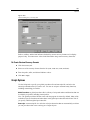
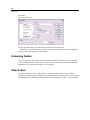
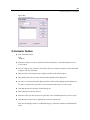
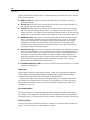
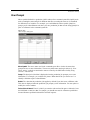
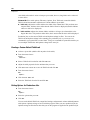
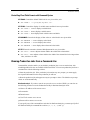
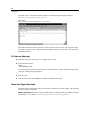
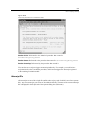
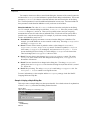
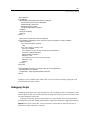
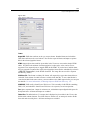
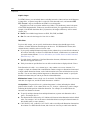
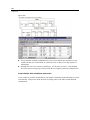
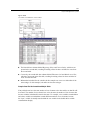
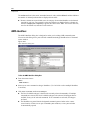
443
Reporting Results
Figure 38-11
Report Summary Lines dialog box
Available summary statistics are sum, mean, minimum, maximum, number of cases, percentage
of cases above or below a specified value, percentage of cases within a specified range of values,
standard deviation, variance, kurtosis, and skewness.
Data Columns Summary for Total Column
Summary Column controls the total summary statistics that summarize two or more data columns.
Available total summary statistics are sum of columns, mean of columns, minimum, maximum,
difference between values in two columns, quotient of values in one column divided by values in
another column, and product of columns values multiplied together.
Figure 38-12
Report Summary Column dialog box
Sum of columns. The total column is the sum of the columns in the Summary Column list.
Mean of columns. The total column is the average of the columns in the Summary Column list.
Minimum of columns. The total column is the minimum of the columns in the Summary Column
list.
Maximum of columns. The total column is the maximum of the columns in the Summary Column
list.
1st column – 2nd column. The total column is the difference of the columns in the Summary
Column list. The Summary Column list must contain exactly two columns.